Probability and Body Composition of Metabolic Syndrome in Young Adults: Use of the Bayes Theorem as Diagnostic Evidence of the Waist-to-Height Ratio

 ,
, 
Abstract
:1. Introduction
2. Methods
2.1. Study Design and Participants
2.2. Variables
2.2.1. Anthropometrical and Clinical Analysis
2.2.2. Biochemical Analysis
2.3. Metabolic Syndrome
2.4. Statistical Methods
3. Results
3.1. Participants
3.2. Body Composition Indexes and Metabolic Syndrome
3.3. Efficacy of WHtR in the Prediction of Metabolic Syndrome
4. Discussion
5. Conclusions
Author Contributions
Acknowledgments
Conflicts of Interest
References
- Falkner, B.; Cossrow, N. Prevalence of metabolic syndrome and obesity-associated hypertension in the racialethnic minorities of the United States. Curr. Hypertens. Rep. 2014, 16, 449. [Google Scholar] [CrossRef] [PubMed]
- Suyilaqimuge, S.U.X. Research progress of metabolic syndrome. China Mod. Med. 2016, 23, 13–16. [Google Scholar]
- Grundy, S.M.; Cleeman, J.I.; Daniels, S.R.; Donato, K.A.; Eckel, R.H.; Franklin, B.A.; Gordon, D.J.; Krauss, R.M.; Savage, P.J.; Smith, S.C., Jr.; et al. Diagnosis and management of the metabolic syndrome: An American Heart Association/National Heart, Lung, and Blood Institute Scientific Statement. Circulation 2005, 112, 2735–2752. [Google Scholar] [CrossRef] [PubMed]
- Després, J.P. Health consequences of visceral obesity. Ann. Med. 2001, 33, 534–541. [Google Scholar] [CrossRef] [PubMed]
- Instituto Nacional de Salud Pública. Encuesta Nacional de Salud y Nutrición. [Mexico’s National Health and Nutrition Survey; Instituto Nacional de Salud Pública: Cuernavaca, Mexico, 2012. [Google Scholar]
- Qiao, Q.; Nyamdorj, R. Is the association of type II diabetes with waist circumference or waist-to-hip ratio stronger than that with body mass index? Eur. J. Clin. Nutr. 2010, 64, 30–34. [Google Scholar] [CrossRef] [PubMed]
- Espinoza, M.; Ruiz, N.; Barrios, E.; Reigosa, A.; Leal, U.; Julio, H.; González, C. Perfil metabólico de riesgo cardiovascular y resistencia a la insulina según índice de masa corporal, circunferencia de cintura y cintura hipertrigliceridémica en pacientes adultos. Revista Médica de Chile 2009, 137, 1179–1186. [Google Scholar] [CrossRef]
- Deurenberg, P.; Weststrate, J.A.; Seidell, J.C. Body mass index as a measure of body fatness: Age- and sex-specific prediction formulas. Br. J. Nutr. 1991, 65, 105–114. [Google Scholar] [CrossRef] [PubMed]
- De Koning, L.; Merchant, A.T.; Pogue, J.; de Koning, L.; Merchant, A.T.; Pogue, J.; Anand, S.S. Waist circumference and waist-to-hip ratio as predictors of cardiovascular events: Meta-regression analysis of prospective studies. Eur. Heart J. 2007, 28, 850–856. [Google Scholar] [CrossRef] [PubMed]
- Cornier, M.A.; Despres, J.P.; Davis, N.; Grossniklaus, D.A.; Klein, S.; Lamarche, B.; Lopez-Jimenez, F.; Rao, G.; St-Onge, M.P.; Towfighi, A.; et al. Assessing adiposity: A scientific statement from the American Heart Association. Circulation 2011, 124, 1996–2019. [Google Scholar] [CrossRef] [PubMed]
- Alberti, K.G.; Eckel, R.H.; Grundy, S.M.; Zimmet, P.Z.; Cleeman, J.I.; Donato, K.A.; Fruchart, J.C.; James, W.P.; Loria, C.M.; Smith, S.C., Jr. Harmonizing the metabolic syndrome: A joint interim statement of the International Diabetes Federation Task Force on Epidemiology and Prevention; National Heart, Lung, and Blood Institute; American Heart Association; World Heart Federation; International Atherosclerosis Society; and International Association for the Study of Obesity. Circulation 2009, 120, 1640–1645. [Google Scholar] [PubMed]
- Misra, A.; Wasir, J.S.; Vikram, N.K. Waist circumference criteria for the diagnosis of abdominal obesity are not applicable uniformly to all populations and ethnic groups. Nutrition 2005, 21, 969–976. [Google Scholar] [CrossRef] [PubMed]
- Schneider, H.J.; Klotsche, J.; Silber, S.; Stalla, G.K.; Wittchen, H.U. Measuring abdominal obesity: Effects of height on distribution of cardiometabolic risk factors risk using waist circumference and waist-to-height ratio. Diabetes Care 2011, 34, e7. [Google Scholar] [CrossRef] [PubMed]
- Ramírez-Vélez, R.; Correa-Bautista, J.E.; Sanders-Tordecilla, A.; Ojeda-Pardo, M.L.; Cobo-Mejía, E.A.; Castellanos-Vega, R.D.P.; García-Hermoso, A.; González-Jiménez, E.; Schmidt-RioValle, J.; González-Ruíz, K.; et al. Percentage of Body Fat and Fat Mass Index as a Screening Tool for Metabolic Syndrome Prediction in Colombian University Students. Nutrients 2017, 9, 1009. [Google Scholar] [CrossRef] [PubMed]
- Ashwell, M.; Gunn, P.; Gibson, S. Waist-to-height ratio is a better screening tool than waist circumference and BMI for adult cardiometabolic risk factors: Systematic review and meta-analysis. Obes. Rev. 2012, 13, 275–286. [Google Scholar] [CrossRef] [PubMed]
- Li, W.C.; Chen, I.C.; Chang, Y.C.; Loke, S.S.; Wang, S.H.; Hsiao, K.Y. Waist-to-height ratio, waist circumference, and body mass index as indices of cardiometabolic risk among 36,642 Taiwanese adults. Eur. J. Nutr. 2013, 52, 57–65. [Google Scholar] [CrossRef] [PubMed]
- Peng, Y.; Li, W.; Wang, Y.; Bo, J.; Chen, H. The cut-off point and boundary values of waist-to-height ratio as an indicator for cardiovascular risk factors in Chinese Adults from the PURE study. PLoS ONE 2015, 10, e0144539. [Google Scholar] [CrossRef] [PubMed]
- Yang, H.; Xin, Z.; Feng, J.P.; Yang, J.K. Waist-to-height ratio is better than body mass index and waist circumference as a screening criterion for metabolic syndrome in Han Chinese adults. Medicine 2017, 96, 8192. [Google Scholar] [CrossRef] [PubMed]
- Zhou, D.; Yang, M.; Yuan, Z.P.; Zhang, D.D.; Liang, L.; Wang, C.L.; Zhang, S.; Zhu, H.H.; Lai, M.D.; Zhu, Y.M. Waist-to-Height Ratio: A simple, effective and practical screening tool for childhood obesity and metabolic syndrome. Prev. Med. 2014, 67, 35–40. [Google Scholar] [CrossRef] [PubMed]
- Norma Oficial Mexicana NOM-008-SSA3-2010. Para el Tratamiento Integral del Sobrepeso y la Obesidad; Norma Oficial Mexicana: Ciudad de México, México, 2010. [Google Scholar]
- Maffeis, C.; Banzato, C.; Talamini, G. Waist to Height ratio, a useful index to identify high risk in overweight children. J. Pediatr. 2008, 152, 207–213. [Google Scholar] [CrossRef] [PubMed]
- Shott, S. Statistics for Health Professionals; Saunders: Philadelphia, PA, USA, 1990; pp. 23–41. [Google Scholar]
- Gnatiuc, L.; Alegre-Díaz, J.; Halsey, J.; Herrington, W.G.; López-Cervantes, M.; Lewington, S.; Collins, R.; Tapia-Conyer, R.; Peto, R.; Emberson, J.R. Adiposity and Blood Pressure in 110,000 Mexican Adults. Hypertension 2017, 69, 608–614. [Google Scholar] [CrossRef] [PubMed]
- López-González, D.; Miranda-Lora, A.; Klünder-Klünder, M.; Queipo-García, G.; Bustos-Esquivel, M.; Paez-Villa, M.; Villanueva-Ortega, E.; Chávez-Requena, I.; Laresgoiti-Servitje, E.; Garibay-Nieto, N. Diagnostic performance of waist circumference measurements for predicting cardiometabolic risk in Mexican children. Hypertension 2017, 69, 608–614. [Google Scholar] [CrossRef] [PubMed]
- Jayawardana, R.; Ranasinghe, P.; Sheriff, M.H.; Matthews, D.R.; Katulanda, P. Waist to height ratio: A better anthropometric marker of diabetes and cardio-metabolic risks in South Asian adults. Diabetes Res. Clin. Pract. 2013, 99, 292–299. [Google Scholar] [CrossRef] [PubMed]
- Valle-Leal, J.; Abundis-Castro, L.; Hernández-Escareño, J.; Flores-Rubio, S. Waist-to-height ratio is an indicator of metabolic risk in children. Rev. Chil. Pediatr. 2016, 87, 180–185. [Google Scholar] [CrossRef] [PubMed]
- Mokha, J.S.; Srinivasan, S.R.; DasMahapatra, P.; Fernandez, C.; Chen, W.; Xu, J.; Berenson, G.S. Utility of waist-to-height ratio in assessing the status of central obesity and related cardiometabolic risk profile among normal weight and overweight/obese children: The Bogalusa Heart Study. BMC Pediatr. 2010, 10. [Google Scholar] [CrossRef] [PubMed]
- Lo, K.; Wong, M.; Khalechelvam, P.; Tam, W. Waist-to-height ratio, body mass index and waist circumference for screening pediatric cardio-metabolic risk factors: A meta-analysis. Obes. Rev. 2016, 17, 1258–1275. [Google Scholar] [CrossRef] [PubMed]
- Khoury, M.; Manlhiot, C.; Dobbin, S.; Gibson, D.; Chahal, N.; Wong, H.; Davies, J.; Stearne, K.; Fisher, A.; McCrindle, B.W. Role of waist measures in characterizing the lipid and blood pressure assessment of adolescents classified by body mass index. Arch. Pediatr. Adolesc. Med. 2012, 166, 719–724. [Google Scholar] [CrossRef] [PubMed]
- Martínez-Montaño, M.L.; Blázquez-Gutiérrez, M.E.; Hernández-Hernández, M.E.; López-Moreno, P.; Ortiz-Bueno, A.; Kammar-García, A.; Calderón-Ibarra, E.; Delgado-Romero, J.; García-Cruz, S.P. Waist-Length Index: Test for cardiovascular risk assessment and diagnosis of metabolic syndrome. Revista Cubana de Medicina 2017, 56, 109–118. [Google Scholar]
- Rodea-Montero, E.R.; Evia-Viscarra, M.L.; Apolinar-Jiménez, E. Waist-to-Height Ratio Is a Better Anthropometric Index than Waist Circumference and BMI in Predicting Metabolic Syndrome among Obese Mexican Adolescents. Int. J. Endocrinol. 2014, 2014, 195407. [Google Scholar] [CrossRef] [PubMed]
- Ramos-Jiménez, A.; Hernández-Torres, R.P.; Wall-Medrano, A.; Villalobos-Molina, R. Metabolomic (anthropometric and biochemical) indexes and metabolic syndrome in adolescents and young adults with intellectual disabilities. Res. Dev. Disabil. 2014, 35, 2987–2992. [Google Scholar] [CrossRef] [PubMed]
- Ferreira-Hermosillo, A.; Ramírez-Rentería, C.; Mendoza-Zubieta, V.; Molina-Ayala, M.A. Utility of the waist-to-height ratio, waist circumference and body mass index in the screening of metabolic syndrome in adult patients with type 1 diabetes mellitus. Diabetol. Metab. Syndr. 2014, 6, 32. [Google Scholar] [CrossRef] [PubMed]
- Han, T.S.; Williams, K.; Sattar, N.; Hunt, K.J.; Lean, M.E.; Haffner, S.M. Analysis of obesity and hyperinsulinemia in the development of metabolic syndrome: San Antonio Heart Study. Obes. Res. 2002, 10, 923–931. [Google Scholar] [CrossRef] [PubMed]
- Schneider, H.J.; Klotsche, J.; Stalla, G.K.; Wittchen, H.U. Obesity and risk of myocardial infarction: The INTERHEART study. Lancet 2006, 367, 1052–1054. [Google Scholar] [CrossRef]
- Bener, A.; Yousafzai, M.T.; Darwish, S.; Al-Hamaq, A.O.; Nasralla, E.A.; Abdul-Ghani, M. Obesity index that better predict metabolic syndrome: Body mass index, waist circumference, waist hip ratio, or waist height ratio. J. Obes. 2013, 2013, 269038. [Google Scholar] [CrossRef] [PubMed]
- Ashwell, M.; Gibson, S. Waist-to-height ratio as an indicator of ‘early health risk’: Simpler and more predictive than using a ‘matrix’ based on BMI and waist circumference. BMJ Open 2016, 6, e010159. [Google Scholar] [CrossRef] [PubMed]
- Elizondo-Montemayor, L.; Serrano-González, M.; Ugalde-Casas, P.A.; Bustamante-Careaga, H.; Cuello-García, C. Waist-to-height: Cutoff matters in predicting metabolic syndrome in Mexican children. Metab. Syndr. Relat. Disord. 2011, 9, 183–190. [Google Scholar] [CrossRef] [PubMed]


| Women | Men | p | |
|---|---|---|---|
| N | 824 | 527 | |
| Age, years | 18.87 ± 2.33 | 19.6 ± 1.7 | 0.26 |
| Weight, kg | 59.8 ± 11.53 | 71.25 ± 13.7 | <0.0001 |
| Height, cm | 160 ± 0.05 | 172.05 ± 0.06 | <0.0001 |
| WC, cm | 78.1 ± 10.02 | 84.8 ± 11.4 | <0.0001 |
| HC, cm | 95.59 ± 9.18 | 97.15 ± 9.6 | 0.43 |
| BMI, kg/m2 | 23.32 ± 4.08 | 24.04 ± 4.06 | 0.002 |
| BF% | 26.94 ± 5.55 | 17.03 ± 4.96 | <0.0001 |
| WHtR | 0.49 ± 0.06 | 0.49 ± 0.07 | 0.79 |
| Waist-Hip R | 0.81 ± 0.06 | 0.87 ± 0.06 | <0.0001 |
| MS, n (%) | 34 (4.1) | 16 (3) | 0.37 |
| Without MS | MS | p | |
|---|---|---|---|
| N | 1301 | 50 | |
| Age, years | 18.95 ± 2.55 | 18.84 ± 1.20 | 0.71 |
| Weight, kg | 63.83 ± 13.24 | 77.28 ± 16.49 | <0.0001 |
| Height, cm | 165 ± 0.43 | 164.3 ± 0.09 | 0.79 |
| High WC | |||
| Number of patients | 169 (13%) | 33 (66%) | <0.0001 |
| Mean of WC | 79.95 ± 10.79 | 92.71 ± 11.29 | <0.0001 |
| BMI | |||
| Number of patients | 376 (28.9%) | 37 (74%) | <0.0001 |
| Mean of BMI | 23.42 ± 3.94 | 28.45 ± 4.75 | <0.0001 |
| Hight BF% | |||
| Number of patients | 115 (8.8%) | 23 (46%) | <0.0001 |
| Mean of BF% | 22.82 ± 7.11 | 29.62 ± 6.08 | <0.0001 |
| High WHtR | |||
| Number of patients | 206 (15.8%) | 39 (78%) | <0.0001 |
| Mean of WHtR | 0.48 ± 0.06 | 0.57 ± 0.06 | <0.0001 |
| High Waist-Hip R | |||
| Number of patients | 97 (7.5%) | 17 (34%) | <0.0001 |
| Mean of Waist-hip Ratio | 0.83 ± 0.06 | 0.87 ± 0.05 | <0.0001 |
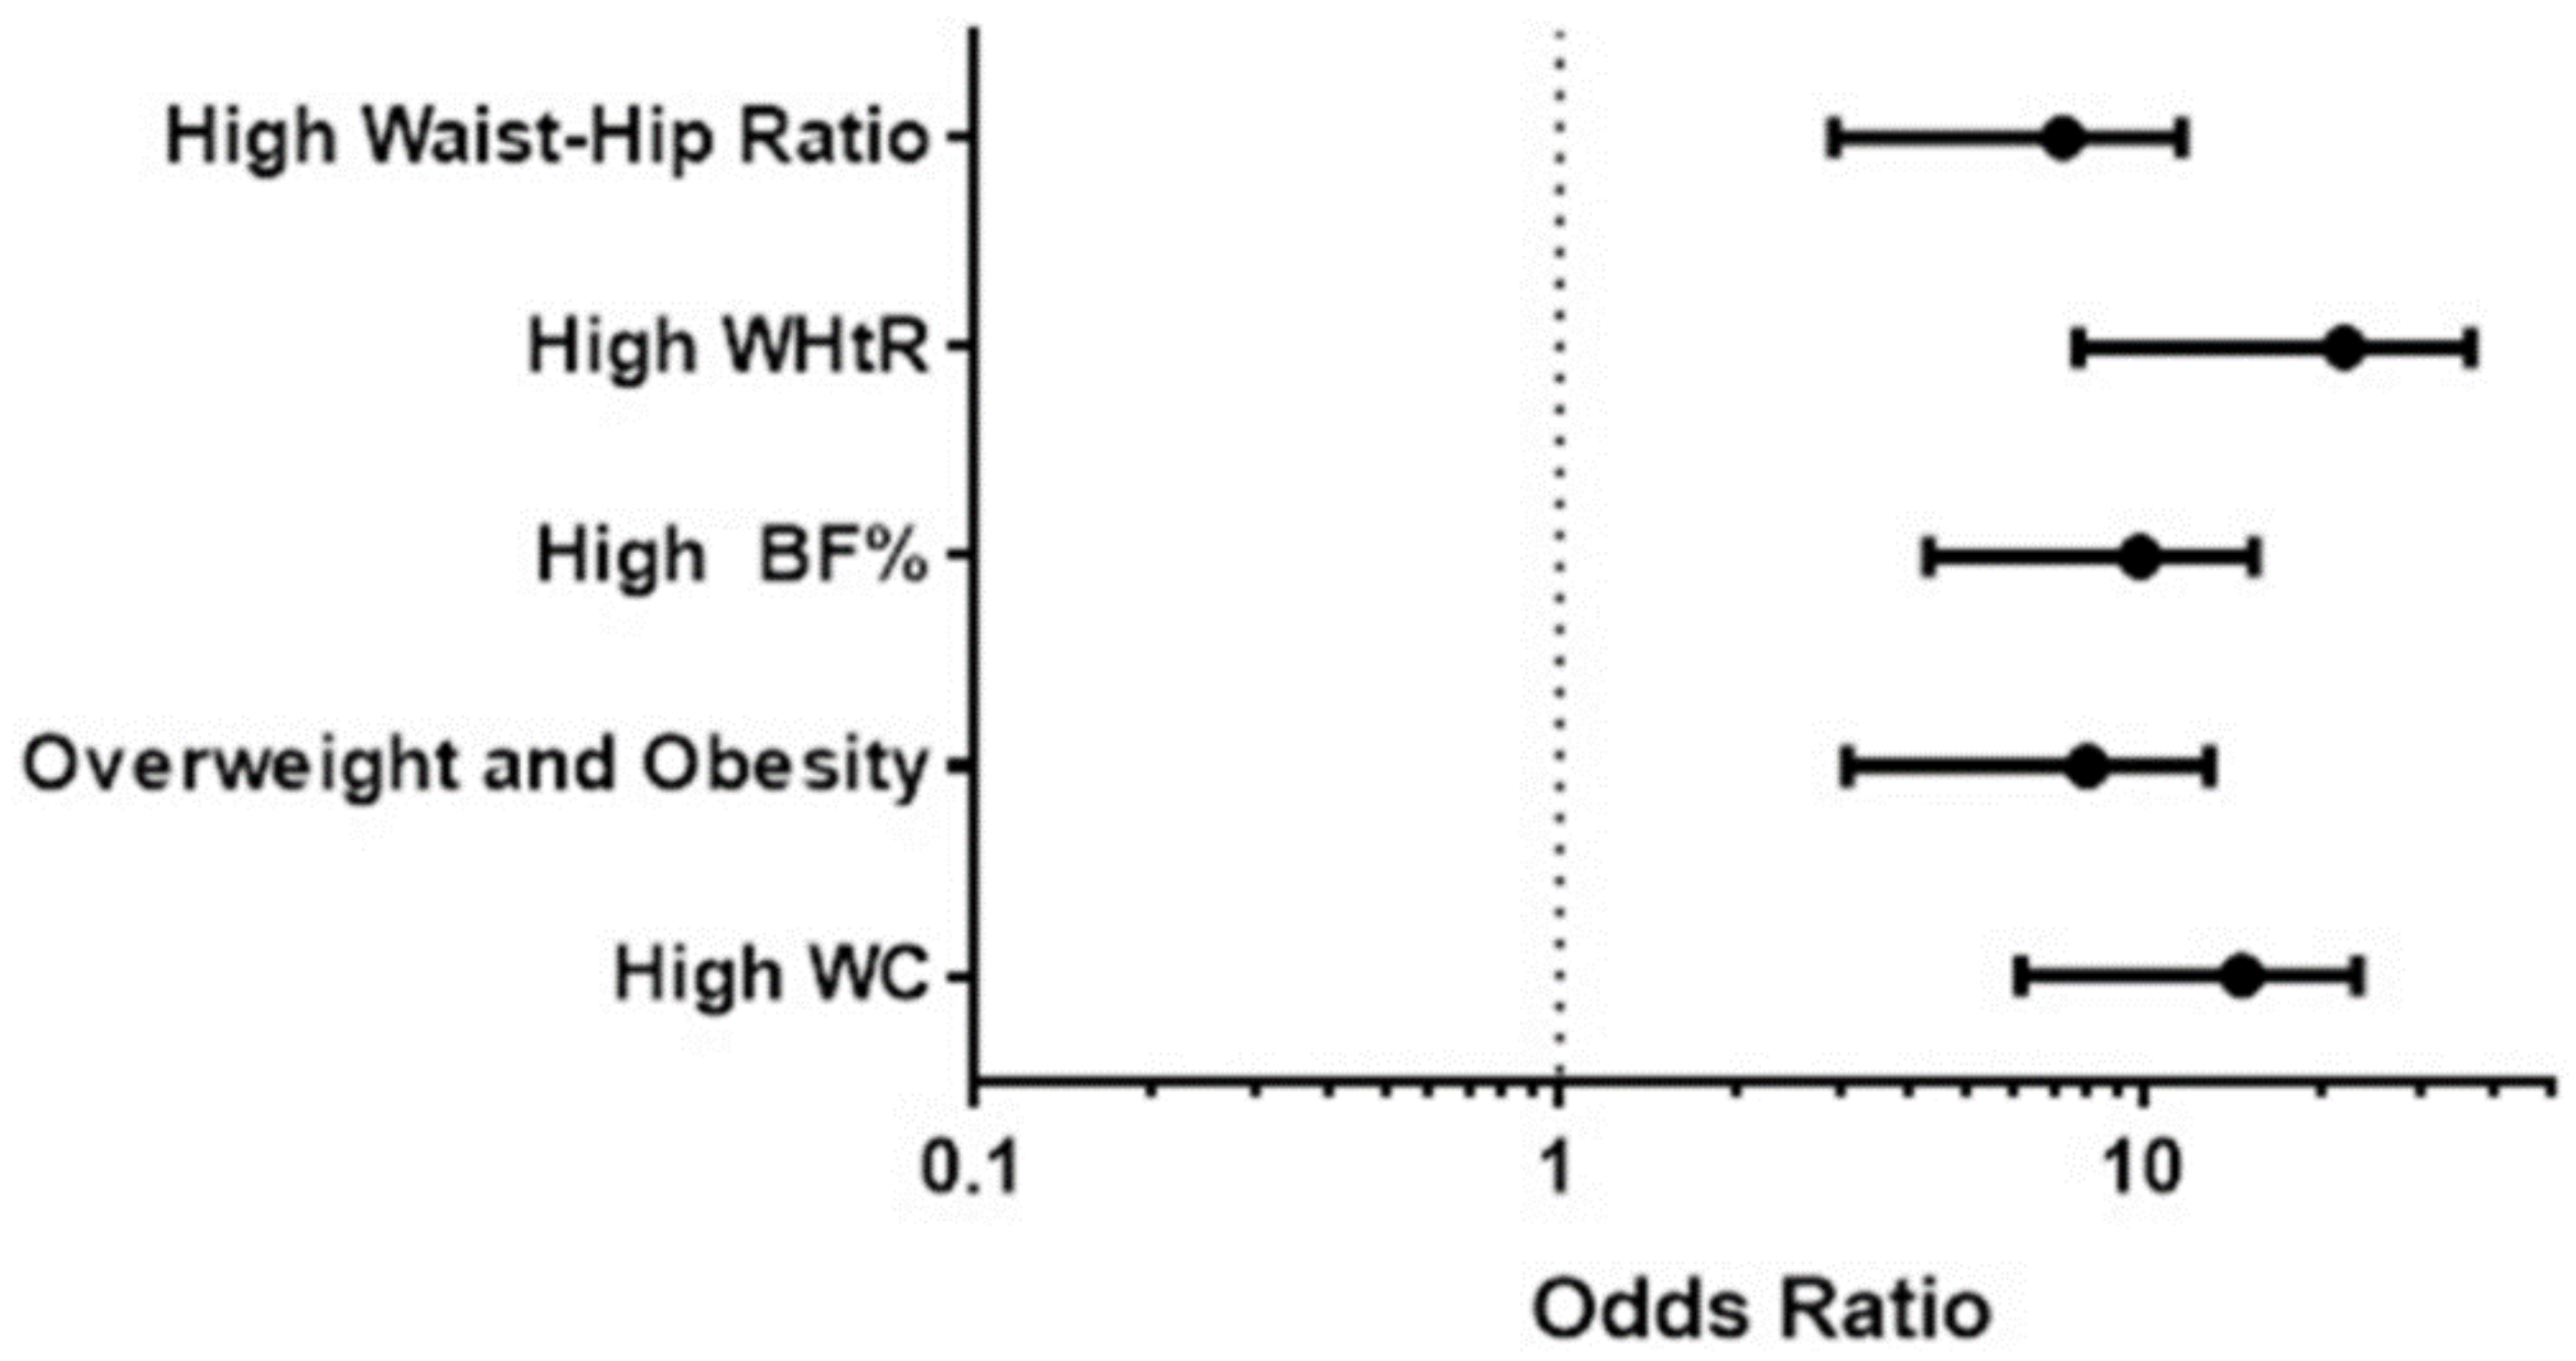
| b Coefficient | Standard Error | OR (95% CI) | p | |
|---|---|---|---|---|
| WC, cm | 0.095 | 0.51 | 1.09 (0.4–2.98) | 0.85 |
| BMI, kg/m2 | 0.76 | 0.43 | 2.15 (0.92–5.06) | 0.07 |
| BF% | 1.15 | 0.41 | 3.18 (1.42–7.13) | 0.005 |
| WHtR | 2.24 | 0.52 | 9.43 (3.4–26.13) | <0.000 |
| Waist-Hip R | 0.482 | 0.42 | 1.61 (0.7–3.71) | 0.25 |
| AUC | SE | p | Confidence Interval at 95% | ||
|---|---|---|---|---|---|
| Lower Limit | Upper Limit | ||||
| WC | 0.810 | 0.030 | <0.000 | 0.751 | 0.868 |
| BMI | 0.813 | 0.034 | <0.000 | 0.748 | 0.879 |
| %BF | 0.811 | 0.034 | <0.000 | 0.744 | 0.878 |
| WHtR | 0.855 | 0.026 | <0.000 | 0.804 | 0.905 |
| Waist-Hip R | 0.695 | 0.045 | <0.000 | 0.608 | 0.782 |
| Sensitivity | Specificity | PPV | NPV | LR+ | LR− | |
|---|---|---|---|---|---|---|
| WC | 66 | 87 | 16.3 | 98.5 | 5 | 0.39 |
| BMI | 74 | 71.1 | 9 | 98.6 | 2.5 | 0.36 |
| %BF | 46 | 91 | 16.7 | 97.8 | 5.1 | 0.59 |
| WHtR | 78 | 84 | 15.9 | 99 | 4.8 | 0.26 |
| Waist-Hip R | 34 | 92.5 | 14.9 | 97.3 | 4.5 | 0.7 |
© 2018 by the authors. Licensee MDPI, Basel, Switzerland. This article is an open access article distributed under the terms and conditions of the Creative Commons Attribution (CC BY) license (http://creativecommons.org/licenses/by/4.0/).
Share and Cite
Kammar, A.; Hernández-Hernández, M.E.; López-Moreno, P.; Ortíz-Bueno, A.M.; Martínez-Montaño, M.D.L.C. Probability and Body Composition of Metabolic Syndrome in Young Adults: Use of the Bayes Theorem as Diagnostic Evidence of the Waist-to-Height Ratio. Stats 2018, 1, 21-31. https://doi.org/10.3390/stats1010003
Kammar A, Hernández-Hernández ME, López-Moreno P, Ortíz-Bueno AM, Martínez-Montaño MDLC. Probability and Body Composition of Metabolic Syndrome in Young Adults: Use of the Bayes Theorem as Diagnostic Evidence of the Waist-to-Height Ratio. Stats. 2018; 1(1):21-31. https://doi.org/10.3390/stats1010003
Chicago/Turabian StyleKammar, Ashuin, María Elena Hernández-Hernández, Patricia López-Moreno, Angélica María Ortíz-Bueno, and María De Lurdez Consuelo Martínez-Montaño. 2018. "Probability and Body Composition of Metabolic Syndrome in Young Adults: Use of the Bayes Theorem as Diagnostic Evidence of the Waist-to-Height Ratio" Stats 1, no. 1: 21-31. https://doi.org/10.3390/stats1010003
APA StyleKammar, A., Hernández-Hernández, M. E., López-Moreno, P., Ortíz-Bueno, A. M., & Martínez-Montaño, M. D. L. C. (2018). Probability and Body Composition of Metabolic Syndrome in Young Adults: Use of the Bayes Theorem as Diagnostic Evidence of the Waist-to-Height Ratio. Stats, 1(1), 21-31. https://doi.org/10.3390/stats1010003