6.1. Preliminary calibrations and validation
As an example of the above protocol, a case study was performed for the monitoring of glucose levels in type 2 diabetic urine samples, together with additional metabolites which parallel such a marked upregulation in patients with this condition. Samples were collected and acquired using the above protocols and parameters. The type 2 diabetic (n = 10) and healthy control (n = 14) participants had mean ± SEM ages of 45 ± 3.9 (range 37–76; seven female/one male) and 27 ± 2.7 (range 21–56; nine female/five male) years respectively (a single heathy control sample was excluded in view of the 1H NMR detection of ethanol in one of the original 15 samples collected for this classification). All diabetic participants were teetotal and non-smokers, and had a mean ± SEM type 2 diabetes duration of 4.86 ± 2.09 years at the time of sample collection.
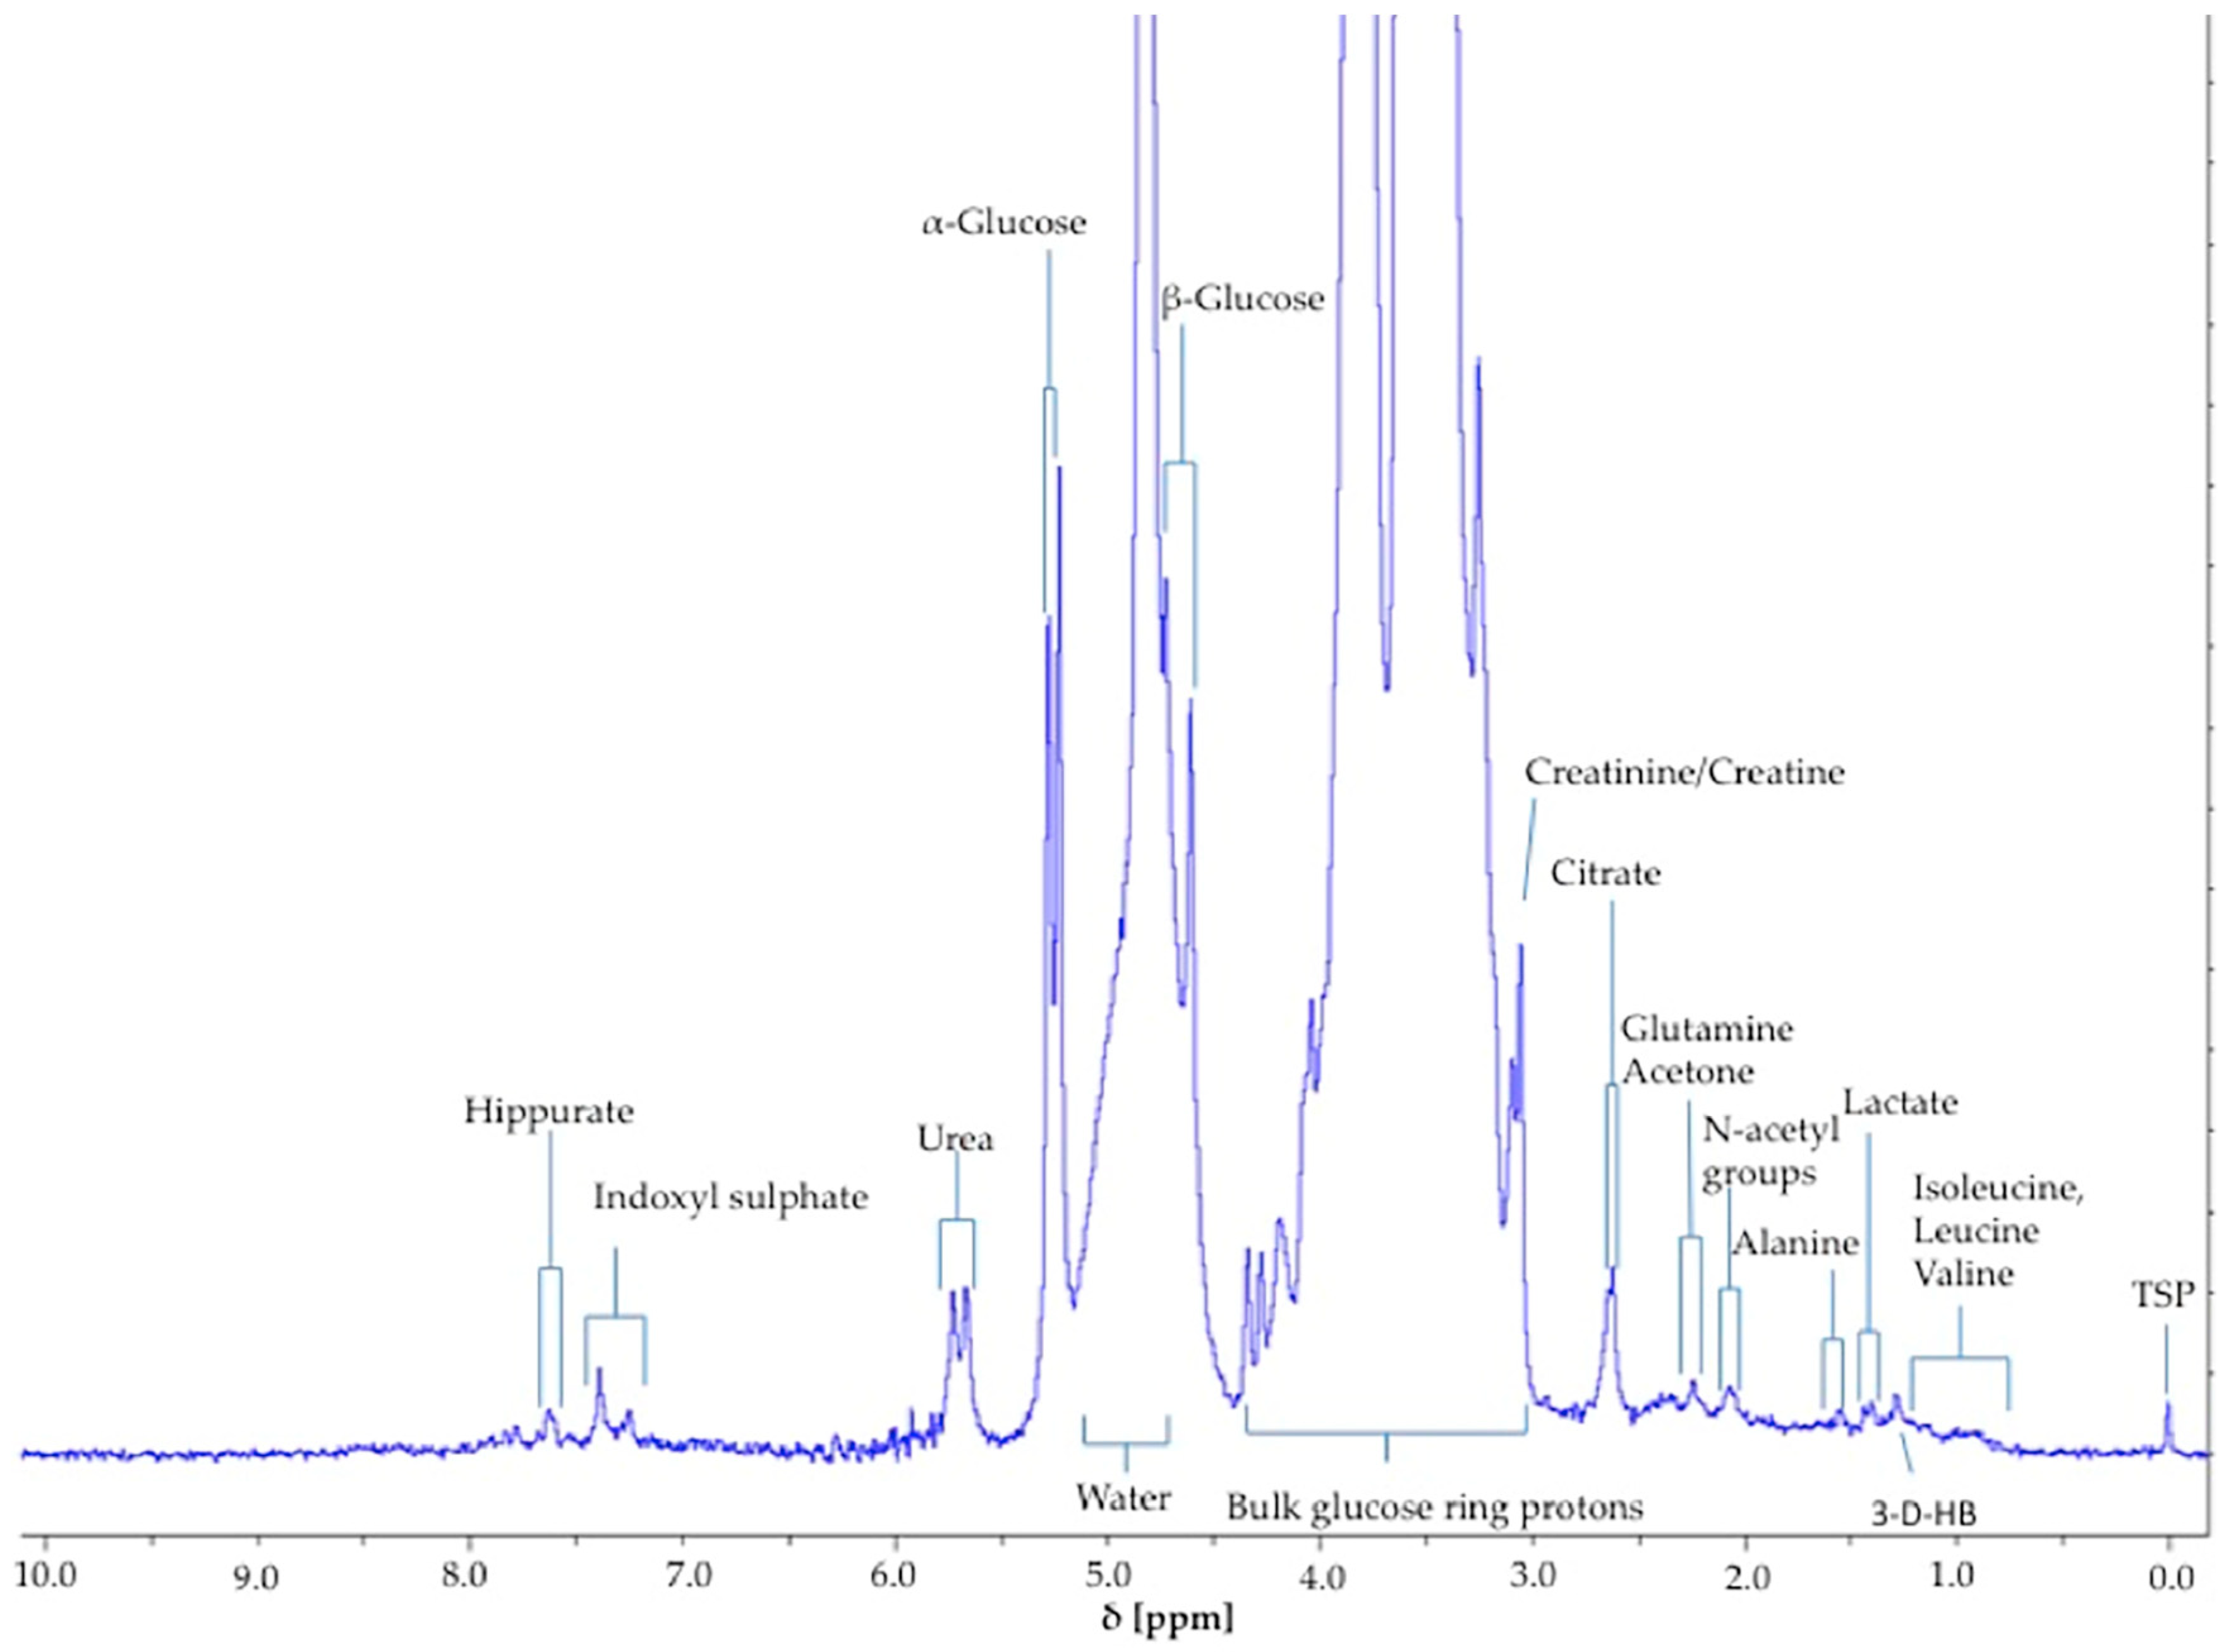
The α-glucose anomer C1-
H signal located at ∂ = 5.25 ppm (
d) (
Figure 1) was detected and integrated, and its intensity expressed relative to that of TSP (
s, δ = 0.00 ppm). This particular resonance was employed for quantification purposes since urinary
1H NMR profiles contain many overlapping signals within the crowded 3.00–4.00 ppm range in which glucose’s C2-
H to C6-
H proton resonances are located, and in view of the poor resolution of these at 60 MHz, this was selected as the optimal resonance to monitor in diabetic and prospectively diabetic patients. Moreover, although distinguishable, the C1-
H doublet resonance for β-glucose (δ = 4.65 ppm) was too closely overlapped with the residual water signal for quantification purposes (
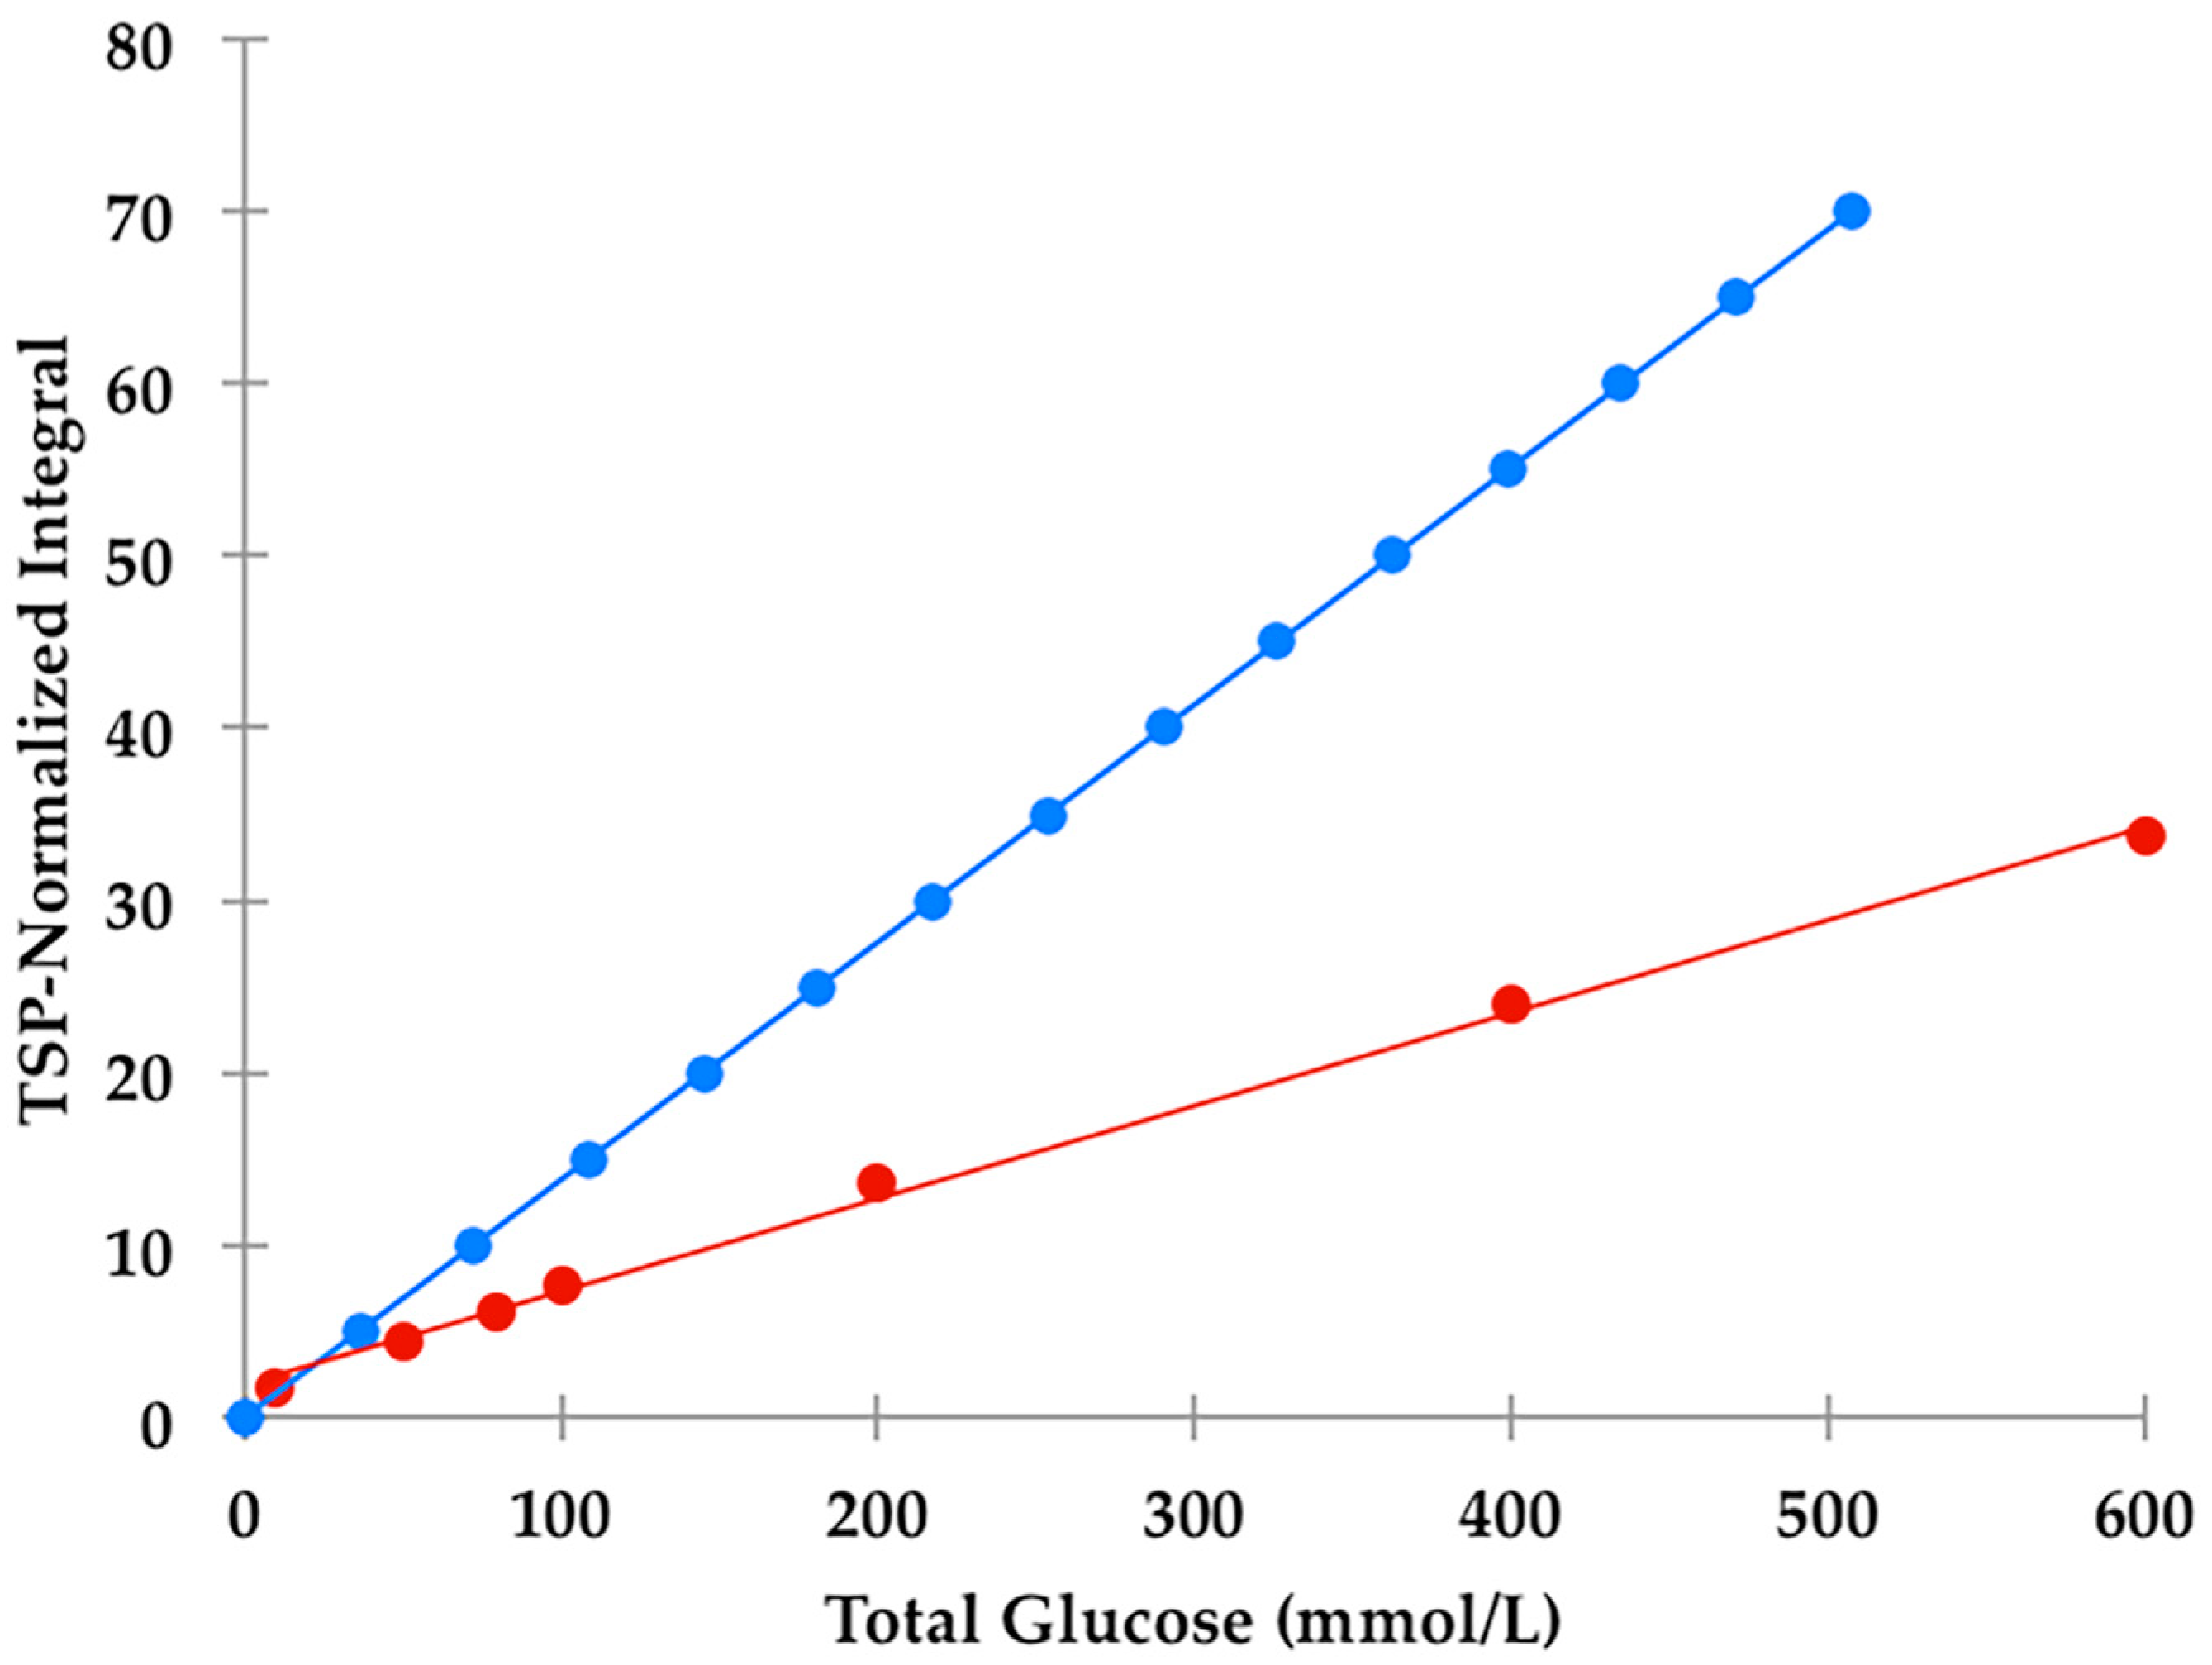
Figure 1). However, it should be noted that glucose’s α-anomer only represents 36% of the total glucose concentration present (the remaining 64% being the β-anomer), and therefore the factor 100/36% (=2.78) should be employed for converting α-anomer concentrations to total glucose ones. The limit of quantification for total (α-plus β-anomer) glucose was 8.0 mmol/L (
section S1, Supplementary Materials section), a value corresponding to 2.88 mmol/L for α-glucose. The calibration curve exhibited a clear linear relationship (r = 0.9973:
Figure 2). The limitations of monitoring this α-glucose resonance using LF benchtop NMR analysis is ascribable to potential interference of the closely located residual water signal, together with influence of the continuous water presaturation process on this closely located and spectrally intense resonance centred at δ = 4.95 ppm; this interference is further investigated and reviewed below. Indeed, total concentrations of this key biomarker below 8.0 mmol/L were found to be unquantifiable in view of a significant degree of overlap of the residual presaturated water signal of ≥10% integration intensity contributory interference (observed at added levels of <8.00 mmol/L). Typical spectra acquired on 5.00, 8.00 and 10.00 mmol/L total glucose calibration standards are shown in
section S1 of the Supplementary Materials file. The calculated SNR values for the 8.00 mmol/L total glucose standard was 21, and 11 for each method employed in order to estimate this quantity; when the mean of the 10 data points located both sides of the α-glucose-C1-
H resonance, and only the 10 largest noise data-points, respectively, were considered. Consideration of lower total glucose concentrations (6.00–7.50 mmol/L) gave rise to a water disturbance (contribution) to the α-glucose-C1-H signal of ≥10%, and therefore 8.00 mmol/L was considered to represent the LOQ value for these LF
1H NMR analyses.
From
Figure S1b, the α-glucose-C1-
H resonance for glucose present at a total level of 5.00 mmol/L was unobservable at 60 MHz operating frequency, although those of the bulk carbohydrate ring protons (C2-
H to C6-
H2) were.
Of particular bioanalytical and
1H NMR-linked metabolomics interest, we noted that there was a major difference between the observed TSP-normalised α-glucose C1-
H NMR resonance intensities and those calculated from the known total glucose and added TSP concentrations, the relative numbers of
1H nuclei contributing towards their
1H NMR resonances employed for analytical purposes (1 and 9 respectively), and the 36% abundance of the α-glucose anomer. Indeed, these ratios were reproducibly only 42% of those predicted from their known total glucose standard concentrations (
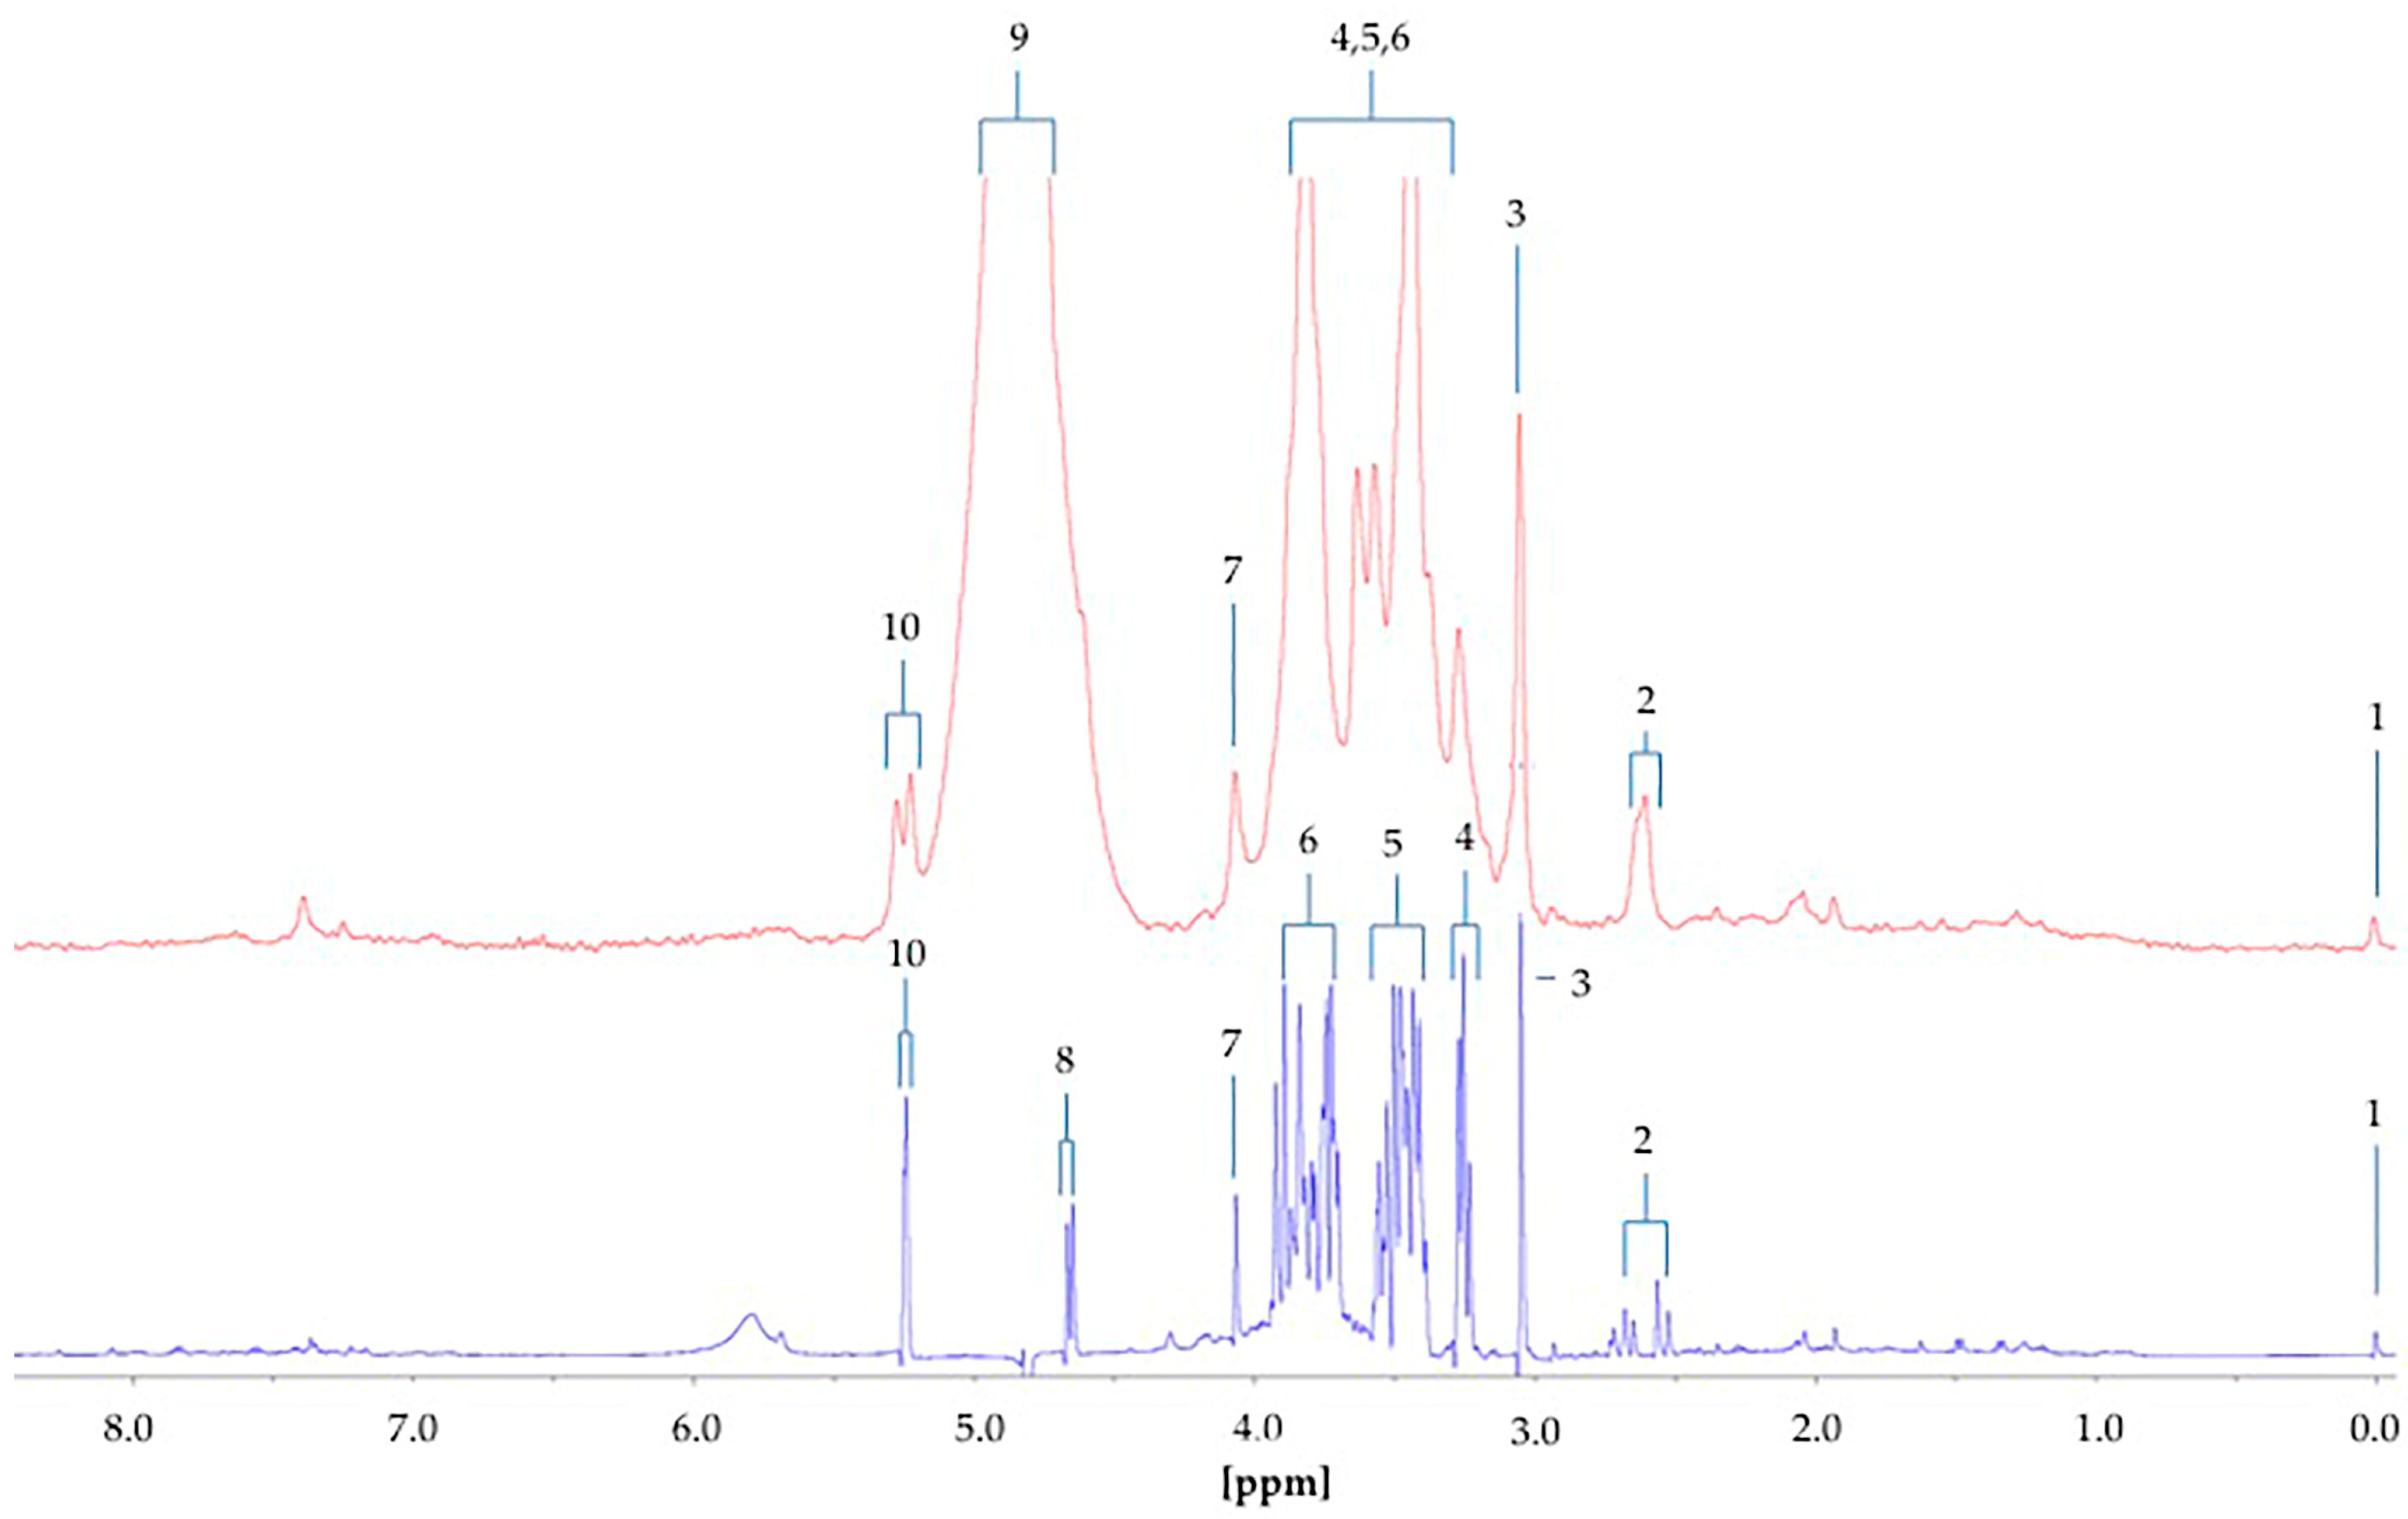
Figure 2); this effect is clearly visually apparent in the comparative 60 versus 400 MHz spectra shown in Figure 8. This observation provides powerful evidence that the H
2O/HOD presaturation sequence applied at a power setting of 58 dB (selected from pilot optimisation experiments) substantially diminishes the intensity of this anomeric proton resonance located at δ = 5.25 ppm, and which is only ca. 18 Hz away from the water frequency at an operating frequency of 60 MHz (δ = 4.95 ppm). This frequency difference is much greater at an operating frequency of 400 MHz (ca. 180 Hz), and therefore this presaturation process presumably exerts a much lesser effect on the intensity of this α-anomeric C1-H resonance (although it indeed does so on glucose’s corresponding β-anomeric C1-
H signal centred at δ = 4.65 ppm, as outlined in detail below).
Despite this, provided that all NMR facilities employed for urinary glucose concentrations are carefully calibrated with a set of freshly prepared glucose calibration standard solutions, particularly those analysed at only 60 MHz operating frequency, then such presaturation effects are circumventable.
However, we successfully detected and created calibrations for other biomolecules at significantly lower concentrations through optimised experiments, such as acetone, which we found had a LOQ value of ca. only 25 µmol/L using a 60 MHz benchtop facility (
Figure S2,
section S2 of the Supplementary Materials section). Typical linear calibration plots of TSP-normalised resonance intensities versus added biomolecule concentrations for acetone (‘spiked’ into heathy control urine samples), betaine and phenylalanine (both in aqueous solution containing ca. 10.0% (
v/
v)
2H
2O), are shown in
section S3 of the Supplementary Materials document. Moreover, for citrate calibration standards (0–20.0 mmol/L, spectra acquired with both 16 and 64 scans), there was an excellent agreement between the concentration estimated from its TSP-normalised resonance intensity (AB coupling pattern, δ = 2.65 ppm) and its known standard calibration value (r = 0.9914). Moreover, we found that the reproducibility of these measurements made on the 20.0 mmol/L standard was ±0.10 mmol/L).
The α-glucose signal is easily identified in the 1H NMR spectral profiles of urine samples collected from non-rigorously controlled type 2 diabetic patients. However, there is a small level of overlap between the water signal and the α-glucose signal, a phenomenon complicating integration and hence quantification of this key biomarker at total concentrations <8.00 mmol/L. Optimisation was attempted by moving the H2O/HOD driver signal to ∂ = 4.80 ppm to ensure the best clarity between these two signals; however, there was still a residual level of overlap. Despite these problems, we found that integration of glucose’s α-anomeric proton resonance (δ = 5.25 ppm) was affected negligibly if the urinary concentration of this anomer was ≥2.8 mmol/L (corresponding to a total glucose level of ≥ca. 8 mmol/L). To date, urinary profiles have not been acquired on LF, benchtop NMR systems for metabolomics analysis such as that used in this example. Indeed, additional 1H NMR signals in addition to those of glucose and assignable in LF 60 MHz spectra may also be employed for metabolomics analysis, notably ketone bodies which arise from the use of lipid sources as a fuel in patients with poorly controlled diabetes. Such a multivariate metabolomics analysis of our LF 60 MHz 1H NMR dataset was therefore performed, and results arising therefrom are outlined below.
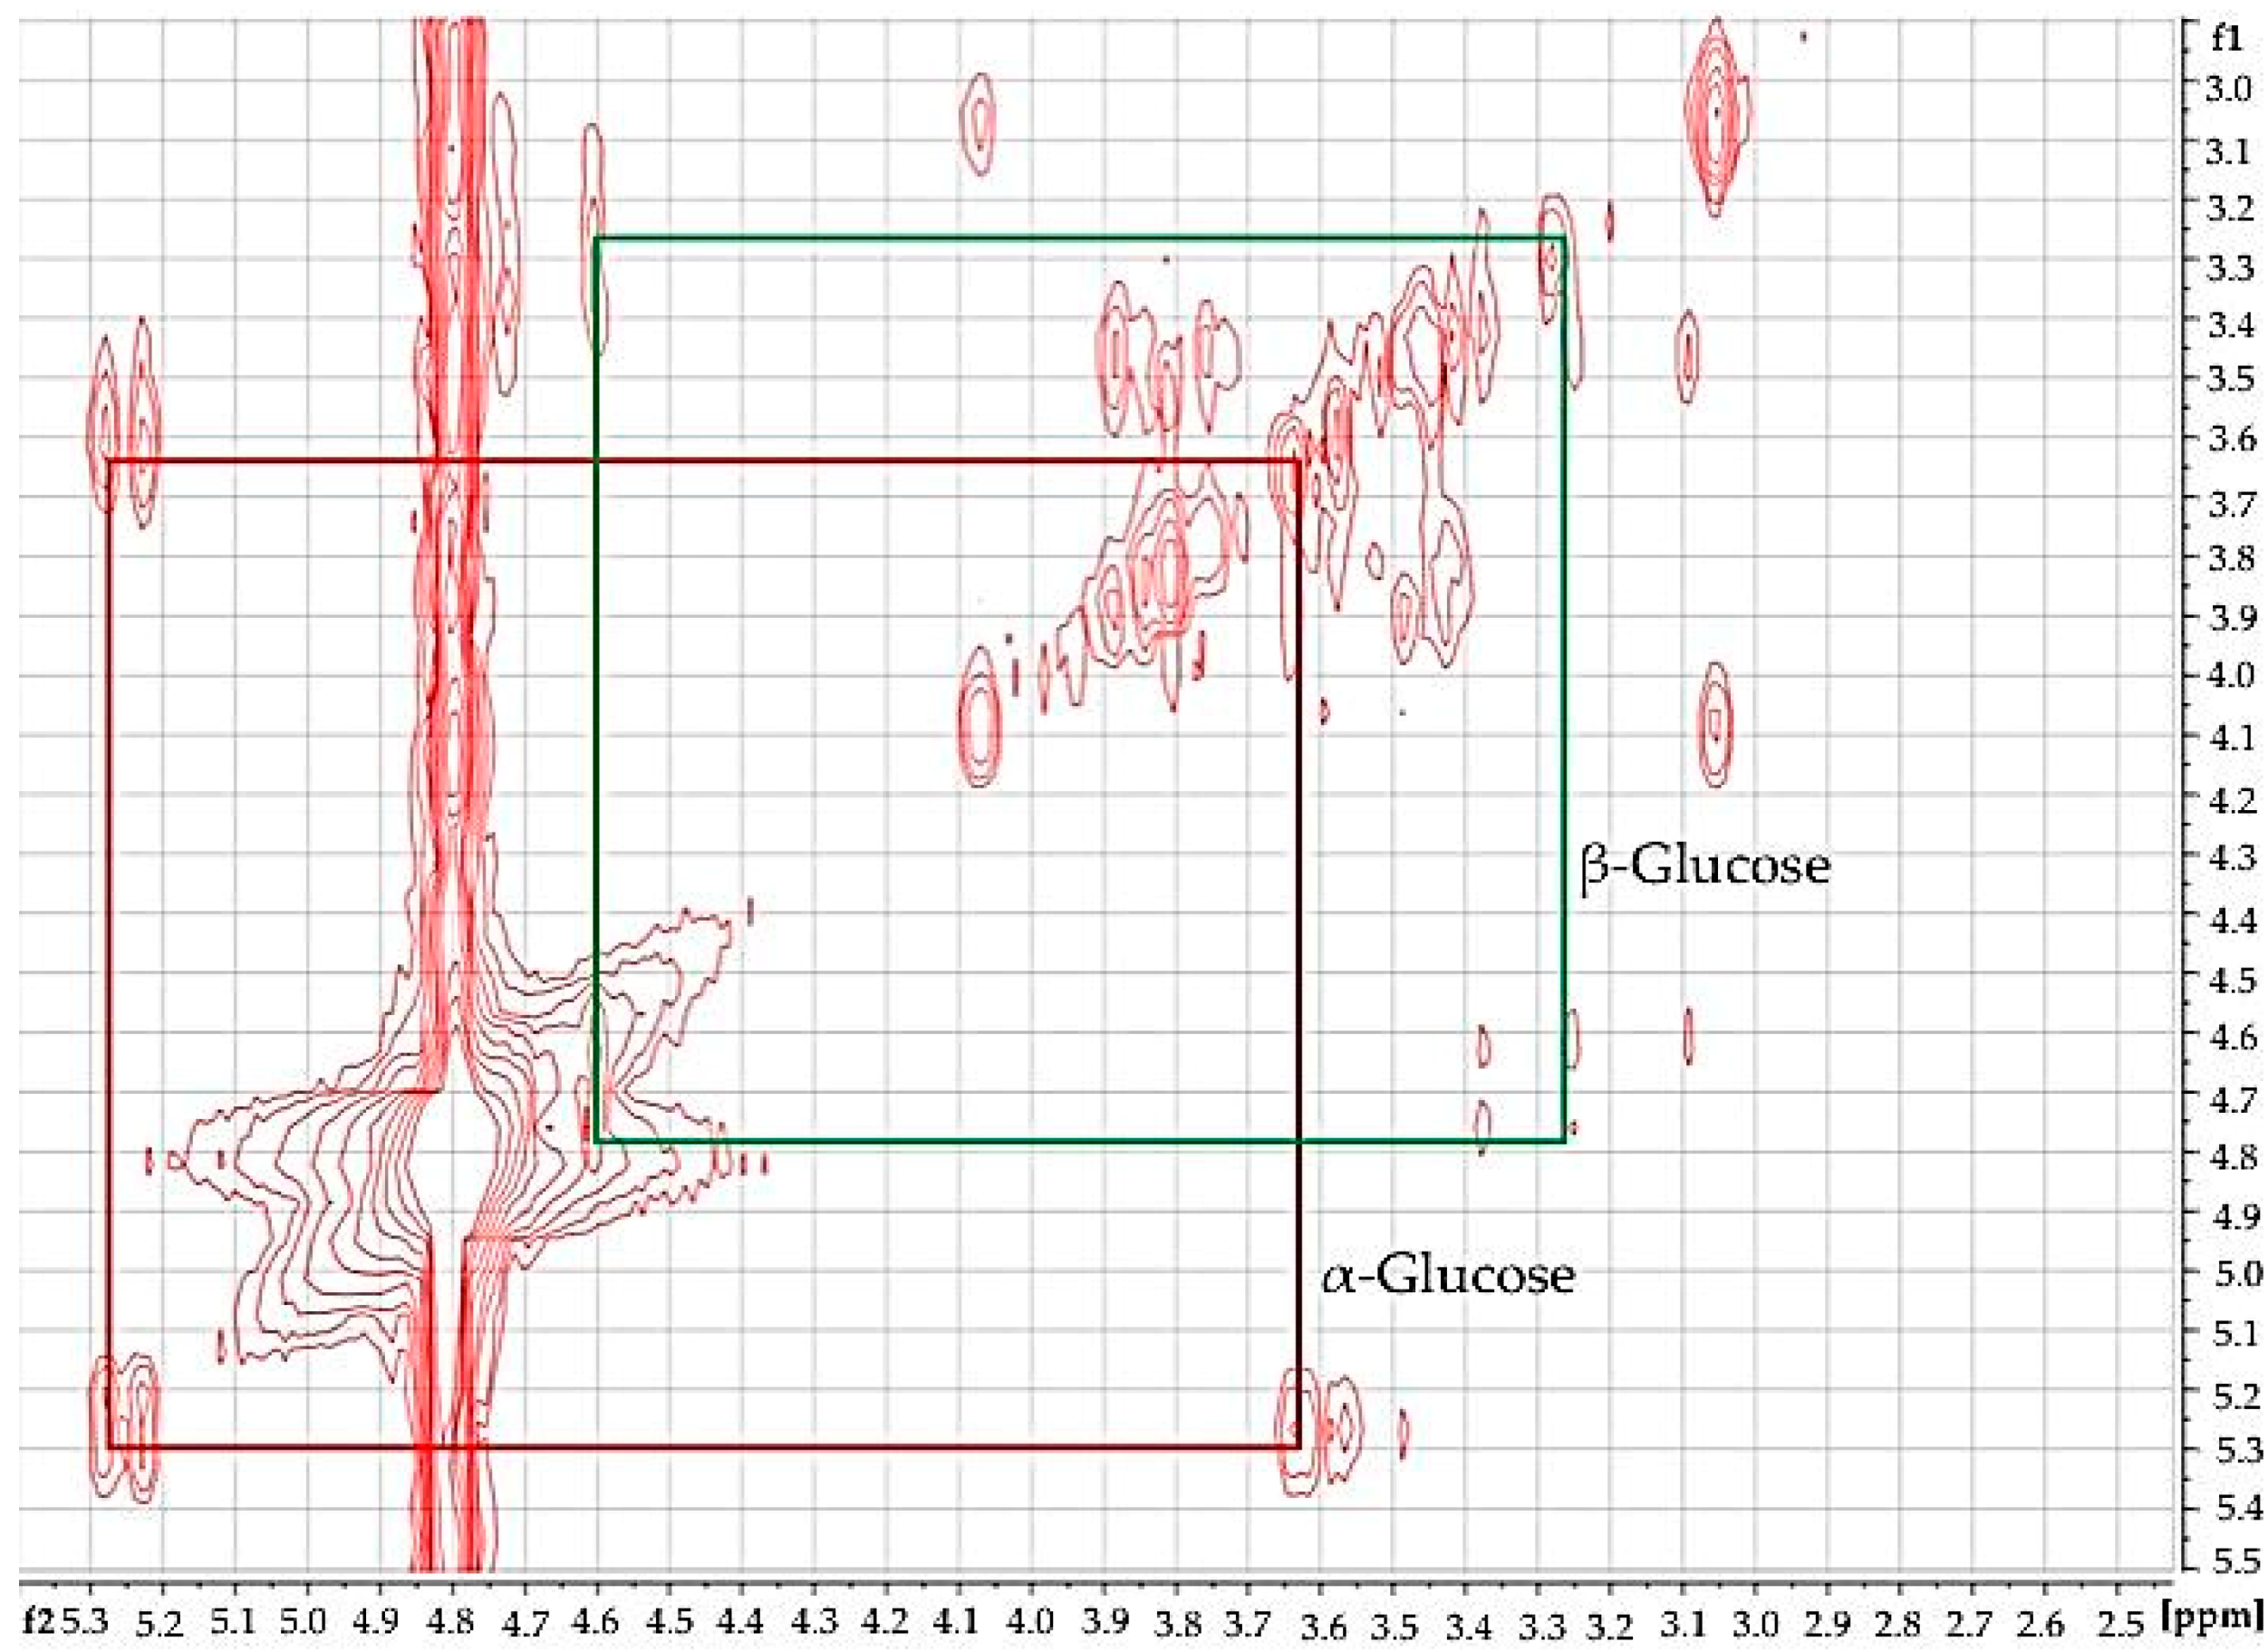
Using 2D
1H-
1H COSY analysis (
Figure 3), the identity of glucose in diabetic urine samples was readily confirmed, since this revealed connectivities between the -C1-
H and -C2-
H resonances of both its anomeric forms. Moreover, further glucose and other biomolecule connectivities were visible. This demonstrates the usefulness of 2D
1H-
1H COSY analysis of human urine as a confirmatory tool for LF benchtop NMR-based metabolomics applications.
Primarily, we compared urinary glucose determinations acquired on a LF 60 MHz benchtop NMR system with those conventionally determined on two separate HF 400 MHz facilities.
When all NMR spectrometer facilities employed for this study were correctly and rigorously calibrated with standard glucose concentrations in accordance with the strategy used for the 60 MHz LF benchtop instrument (i.e., using 0–600 mmol/L total glucose concentration standard solutions), there was an excellent correlation between urinary glucose determinations made on the 60 and both 400 MHz systems (R2 ≥ 0.997). Moreover, paired sample t-tests found no significant differences between total urinary glucose concentration determinations performed on a LF benchtop 60 MHz spectrometer and the two more conventional HF 400 MHz NMR facilities (p = 0.079 and 0.324).
However, further investigations were required in order to explore highly significant deviations from the 36:64 ratio of α-glucose:β-glucose C1-H anomeric proton resonance intensities (i.e., those of the corresponding 5.25:4.65 ppm signals) observed in urinary spectra acquired on both the 400 MHz facilities employed for these studies. In view of this crucial observation, further comparative evaluations between these results and those acquired at 60 MHz were performed. Such studies served to facilitate the direct determination of urinary glucose concentrations on these HF facilities without reference to calibration standard solutions. Indeed, for the 1H NMR spectral profiles acquired on type 2 diabetic urine samples at an operating frequency of 400 MHz, we observed that the ratios of intensities of glucose’s α- and β-C1-H anomeric proton resonances was 57:43 (mean ± SEM percentage α-anomer C1-H signal intensity 57.11 ± 2.40%), a value which reproducibly deviated substantially from the expected value, specifically 36:64, i.e., 36% α-anomer (this is also readily visible in the 400 MHz profile shown in Figure 8). This indicated that the H2O/HOD presaturation process employed and its corresponding power setting gave rise to a marked ‘dampening’ of the β-anomer’s C1-H NMR signal intensity, which arises from its very close chemical shift locality (δ = 4.65 ppm) to that of the presaturation frequency (δ = 4.80 ppm). In view of its close locality, this resonance is, of course, expected to be more affected by this presaturation process than the α-anomeric one located at δ = 5.25 ppm. Therefore, it appeared that the default NMR power setting of 50 dB employed for H2O/HOD solvent suppression at an operating frequency of 400 MHz gave rise to this unexpected and erroneous anomeric ratio.
Since the 50 dB default value (which is very effective for simple chemical model system samples) exerted a significant effect on glucose’s anomeric proton intensities, we elected to perform further investigations, which involved the alternative 400 MHz 1H NMR analysis of type 2 diabetic urine samples diluted extensively with 2H2O. In this manner, we developed an alternative HF 1H NMR method for the determination of urinary glucose concentrations. For this purpose, 60 µL of urine was diluted to a final volume of 0.60 mL with 2H2O, and to this mixture was added 60 µL of a 0.40% (w/v) solution of the microbicide sodium azide in 1.00 mol/L phosphate buffer (pH 7.00). These solutions, which contained 81.75% (v/v) 2H2O and only 18.25% (v/v) H2O were therefore much more suitable for electronic integration of glucose’s two anomeric proton signals, i.e., the adverse effects of water resonance presaturation were minimised in this high 2H2O content solution medium. To demonstrate this, we compared the integration ratios of these two anomeric proton resonances (δ = 4.65 and 5.25 ppm for the β- and α-anomers respectively) in the type 2 diabetic urine samples under these low H2O content sample preparation conditions, and employing a lower presaturation power setting of 62 dB (only one quarter of that of the 50 dB one), to those acquired on these samples containing only ca. 10% (v/v) 2H2O and the 50 dB default power setting provided above. Data acquired demonstrated that the mean relative intensity of the α-C1-H resonance signal to that of total glucose was 37.84 ± 1.96% (n = 6 samples), which is in excellent agreement with the expected value (36.0%). Therefore, this approach was considered highly satisfactory, and it was henceforth employed for all our HF 400 MHz 1H NMR glucose determinations on HF spectrometers.
Moreover, these further experiments established that the lower power setting of 56 dB (56 dB equating to one-half the power of the default 50 dB one) also produced integral values much closer to the expected 36:64 ratio; that employing the 62 dB power setting (a further halving of the power) generated a further improved integral ratio value for HF bioanalytical 1H NMR glucose determinations. Full results acquired from these studies will be reported elsewhere.
Having further established the validity of our integration strategy for the two anomeric protons of glucose at an operating frequency of 400 MHz, we then again sought to compare glucose concentrations determined from the TSP-normalised intensities of the α-anomer to those acquired on the LF 60 MHz benchtop spectrometer. We also compared these two sets of urinary total glucose concentrations to those determined on non-NMR analytical methods, i.e., an established glucose oxidase-peroxide/4-aminophenzone/phenol (GOD-PAP)-based spectrophotometric method (outlined in
section S4 of the Supplementary Materials), along with a simpler but less accurate urinary glucose visual colourimetric dipstick test system (Health Mate, DUS 8, DFI Co. Ltd., Gyeongsangnam-do, Korea). Where required, urine samples were diluted 1/5 or 1/10 prior to visual colourimetric dipstick analysis.
For this purpose, we employed an analysis-of-variance (ANOVA)-based experimental design with two main sources of variation (Equation (1), in which M
i, represents that attributable to any differences between the four analytical methods/techniques employed (fixed effect), P
j that arising from differences ‘between-participants’ (random effect, substantial in this case), e
ijk that ascribable to fundamental error, and y
ijk the urinary glucose concentration and μ that concentration in the absence of these sources of variation.
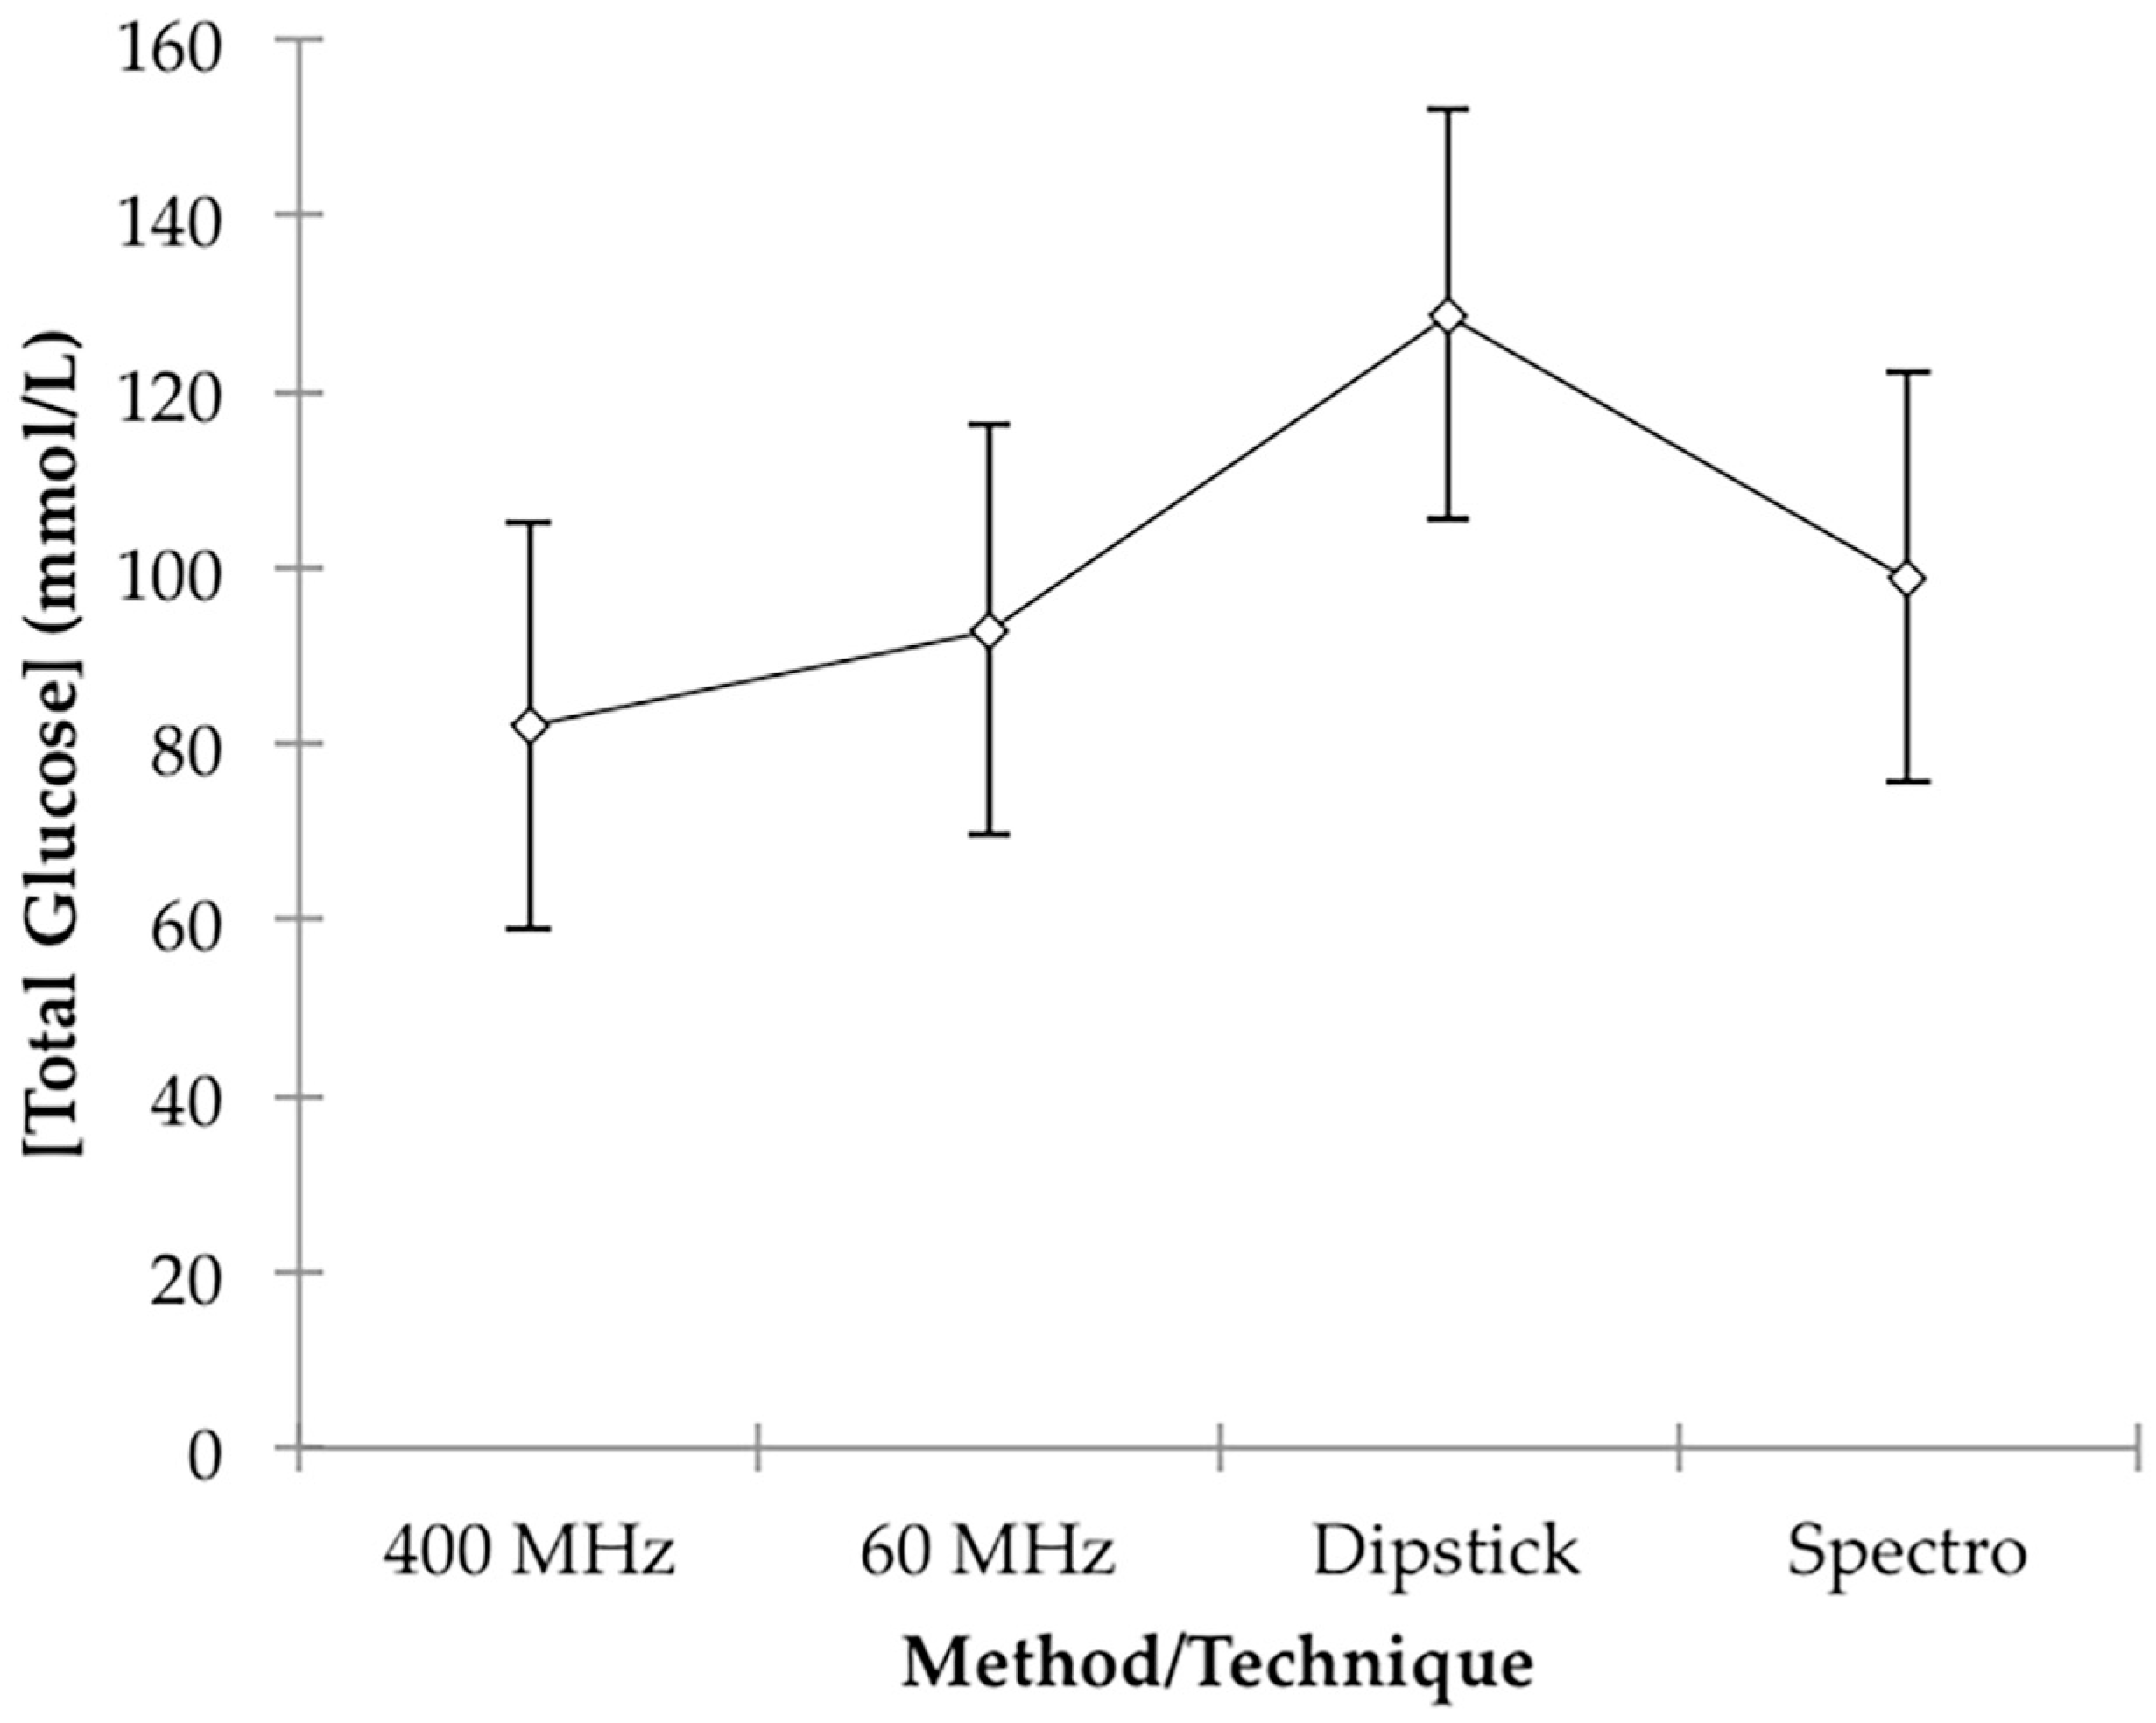
This analysis found that there were very highly significant differences between participants (
p < 10
−4), as expected; however, that between methods/techniques was barely statistically significant, and the only difference found between these four form of analyses using further analysis by Tukey’s highest significant difference (HSD) test, was that between 400 MHz
1H NMR-determined glucose levels and those obtained from the above dipstick approach, the latter being significantly greater than the former (
p = 0.033). However, this is not unexpected in view of the much poorer accuracy of the dipstick colour test system employed. Mean total estimated glucose concentration values for the 60 MHz NMR, 400 MHz NMR, spectrophotonetric GOD-PAP and chromophoric dipstick analyses were 92.9, 82.0, 98.8 and 128.7 mmol/L respectively, and these clearly indicate that the simple, less accurate dipstick analysis system may have overestimated urinary glucose levels. Plots of mean ± 95% ‘Between-Participant’ confidence intervals (CIs) for each class of determinations are shown in
Figure 4.
Therefore, based on this ANOVA experimental design, there were no statically significant differences found between our analysis of glucose on a LF (60 MHz) benchtop NMR facility and those determined by HF 1H NMR spectroscopy (400 MHz), an established glucose oxidase-based spectrophotometric assay, and also a simpler colour-visual dipstick strategy.
A plot of total glucose level results acquired on the LF 60 MHz NMR facility versus those obtained with the HF 400 MHz one was indeed linear (R
2 = 0.980), and 95% CIs for the y-intercept and regression coefficient (gradient) covered 0.00 and 1.00, respectively (0.888–1.189 for the latter parameter), information further confirming an excellent agreement between these two bioanalytical
1H NMR approaches. However, although plots of our 60 MHz NMR data against those arising from the spectrophotometric and dipstick analyses were again linear (R
2 = 0.940 and 0.980 respectively), and 95% CIs for the y-intercepts of these plots covered zero, 95% CIs for the regression coefficients were found to be significantly less than the 1.00 value expected for good agreement between these values (0.621–0.943 and 0.648–0.819 respectively). These plots, with 95% CIs for both means and observations, are shown in
section S5 of the Supplementary Materials section. Although as noted above, higher total glucose levels were expected for the simple dipstick test, the ca. 20% higher concentration values observed for the spectrophotometric analysis system are not simply explicable, and further investigations are underway to explore this difference further.
Despite excellent linear relationships between them, there were also statistically significant deviations from unity (i.e., <1.00) for the regression coefficients of plots of the 400 MHz analysis results against both the spectrophotometric and dipstick analysis systems explored, although the upper CIs for the former parameter were found to be very close to unity.
6.2. 1H NMR-Linked Metabolomics Analysis of LF 60 MHz Benchtop Spectrometer Datasets: Type 2 Diabetes Versus Healthy Controls
Both univariate and multivariate analysis of the LF benchtop 60 MHz NMR dataset revealed clear and highly statistically significant differences between urine samples collected from a cohort of diabetic patients (n = 10) and those from healthy controls (n = 14). The dataset acquired, comprising 27 manually selected and electronically integrated bucket regions ranging from 1.03–8.52 ppm, was normalised to the TSP internal standard (of final concentration 264 µmol/L), and then potential predictor variables within chemical shift bucket columns were generalised-logarithmically (glog)-transformed, and Pareto-scaled (Pareto-scaling involves subtraction of the mean resonance integration bucket value from all bucket observations followed by their division by the square root of that variable’s standard deviation, so that each one has a mean value of 0 and a variance not equivalent but similar to unity. Additional analysis performed was conducted exactly as described above, but with constant sum rather than added internal standard (TSP) concentration normalisation CSN.
Primarily, 27 univariate two-sample Student’s t-tests were performed, and when corrected for FDRs, these revealed very highly significant differences in the urinary concentrations of a range of biomolecules in type 2 diabetic patients. Key biomarkers detected using the LF 1H NMR technique were: citrate, i.e., 2 × -CH2CO2− functions within the relatively spectroscopically clear 2.53–2.70 ppm bucket (p = 1.87 × 10⁻⁶); N-acetyl storage compounds, i.e., N-acetylsugar- and N-acetylamino acid-NHCOCH3 function protons in the relatively clear 1.99–2.13 ppm bucket (p = 1.87 × 10⁻⁶); lactate as its -CH3 group protons in the 1.25–1.34 ppm region (p = 2.15 × 10⁻⁶), which has potential interferences arising from threonine- and acetoin-CH3 functions; alanine as its -CH3 function doublet resonance at 1.48 ppm with minimal potential interferences; Cn, i.e., as its >N-CH3 proton singlet within the 2.98–3.14 ppm bucket (p = 5.0 × 10⁻⁶), with potential interferences arising from creatine-CH3, lysine-ε-CH2 and γ-aminobutyrate’s γ-CH2 functions, and also β-glucose’s C2-H 3.21 ppm signal; acetone as its -CH3 groups’ singlet resonance within the 2.14–2.29 ppm bucket (p = 5.53 × 10⁻⁶), which has conceivable interferences from glutamine-C3-CH2 and acetoin-CH3 proton signals; acetate as its -CH3 function in the 1.87–1.99 ppm bucket (p = 4.53 × 10⁻⁵), which has a potential interference from the thymine-CH3 resonance, although it should be noted that the latter metabolite has a substantially lower urinary concentration than the former; 3-d-hydroxybutyrate within the 1.14–1.25 ppm bucket (p = 4.55 × 10⁻⁵), with potential interferences arising from 3-aminoisobutyrate-CH3 and L-fucose-CH3 function resonances; indoxyl sulphate in the 7.15–7.33 ppm bucket (p = 6.27 × 10⁻³), with a potential interference from tyrosine’s C2/C6 aromatic proton doublet signal; and hippurate as its signal localised within the 7.55–7.71 ppm bucket, the only potential interfering agent being 1-methylhistidine’s C4 imidazole ring proton singlet (p = 0.037). Most importantly, glucose, which was determined firstly as a composite bulk carbohydrate ring proton (i.e., C2-H to C6-H2) bucket (δ = 3.14–3.99 ppm, p = 2.15 × 10⁻⁶), and secondly as the more specific α-anomeric proton (i.e., α-C1-H) resonance bucket (δ = 5.17–5.36 ppm, p = 0.038) was also found to be a key upregulated biomarker, as expected. However, as noted above, a complication of the α-C1-H glucose signal’s integration is its small fractional overlap with the residual water signal at 60 MHz operating signal. Although the bulk 3.14–3.99 ppm glucose sugar ring proton bucket intensity can be expected to be influenced by contributions from those of a range of further urinary metabolite signals also present within this spectral region, we found that when glucose concentrations were >10 mmol/L, as indeed it was in all six of the type 2 diabetic urine samples explored which had detectable glucose levels (it was non-1H NMR-detectable in 4/10 samples investigated), such interferences were limited in view of the much lower intensities of these further biomolecule signals within this broad spectral region (such as those arising from choline, betaine, trimethylamine N-oxide, taurine, glycine, creatine, glycolate, guanadinoacetate, etc.) than those of the relatively intense α- and β-glucose anomers (i.e., C2-H to C6-H2 resonances combined).
Upregulations of both the ketone body 3-d-hydroxybutyrate, and also Cn in the type 2 diabetic patient samples were confirmed by HF 1H NMR analysis performed at an operating frequency of 400 MHz. Indeed, mean ± SEM absolute urinary concentrations of 3-d-hydroxybutyrate were 3.12 ± 0.99 mmol/L for the type 2 diabetic cohort, but only 0.24 ± 0.06 mmol/L for the healthy control group (p = 6.34 × 10⁻³, two-sample Student’s t-test), i.e., a 13-fold difference in mean values. Similarly, Cn-normalised 3-hydroxybutyrate levels were 89.8 ± 18.7 and 31.2 ± 6.4 µmol/mmol Cn for the type 2 diabetic and healthy control groups respectively (p = 2.86 × 10⁻³). However, TSP-normalised intensities of the urinary Cn-CH2- function resonance were found to be much higher in the type 2 diabetic patient group, i.e., mean ± SEM values of 14.37 ± 7.27 (corresponding to 20.86±10.56 mmol/L) versus 4.33 ± 0.68 (corresponding to 6.30±0.99 mmol/L) for the healthy control group (p = 0.0144).
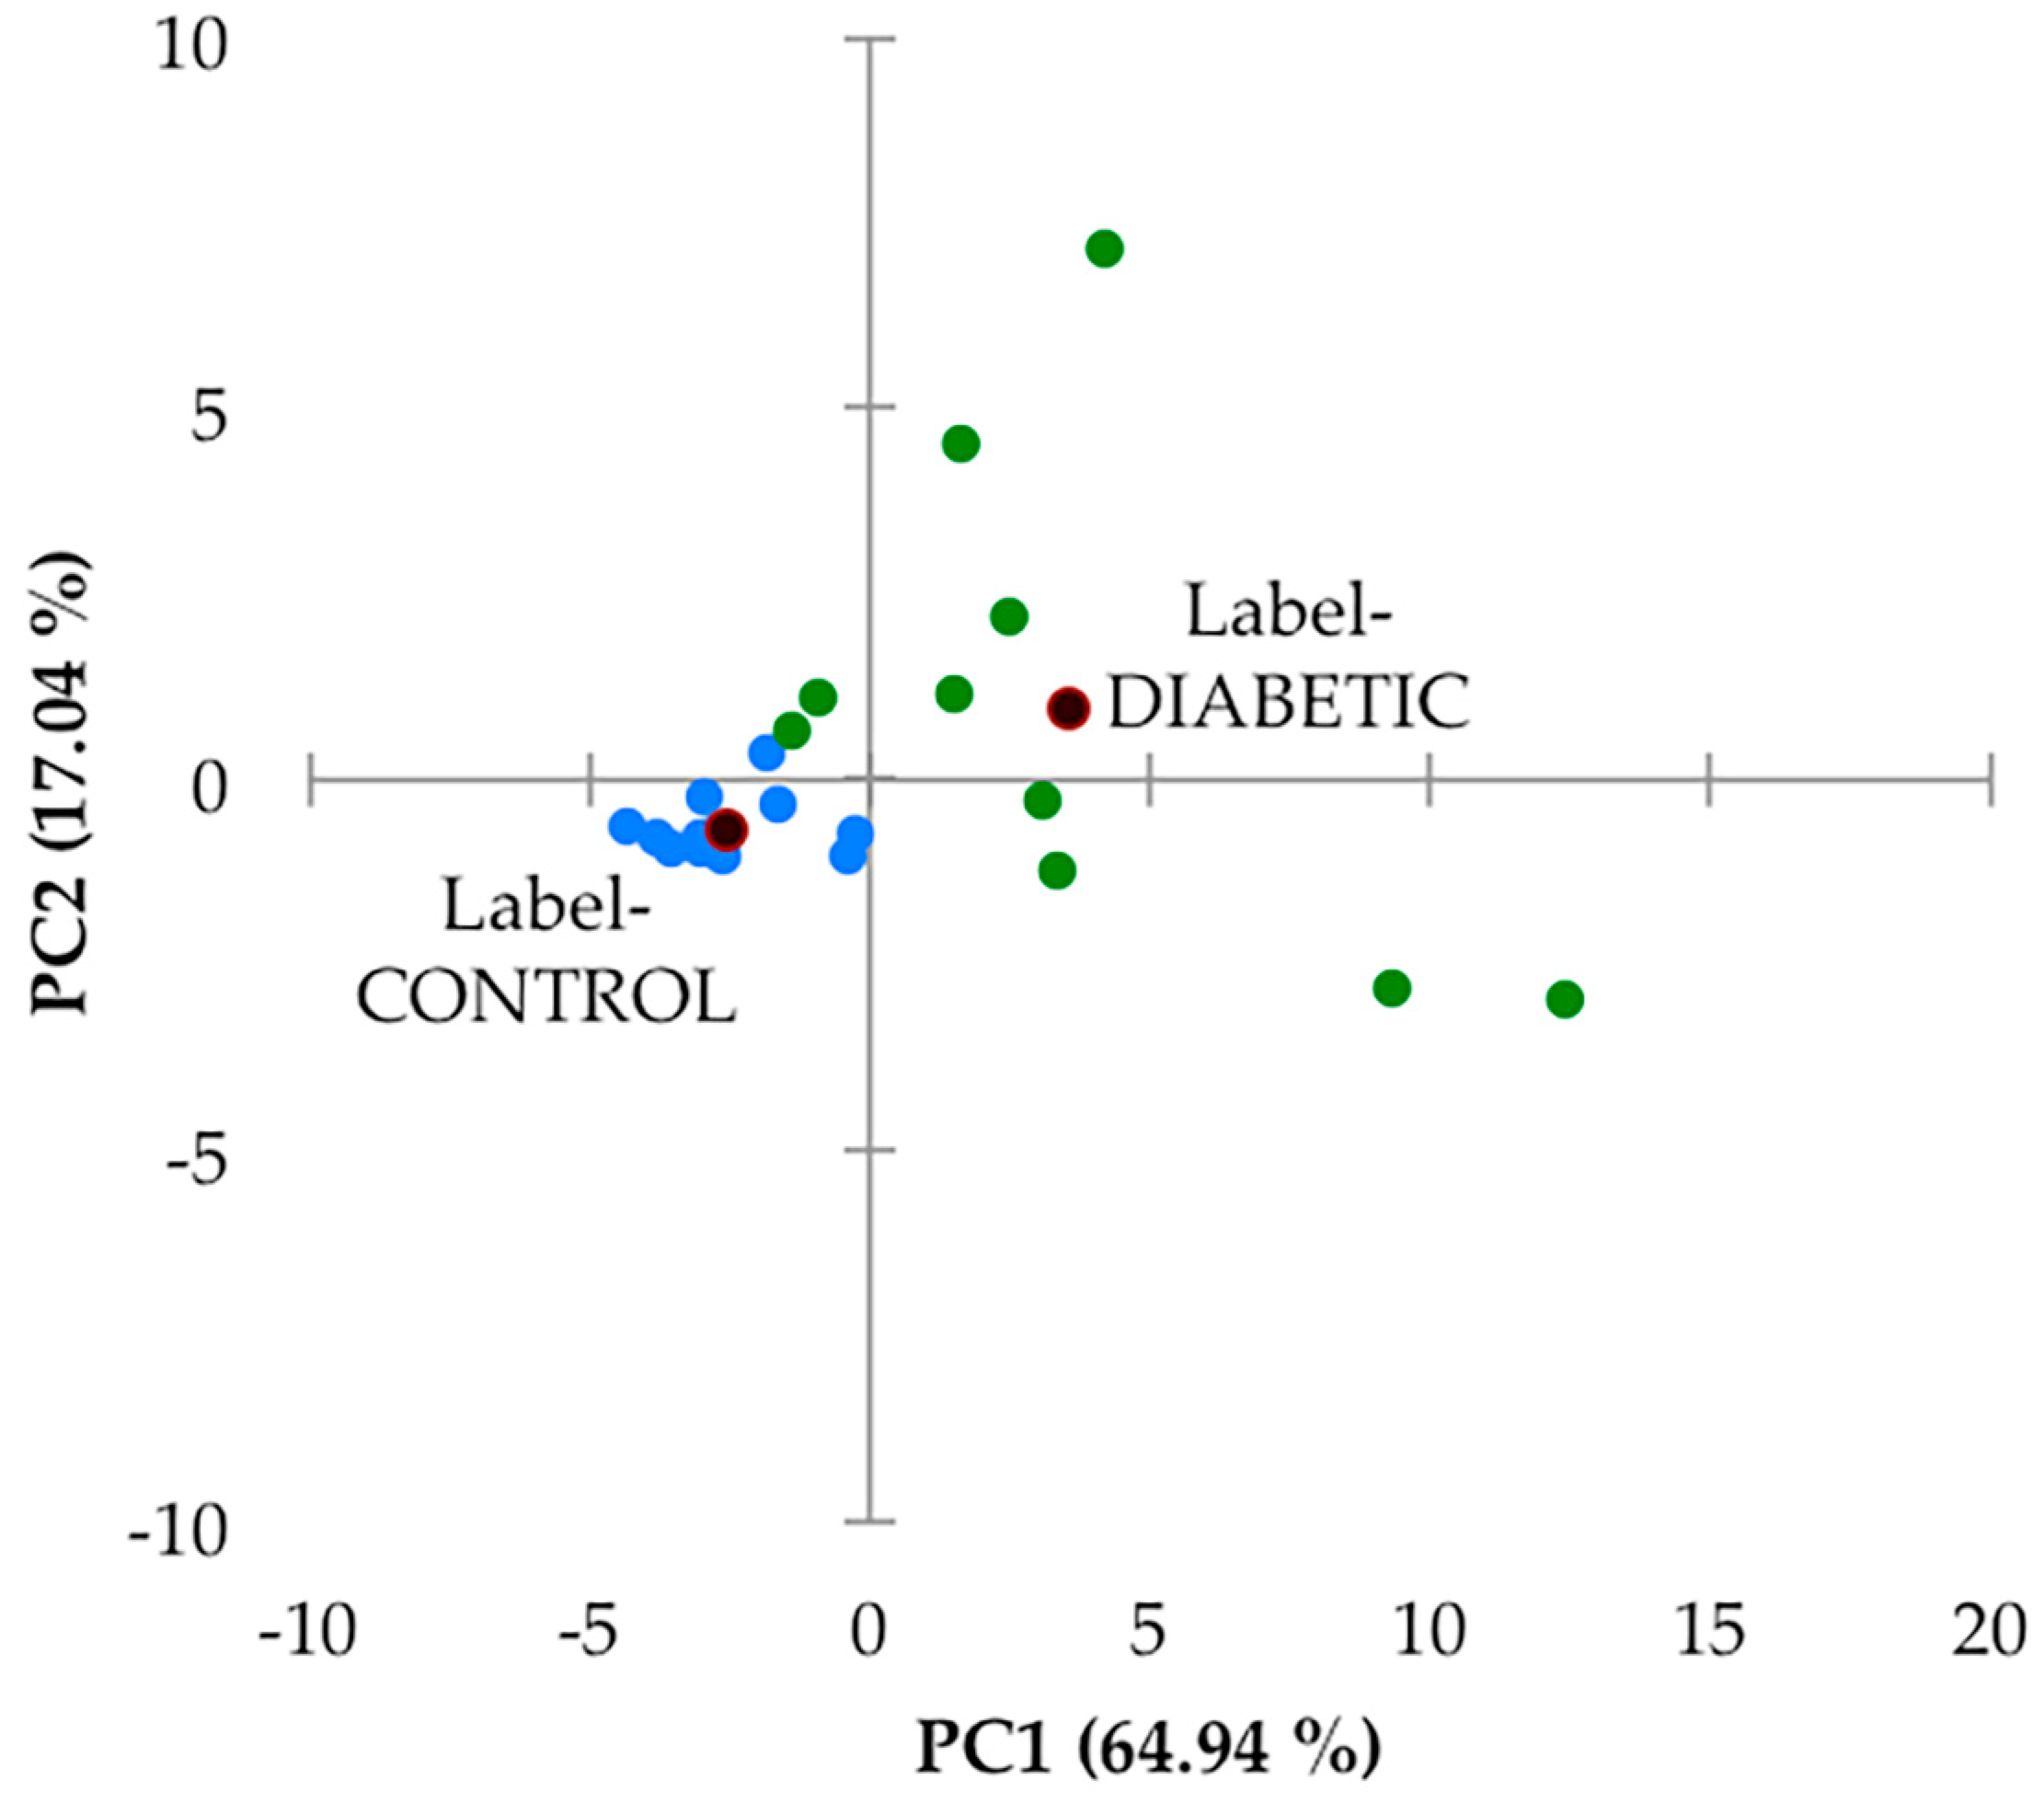
Secondly, this 27-variable dataset was subjected to principal component analysis (PCA), and this analysis, which was performed with varimax rotation and Kaiser normalisation, and a minimum variance criterion of 80%, showed that there were two major PCs isolated, which accounted for a total of 82% of the total model variance. There was a high degree of distinction between the urinary profiles of the two sample groups investigated (
Figure 5). However, it should be noted that the PC1 and PC2 scores of samples collected from the type 2 diabetic patient samples varied much more so than their healthy control counterparts. Indeed, PC1 varied from −2 to +13, and PC2 from −3 to +8 for this patient cohort, whereas for the healthy control samples, contributions to both PCs were much lower, and this group of sample PC score datapoints were found to form a tight cluster within the −5 to 0 PC1 range, with only very low PC2 contributions. In view of this high level of PC variation in the type 2 diabetes group samples, we elected not to remove any of the samples as outliers. A detailed manual examination of the
1H NMR profiles of both participant groups did not reveal any resonances arising from ethanol, (with the exception of one of the healthy control samples which was removed prior to performing this multivariate data analysis (decreasing the sample size from 15 to 14), and which contained an ethanol-C
H3 triplet resonance located at δ = 1.19 ppm), nor those from any other xenobiotics.
An examination of loadings scores revealed that both 60 MHz glucose resonance bucket regions (δ = 3.14–3.99 and 5.17–5.36 ppm) loaded strongly on PC2 (loading scores 0.96 and 0.95 respectively), as did citrate (loading score 0.77), and this accounts for the predominantly higher PC2 values of the type 2 diabetic patient samples (although it should be noted that 4 of these samples had little or no detectable glucose). PC1 had significant loadings from a larger number of these chemical shift bucket regions, including those arising from aromatic biomolecules such as indoxyl sulphate and hippurate, which were found to be downregulated in our type 2 diabetic urinary profiles (as outlined below). Again, PC1 scores were predominantly greater in the diabetic group samples.
Although no major sub-clusterings of the small number of type 2 diabetic patients recruited to this study (n = 10) were discernable in this PCA scores plot, two urine samples provided therefrom with the most strongly positive PC1 score values (>9 and 12) and PC2 values of ca. −2.9 may be considered as such. However, the small number of samples available clearly restricts any decisions from being made regarding their potential removal.
As a further example of multivariate analysis, OPLS-DA was utilised to explore the ability of this strategy to distinguish between the type 2 diabetic and healthy control urinary
1H NMR profiles acquired.
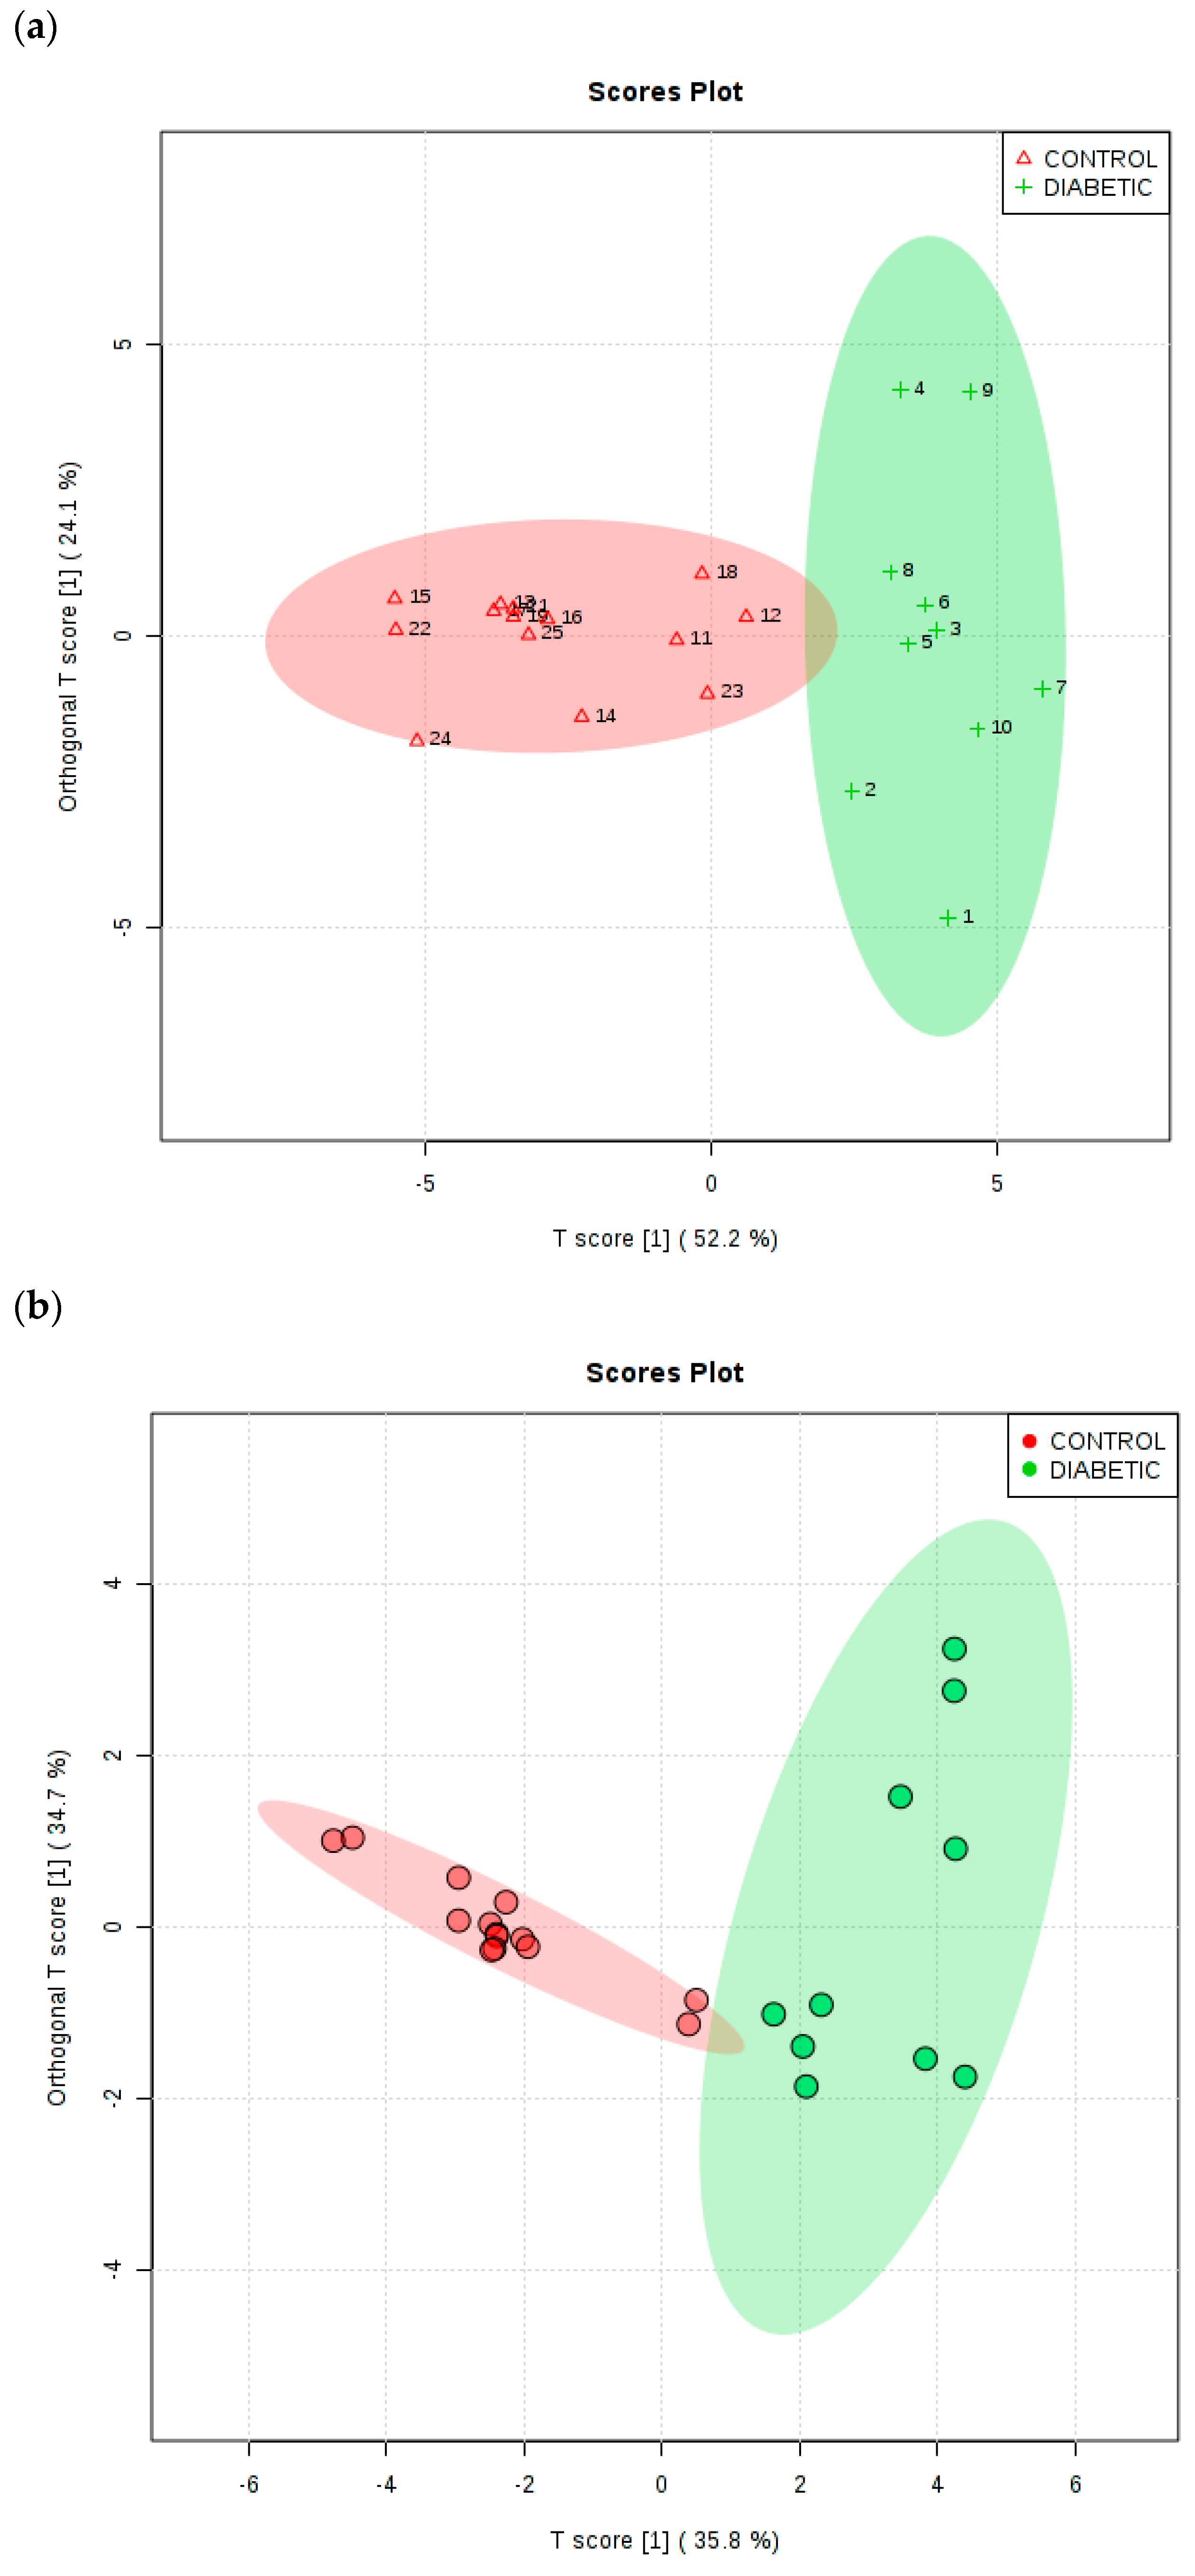
Figure 6a shows an OPLS-DA scores plot with associated 95% confidence ellipses, and this demonstrates clearly distinctive clusterings for these two groups of participants for the TSP-normalised dataset. To evaluate the performance of this multivariate classification system, a 10-fold cross-validation procedure was applied. R
2X, R
2Y and Q
2 values obtained from this analytical model were 0.522, 0.674 and 0.634 respectively, and the Q
2 value obtained was highly significant (values of this index ≥0.40 are routinely employed as a cut-off for this model, as previously described by Worley and Powers [
39]). Moreover, a permutation test conducted with 2000 permutations gave
p values of <5 × 10
−4 for both Q
2 and R
2Y. PLS-DA variable importance in projection (VIP) scores and OPLS-DA S-plots were utilised in order to identify the most important
1H NMR bucket variables for discrimination between healthy and type 2 diabetic participants, and those assigned to methylsuccinate (upregulated in type 2 diabetes) and formate (downregulated) were also found to serve as key biomarker features of this discrimination, in addition to the majority of those detected via the univariate
t-test analysis described above (including glucose itself, the ketone bodies acetone and 3-
d -hydroxybutyrate, acetate, N-acetyl storage compounds, citrate, Cn and lactate).
In view of polyuria experienced by uncontrolled or poorly controlled diabetic patients, we also elected to subject the CSN dataset to MV metabolomics analysis. For this dataset, the OPLS-DA model also yielded a Q2 parameter of 0.63 (permutation p-value 5.0 × 10⁻⁴ with 2000 permutations), and the two glucose resonance bucket regions (bulk C2-H to C6-H2, and α-anomeric C1-H proton ones) served as the two most important key upregulated biomarker variables for type 2 diabetes (upper right-hand side p[1] axis portion of plot, with p[1] values ≥ 1.6), as expected. The five most significant type 2 diabetes group-downregulated ones (with p[1] values ≤ −2.3 at the lower left-hand side p[1] axis of the plot) were exclusively those with relatively intense resonances within the 7.15–8.01 ppm aromatic regions of spectra, i.e., those of indoxyl sulphate and hippurate, together with perhaps lower intensity, spectrally overlapping contributions arising from interfering phenylalanine and 1-methylhistidine signals, respectively. Hippurate’s-α-CH2 function resonance (δ = 3.96 ppm) was not among the biomarker resonances found in view of its overlap by much higher intensities of the bulk δ = 3.14–3.99 ppm glucose ring proton signals. As expected, removal of the two glucose resonance bucket regions prior to analysis markedly diminished this model’s Q2 value from 0.63 to only 0.43, an observation confirming the importance of these as 1H NMR-based distinguishing features.
Similarly, PCA of this glucose resonance-removed CSN dataset showed much more overlap of the type 2 diabetes and healthy control group clusterings than that observed with the inclusion of these signals, and univariate t-tests revealed only a small number of significant variables, with FDR-adjusted p values ranging from 3.02 × 10⁻⁶ to 0.032 (these included the alanine and hippurate resonance bucket regions).
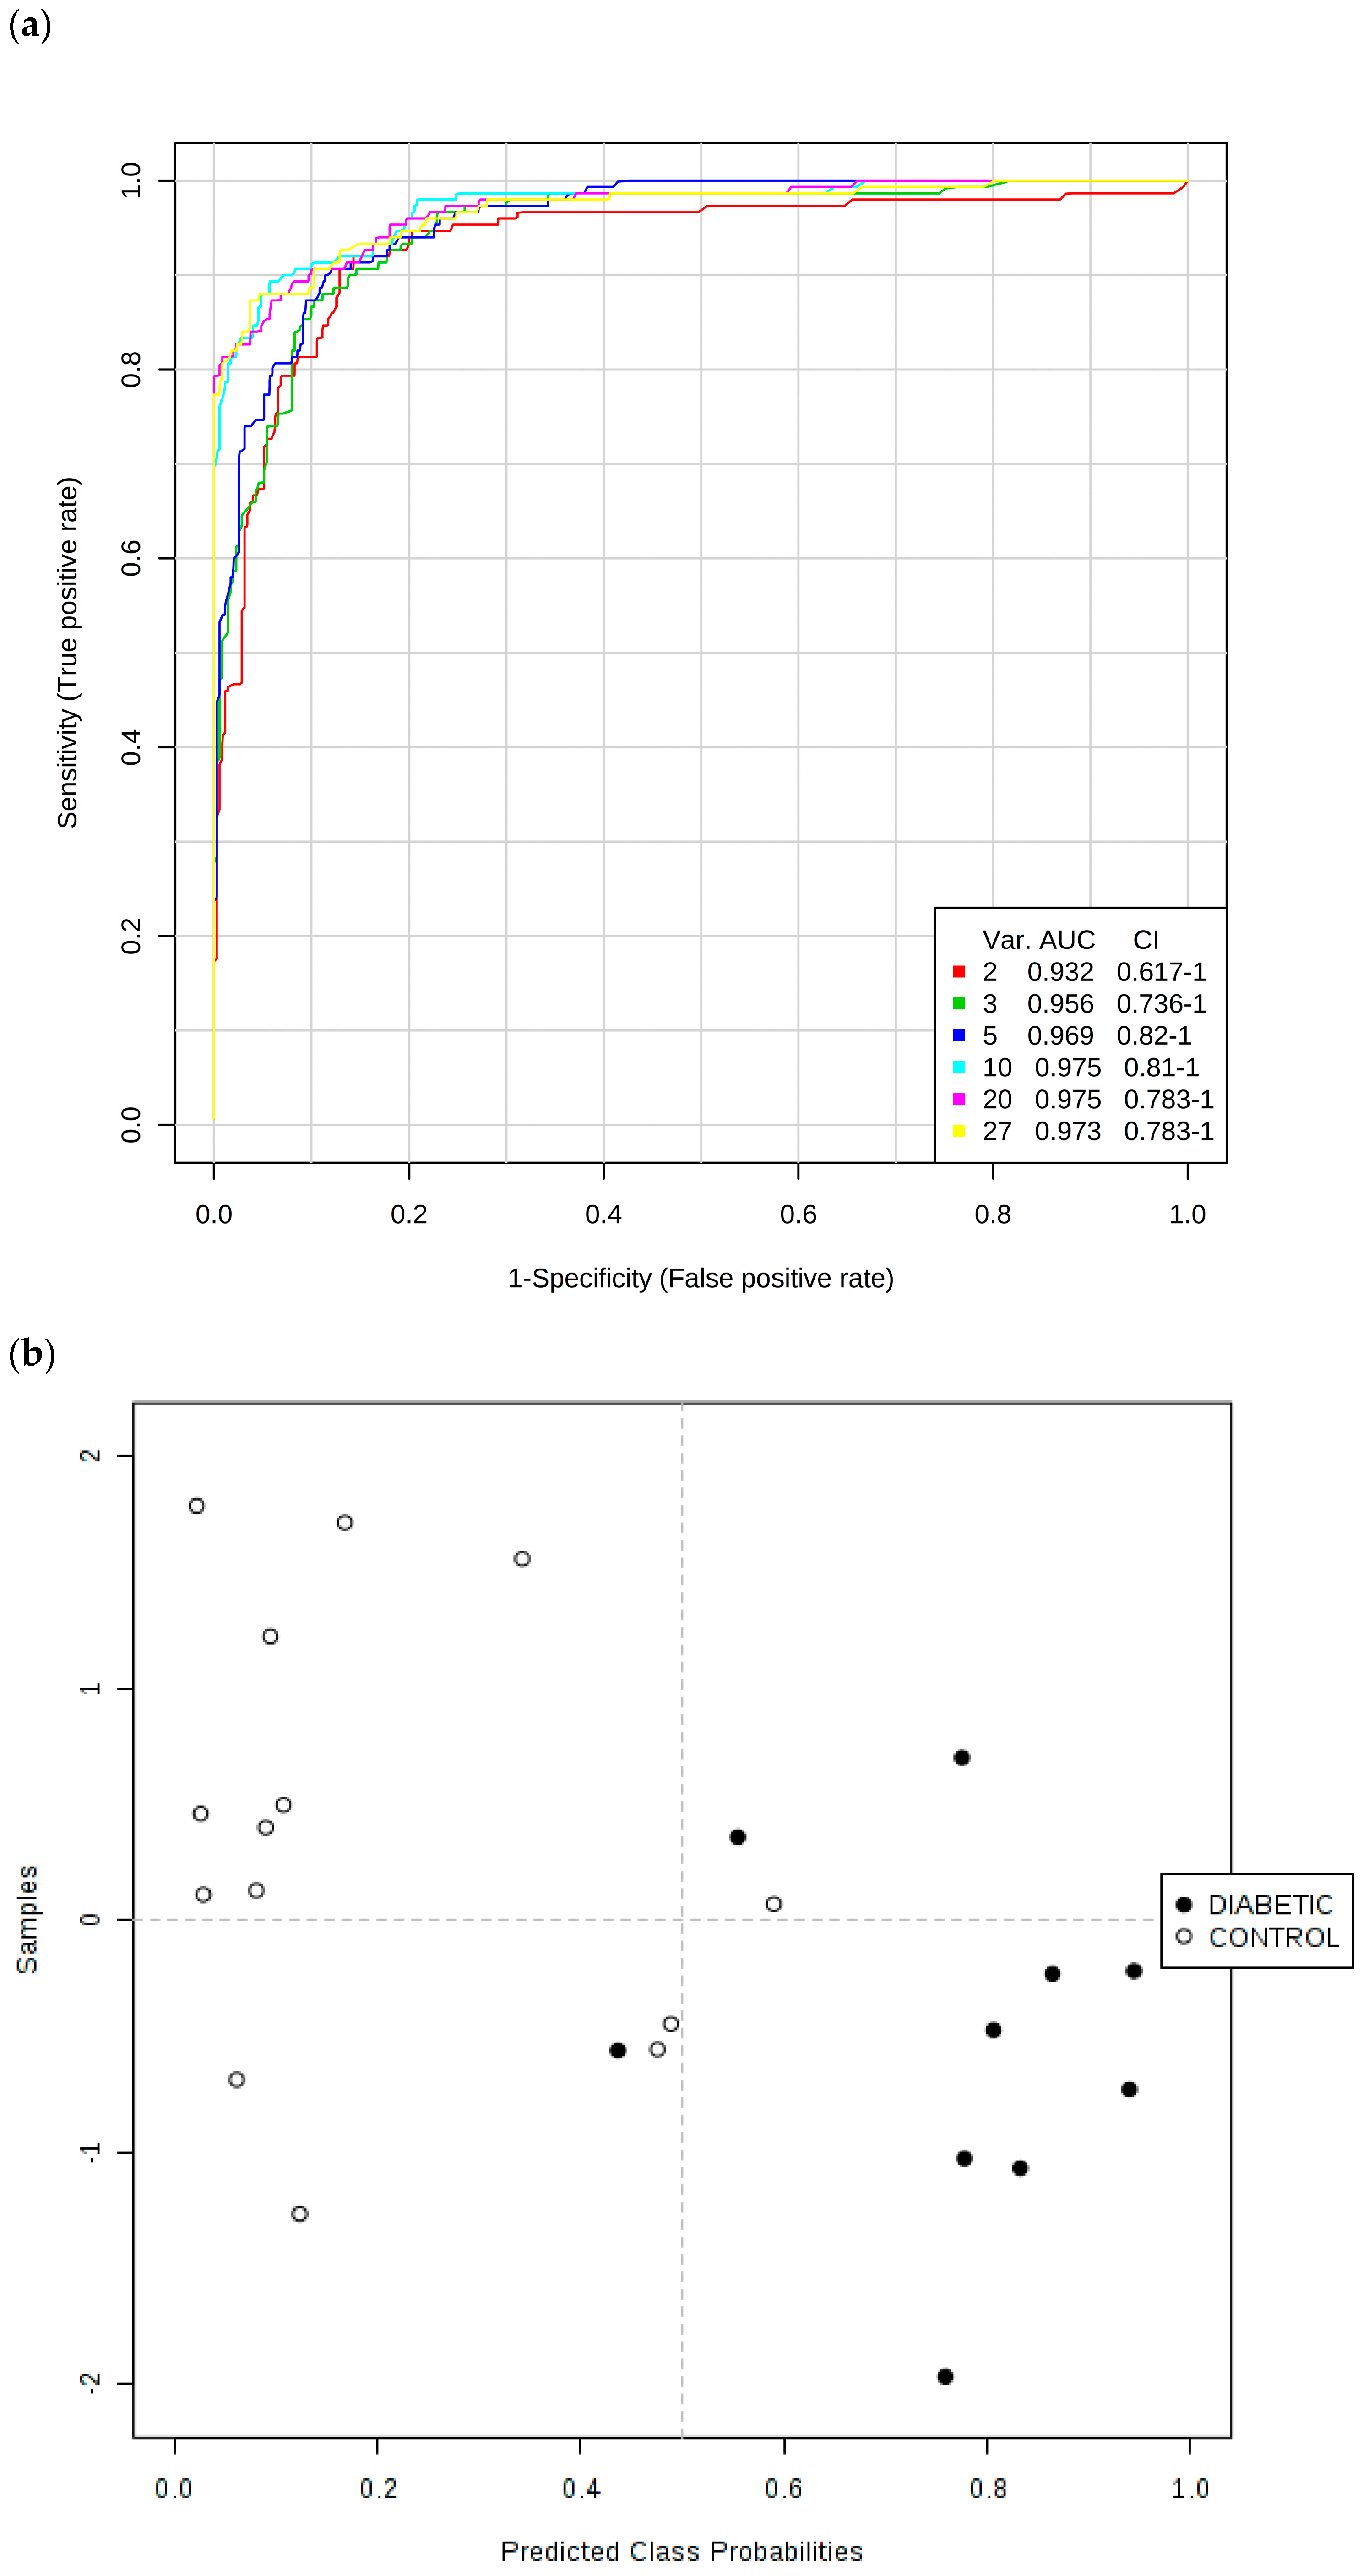
Secondly, ROC curves produced via Monte Carlo Cross-Validation (MCCV) and based on the SVM strategy demonstrated that the overall mean classification success rate was 97.5% for this model. The most effective SVM models were those which incorporated the total number of 10 chemical shift bucket region intensity features, the AUROC value obtained being 0.975 (95% confidence intervals 0.81–1.00), as shown in
Figure 7. Therefore, with the above overall classification reliability and AUROC values, this model applied served as one with a highly effective discriminatory ability (these values are considered effective, highly discriminatory and exceptional for models when they are >0.70, 0.87–0.90 and >0.90 respectively [
40]).
Key discriminatory biomarker variables identified from this form of multivariate analysis were citrate > 3-d-hydroxybutyrate > hippurate > N-acetyl storage compounds > alanine > total bulk glucose (C2-H to C6-H2 resonances only) > lactate > α-glucose (C1-H resonance only) > 3-(3-hydroxyphenyl)-3-hydroxypropanoate (C1/C6-CH resonances) > indoxyl sulphate > urea in that order of effectiveness.
We also performed this ROC testing system for a simple model incorporating the two TSP-normalised glucose 1H NMR buckets, along with those of the ketone bodies acetone and 3-d-hydroxybutyrate, and found that AUROC (and corresponding 95% confidence interval) values for models with two, three and four of these key variables were as high as 0.934 (0.725–1.00), 0.937 (0.773–1.00) and 0.930 (0.773–1.00) respectively, observations confirming that these upregulated diabetes biomarkers were highly significant discriminators, as expected. Moreover, univariate ROC values obtained for a series of key biomarker resonances were found to be 1.00 (N-acetyl storage compounds); 0.9929 (glucose bulk C2-H to C6-H2, acetone-CO-CH3 and citrate-CH2-CO2−); 0.9430 (3-d-hydroxybutyrate-CH3); and 0.882 (α-glucose-C1-H).
Finally, a Random Forest analysis performed on the TSP-normalised dataset with 500 trees and seven distinguishing variables per node successfully classified nine out of ten type 2 diabetic samples, and 12 out of 14 healthy control ones, on the basis of their urinary
1H NMR metabolic profiles, i.e., an overall classification accuracy of 0.875 (
section S6, Supplementary Materials document).
The difference between the
1H NMR metabolic profiles of urine acquired at 60 and 400 MHz operating frequencies for metabolomics analysis is substantial (
Figure 8). Indeed, in 1D single-pulse spectra acquired at 60 MHz, the α-glucose signal is influenced by the residual water signal at concentrations <2.8 mmol/L, and increasingly so with decreasing α-glucose level. Moreover, the difference in resolution from 400 MHz to 60 MHz causes significant expansion of multiplet resonances, especially complex second-order ones, at the lower operating frequency. This, in turn, gives rise to resonance overlap problems at 60 MHz, particularly for complex biofluid spectra. Indeed, this resonance δ value expansion would be 400/60 times greater for 60 MHz spectra than it is for 400 MHz ones. For example, the ethanol-CH
3 function triplet resonance located at δ = 1.19 ppm, which has a
J value of 7.07 Hz, would wholly encompass 2 × 7.07 Hz/60 Hz = 0.235 ppm of the spectral profile at 60 MHz, but only 2 × 7.07 Hz/400 Hz = 0.035 ppm at 400 MHz. The more challenging signals to assign include those from higher-order multiplets and more highly split first-order ones, such as the lactate C-
H quartet resonance (δ = 4.13 ppm). Glucose was clearly
1H NMR-detectable in six out of a total of n = 10 type 2 diabetic urine samples at an operating frequency of 60 MHz, and integration of the 5.25 ppm α-anomeric proton signal followed by its normalisation to internal TSP provided calibration curve-based estimates of total urinary glucose levels in our cohort of type 2 diabetic patients. Mean ± SEM glucose concentrations determined by LF benchtop 60 MHz
1H NMR analysis were 93 ± 41 mmol/L for all n = 10 samples explored. However, exclusion of the n = 4 type 2 diabetic urine samples in which glucose was undetectable gave revised mean ± SEM values of 155 ± 56 mmol/L. The former mean ± SEM values for Cn-normalised urinary total glucose concentrations determined from our 400 MHz
1H NMR analysis were 17.9 ± 7.5 mmol/mmol Cn. These Cn-normalised urinary glucose level values concord with those previously reported in diabetic patients, as noted in
Table 1, although it should be noted that these data correspond to type 1 diabetes or diabetic ketosis. This table also lists mean Cn-normalised glucose concentrations for healthy control subjects, which vary from 9.0 to 37.5 µmol/mmol Cn for adults, 31.6 µmol/mmol Cn for children, 7.0–143.1 µmol/mmol Cn for infants, and 15.0 µmol/mmol Cn for new-borns.
The significance of urinary glucose levels is not only evident in diabetes patients, but also in patients with conditions such as eosinophilic esophagitis and Fanconi Bickel Syndrome (
Table 1). Therefore, potential applications for using LF-benchtop NMR reach far beyond screening for one disease, metabolic ‘fingerprints’ being able to be formed to successfully diagnose multiple diseases. Moreover, monitoring urinary glucose levels is just a single example of what can be achieved using LF NMR analysis. Investigations of other biofluids and corresponding metabolites are possible, and therefore an abundance of metabolic disturbances may be explored with this novel technique.
