
Identification of Novel Biomarker for Early Detection of Diabetic Nephropathy

 , , , and
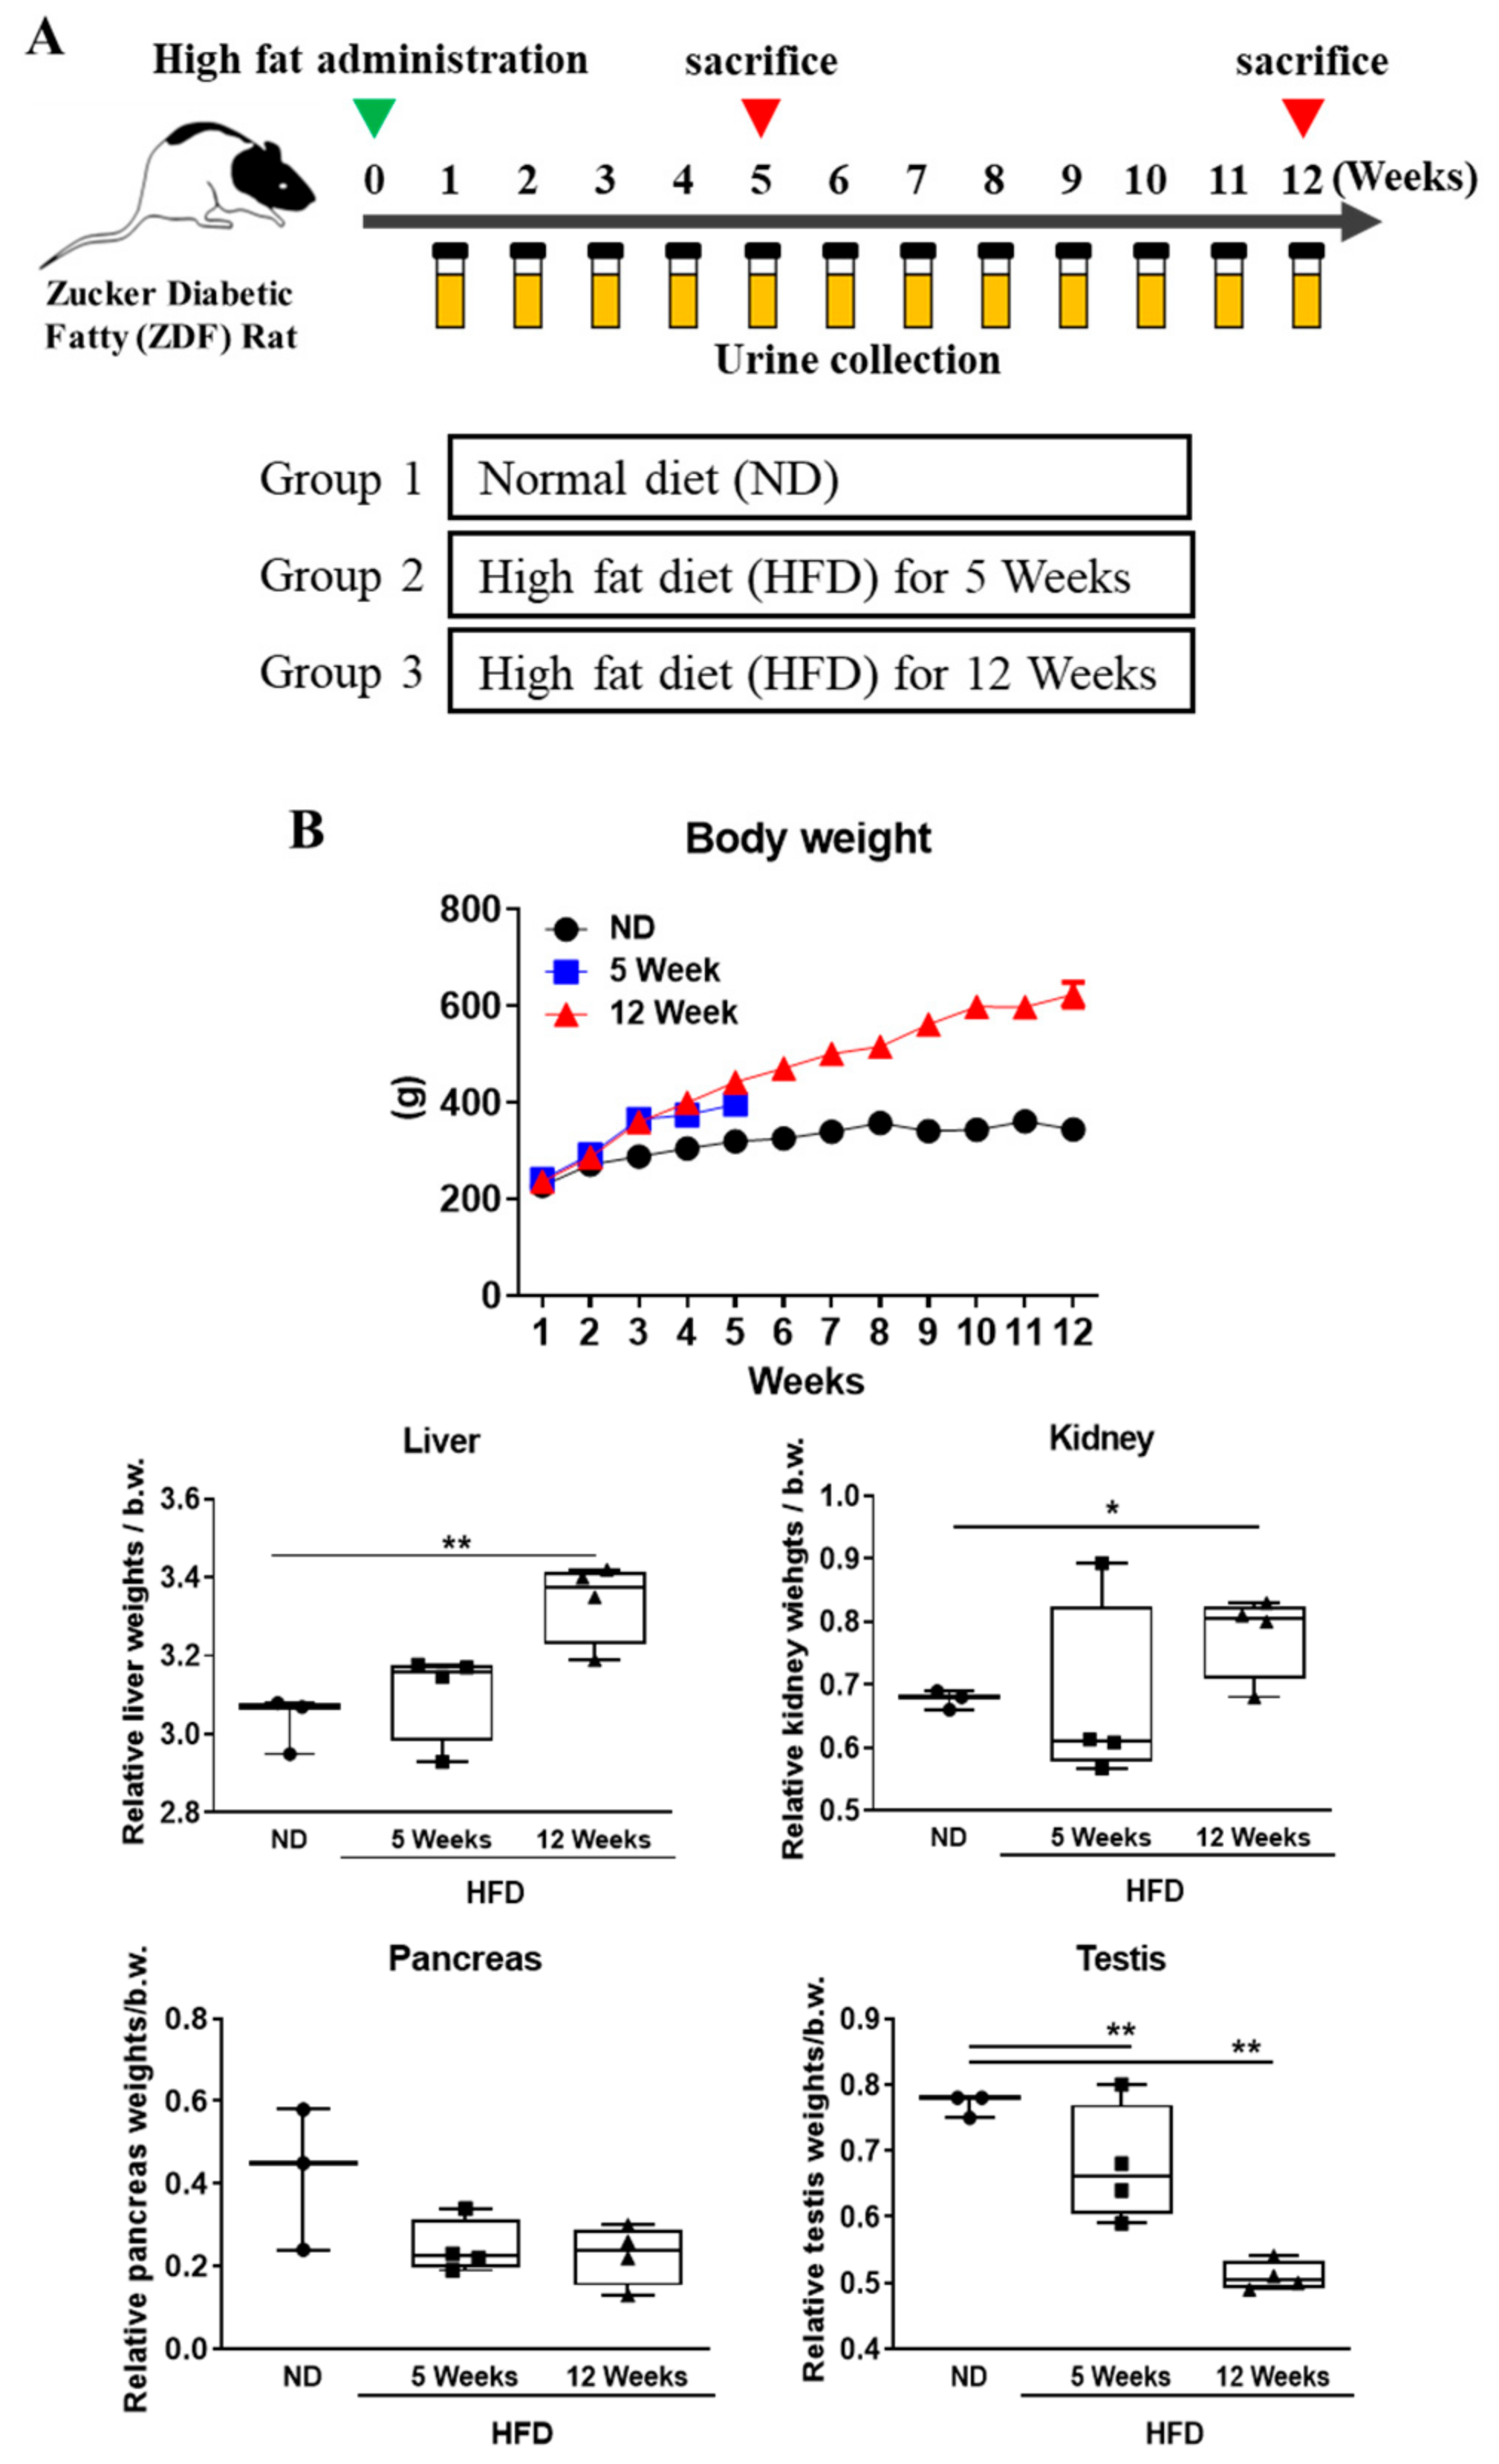
Abstract
1. Introduction
2. Materials and Methods
2.1. Chemicals and Reagents
2.2. Animal Experiments
2.3. Analysis of Serum and Urine Biochemical Parameters
2.4. Oral Glucose Tolerance Test (GTT)
2.5. Histology
2.6. Transcriptomics
2.7. Western Blot Analysis
2.8. RNA Extraction and Quantitative Real-Time PCR
2.9. Clinical Urine Sample Analysis from DN Patients
2.10. Statistical Methods
3. Results
3.1. Effects of Diabetes Progression on Body Weight and Organ Weight Change in Rats
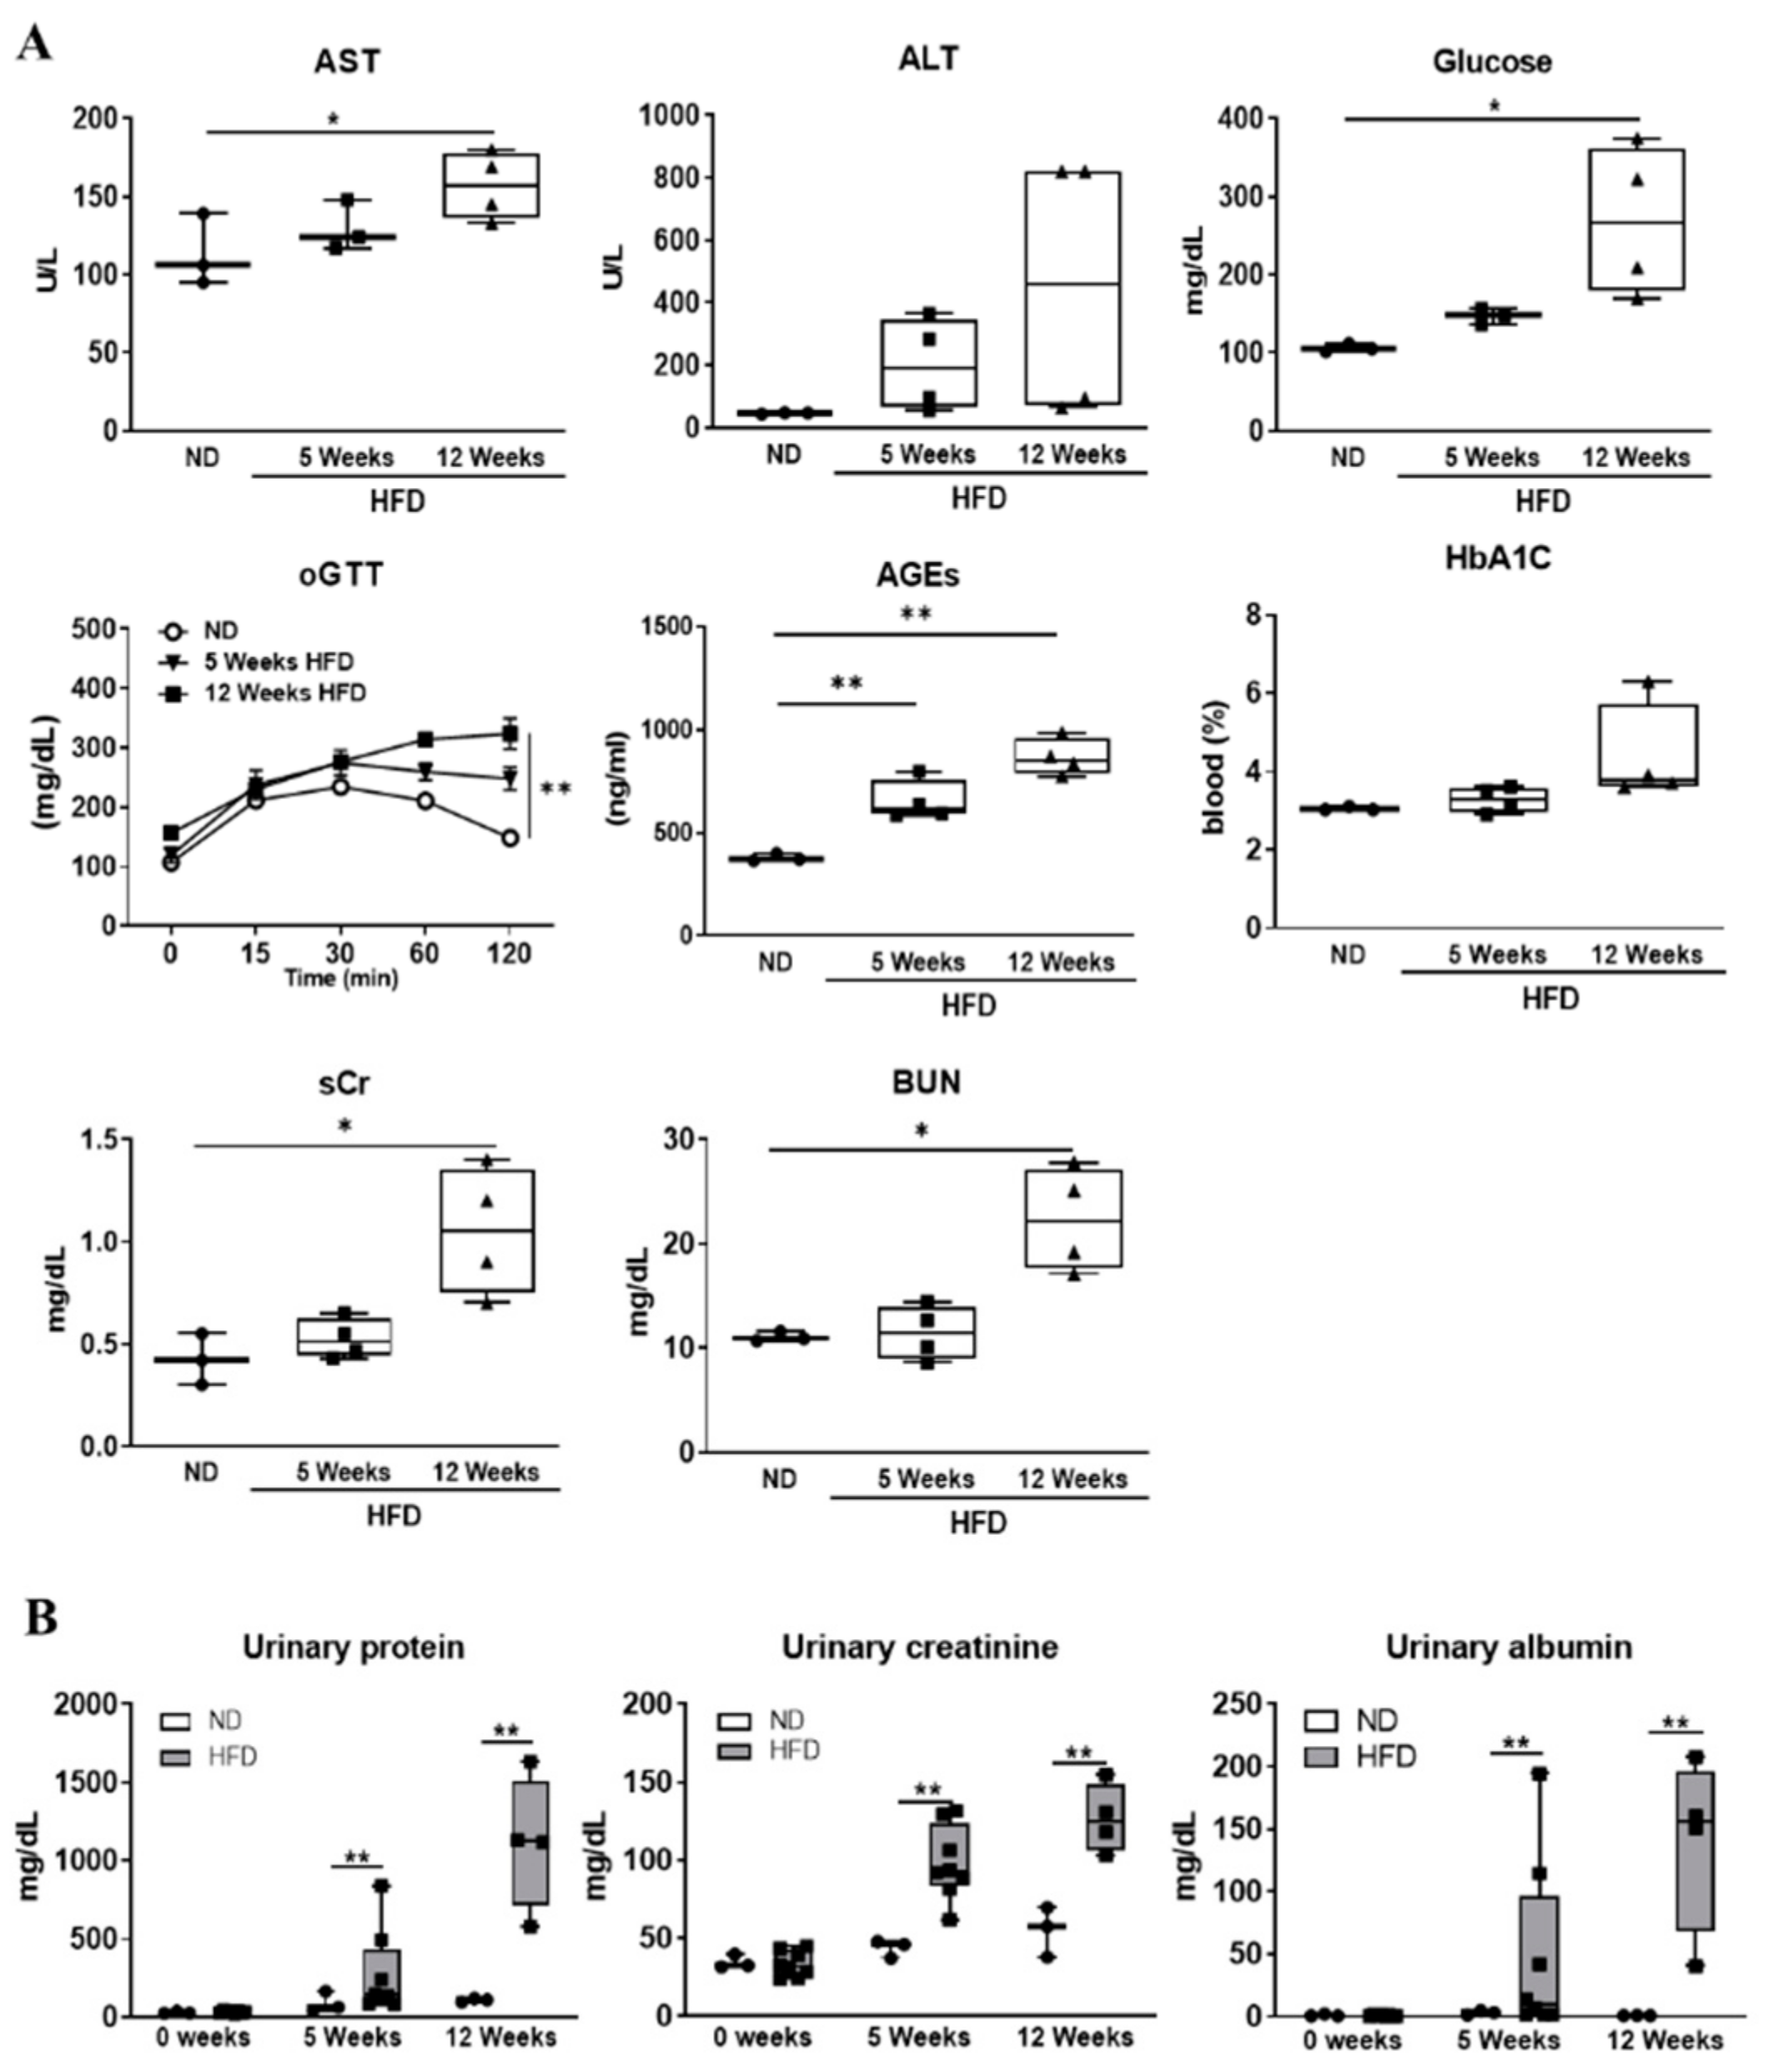
3.2. Serum and Urinary Biochemical Parameters Changes as Diabetes Progression
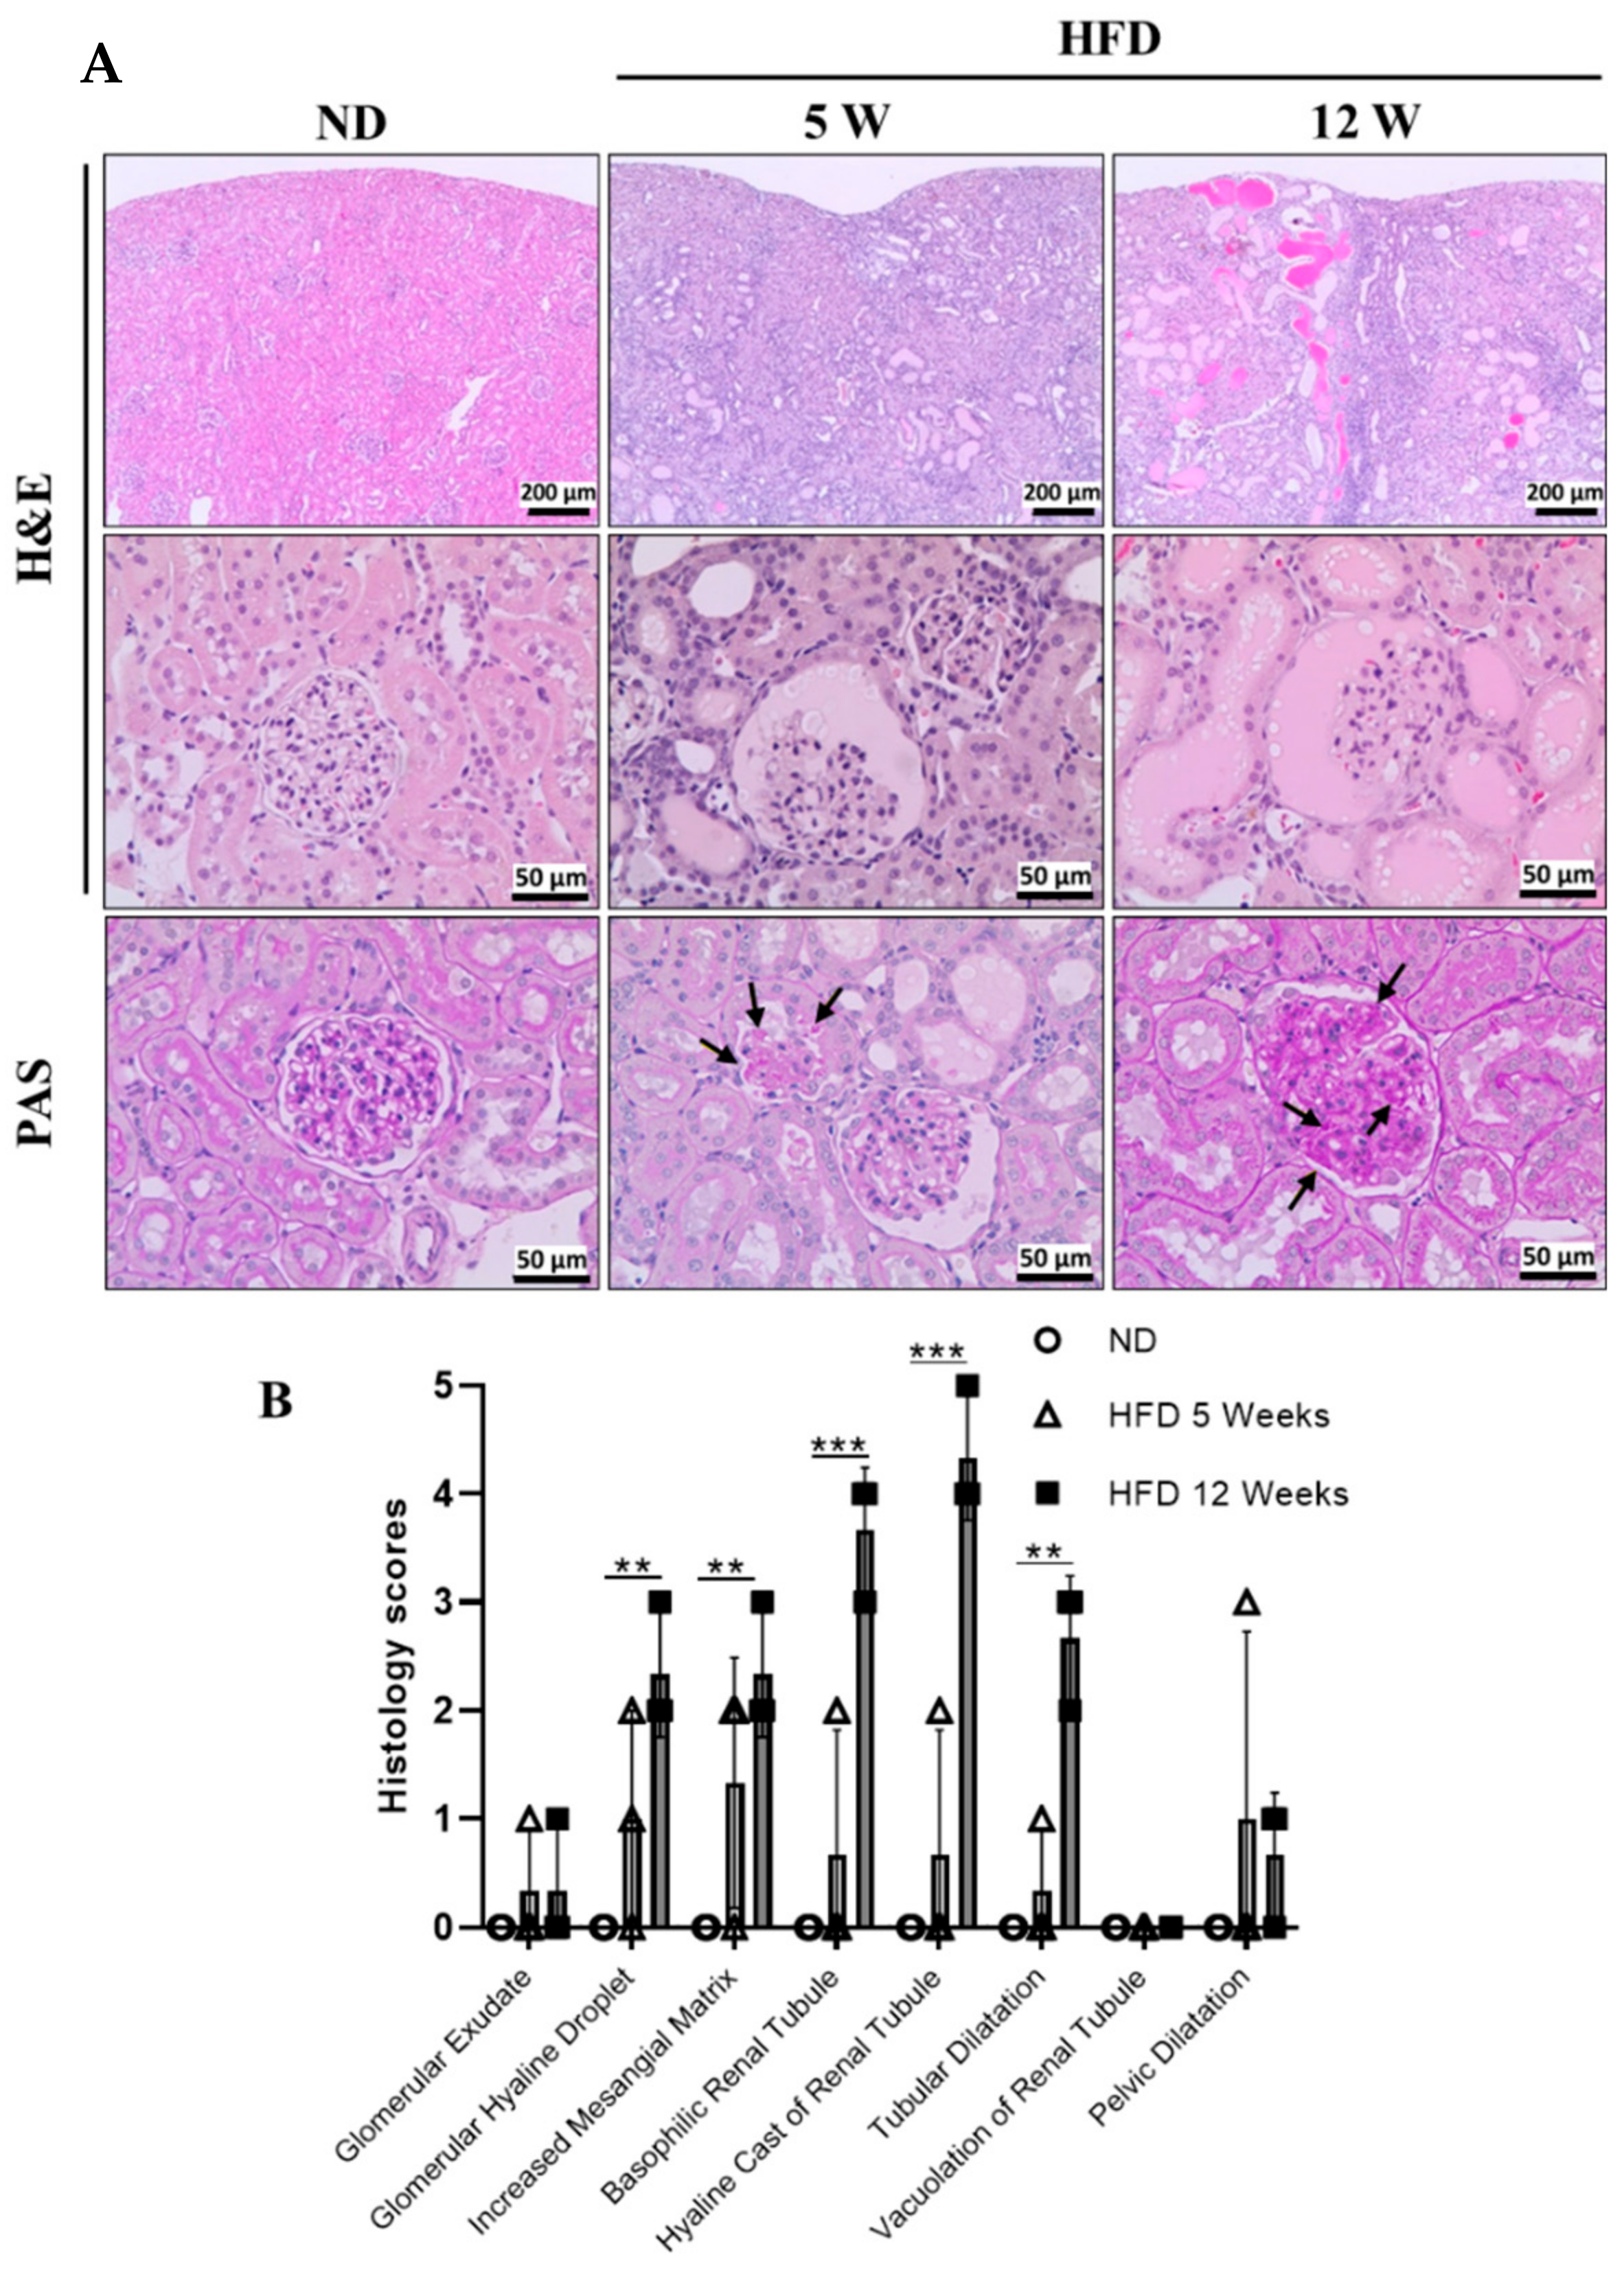
3.3. Histological Examination
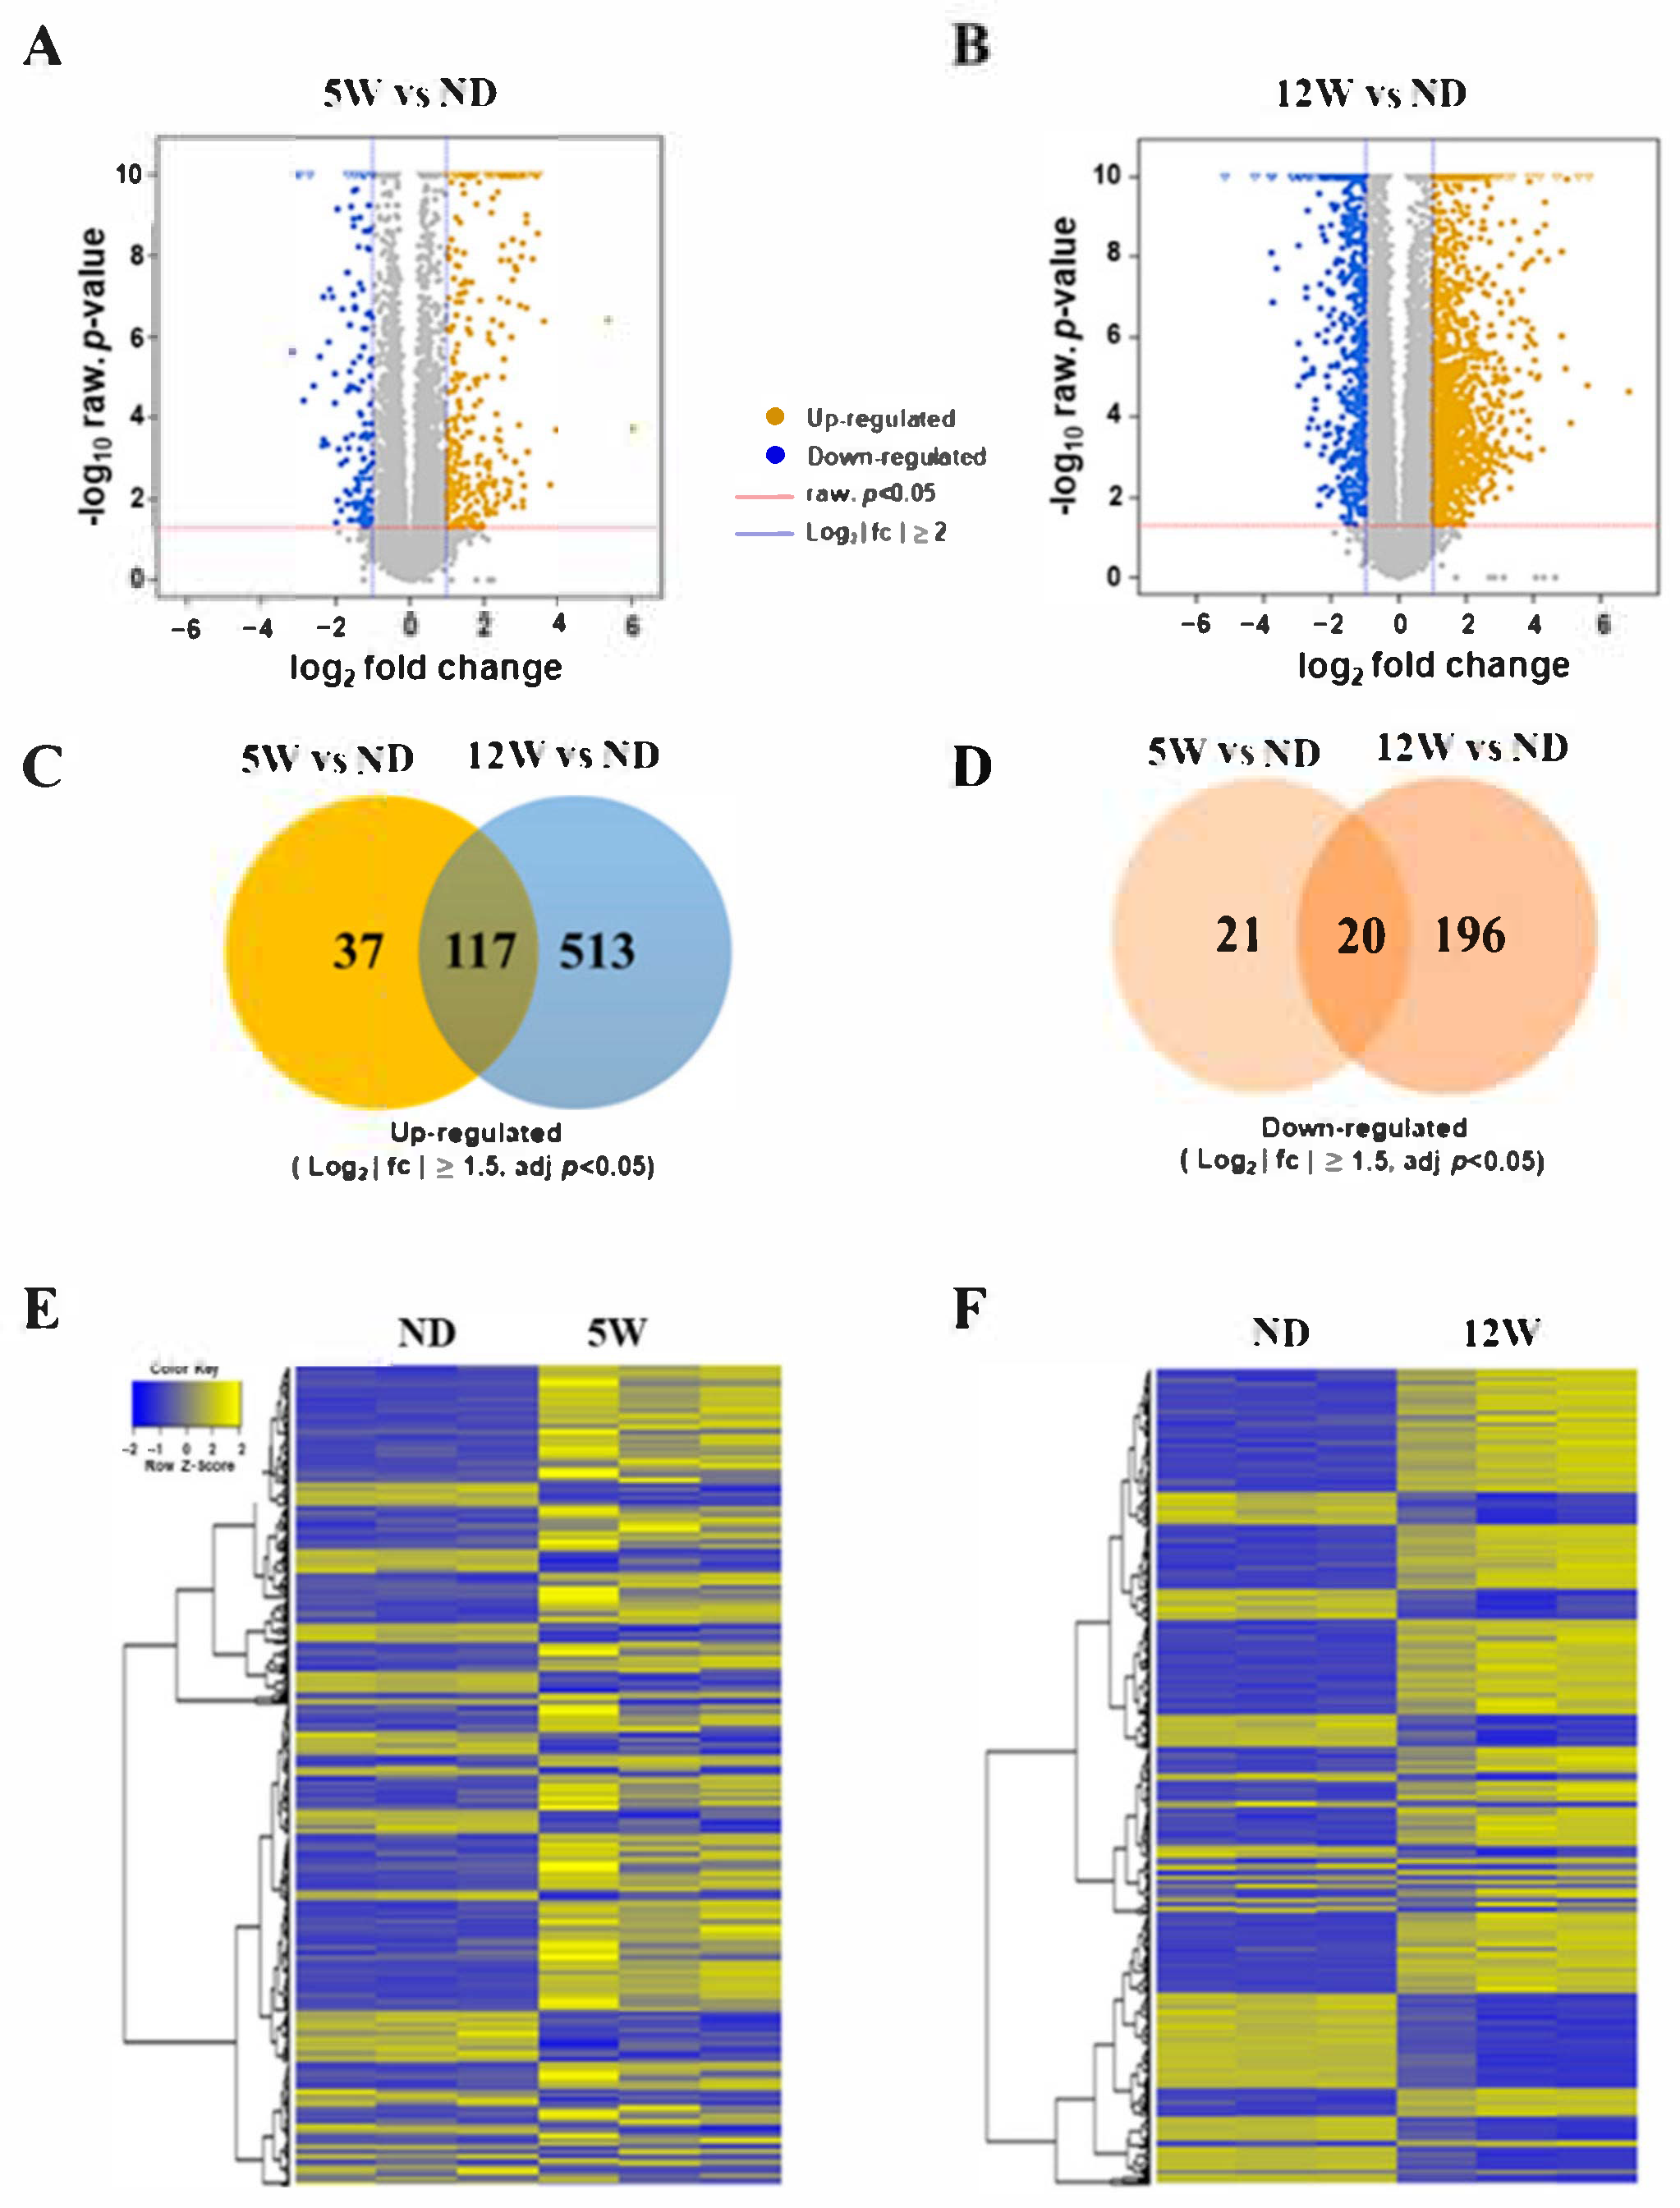
3.4. Identification of Differentially Expressed Genes during Progression of DN
3.5. The Altered mRNAs Were Enriched in Certain Biological Functions
3.6. Identification of Secreted Genes Closely Related to Progressive Kidney Injury in Diabetes Using DEGs
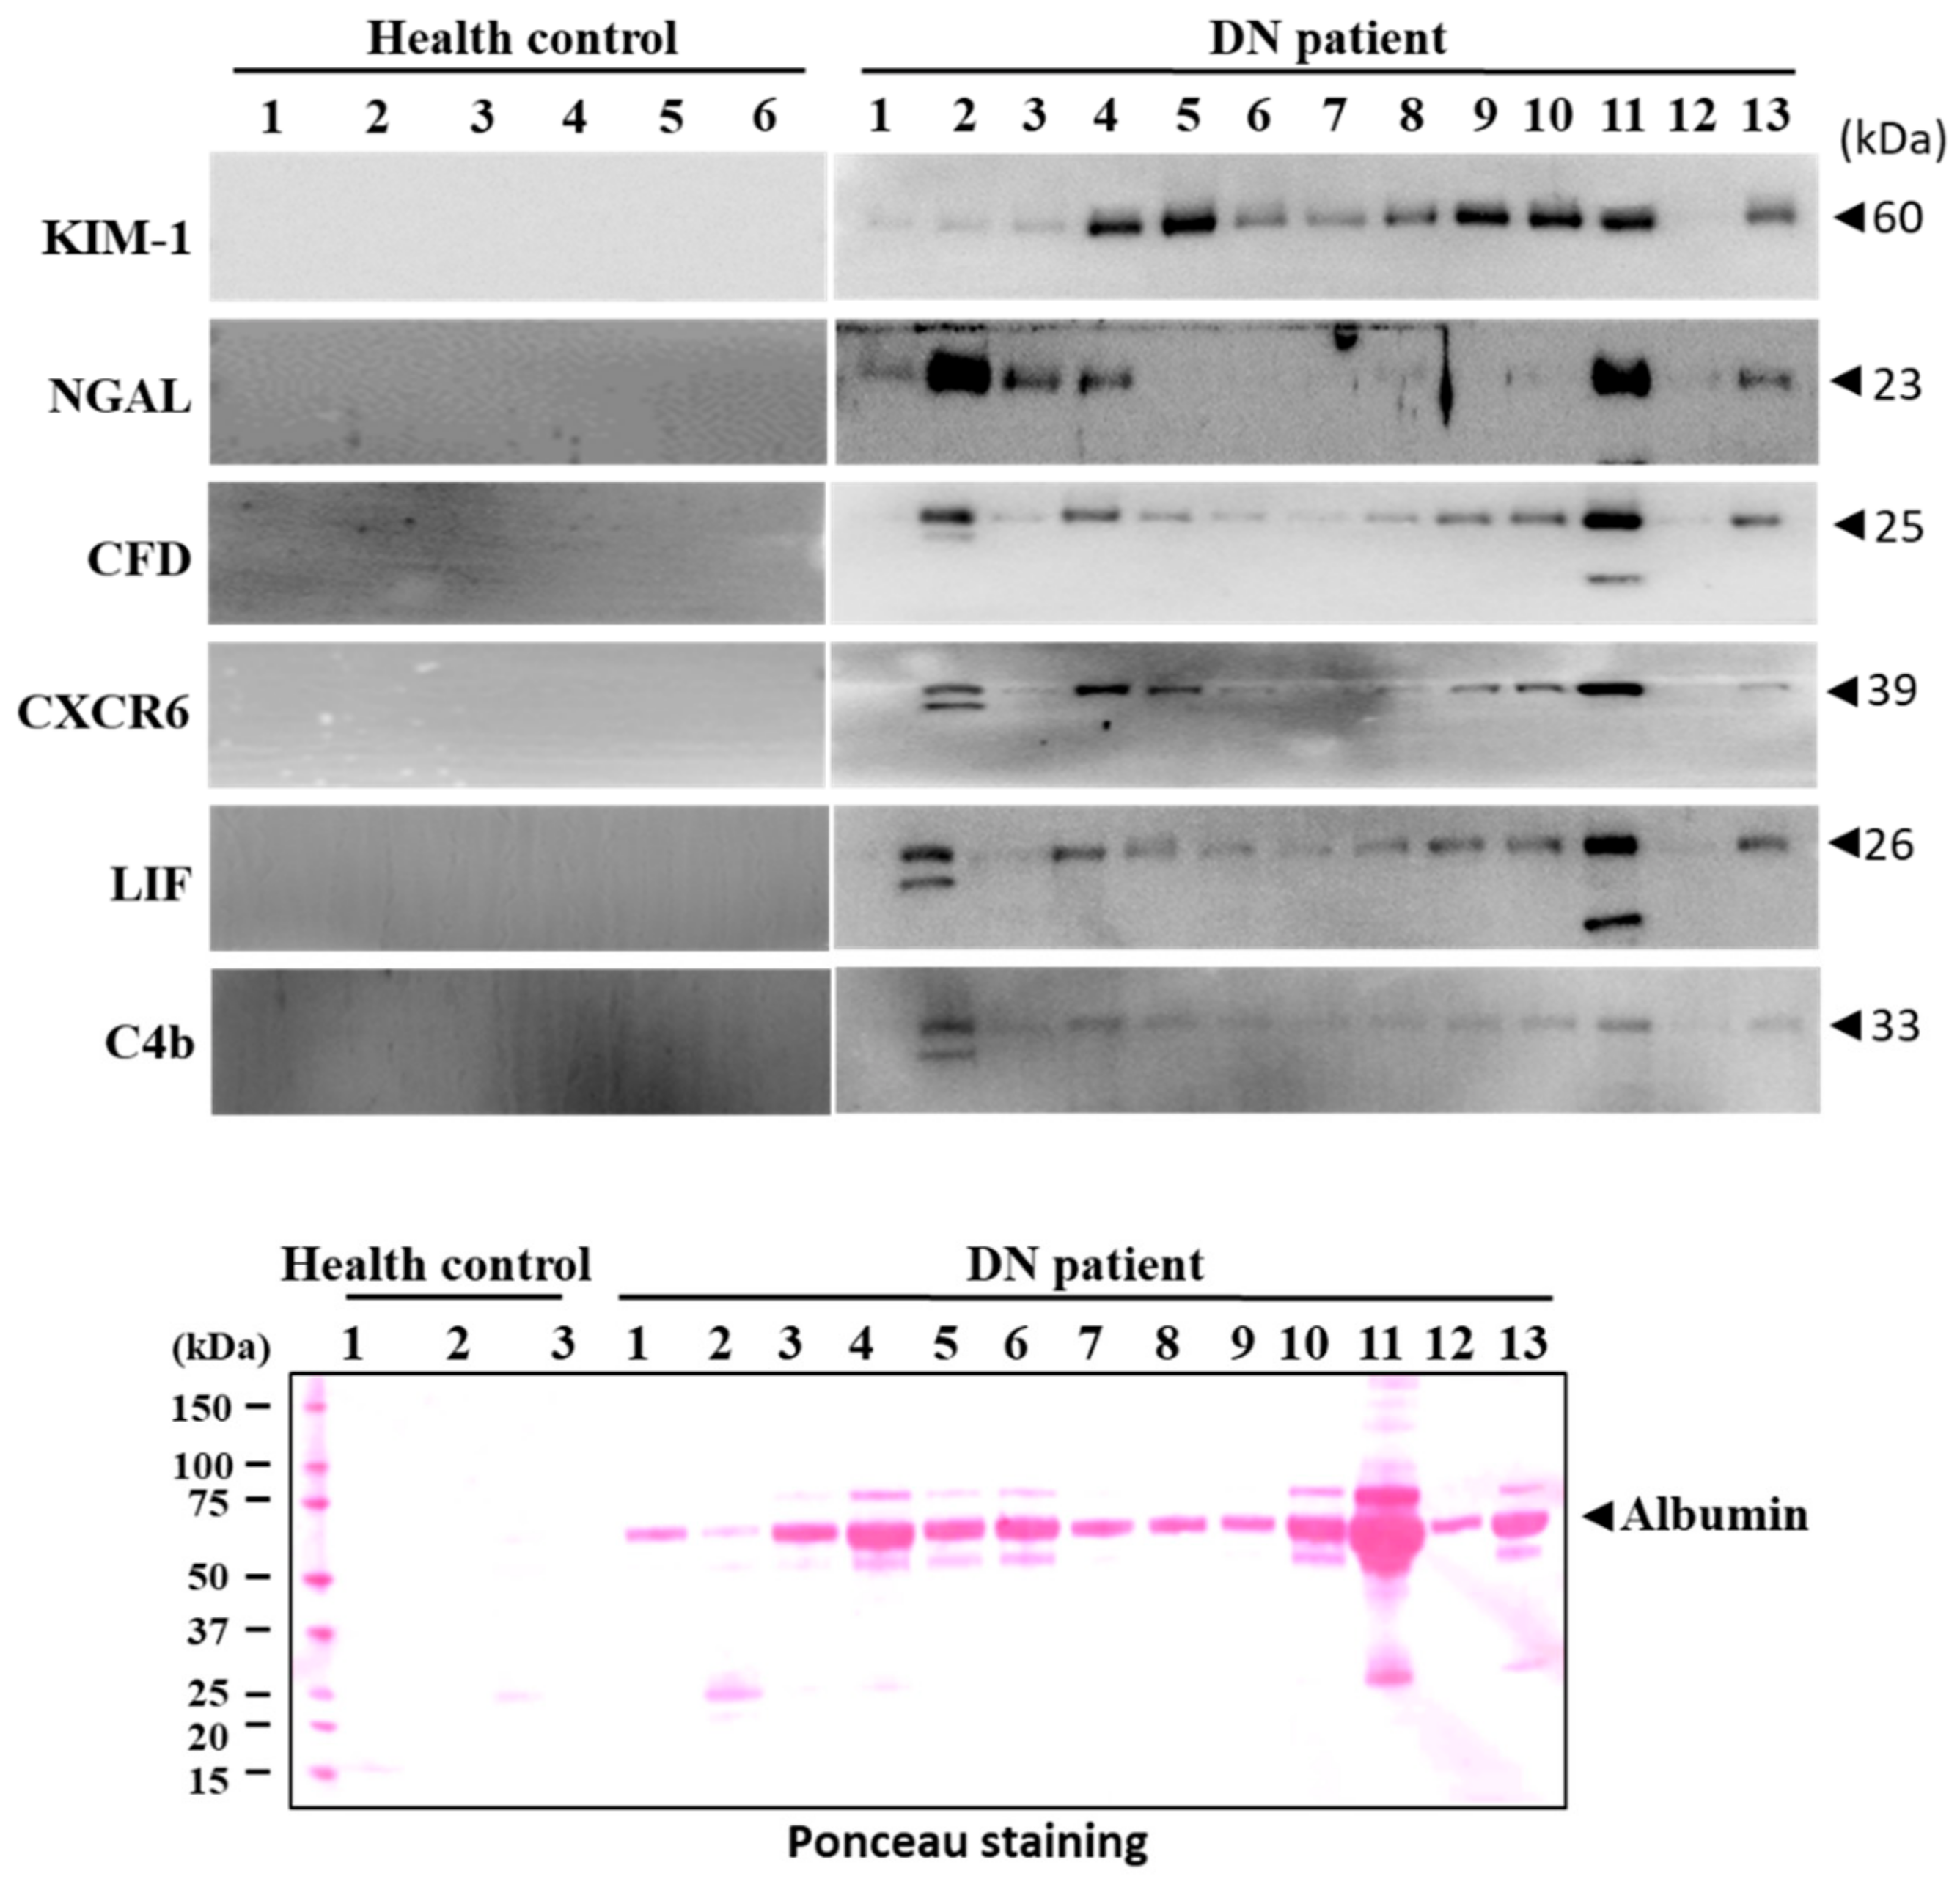
3.7. Validation of Candidate Biomarkers
4. Discussion
Supplementary Materials
Author Contributions
Funding
Institutional Review Board Statement
Informed Consent Statement
Data Availability Statement
Conflicts of Interest
References
- Wan, E.Y.F.; Fong, D.Y.T.; Fung, C.S.C.; Yu, E.Y.T.; Chin, W.Y.; Chan, A.K.C.; Lam, C.L.K. Prediction of five-year all-cause mortality in Chinese patients with type 2 diabetes mellitus—A population-based retrospective cohort study. J. Diabetes Complicat. 2017, 31, 939–944. [Google Scholar] [CrossRef] [PubMed]
- Chen, L.; Magliano, D.J.; Zimmet, P.Z. The worldwide epidemiology of type 2 diabetes mellitus—Present and future perspectives. Nat. Rev. Endocrinol. 2011, 8, 228–236. [Google Scholar] [CrossRef] [PubMed]
- Deshpande, A.D.; Harris-Hayes, M.; Schootman, M. Epidemiology of Diabetes and Diabetes-Related Complications. Phys. Ther. 2008, 88, 1254–1264. [Google Scholar] [CrossRef]
- Yuan, C.M.; Nee, R.; Ceckowski, K.A.; Knight, K.R.; Abbott, K.C. Diabetic nephropathy as the cause of end-stage kidney disease reported on the medical evidence form CMS2728 at a single center. Clin. Kidney J. 2016, 10, 257–262. [Google Scholar] [CrossRef] [PubMed]
- Rigalleau, V.; Lasseur, C.; Raffaitin, C.; Beauvieux, M.-C.; Barthe, N.; Chauveau, P.; Combe, C.; Gin, H. Normoalbuminuric Renal-Insufficient Diabetic Patients: A lower-risk group. Diabetes Care 2007, 30, 2034–2039. [Google Scholar] [CrossRef] [PubMed]
- Jain, S.; Rajput, A.; Kumar, Y.; Uppuluri, N.; Arvind, A.S.; Tatu, U. Proteomic analysis of urinary protein markers for accurate prediction of diabetic kidney disorder. J. Assoc. Physicians India 2005, 53, 513–520. [Google Scholar]
- Nishikawa, T.; Edelstein, D.; Du, X.L.; Yamagishi, S.-I.; Matsumura, T.; Kaneda, Y.; Yorek, M.A.; Beebe, D.J.; Oates, P.J.; Hammes, H.-P.; et al. Normalizing mitochondrial superoxide production blocks three pathways of hyperglycaemic damage. Nat. Cell Biol. 2000, 404, 787–790. [Google Scholar] [CrossRef] [PubMed]
- Singh, V.P.; Bali, A.; Singh, N.; Jaggi, A.S. Advanced glycation end products and diabetic complications. Korean J. Physiol. Pharmacol. 2014, 18, 1–14. [Google Scholar] [CrossRef] [PubMed]
- Lewko, B.; Stepinski, J. Hyperglycemia and mechanical stress: Targeting the renal podocyte. J. Cell. Physiol. 2009, 221, 288–295. [Google Scholar] [CrossRef] [PubMed]
- Eid, A.A.; Gorin, Y.; Fagg, B.M.; Maalouf, R.; Barnes, J.L.; Block, K.; Abboud, H.E. Mechanisms of Podocyte Injury in Diabetes: Role of Cytochrome P450 and NADPH Oxidases. Diabetes 2009, 58, 1201–1211. [Google Scholar] [CrossRef] [PubMed]
- Williams, M.E. Diabetic Nephropathy: The Proteinuria Hypothesis. Am. J. Nephrol. 2005, 25, 77–94. [Google Scholar] [CrossRef] [PubMed]
- Cao, Z.; Cooper, M.E. Pathogenesis of diabetic nephropathy. J. Diabetes Investig. 2011, 2, 243–247. [Google Scholar] [CrossRef] [PubMed]
- Park, T.S. How much glycemic control is needed to prevent progression of diabetic nephropathy? J. Diabetes Investig. 2012, 3, 411–412. [Google Scholar] [CrossRef] [PubMed]
- Williams, M.E.; Garg, R. Glycemic Management in ESRD and Earlier Stages of CKD. Am. J. Kidney Dis. 2014, 63, S22–S38. [Google Scholar] [CrossRef] [PubMed]
- Strimbu, K.; Tavel, J.A. What are biomarkers? Curr. Opin. HIV AIDS 2010, 5, 463–466. [Google Scholar] [CrossRef]
- Ransohoff, D.F. Developing Molecular Biomarkers for Cancer. Science 2003, 299, 1679–1680. [Google Scholar] [CrossRef] [PubMed]
- Riesterer, O.; Milas, L.; Ang, K.K. Use of Molecular Biomarkers for Predicting the Response to Radiotherapy with or without Chemotherapy. J. Clin. Oncol. 2007, 25, 4075–4083. [Google Scholar] [CrossRef]
- Kim, Y.S.; Maruvada, P.; Milner, J.A. Metabolomics in biomarker discovery: Future uses for cancer prevention. Futur. Oncol. 2008, 4, 93–102. [Google Scholar] [CrossRef]
- Brooks, S.A. Strategies for Analysis of the Glycosylation of Proteins: Current Status and Future Perspectives. Mol. Biotechnol. 2009, 43, 76–88. [Google Scholar] [CrossRef]
- Martens, J.W.; Margossian, A.L.; Schmitt, M.; Foekens, J.; Harbeck, N. DNA methylation as a biomarker in breast cancer. Futur. Oncol. 2009, 5, 1245–1256. [Google Scholar] [CrossRef] [PubMed]
- Ruan, K.; Fang, X.; Ouyang, G. Micro RNAs: Novel regulators in the hallmarks of human cancer. Cancer Lett. 2009, 285, 116–126. [Google Scholar] [CrossRef] [PubMed]
- Feng, S.T.; Wang, B.; Liu, B.C. Research status and prospect of novel biomarkers for diabetic kidney disease. Zhonghua Yi Xue Za Zhi 2021, 101, 691–694. [Google Scholar]
- Barutta, F.; Bellini, S.; Canepa, S.; Durazzo, M.; Gruden, G. Novel biomarkers of diabetic kidney disease: Current status and potential clinical application. Acta Diabetol. 2021, 1–12. [Google Scholar] [CrossRef]
- Lee, Y.K.; Park, E.Y.; Kim, S.; Son, J.Y.; Kim, T.H.; Kang, W.G.; Jeong, T.C.; Kim, K.-B.; Kwack, S.J.; Lee, J.; et al. Evaluation of Cadmium-Induced Nephrotoxicity Using Urinary Metabolomic Profiles in Sprague-Dawley Male Rats. J. Toxicol. Environ. Health Part A 2014, 77, 1384–1398. [Google Scholar] [CrossRef] [PubMed]
- Long, L.; Qiu, H.; Cai, B.; Chen, N.; Lu, X.; Zheng, S.; Ye, X.; Li, Y. Hyperglycemia induced testicular damage in type 2 diabetes mellitus rats exhibiting microcirculation impairments associated with vascular endothelial growth factor decreased via PI3K/Akt pathway. Oncotarget 2018, 9, 5321–5336. [Google Scholar] [CrossRef] [PubMed]
- Al-Mrabeh, A.; Hollingsworth, K.G.; Steven, S.; Taylor, R. Morphology of the pancreas in type 2 diabetes: Effect of weight loss with or without normalisation of insulin secretory capacity. Diabetologia 2016, 59, 1753–1759. [Google Scholar] [CrossRef] [PubMed]
- Chen, L.; Chu, C.; Lu, J.; Kong, X.; Huang, T.; Cai, Y.-D. Gene Ontology and KEGG Pathway Enrichment Analysis of a Drug Target-Based Classification System. PLoS ONE 2015, 10, e0126492. [Google Scholar] [CrossRef] [PubMed]
- Schrijvers, B.F.; De Vriese, A.S.; Flyvbjerg, A. From Hyperglycemia to Diabetic Kidney Disease: The Role of Metabolic, Hemodynamic, Intracellular Factors and Growth Factors/Cytokines. Endocr. Rev. 2004, 25, 971–1010. [Google Scholar] [CrossRef] [PubMed]
- Assogba, F.G.A.; Couchoud, C.; Hannedouche, T.; Villar, E.; Frimat, L.; Fagot-Campagna, A.; Jacquelinet, C.; Stengel, B. Trends in the epidemiology and care of diabetes mellitus-related end-stage renal disease in France, 2007–2011. Diabetologia 2014, 57, 718–728. [Google Scholar] [CrossRef] [PubMed]
- Van Dijk, P.R.; Kramer, A.; Logtenberg, S.J.J.; Hoitsma, A.J.; Kleefstra, N.; Jager, K.J.; Bilo, H.J.G. Incidence of renal replacement therapy for diabetic nephropathy in the Netherlands: Dutch diabetes estimates (DUDE)-3. BMJ Open 2015, 5, e005624. [Google Scholar] [CrossRef]
- Berger, S.P.; Roos, A.; Daha, M.R. Complement and the kidney: What the nephrologist needs to know in 2006? Nephrol. Dial. Transplant. 2005, 20, 2613–2619. [Google Scholar] [CrossRef][Green Version]
- Ferguson, M.A.; Vaidya, V.S.; Bonventre, J.V. Biomarkers of nephrotoxic acute kidney injury. Toxicology 2008, 245, 182–193. [Google Scholar] [CrossRef] [PubMed]
- Marso, S.P.; Daniels, G.H.; Brown-Frandsen, K.; Kristensen, P.; Mann, J.F.; Nauck, M.A.; Nissen, S.E.; Pocock, S.; Poulter, N.R.; Ravn, L.S.; et al. Liraglutide and Cardiovascular Outcomes in Type 2 Diabetes. N. Engl. J. Med. 2016, 375, 311–322. [Google Scholar] [CrossRef] [PubMed]
- Marso, S.P.; Bain, S.C.; Consoli, A.; Eliaschewitz, F.G.; Jódar, E.; Leiter, L.A.; Lingvay, I.; Rosenstock, J.; Seufert, J.; Warren, M.L.; et al. Semaglutide and Cardiovascular Outcomes in Patients with Type 2 Diabetes. N. Engl. J. Med. 2016, 375, 1834–1844. [Google Scholar] [CrossRef] [PubMed]
- Ghaderian, S.B.; Hayati, F.; Shayanpour, S.; Mousavi, S.S.B. Diabetes and end-stage renal disease: A review article on new concepts. J. Ren. Inj. Prev. 2015, 4, 28–33. [Google Scholar] [PubMed]
- Dunkelberger, J.R.; Song, W.-C. Complement and its role in innate and adaptive immune responses. Cell Res. 2010, 20, 34–50. [Google Scholar] [CrossRef]
- De Vriese, A.S.; Sethi, S.; Van Praet, J.; Nath, K.A.; Fervenza, F.C. Kidney Disease Caused by Dysregulation of the Complement Alternative Pathway: An Etiologic Approach. J. Am. Soc. Nephrol. 2015, 26, 2917–2929. [Google Scholar] [CrossRef] [PubMed]
- Cook, H.T. Complement and kidney disease. Curr. Opin. Nephrol. Hypertens. 2013, 22, 295–301. [Google Scholar] [CrossRef]
- Flyvbjerg, A. The role of the complement system in diabetic nephropathy. Nat. Rev. Nephrol. 2017, 13, 311–318. [Google Scholar] [CrossRef] [PubMed]
- Acosta, J.; Hettinga, J.; Fluckiger, R.; Krumrei, N.; Goldfine, A.; Angarita, L.; Halperin, J. Molecular basis for a link between complement and the vascular complications of diabetes. Proc. Nat. Acad. Sci. USA 2000, 97, 5450–5455. [Google Scholar] [CrossRef] [PubMed]
- Qin, X.; Goldfine, A.; Krumrei, N.; Grubissich, L.; Acosta, J.; Chorev, M.; Hays, A.P.; Halperin, J.A. Glycation Inactivation of the Complement Regulatory Protein CD59: A Possible Role in the Pathogenesis of the Vascular Complications of Human Diabetes. Diabetes 2004, 53, 2653–2661. [Google Scholar] [CrossRef] [PubMed]
- Inagi, R.; Miyata, T.; Oda, O.; Maeda, K.; Inoue, K. Evaluation of the Proteolytic Activity of Factor D Accumulated as an Active Serine Protease in Patients with Chronic Renal Failure. Nephron 1994, 66, 285–290. [Google Scholar] [CrossRef] [PubMed]
- Miyata, T.; Oda, O.; Inagi, R.; Sugiyama, S.; Miyama, A.; Maeda, K.; Nakashima, I.; Yamanaka, N.; Mlyama, A. Molecular and functional identification and purification of complement component factor D from urine of patients with chronic renal failure. Mol. Immunol. 1990, 27, 637–644. [Google Scholar] [CrossRef]
- Volanakis, J.E.; Barnum, S.R.; Giddens, M.; Galla, J.H. Renal Filtration and Catabolism of Complement Protein D. N. Engl. J. Med. 1985, 312, 395–399. [Google Scholar] [CrossRef] [PubMed]
- Pascual, M.; Steiger, G.; Estreicher, J.; Macon, K.; Volanakis, J.E.; Schifferli, J.A. Metabolism of complement factor D in renal failure. Kidney Int. 1988, 34, 529–536. [Google Scholar] [CrossRef] [PubMed]
- Peng, B.; Zhang, L.; Yan, J.; Qi, H.; Zhang, W.; Fan, L.; Hu, Y.; Lin, L.; Li, X.; Hu, R.; et al. Assessment of the diagnostic value of a urinary adipsin rapid strip test for pre-eclampsia: A prospective multicenter study. J. Obstet. Gynaecol. Res. 2016, 43, 30–33. [Google Scholar] [CrossRef] [PubMed][Green Version]
- Wang, T.; Zhou, R.; Gao, L.; Wang, Y.; Song, C.; Gong, Y.; Jia, J.; Xiong, W.; Dai, L.; Zhang, L.; et al. Elevation of Urinary Adipsin in Preeclampsia. Hypertension 2014, 64, 846–851. [Google Scholar] [CrossRef] [PubMed]
- Navarro-González, J.F.; Mora-Fernández, C. The Role of Inflammatory Cytokines in Diabetic Nephropathy. J. Am. Soc. Nephrol. 2008, 19, 433–442. [Google Scholar] [CrossRef]
- Lopez-Parra, V.; Mallavia, B.; Egido, J.; Gomez-Guerrero, J.E.A.C. Immunoinflammation in Diabetic Nephropathy: Molecular Mechanisms and Therapeutic Options; IntechOpen Limited: London, UK, 2012; pp. 127–146. ISBN 978-953-51-0543-5. [Google Scholar]
- Lei, L.; Mao, Y.; Meng, D.; Zhang, X.; Cui, L.; Huo, Y.; Wang, Y. Percentage of Circulating CD8+ T Lymphocytes is Associated with Albuminuria in Type 2 Diabetes Mellitus. Exp. Clin. Endocrinol. Diabetes 2013, 122, 27–30. [Google Scholar] [CrossRef] [PubMed]
- El Mesallamy, H.O.; Ahmed, H.H.; Bassyouni, A.A.; Ahmed, A.S. Clinical significance of inflammatory and fibrogenic cytokines in diabetic nephropathy. Clin. Biochem. 2012, 45, 646–650. [Google Scholar] [CrossRef]
- Chen, S.; Bacon, K.B.; Li, L.; Garcia, G.E.; Xia, Y.; Lo, D.; Thompson, D.A.; Siani, M.A.; Yamamoto, T.; Harrison, J.K.; et al. In Vivo Inhibition of CC and CX3C Chemokine–induced Leukocyte Infiltration and Attenuation of Glomerulonephritis in Wistar-Kyoto (WKY) Rats by vMIP-II. J. Exp. Med. 1998, 188, 193–198. [Google Scholar] [CrossRef]
- Christopherson, K.; Hromas, R. Chemokine Regulation of Normal and Pathologic Immune Responses. Stem Cells 2001, 19, 388–396. [Google Scholar] [CrossRef] [PubMed]
- Feng, L.; Chen, S.; Garcia, G.E.; Xia, Y.; Siani, M.A.; Botti, P.; Wilson, C.B.; Harrison, J.K.; Bacon, K.B. Prevention of crescentic glomerulonephritis by immunoneutralization of the fractalkine receptor CX3CR1: Rapid Communication. Kidney Int. 1999, 56, 612–620. [Google Scholar] [CrossRef]
- Wenzel, U.O.; Abboud, H.E. Chemokines and renal disease. Am. J. Kidney Dis. 1995, 26, 982–994. [Google Scholar] [CrossRef]
- Abel, S.; Hundhausen, C.; Mentlein, R.; Schulte, A.; Berkhout, T.A.; Broadway, N.; Hartmann, D.; Sedlacek, R.; Dietrich, S.; Muetze, B.; et al. The Transmembrane CXC-Chemokine Ligand 16 Is Induced by IFN-γ and TNF-α and Shed by the Activity of the Disintegrin-Like Metalloproteinase ADAM10. J. Immunol. 2004, 172, 6362–6372. [Google Scholar] [CrossRef] [PubMed]
- Wilbanks, A.; Zondlo, S.C.; Murphy, K.; Mak, S.; Soler, D.; Langdon, P.; Andrew, D.P.; Wu, L.; Briskin, M. Expression Cloning of the STRL33/BONZO/TYMSTR Ligand Reveals Elements of CC, CXC, and CX3C Chemokines. J. Immunol. 2001, 166, 5145–5154. [Google Scholar] [CrossRef] [PubMed]
- Matloubian, M.; David, A.; Engel, S.; Ryan, J.E.; Cyster, J.G. A transmembrane CXC chemokine is a ligand for HIV-coreceptor Bonzo. Nat. Immunol. 2000, 1, 298–304. [Google Scholar] [CrossRef] [PubMed]
- Chandrasekar, B.; Bysani, S.; Mummidi, S. CXCL16 Signals via Gi, Phosphatidylinositol 3-Kinase, Akt, IκB Kinase, and Nuclear Factor-κB and Induces Cell-Cell Adhesion and Aortic Smooth Muscle Cell Proliferation. J. Biol. Chem. 2004, 279, 3188–3196. [Google Scholar] [CrossRef] [PubMed]
- Geissmann, F.; Cameron, T.O.; Sidobre, S.; Manlongat, N.; Kronenberg, M.; Briskin, M.J.; Dustin, M.L.; Littman, D.R. Intravascular Immune Surveillance by CXCR6+ NKT Cells Patrolling Liver Sinusoids. PLoS Biol. 2005, 3, e113. [Google Scholar] [CrossRef]
- Hofnagel, O.; Luechtenborg, B.; Plenz, G.; Robenek, H. Expression of the novel scavenger receptor SR-PSOX in cultured aortic smooth muscle cells and umbilical endothelial cells. Arter. Thromb. Vasc. Biol. 2002, 22, 710–711. [Google Scholar] [CrossRef] [PubMed]
- Liao, F.; Alkhatib, G.; Peden, K.W.; Sharma, G.; Berger, E.A.; Farber, J.M. STRL33, A Novel Chemokine Receptor–like Protein, Functions as a Fusion Cofactor for Both Macrophage-tropic and T Cell Line–tropic HIV-1. J. Exp. Med. 1997, 185, 2015–2023. [Google Scholar] [CrossRef] [PubMed]
- Sato, T.; Thorlacius, H.; Johnston, B.; Staton, T.L.; Xiang, W.; Littman, D.R.; Butcher, E.C. Role for CXCR6 in Recruitment of Activated CD8+ Lymphocytes to Inflamed Liver. J. Immunol. 2004, 174, 277–283. [Google Scholar] [CrossRef] [PubMed]
- Sharron, M.; Pöhlmann, S.; Price, K.; Lolis, E.; Tsang, M.; Kirchhoff, F.; Doms, R.W.; Lee, B. Expression and coreceptor activity of STRL33/Bonzo on primary peripheral blood lymphocytes. Blood 2000, 96, 41–49. [Google Scholar] [CrossRef] [PubMed]
- Shashkin, P.; Simpson, D.; Mishin, V.; Chesnutt, B.; Ley, K. Expression of CXCL16 in human T cells. Arter. Thromb. Vasc. Biol. 2003, 23, 148–149. [Google Scholar] [CrossRef] [PubMed][Green Version]
- Hu, Z.-B.; Ma, K.-L.; Zhang, Y.; Wang, G.-H.; Liu, L.; Lu, J.; Chen, P.-P.; Lu, C.-C.; Liu, B.-C. Inflammation-activated CXCL16 pathway contributes to tubulointerstitial injury in mouse diabetic nephropathy. Acta Pharmacol. Sin. 2018, 39, 1022–1033. [Google Scholar] [CrossRef]
- Xia, Y.; Yan, J.; Jin, X.; Entman, M.L.; Wang, Y. The chemokine receptor CXCR6 contributes to recruitment of bone marrow-derived fibroblast precursors in renal fibrosis. Kidney Int. 2014, 86, 327–337. [Google Scholar] [CrossRef] [PubMed]
- Plisov, S.Y.; Yoshino, K.; Dove, L.F.; Higinbotham, K.G.; Rubin, J.S.; Perantoni, A.O. TGF beta 2, LIF and FGF2 cooperate to induce nephrogenesis. Development 2001, 128, 1045–1057. [Google Scholar]
- Xu, J.; Li, Z.; Xu, P.; Yang, Z. Protective effects of leukemia inhibitory factor against oxidative stress during high glucose-induced apoptosis in podocytes. Cell Stress Chaperon 2012, 17, 485–493. [Google Scholar] [CrossRef]
- Yoshino, J.; Monkawa, T.; Tsuji, M.; Hayashi, M.; Saruta, T. Leukemia Inhibitory Factor Is Involved in Tubular Regeneration after Experimental Acute Renal Failure. J. Am. Soc. Nephrol. 2003, 14, 3090–3101. [Google Scholar] [CrossRef] [PubMed]


Publisher’s Note: MDPI stays neutral with regard to jurisdictional claims in published maps and institutional affiliations. |
© 2021 by the authors. Licensee MDPI, Basel, Switzerland. This article is an open access article distributed under the terms and conditions of the Creative Commons Attribution (CC BY) license (https://creativecommons.org/licenses/by/4.0/).
Share and Cite
Kim, K.-S.; Lee, J.-S.; Park, J.-H.; Lee, E.-Y.; Moon, J.-S.; Lee, S.-K.; Lee, J.-S.; Kim, J.-H.; Kim, H.-S. Identification of Novel Biomarker for Early Detection of Diabetic Nephropathy. Biomedicines 2021, 9, 457. https://doi.org/10.3390/biomedicines9050457
Kim K-S, Lee J-S, Park J-H, Lee E-Y, Moon J-S, Lee S-K, Lee J-S, Kim J-H, Kim H-S. Identification of Novel Biomarker for Early Detection of Diabetic Nephropathy. Biomedicines. 2021; 9(5):457. https://doi.org/10.3390/biomedicines9050457
Chicago/Turabian StyleKim, Kyeong-Seok, Jin-Sol Lee, Jae-Hyeon Park, Eun-Young Lee, Jong-Seok Moon, Sang-Kyu Lee, Jong-Sil Lee, Jung-Hwan Kim, and Hyung-Sik Kim. 2021. "Identification of Novel Biomarker for Early Detection of Diabetic Nephropathy" Biomedicines 9, no. 5: 457. https://doi.org/10.3390/biomedicines9050457
APA StyleKim, K.-S., Lee, J.-S., Park, J.-H., Lee, E.-Y., Moon, J.-S., Lee, S.-K., Lee, J.-S., Kim, J.-H., & Kim, H.-S. (2021). Identification of Novel Biomarker for Early Detection of Diabetic Nephropathy. Biomedicines, 9(5), 457. https://doi.org/10.3390/biomedicines9050457