
Probing Skin Barrier Recovery on Molecular Level Following Acute Wounds: An In Vivo/Ex Vivo Study on Pigs

 , , , and
Abstract
1. Introduction
2. Materials and Methods
2.1. Materials
2.2. In Vivo Study
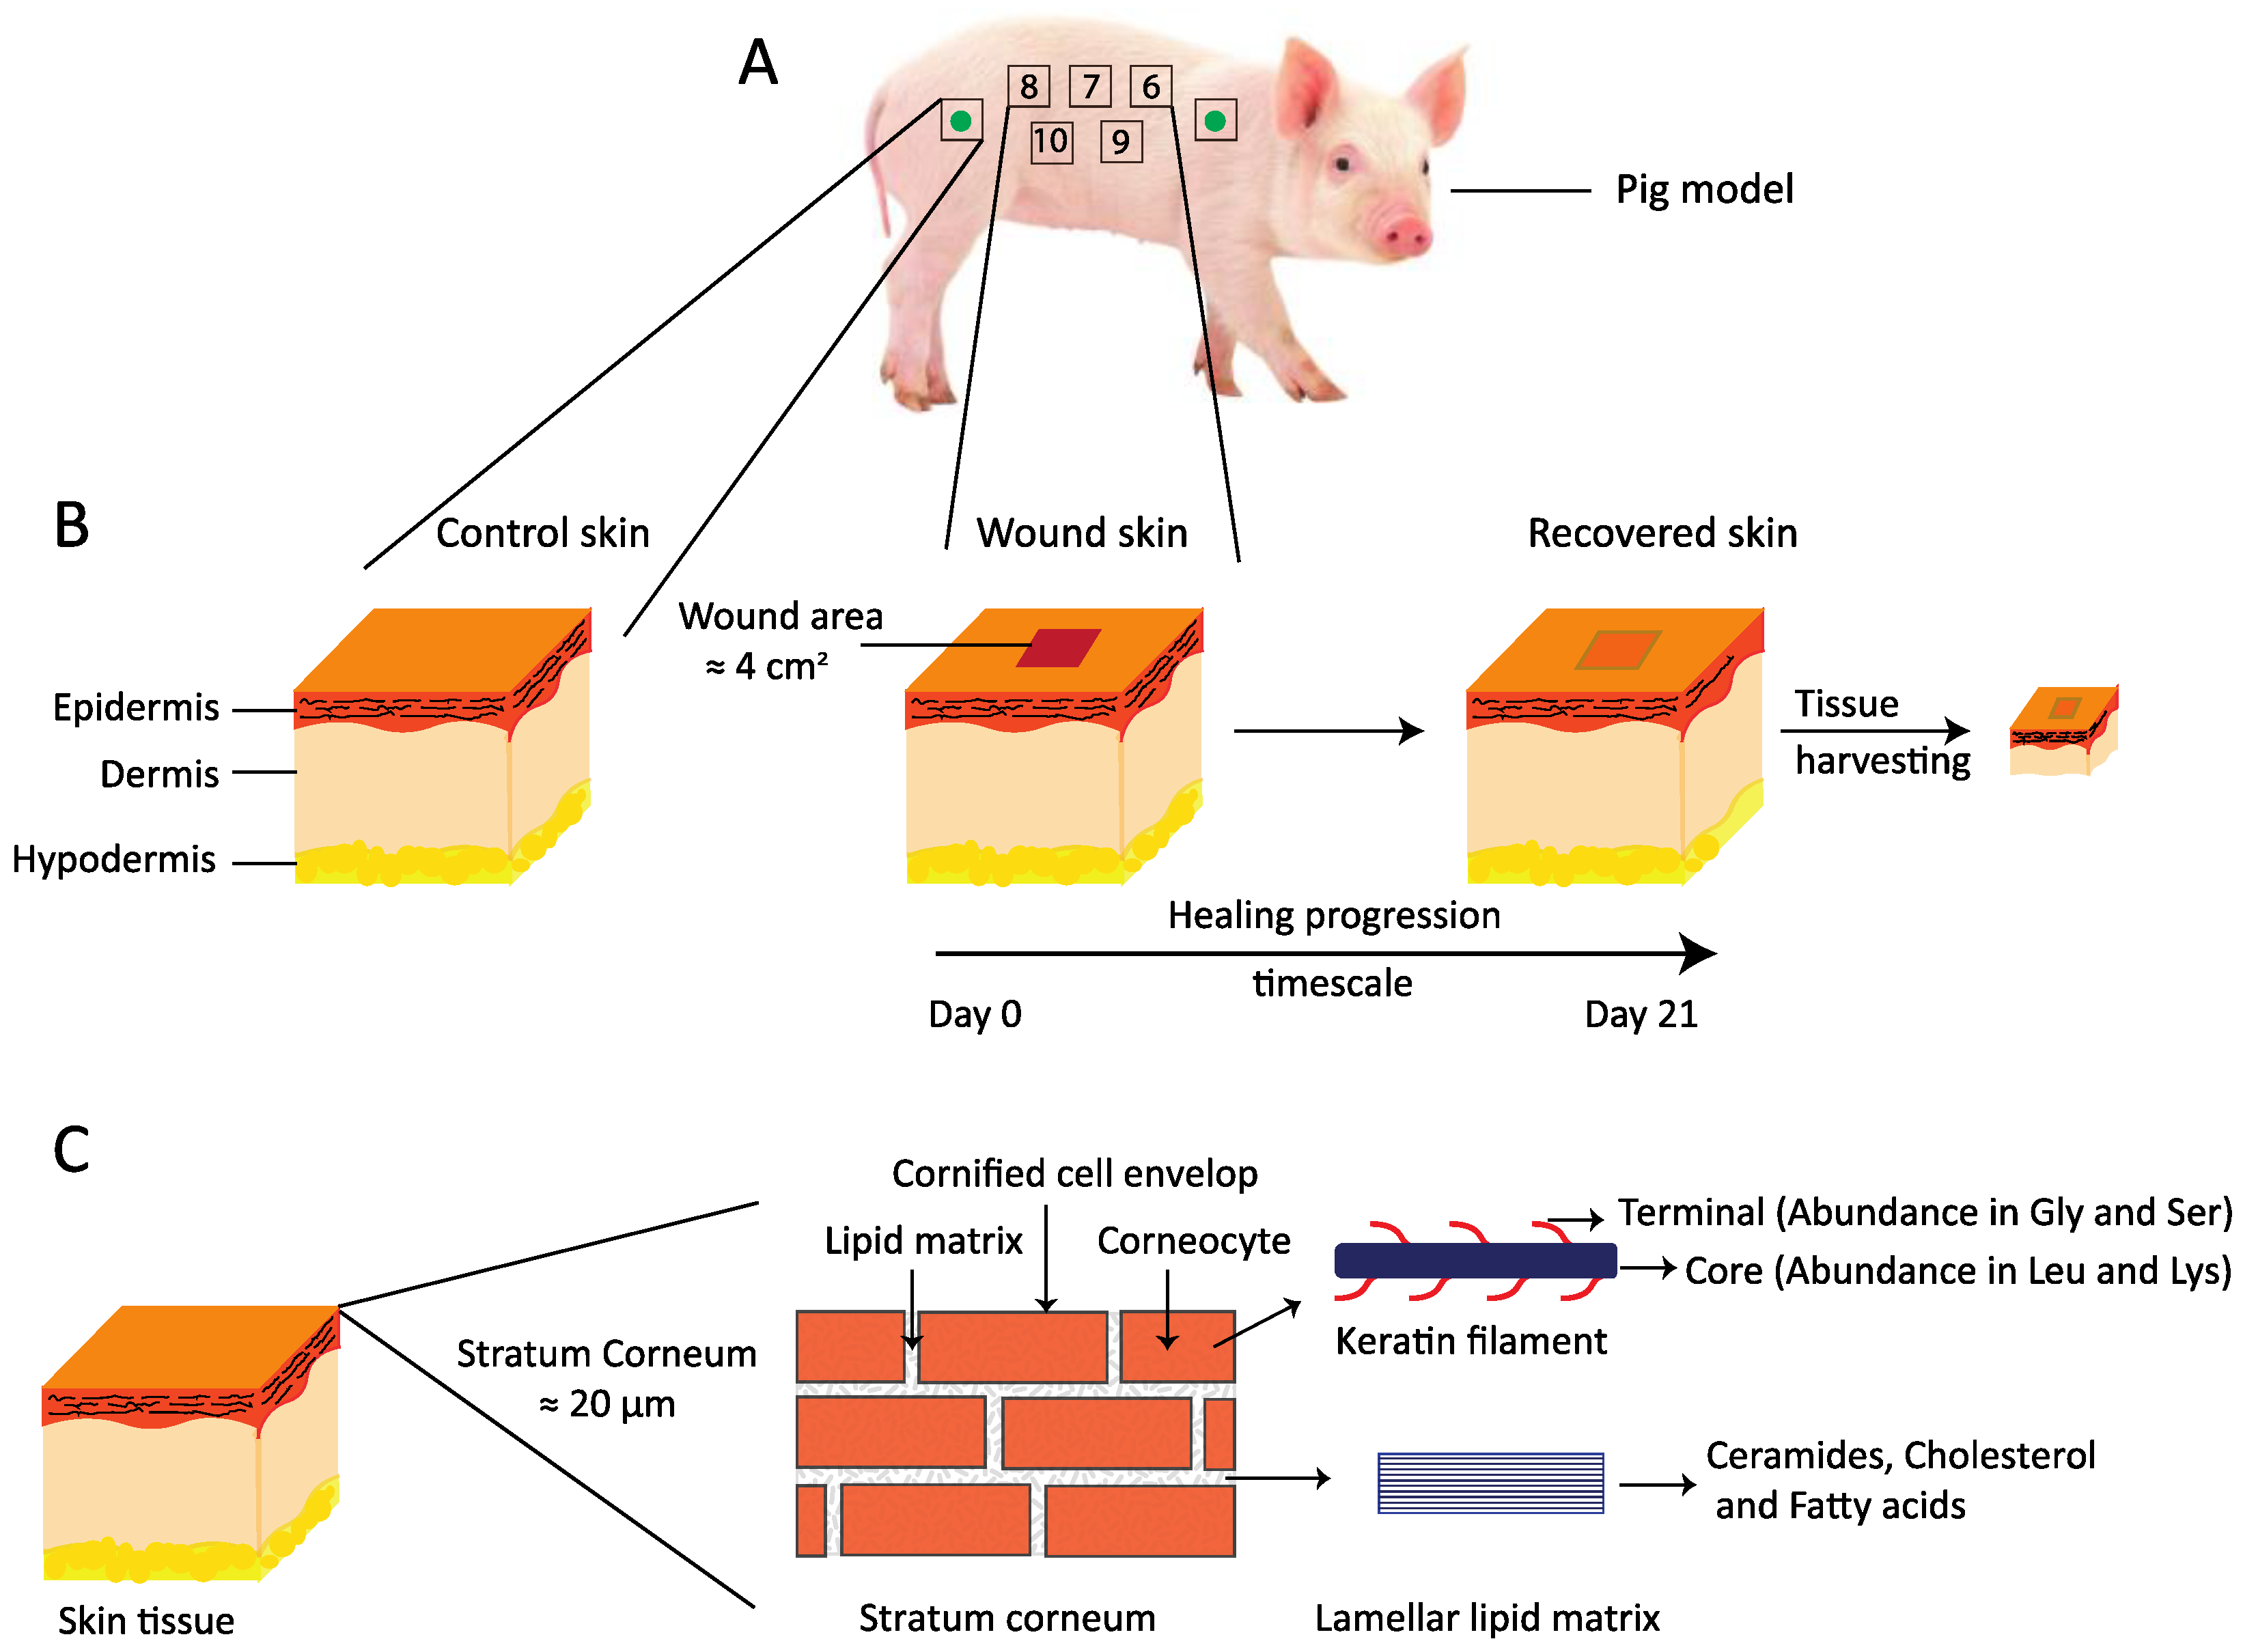
2.2.1. Animal Model
2.2.2. Ethical Permission
2.2.3. Wound Induction
2.2.4. Pain Treatment
2.2.5. Dressing Change
2.2.6. Study Termination
2.3. Trans-Epidermal Water Loss (TEWL) Measurement
2.4. Measurement of pH and Skin Temperature
2.5. Wound Closure Monitoring and Photographic Documentation
2.6. Histology
2.7. Sample Treatment Ex Vivo
2.8. Isolation of Stratum Corneum (SC)
2.9. Sample Preparation Method for SWAXD, NMR, DVS, and FTIR Studies
2.10. Small and Wide Angle X-ray Diffraction (SWAXD)
2.11. Polarization Transfer Solid State Nuclear Magnetic Resonance (PTssNMR)
2.12. Dynamic Vapor Sorption (DVS) Measurements
2.13. Fourier Transform Infrared (FTIR) Spectroscopy
3. Results
3.1. Wound Healing Progression In Vivo
3.1.1. Visualizing Wound Closure and Healing Cycle In Vivo
3.1.2. TEWL and pH as Barrier Indicator of Healed Skin
3.2. Ex Vivo Characterization of Recovered Tissue after Healing Compared to Control Skin
3.2.1. Morphology of Healed vs. Control Skin
3.2.2. SC Lipid and Protein Molecular Organization Investigated Using SWAXD
3.2.3. Water Uptake in SC Examined by DVS and 1H NMR
3.2.4. Molecular Structure and Dynamics of SC Constituents Examined by PTssNMR
4. Discussion
5. Conclusions
- Acute open wounds sealed within two weeks after incision. Wound closure monitored visually reflected good regeneration of the tissue at the end of the 21 days in vivo session. Histological evaluation of excised healed skin did, however, reveal morphological differences in various layers of the epidermis and less epithelialization in the dermis when compared with control skin.
- The TEWL of the healing skin reached the value of control skin (≈15 g/m2·h) within three weeks from wound incision. The pH was alkaline (≈8.0) at the beginning of the healing cycle and became slightly acidic (≈5.1) at the end of the session. Both TEWL and pH provided an excellent correlation to visually determined wound closure.
- SC water uptake capacity was similar in both control and healed SC with slightly higher water uptake in healed SC compared to control SC at higher humidity.
- SWAXD studies on excised SC showed poorly developed keratin organization in healed SC. The extracellular lipid organization in healed SC also exhibited deviations in lamellar structure compared to control SC.
- PTssNMR revealed the presence of more fluid lipids in healed SC compared to control SC. This could be a result of incomplete lipid conversion during barrier recovery as glycosphingolipids, which were normally not present in SC, were detected by FTIR.
Supplementary Materials
Author Contributions
Funding
Institutional Review Board Statement
Informed Consent Statement
Data Availability Statement
Acknowledgments
Conflicts of Interest
References
- Madison, K.C. Barrier function of the skin: “La raison d’etre” of the epidermis. J. Investig. Dermytol. 2003, 121, 231–241. [Google Scholar] [CrossRef]
- Proksch, E.; Brandner, J.M.; Jensen, J.-M. The skin: An indispensable barrier. Exp. Dermatol. 2008, 17, 1063–1072. [Google Scholar] [CrossRef]
- Blatteis, C.M. Age-dependent changes in temperature regulation–A mini review. Gerontology 2012, 58, 289–295. [Google Scholar] [CrossRef]
- Schaefer, H.; Redelmeier, T.E. Skin Barrier: Principles of Percutaneous Absorption; Karger: Basel, Switzerland, 1996. [Google Scholar]
- Scheuplein, R.J. Permeability of the skin: A review of major concepts and some new developments. J. Investig. Dermatol. 1976, 67, 672–676. [Google Scholar] [CrossRef]
- Eckert, R.L. Structure, function, and differentiation of the keratinocyte. Physiol. Rev. 1989, 69, 1316–1346. [Google Scholar] [CrossRef]
- Watt, F.M. Terminal differentiation of epidermal keratinocytes. Curr. Opin. Cell Biol. 1989, 1, 1107–1115. [Google Scholar] [CrossRef]
- Grove, G.L.; Kligman, A.M. Age-associated changes in human epidermal cell renewal. J. Gerontol. 1983, 38, 137–142. [Google Scholar] [CrossRef]
- Candi, E.; Schmidt, R.; Melino, G. The cornified envelope: A model of cell death in the skin. Nat. Rev. Mol. Cell Biol. 2005, 6, 328–340. [Google Scholar] [CrossRef]
- Holbrook, K.A.; Odland, G.F. Regional differences in the thickness (cell layers) of the human stratum corneum: An ultrastructural analysis. J. Investig. Dermatol. 1974, 62, 415–422. [Google Scholar] [CrossRef] [PubMed]
- Pham, Q.D.; Carlström, G.; Lafon, O.; Sparr, E.; Topgaard, D. Quantification of the amount of mobile components in intact stratum corneum with natural-abundance 13C solid-state NMR. Phys. Chem. Chem. Phys. 2020, 22, 6572–6583. [Google Scholar] [CrossRef]
- Schaefer, H.; Redelmeier, T.E. Structure and dynamics of the skin barrier. In Skin Barrier: Principles of Percutaneous Absorption; Krager: Basel, Switzerland, 1996; pp. 1–42. [Google Scholar]
- Papir, Y.S.; Hsu, K.; Wildnauer, R.H. The mechanical properties of stratum corneum. Biochim. Biophys. Acta 1975, 399, 170–180. [Google Scholar] [CrossRef]
- Breiden, B.; Sandhoff, K. The role of sphingolipid metabolism in cutaneous permeability barrier formation. Biochim. Biophys. Acta 2014, 1841, 441–452. [Google Scholar] [CrossRef]
- Bouwstra, J.A.; Gooris, G.S.; Bras, W.; Downing, D.T. Lipid organization in pig stratum corneum. J. Lipid Res. 1995, 36, 685–695. [Google Scholar] [CrossRef]
- Wertz, P.W.; Miethke, M.C.; Long, S.A.; Strauss, J.S.; Downing, D.T. The Composition of the Ceramides from Human Stratum Corneum and from Comedones. J. Investig. Dermatol. 1985, 84, 410–412. [Google Scholar] [CrossRef] [PubMed]
- Bouwstra, J.A.; Gooris, G.S.; Van Der Spek, J.A.; Bras, W. Structural investigations of human stratum corneum by small-angle X-ray scattering. J. Investig. Dermatol. 1991, 97, 1005–1012. [Google Scholar] [CrossRef]
- White, S.H.; Mirejovsky, D.; King, G.I. Structure of lamellar lipid domains and corneocyte envelopes of murine stratum corneum. An x-ray diffraction study. Biochemistry 1988, 27, 3725–3732. [Google Scholar] [CrossRef]
- Silva, C.L.; Topgaard, D.; Kocherbitov, V.; Sousa, J.J.S.; Pais, A.A.C.C.; Sparr, E. Stratum corneum hydration: Phase transformations and mobility in stratum corneum, extracted lipids and isolated corneocytes. Biochim. Biophys. Acta (BBA)–Biomembr. 2007, 1768, 2647–2659. [Google Scholar] [CrossRef]
- Alonso, A.; Meirelles, N.C.; Yushmanov, V.E.; Tabak, M. Water increases the fluidity of intercellular membranes of stratum corneum: Correlation with water permeability, elastic, and electrical resistance properties. J. Investig. Dermatol. 1996, 106, 1058–1063. [Google Scholar] [CrossRef]
- Park, Y.H.; Jang, W.H.; Seo, J.A.; Park, M.; Lee, T.R.; Park, Y.H.; Kim, D.K.; Lim, K.M. Decrease of ceramides with very long-chain fatty acids and downregulation of elongases in a murine atopic dermatitis model. J. Investig. Dermatol. 2012, 132, 476–479. [Google Scholar] [CrossRef]
- Ishikawa, J.; Narita, H.; Kondo, N.; Hotta, M.; Takagi, Y.; Masukawa, Y.; Kitahara, T.; Takema, Y.; Koyano, S.; Yamazaki, S.; et al. Changes in the ceramide profile of atopic dermatitis patients. J. Investig. Dermatol. 2010, 130, 2511–2514. [Google Scholar] [CrossRef] [PubMed]
- Motta, S.; Monti, M.; Sesana, S.; Mellesi, L.; Ghidoni, R.; Caputo, R. Abnormality of Water Barrier Function in Psoriasis: Role of Ceramide Fractions. Arch. Dermatol. 1994, 130, 452–456. [Google Scholar] [CrossRef]
- Imokawa, G.; Abe, A.; Jin, K.; Higaki, Y.; Kawashima, M.; Hidano, A. Decreased level of ceramides in stratum corneum of atopic dermatitis: An etiologic factor in atopic dry skin? J. Investig. Dermatol. 1991, 96, 523–526. [Google Scholar] [CrossRef]
- Janssens, M.; Van Smeden, J.; Gooris, G.S.; Bras, W.; Portale, G.; Caspers, P.J.; Vreeken, R.J.; Kezic, S.; Lavrijsen, A.P.; Bouwstra, J.A. Lamellar lipid organization and ceramide composition in the stratum corneum of patients with atopic eczema. J. Investig. Dermatol. 2011, 131, 2136–2138. [Google Scholar] [CrossRef] [PubMed]
- Janssens, M.; Van Smeden, J.; Gooris, G.S.; Bras, W.; Portale, G.; Caspers, P.J.; Vreeken, R.J.; Hankemeier, T.; Kezic, S.; Wolterbeek, R.; et al. Increase in short-chain ceramides correlates with an altered lipid organization and decreased barrier function in atopic eczema patients. J. Lipid. Res. 2012, 53, 2755–2766. [Google Scholar] [CrossRef]
- Bouwstra, J.; Gooris, G.; Ponec, M. The lipid organisation of the skin barrier: Liquid and crystalline domains coexist in lamellar phases. J. Biol. Phys. 2002, 28, 211–223. [Google Scholar] [CrossRef]
- Van Smeden, J.; Janssens, M.; Gooris, G.S.; Bouwstra, J.A. The important role of stratum corneum lipids for the cutaneous barrier function. Biochim. Biophys. Acta 2014, 1841, 295–313. [Google Scholar] [CrossRef]
- Elias, P.M. Epidermal lipids, barrier function, and desquamation. J. Investig. Dermatol. 1983, 80, 44–49. [Google Scholar] [CrossRef] [PubMed]
- Nemes, Z.; Steinert, P.M. Bricks and mortar of the epidermal barrier. Exp. Mol. Med. 1999, 31, 5–19. [Google Scholar] [CrossRef] [PubMed]
- Honari, G.; Maibach, H. Chapter 1–Skin Structure and Function. In Applied Dermatotoxicology; Maibach, H., Honari, G., Eds.; Academic Press: Boston, MA, USA, 2014; pp. 1–10. [Google Scholar] [CrossRef]
- Reinke, J.M.; Sorg, H. Wound repair and regeneration. European surgical research. Europaische chirurgische Forschung. Rech. Chir. Eur. 2012, 49, 35–43. [Google Scholar] [CrossRef]
- Landen, N.X.; Li, D.; Stahle, M. Transition from inflammation to proliferation: A critical step during wound healing. Cell. Mol. Life Sci. CMLS 2016, 73, 3861–3885. [Google Scholar] [CrossRef]
- Wilhelm, K.P.; Wilhelm, D.; Bielfeldt, S. Models of wound healing: An emphasis on clinical studies. Skin Res. Technol. 2017, 23, 3–12. [Google Scholar] [CrossRef] [PubMed]
- Atiyeh, B.S.; Ioannovich, J.; Al-Amm, C.A.; El-Musa, K.A. Management of acute and chronic open wounds: The importance of moist environment in optimal wound healing. Curr. Pharm. Biotechnol. 2002, 3, 179–195. [Google Scholar] [CrossRef] [PubMed]
- Dyson, M.; Young, S.; Pendle, C.L.; Webster, D.F.; Lang, S.M. Comparison of the effects of moist and dry conditions on dermal repair. J. Investig. Dermatol. 1988, 91, 434–439. [Google Scholar] [CrossRef] [PubMed]
- Svensjö, T.; Pomahac, B.; Yao, F.; Slama, J.; Eriksson, E. Accelerated Healing of Full-Thickness Skin Wounds in a Wet Environment. Plast. Reconstr. Surg. 2000, 106, 602–612. [Google Scholar] [CrossRef] [PubMed]
- Vogt, P.M.; Andree, C.; Breuing, K.; Liu, P.Y.; Slama, J.; Helo, G.; Eriksson, E. Dry, moist, and wet skin wound repair. Ann. Plast. Surg. 1995, 34, 493–499. [Google Scholar] [CrossRef] [PubMed]
- Atiyeh, B.; Hayek, S. Moisture and wound healing. J. Plaies Cicatr. 2005, 9, 7–11. [Google Scholar]
- Percival, S.L.; McCarty, S.; Hunt, J.A.; Woods, E.J. The effects of pH on wound healing, biofilms, and antimicrobial efficacy. Wound Repair Regen. 2014, 22, 174–186. [Google Scholar] [CrossRef]
- Ousey, K.; Cutting, K.F.; Rogers, A.A.; Rippon, M.G. The importance of hydration in wound healing: Reinvigorating the clinical perspective. J. Wound Care 2016, 25, 124–130. [Google Scholar] [CrossRef]
- Visscher, M.O.; Robinson, M.; Fugit, B.; Rosenberg, R.J.; Hoath, S.B.; Randall Wickett, R. Amputee skin condition: Occlusion, stratum corneum hydration and free amino acid levels. Arch. Dermatol. Res. 2011, 303, 117–124. [Google Scholar] [CrossRef]
- Harding, C.R.; Watkinson, A.; Rawlings, A.V.; Scott, R. Dry skin, moisturization and corneodesmolysis. Int. J. Cosmet. Sci. 2000, 22, 21–52. [Google Scholar] [CrossRef]
- Roberts, G.; Hammad, L.; Creevy, J.; Shearman, C.; European Wound Management Association. Physical changes in dermal tissues around chronic venous ulcers. In Proceedings of the European Conference, 7th Advances in Wound Management, Harrogate, North Yorkshire; 1998; pp. 104–105. [Google Scholar]
- Hoffman, R.; Noble, J.; Eagle, M. The use of proteases as prognostic markers for the healing of venous leg ulcers. J. Wound Care 1999, 8, 273–276. [Google Scholar] [CrossRef]
- Schade, H.; Marchionini, A. Der Säuremantel der Haut nach Gaskettenmessngen. Klin. Wochenschr 1928, 7, 12–14. [Google Scholar] [CrossRef]
- Ali, S.M.; Yosipovitch, G. Skin pH: From Basic Science to Basic Skin Care. Acta Derm. Venereol. 2013, 93, 261–269. [Google Scholar] [CrossRef]
- Braun-Falco, O.; Korting, H.C. Normal pH value of human skin. Der Hautarzt Z. Dermatol. Venerol. Verwandte Geb. 1986, 37, 126–129. [Google Scholar]
- Bandier, J.; Johansen, J.D.; Petersen, L.J.; Carlsen, B.C. Skin pH, atopic dermatitis, and filaggrin mutations. Dermat. Contact Atopic Occup. Drug 2014, 25, 127–129. [Google Scholar] [CrossRef] [PubMed]
- Kezic, S.; Kammeyer, A.; Calkoen, F.; Fluhr, J.W.; Bos, J.D. Natural moisturizing factor components in the stratum corneum as biomarkers of filaggrin genotype: Evaluation of minimally invasive methods. Br. J. Dermatol. 2009, 161, 1098–1104. [Google Scholar] [CrossRef]
- Rippke, F.; Schreiner, V.; Schwanitz, H.J. The acidic milieu of the horny layer: New findings on the physiology and pathophysiology of skin pH. Am. J. Clin. Dermatol. 2002, 3, 261–272. [Google Scholar] [CrossRef] [PubMed]
- Scott, I.R.; Harding, C.R. Filaggrin breakdown to water binding compounds during development of the rat stratum corneum is controlled by the water activity of the environment. Dev. Biol. 1986, 115, 84–92. [Google Scholar] [CrossRef]
- Elias, P.M. The how, why and clinical importance of stratum corneum acidification. Exp. Dermatol. 2017, 26, 999–1003. [Google Scholar] [CrossRef] [PubMed]
- Shukla, V.K.; Shukla, D.; Tiwary, S.K.; Agrawal, S.; Rastogi, A. Evaluation of pH measurement as a method of wound assessment. J. Wound Care 2007, 16, 291–294. [Google Scholar] [CrossRef] [PubMed]
- Schneider, L.A.; Korber, A.; Grabbe, S.; Dissemond, J. Influence of pH on wound-healing: A new perspective for wound-therapy? Arch. Dermatol. Res. 2007, 298, 413–420. [Google Scholar] [CrossRef]
- Nagoba, B.; Suryawanshi, N.; Wadher, B.; Selkar, S. Acidic Environment and Wound Healing: A Review. Wounds Compend. Clin. Res. Pract. 2015, 27, 5–11. [Google Scholar]
- Kurabayashi, H.; Tamura, K.; Machida, I.; Kubota, K. Inhibiting bacteria and skin pH in hemiplegia: Effects of washing hands with acidic mineral water. Am. J. Phys. Med. Rehabil. 2002, 81, 40–46. [Google Scholar] [CrossRef]
- Nyman, E.; Henricson, J.; Ghafouri, B.; Anderson, C.D.; Kratz, G. Hyaluronic Acid Accelerates Re-epithelialization and Alters Protein Expression in a Human Wound Model. Plast. Reconstr. Surg. Glob. Open 2019, 7, e2221. [Google Scholar] [CrossRef] [PubMed]
- Sorg, H.; Tilkorn, D.J.; Hager, S.; Hauser, J.; Mirastschijski, U. Skin Wound Healing: An Update on the Current Knowledge and Concepts. Eur. Surg. Res. 2017, 58, 81–94. [Google Scholar] [CrossRef]
- Cañedo-Dorantes, L.; Cañedo-Ayala, M. Skin Acute Wound Healing: A Comprehensive Review. Int. J. Inflamm. 2019, 2019, 3706315. [Google Scholar] [CrossRef]
- Sullivan, T.P.; Eaglstein, W.H.; Davis, S.C.; Mertz, P. The pig as a model for human wound healing. Wound Repair Regen. Off. Publ. Wound Heal Soc. Eur. Tissue Repair Soc. 2001, 9, 66–76. [Google Scholar] [CrossRef] [PubMed]
- Arcega, R.S.; Woo, J.S.; Xu, H. Performing and Cutting Frozen Sections. In Biobanking: Methods and Protocols; Yong, W.H., Ed.; Springer: New York, NY, USA, 2019; pp. 279–288. [Google Scholar] [CrossRef]
- Morris, G.A.; Freeman, R. Enhancement of nuclear magnetic resonance signals by polarization transfer. J. Am. Chem. Soc. 1979, 101, 760–762. [Google Scholar] [CrossRef]
- Pines, A.; Gibby, M.G.; Waugh, J.S. Proton-enhanced nuclear induction spectroscopy. A method for high resolution NMR of dilute spins in solids. J. Chem. Phys. 1972, 56, 1776–1777. [Google Scholar] [CrossRef]
- Van Geet, A.L. Calibration of methanol nuclear magnetic resonance thermometer at low temperature. Anal. Chem. 1970, 42, 679–680. [Google Scholar] [CrossRef]
- Chen, L.; Weng, Z.; Goh, L.; Garland, M. An efficient algorithm for automatic phase correction of NMR spectra based on entropy minimization. J. Magn. Reson. 2002, 158, 164–168. [Google Scholar] [CrossRef]
- Van Beek, J.D. MatNMR: A flexible toolbox for processing, analyzing and visualizing magnetic resonance data in Matlab®. J. Magn. Reson. 2007, 187, 19–26. [Google Scholar] [CrossRef]
- Doucet, J.; Potter, A.; Baltenneck, C.; Domanov, Y.A. Micron-scale assessment of molecular lipid organization in human stratum corneum using microprobe X-ray diffraction. J. Lipid Res. 2014, 55, 2380–2388. [Google Scholar] [CrossRef]
- Bjorklund, S.; Engblom, J.; Thuresson, K.; Sparr, E. Glycerol and urea can be used to increase skin permeability in reduced hydration conditions. Eur. J. Pharm. Sci. Off. J. Eur. Fed. Pharm. Sci. 2013, 50, 638–645. [Google Scholar] [CrossRef]
- Yagi, N.; Aoyama, K.; Ohta, N. Microbeam X-ray diffraction study of lipid structure in stratum corneum of human skin. PLoS ONE 2020, 15, e0233131. [Google Scholar] [CrossRef]
- Nakazawa, H.; Ohta, N.; Hatta, I. A possible regulation mechanism of water content in human stratum corneum via intercellular lipid matrix. Chem. Phys. Lipids 2012, 165, 238–243. [Google Scholar] [CrossRef]
- Garson, J.-C.; Doucet, J.; Lévêque, J.-L.; Tsoucaris, G. Oriented Structure in Human Stratum Corneum Revealed by X-Ray Diffraction. J. Investig. Dermatol. 1991, 96, 43–49. [Google Scholar] [CrossRef]
- Kreplak, L.; Doucet, J.; Dumas, P.; Briki, F. New aspects of the alpha-helix to beta-sheet transition in stretched hard alpha-keratin fibers. Biophys. J. 2004, 87, 640–647. [Google Scholar] [CrossRef]
- Rodriguez, J.A.; Ivanova, M.I.; Sawaya, M.R.; Cascio, D.; Reyes, F.E.; Shi, D.; Sangwan, S.; Guenther, E.L.; Johnson, L.M.; Zhang, M.; et al. Structure of the toxic core of [agr]-synuclein from invisible crystals. Nature 2015, 525, 486–490. [Google Scholar] [CrossRef]
- Mojumdar, E.H.; Pham, Q.D.; Topgaard, D.; Sparr, E. Skin hydration: Interplay between molecular dynamics, structure and water uptake in the stratum corneum. Sci. Rep. 2017, 7, 15712. [Google Scholar] [CrossRef]
- Nowacka, A.; Bongartz, N.A.; Ollila, O.H.S.; Nylander, T.; Topgaard, D. Signal intensities in 1H–13C CP and INEPT MAS NMR of liquid crystals. J. Magn. Reson. 2013, 230, 165–175. [Google Scholar] [CrossRef]
- Bjorklund, S.; Nowacka, A.; Bouwstra, J.A.; Sparr, E.; Topgaard, D. Characterization of stratum corneum molecular dynamics by natural-abundance (1)(3)C solid-state NMR. PLoS ONE 2013, 8, e61889. [Google Scholar] [CrossRef] [PubMed]
- Nowacka, A.; Mohr, P.C.; Norrman, J.; Martin, R.W.; Topgaard, D. Polarization transfer solid-state NMR for studying surfactant phase behavior. Langmuir 2010, 26, 16848–16856. [Google Scholar] [CrossRef]
- Andersson, J.M.; Grey, C.; Larsson, M.; Ferreira, T.M.; Sparr, E. Effect of cholesterol on the molecular structure and transitions in a clinical-grade lung surfactant extract. Proc. Natl. Acad. Sci. USA 2017, 114, 3592–3601. [Google Scholar] [CrossRef]
- Lu, Y.; Hu, F.; Miyakawa, T.; Tanokura, M. Complex Mixture Analysis of Organic Compounds in Yogurt by NMR Spectroscopy. Metabolites 2016, 6. [Google Scholar] [CrossRef]
- Yazdani, P.; Wang, B.; Rimaz, S.; Kawi, S.; Borgna, A. Glucose hydrogenolysis over Cu-La2O3/Al2O3: Mechanistic insights. Mol. Catal. 2019, 466, 138–145. [Google Scholar] [CrossRef]
- Klang, V.; Schwarz, J.C.; Lenobel, B.; Nadj, M.; Auböck, J.; Wolzt, M.; Valenta, C. In vitro vs. in vivo tape stripping: Validation of the porcine ear model and penetration assessment of novel sucrose stearate emulsions. Eur. J. Pharm. Biopharm. Off. J. Arb. Pharm. Verfahr. V 2012, 80, 604–614. [Google Scholar] [CrossRef]
- Zhai, H.; Maibach, H.I. Dermatotoxicology, 6th ed.; CRC Press LCC: Boca Raton, FL, USA, 2004; pp. 938–955. [Google Scholar]
- Boer, M.; Duchnik, E.; Maleszka, R.; Marchlewicz, M. Structural and biophysical characteristics of human skin in maintaining proper epidermal barrier function. Adv. Dermatol. Allergol. Postępy Dermatol. Alergol. 2016, 33, 1–5. [Google Scholar] [CrossRef]
- Du Plessis, J.; Stefaniak, A.; Eloff, F.; John, S.; Agner, T.; Chou, T.-C.; Nixon, R.; Steiner, M.; Franken, A.; Kudla, I.; et al. International guidelines for the in vivo assessment of skin properties in non-clinical settings: Part 2. transepidermal water loss and skin hydration. Skin Res. Technol. 2013, 19, 265–278. [Google Scholar] [CrossRef]
- Lengheden, A.; Jansson, L. pH effects on experimental wound healing of human fibroblasts in vitro. Eur. J. Oral Sci. 1995, 103, 148–155. [Google Scholar] [CrossRef] [PubMed]
- Stüttgen, G.; Schaefer, H. Die Hautoberfläche. In Funktionelle Dermatologie: Grundlagen der Morphokinetik Pathophysiologie, Pharmakoanalyse und Therapie von Dermatosen; Stüttgen, G., Schaefer, H., Eds.; Springer: Berlin, Germany, 1974; pp. 184–190. [Google Scholar] [CrossRef]
- Gethin, G. The significance of surface pH in chronic wounds. Wounds UK 2007, 3, 52. [Google Scholar]
- Greener, B.; Hughes, A.A.; Bannister, N.P.; Douglass, J. Proteases and pH in chronic wounds. J. Wound Care 2005, 14, 59–61. [Google Scholar] [CrossRef]
- Leveen, H.H.; Falk, G.; Borek, B.; Diaz, C.; Lynfield, Y.; Wynkoop, B.J.; Mabunda, G.A.; Rubricius, J.L.; Christoudias, G.C. Chemical acidification of wounds. An adjuvant to healing and the unfavorable action of alkalinity and ammonia. Ann. Surg. 1973, 178, 745–753. [Google Scholar] [CrossRef]
- Björklund, S.; Andersson, J.M.; Pham, Q.D.; Nowacka, A.; Topgaard, D.; Sparr, E. Stratum corneum molecular mobility in the presence of natural moisturizers. Soft Matter 2014, 10, 4535–4546. [Google Scholar] [CrossRef]
- Ongpipattanakul, B.; Francoeur, M.L.; Potts, R.O. Polymorphism in stratum corneum lipids. Biochim. Biophys. Acta (BBA) Biomembr. 1994, 1190, 115–122. [Google Scholar] [CrossRef]
- Pham, Q.D.; Björklund, S.; Engblom, J.; Topgaard, D.; Sparr, E. Chemical penetration enhancers in stratum corneum–Relation between molecular effects and barrier function. J. Control. Release 2016, 232, 175–187. [Google Scholar] [CrossRef]
- Mojumdar, E.H.; Grey, C.; Sparr, E. Self-Assembly in Ganglioside‒Phospholipid Systems: The Co-Existence of Vesicles, Micelles, and Discs. Int. J. Mol. Sci. 2019, 21, 56. [Google Scholar] [CrossRef] [PubMed]
- Hamanaka, S.; Suzuki, A.; Hara, M.; Nishio, H.; Otsuka, F.; Uchida, Y. Human Epidermal Glucosylceramides are Major Precursors of Stratum Corneum Ceramides. J. Investig. Dermatol. 2002, 119, 416–423. [Google Scholar] [CrossRef]


| Wound Area * (mm2) | TEWL * (g/m2·h) | pH ** | Temperature (°C) | |||
|---|---|---|---|---|---|---|
| Pig 1/Days | Wound | Control | Wound | Control | Wound | Control |
| 0 | 505.6 | 14.4 | 14.4 | – | – | – |
| 2 | 435.1 | 11.9 | 160 | 5 | 8.4 | 34.2 |
| 4 | 358.0 | 12.8 | 188 | 5.3 | 8.2 | 34.2 |
| 7 | 297.6 | 14.7 | 191 | 5.3 | 8.1 | 33.7 |
| 10 | 165.6 | 12.1 | 165 | 5.2 | 7.3 | 33.5 |
| 14 | 122.0 | 12.9 | 30.5 | 5.1 | 5.3 | 33.5 |
| 17 | 122.5 | 12.2 | 13.5 | 5.2 | 5.2 | 33.3 |
| 21 | 117.2 | 12.3 | 7.9 | 5.2 | 5.1 | 33.6 |
| Pig 2/Days | ||||||
| 0 | 549.3 | 15.3 | 11.9 | – | – | – |
| 2 | 439.3 | 13.7 | 144 | 5.3 | 8.5 | 34.7 |
| 4 | 397.1 | 11.8 | 195 | 5.2 | 8.3 | 34.4 |
| 7 | 310.2 | 13.6 | 183 | 5.4 | – | 34.3 |
| 10 | 180.2 | 13.7 | 167 | 5.2 | 7.8 | 34.1 |
| 14 | 165.4 | 11.0 | 25.2 | 5.3 | 5.8 | 33.4 |
| 17 | 161.3 | 12.4 | 12.6 | 5.4 | 5.5 | 33.7 |
| 21 | 159.9 | 12.6 | 7.2 | 5.1 | 5.1 | 33.1 |
| Dry | Wet | d (Å) in Literature for Pig | Remarks | |||||
|---|---|---|---|---|---|---|---|---|
| Pig 1 Q (Å−1) | Pig 2 Q (Å−1) | d (Å) | Pig 1 Q (Å−1) | Pig 2 Q (Å−1) | d (Å) | |||
| Control SC | – | – | – | – | – | – | 120–132 * [15,69] | LPP with higher orders. Observed at RT and recrystallization from 120 °C. |
| 0.07 | – | 90 | 0.07 | 0.07 | 90 | 90 [15] | Keratin rod diameter/thickness of corneocyte bound lipids. | |
| – | – | – | 0.1; 0.2 | – | 60 | 60 [15] | SPP. Detected at RT and skin temperature. | |
| 0.25 | – | 25 | – | 0.12; 0.25 | 50–52; 25 | – – | SPP first order with shorter d-spacing. SPP second order with shorter d-spacing. | |
| 0.14 | 0.14 | 44 | 0.14 | 0.14 | 44 | 45 [15,69] | Possibly second order of 90 Å phase/higher order of LPP/other phase. | |
| 0.18 | 0.18 | 33 | 0.18 | 0.18 | 33 | 34 [15,68] | Anhydrous Chol crystals. | |
| 1.52 | 1.52 | 4.1 | 1.52 | 1.52 | 4.1 | 4.1 [15,69,75] | Crystalline hexagonal packing of hydrocarbon lipid tails. | |
| 0.67 | 0.67 | 9.3 | 0.65 | 0.65 | 9.7 | 9.0–10.4 * [15,69,75] | Keratin interchain distance. Swelling upon hydration. | |
| NR | NR | – | NR | NR | – | 5.1–5.4 * [15,69,75] | α-Helical secondary structure of keratin protein. | |
| 1.39 | 1.39 | 4.5 | 1.39 | NR | 4.5 | 4.6–4.9 * [15,75] | β-Sheet secondary structure of keratin protein. | |
| Healed SC | – | – | – | – | – | – | 120–132 * [15,69] | LPP with higher orders. Observed at RT and recrystallization from 120 °C. |
| – | – | – | – | – | – | 90 [15] | Keratin rod diameter/thickness of corneocyte bound lipids. | |
| – | – | – | 0.1 | – | 60 | 60 [15] | SPP with higher orders. Detected at RT and skin temperature. | |
| 0.23 | 0.12; 0.23 | 52–54, 27 | – | 0.12 | 52 | – – | SPP first order with shorter d-spacing. SPP second order with shorter d-spacing. | |
| – | – | – | 0.14 | 0.14 | 44 | 45 [15,69] | Possibly second order of 90 Å phase/higher order of LPP/other phase. | |
| 0.18 | 0.18 | 33 | 0.18 | – | 33 | 34 [15,69] | Anhydrous Chol crystals. | |
| 1.52 | 1.52 | 4.1 | 1.52 | 1.52 | 4.1 | 4.1 [15,69,75] | Crystalline hexagonal packing of hydrocarbon lipid tails. | |
| 0.67 | 0.65 | 9.3–9.7 | 0.64 | 0.60 | 9.8–10.4 | 9.0–10.4 * [15,69,75] | Keratin interchain distance. Swelling upon hydration. More pronounced in healed SC compared to control SC. | |
| NR | NR | – | NR | NR | – | 5.1–5.4 * [15,69,75] | α-Helical secondary structure of keratin protein. | |
| NR | 1.39 | 4.5 | NR | NR | – | 4.6–4.9 * [15,75] | β-Sheet secondary structure of keratin protein (not observed in wet condition). | |
Publisher’s Note: MDPI stays neutral with regard to jurisdictional claims in published maps and institutional affiliations. |
© 2021 by the authors. Licensee MDPI, Basel, Switzerland. This article is an open access article distributed under the terms and conditions of the Creative Commons Attribution (CC BY) license (https://creativecommons.org/licenses/by/4.0/).
Share and Cite
Mojumdar, E.H.; Madsen, L.B.; Hansson, H.; Taavoniku, I.; Kristensen, K.; Persson, C.; Morén, A.K.; Mokso, R.; Schmidtchen, A.; Ruzgas, T.; et al. Probing Skin Barrier Recovery on Molecular Level Following Acute Wounds: An In Vivo/Ex Vivo Study on Pigs. Biomedicines 2021, 9, 360. https://doi.org/10.3390/biomedicines9040360
Mojumdar EH, Madsen LB, Hansson H, Taavoniku I, Kristensen K, Persson C, Morén AK, Mokso R, Schmidtchen A, Ruzgas T, et al. Probing Skin Barrier Recovery on Molecular Level Following Acute Wounds: An In Vivo/Ex Vivo Study on Pigs. Biomedicines. 2021; 9(4):360. https://doi.org/10.3390/biomedicines9040360
Chicago/Turabian StyleMojumdar, Enamul Haque, Lone Bruhn Madsen, Henri Hansson, Ida Taavoniku, Klaus Kristensen, Christina Persson, Anna Karin Morén, Rajmund Mokso, Artur Schmidtchen, Tautgirdas Ruzgas, and et al. 2021. "Probing Skin Barrier Recovery on Molecular Level Following Acute Wounds: An In Vivo/Ex Vivo Study on Pigs" Biomedicines 9, no. 4: 360. https://doi.org/10.3390/biomedicines9040360
APA StyleMojumdar, E. H., Madsen, L. B., Hansson, H., Taavoniku, I., Kristensen, K., Persson, C., Morén, A. K., Mokso, R., Schmidtchen, A., Ruzgas, T., & Engblom, J. (2021). Probing Skin Barrier Recovery on Molecular Level Following Acute Wounds: An In Vivo/Ex Vivo Study on Pigs. Biomedicines, 9(4), 360. https://doi.org/10.3390/biomedicines9040360