Abstract
There is emerging evidence of an association between epigenetic modifications, glycemic control and atherosclerosis risk. In this study, we mapped genome-wide epigenetic changes in patients with type 2 diabetes (T2D) and advanced atherosclerotic disease. We performed chromatin immunoprecipitation sequencing (ChIP-seq) using a histone 3 lysine 9 acetylation (H3K9ac) mark in peripheral blood mononuclear cells from patients with atherosclerosis with T2D (n = 8) or without T2D (ND, n = 10). We mapped epigenome changes and identified 23,394 and 13,133 peaks in ND and T2D individuals, respectively. Out of all the peaks, 753 domains near the transcription start site (TSS) were unique to T2D. We found that T2D in atherosclerosis leads to an H3K9ac increase in 118, and loss in 63 genomic regions. Furthermore, we discovered an association between the genomic locations of significant H3K9ac changes with genetic variants identified in previous T2D GWAS. The transcription factor 7-like 2 (TCF7L2) rs7903146, together with several human leukocyte antigen (HLA) variants, were among the domains with the most dramatic changes of H3K9ac enrichments. Pathway analysis revealed multiple activated pathways involved in immunity, including type 1 diabetes. Our results present novel evidence on the interaction between genetics and epigenetics, as well as epigenetic changes related to immunity in patients with T2D and advanced atherosclerotic disease.
1. Introduction
Atherosclerosis accounts for more than 80% of deaths among patients with diabetes. Strong evidence from large treatment studies, such as the United Kingdom Prospective Diabetes Study (UKPDS) and Diabetes Control and Complications Trial (DCCT), supports an association between glycemic control and cardiovascular disease (CVD) risk [1,2]. Animal and human studies have provided further evidence that prolonged exposure to hyperglycemia induces alterations in vascular tissue that potentially accelerate the atherosclerotic process [3,4]. The atherogenic role of glucose involves protein and lipid glycosylation relevant to the atherosclerotic process, oxidative stress and protein kinase C (PKC) activation [5]. There is also emerging evidence of associations between epigenetic modifications and atherosclerosis risk.
Epigenetic mechanisms involve interactions between environmental factors (e.g., hyperglycemia) and gene expression via altering DNA methylation, non-coding RNAs, and histone modifications. These processes may persist for a lifetime and even be heritable. Histone acetylation contributes to the regulation of gene expression through its effect on conformational changes in chromatin. Histone 3 lysine 9 (H3K9ac) is a frequently acetylated site in active gene transcription under hyperglycemia. Previous investigations, including our own studies, have shown that H3K9ac is an important modification for transcription activity in glucotoxicity [6,7,8].
Histone acetylation is a dynamic process regulated by histone acetyl-transferases (HATs) and histone deacetylases (HDACs), which add and remove acetyl groups, respectively. HATs transfer acetyl groups generated from acetyl-coenzyme A (acetyl-CoA) to lysine residues on histone tails. Glucose is one of the major sources for the production of acetyl-CoA via the tricarboxylic acid cycle [9,10,11,12]; therefore, the availability of acetyl-CoA and thereby acetyl groups, also contributes to the levels of histone acetylation. Previous studies have shown that global histone acetylation levels in T2D patients are higher when compared to healthy controls, and are often associated with increases in gene expression [9,13,14]. Glucose-induced H3K9ac is found to be involved in the upregulation of glucotoxicity-related genes such as NF-kB and TXNIP in blood monocytes, pancreatic islet cells and kidney cells [7,15,16]. Therefore, we hypothesized that epigenetic regulation by H3K9ac could also be involved in T2D patients suffering from atherosclerosis.
In this study, we compared the genome-wide profiles of H3K9ac in peripheral blood mononuclear cells (PBMCs) of atherosclerotic patients with or without T2D, to elucidate key epigenetic mechanisms underlying T2D in atherosclerosis.
2. Materials and Methods
2.1. Carotid Plaque Imaging Project (CPIP) Cohort
The CPIP cohort is designed to study atherosclerosis and inflammatory or immune markers to identify mechanisms in atherosclerotic plaques that lead to the development of myocardial infarctions or strokes. The CPIP is an ongoing study since November 2005 that recruits patients who undergo carotid endarterectomy at Lund University Hospital, Malmö, Sweden. Blood samples were drawn from patients a day before the surgery. The criteria for surgery are (1) stroke, transient ischemic attack or amaurosis fugax and a stenosis degree (assessed by ultrasound) of >70%, or (2) no symptoms and a stenosis degree of >80%. For the current study, we studied blood PBMCs from 18 patients with (n = 8) or without (n = 10) T2D. The patients’ characteristics are summarized in Table 1. Serum C-peptide levels were measured using ELISA (10-1136-01, Mercodia, Uppsala, Sweden).

Table 1.
Categorical variables are expressed in total amount and percentages. Continuous variables as median and interquartile range (IQR) or mean and standard deviation (SD). * BMI, body mass index. † hsCRP, high-sensitivity CRP. ‡ LDL, low-density lipoprotein. § HDL, high-density lipoprotein. || HbA1c, hemoglobin A1c, was available for 67% (n = 12) of the cohort. Hypertension defined as: anti-hypertensive treatment or systolic pressure > 140 mmHg. Level of significance between no diabetes and T2D patients is marked by *** p < 0.005.
All patients gave informed consent and the study has been approved by the Lund/Malmö ethical committee (Approval Number and date: 472/2005-8 September 2005, 2014/904-14 December 2014). All experiments were performed in accordance with relevant guidelines and regulations.
2.2. PBMCs Isolation
Five milliliters of an EDTA-blood sample were used to isolate PBMC using Ficoll Paque Plus (GE17-1440-02) density gradient centrifugation. The total volume of blood was layered on 2.5 mL Ficoll Paque Plus and centrifuged at 1350× g for 10 min without braking to form gradients. The upper most layer was plasma, followed by the PBMC cell layer, the ficoll layer and granulocytes. Carefully, the PBMC layer was collected and washed by adding 0.9% NaCl, centrifuged at 600× g for 10 min. The washing step was repeated by adding NaCl, and followed by centrifugation at 300× g for 10 min. Finally, cells were suspended in 500 µL autologous plasma and cells were counted using a Burkes chamber. Cells were stored in freezing media containing 20% DMSO in RPMI1640 in liquid N2.
2.3. Chromatin Immunoprecipitation (ChIP)
ChIP was performed as previously described [7,17]. PBMCs were cross-linked by formaldehyde (final concentration 1%) and sonicated by a Bioruptor sonicator (Diagenode, Denville, NJ, USA) for 25 cycles of 30 s with a 30 s interval (medium intensity) period between cycles. Genomic DNA fragment lengths of 200–1000 bp were achieved after sonication. The lysates were then centrifuged, and the supernatants were collected. A 10% volume of each sample was set aside as the input control. The sonicated chromatin was incubated overnight at 4 °C with a 1 µg antibody binding to histone H3 lysine 9-acetylated (H3K9ac, ab4441, Abcam, Cambridge, United Kingdom). DNA–protein complexes were captured with 15 µL of 50% protein G beads, followed by reverse cross-linking and protease K digestion. The DNA fragments were purified using a MinElute PCR Purification Kit (Qiagen, Hilden, Germany).
2.4. Library Preparation
The purified DNA was then processed including end repair: A-tailing and barcode adapter ligation (Nextflex-HT barcodes 228-514174, Nextflex, San Jose, CA, USA). DNA libraries were then sequenced on Illumina HiSeq 2000.
2.5. ChIP-Seq Analysis
ChIP seq was performed with 40 M effective reads. The ingroup standard deviation among replicates was set at 10% of the average read density. ChIP-seq tags generated with the Illumina HiSeq platform were de-multiplexed with the bcl2fastq utility and aligned to the human reference genome (assembly NCBI37/hg19) using BWA v0.7.10, allowing up to three mismatches per sequencing tag (default parameters). Peaks were detected using MACS2 v2.1.1 (tag size = 100 bp; false discovery rate (FDR) <1 × 10⁻³) from pooled H3K9ac tags of patients with each individual’s input tags as control. Within each pooled sample, peaks whose termini were within 150 bp were merged into one peak. The MAnorm method was then used to compare H3K9ac enrichment across the two study groups. MAnorm took the coordinate of all peaks and aligned reads in both group samples as input. The (M, A) value of each common peak was then calculated and plotted, where M = log2 (Read density in sample 1/Read density in sample 2) and A = 0.5 × log2 (Read density in sample 1 × Read density in sample 2). A robust regression was subsequently applied to the (M, A) values of all common peaks and a linear model was derived. Finally, the linear model was extrapolated to all peaks for normalization. For each peak, a p-Value was calculated to examine the statistical significance (<0.001) of read intensity difference between the samples from the two groups. The p-value calculation was based on a Bayesian model developed by Audic and Claverie [18]. The value of M describes the log2 fold change of the read density at a peak region between two samples, and was used for downstream analysis (i.e., ND vs. T2D). Scatter plots, histograms, and box plots of ChIP-seq data were visualized using R software. Representative peaks at each gene that had significantly increased or decreased enrichment were generated by IGV software (GNU LGPL open-source, http://www.broadinstitute.org/igv (accessed on 28 September 2021), Broad Institute of MIT and Harvard, Cambridge, MA, USA).
2.6. Statistical Analysis
Statistical analysis of ChIP-seq data was performed by a Welch’s test. A Mann–Whitney test was used for clinical comparison of the patients from the ND and T2D groups. p < 0.05 were considered to be statistically significant.
2.7. Data and Resource Availability
Data presented in this manuscript are available upon reasonable request to the corresponding authors, with the exception of sensitive data according to current GDPR regulations.
3. Results
3.1. Genome-Wide Distribution of H3K9ac in Atherosclerosis Patients with T2D
To study the role of H3K9ac in atherosclerosis patients with T2D, we profiled the genome-wide enrichment of H3K9ac by ChIP-seq in the PBMCs collected from patients with T2D (n = 8) or without T2D (ND, n = 10), all with advanced atherosclerotic disease. The H3K9ac peaks in each group were detected by the MACS2 peak calling method (FDR < 1 × 10⁻³). Differential peak enrichment was evaluated by assessing the enrichment of the corresponding region in individual samples. ChIP-seq peak calling detected 23,394 peaks in subjects without T2D and 13,133 peaks in subjects with T2D (Figure 1A). The difference in detected peaks indicates an overall decrease in the total number of H3K9ac peaks in T2D, which suggests a downregulation of H3K9ac in the T2D condition. There are 12,380 peaks common to both ND and T2D individuals (Figure 1B). When the constitutive peaks are compared to the remaining peaks in the T2D group, around 6% (753 peaks) of the peaks were redistributed in T2D, which may suggest different chromatin states in T2D (Figure 1B). We then compared the enrichment of the constitutive H3K9ac peaks around the transcriptional start sites (TSSs, ±1 kb), with that of the TSSs with no H3K9ac peaks. The levels of H3K9ac acetylation at the TSSs of constitutive peaks and no peaks-calling were both higher in T2D (Figure 1C,D). The TSSs of constitutive peaks showed a bimodal distribution in both +1kb and −1kb around the TSS (Figure 1C). In the TSSs where no H3K9ac peaks were called, distribution of H3K9ac acetylation was mostly enriched in +1kb of the TSSs (Figure 1D).
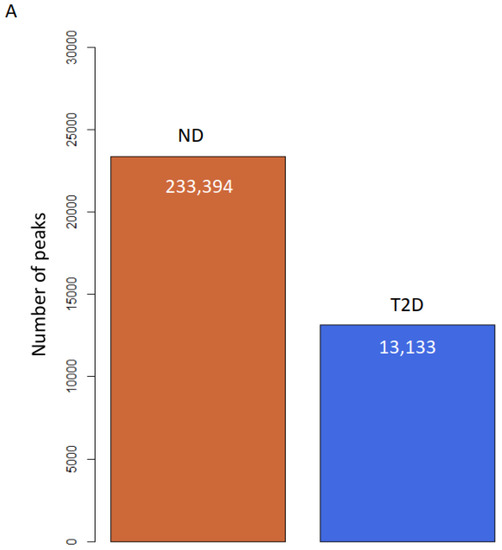
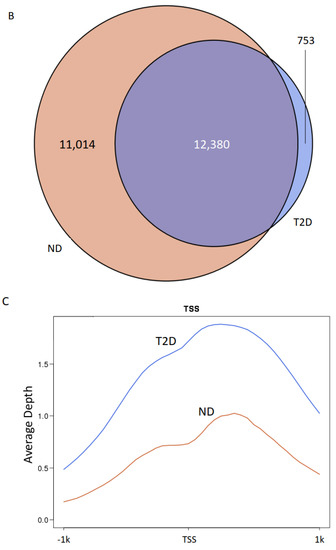
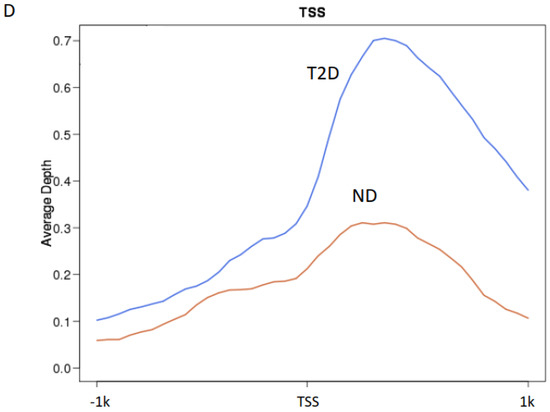
Figure 1.
H3K9ac is redistributed in atherosclerosis patients with T2D. (A) Bar plot of total number of H3K9ac peaks. (B) Venn diagram of peak overlapping between ND (red) and T2D (blue). (C,D) H3K9ac enrichment at (C) TSSs (±1 kb) of constitutive peaks; (D) TSS (± 1 kb) where no peak was detected.
3.2. The Dynamics of the H3K9ac Changes in T2D
Quantification and comparison of the number of peaks that were gained or lost in ND and T2D showed 753 peaks gained in T2D, whereas no loss in peaks was detected (Figure 1B). This analysis suggests that H3K9ac tends to gain in T2D. To better understand the dynamics of the H3K9ac changes in T2D, we next performed quantitative measurements of H3K9ac enrichment.
Individual heterogeneity could potentially impact variable peaks; therefore, to ensure that the observed trends were statistically significant, for each peak detected in ND or T2D individuals, we quantified the corresponding area under the curve in each patient and compared it with both ND and T2D groups. When comparing ND with T2D, we detected 80 peaks with a significant increase and 405 peaks with a significant decrease in H3K9ac with T2D (p < 0.05, Welch’s t test; Figure 2A,B).
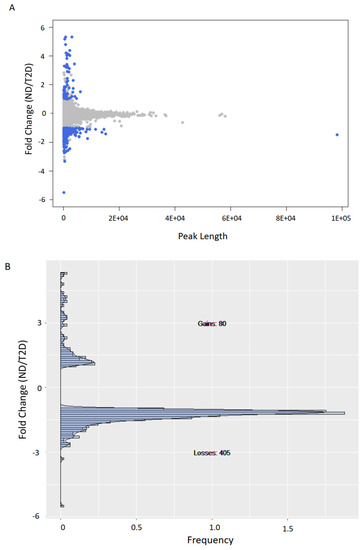
Figure 2.
H3K9ac is predominantly lost in T2D. (A) Scatter plot of H3K9ac fold-change vs. peak size average (measured as area under the curve or AUC) for ND vs. T2D. (B) Histogram of H3K9ac fold-change vs. frequency for peaks with significant (p < 0.05, Welch’s t test, two-sided) H3K9ac changes (blue dots in (A)).
3.3. H3K9ac-Enriched Genomic Regions in T2D Coincide with Genetic Loci Associated with T2D and Type 1 Diabetes (T1D)
We then mapped and profiled T2D H3K9ac enrichment in annotated genomic regions. A comparison of ND and T2D H3K9ac enrichment revealed 181 genomic regions unique to T2D (top 10 loci displayed in Table 2 and Table 3; full gene list presented in Table S1). About 69.5% of the differentially enriched regions fall into intergenic regions; 24.2% in introns; 4% upstream and 0.8% downstream of the TSS; and 1.5% in exons (Figure 3A). Among these genes, 118 displayed increased (Tables S1 and S2) and 63 showed decreased H3K9ac enrichment in T2D (Table 3 and Table S1). Representative UCSC Genome browser track views of H3K9ac changes are presented in Figure 3B–G (B–D: increased H3K9ac; and E–G: decreased H3K9ac in T2D). The transcription factor 7-like 2 (TCF7L2) polymorphism at rs7903146 is known to be highly associated with an increased risk for T2D from multiple large population studies [19]. Here, we detected TCF7L2 rs7903146 as one of the loci with the most highly increased H3K9ac enrichment in T2D (Table 2 and Figure 3D). Surprisingly, several HLA genes were also identified among the most altered H3K9ac enrichments in T2D, including HLA-A, HLA-B, HLA-C, HLA-DRB1, HLA-DRB5, HLA-DQA1 and HLA-DQB1 (Table S1 and Figure 3).
Table 2.
Top genetic loci with increased H3K9ac enrichment in atherosclerosis patients with T2D.
Table 3.
Top genetic loci with decreased H3K9ac enrichment in atherosclerosis patients with T2D.
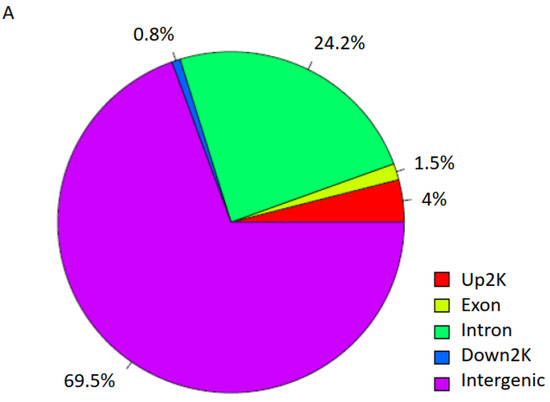
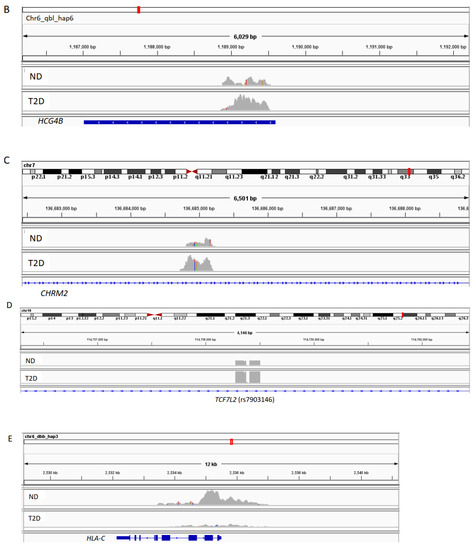
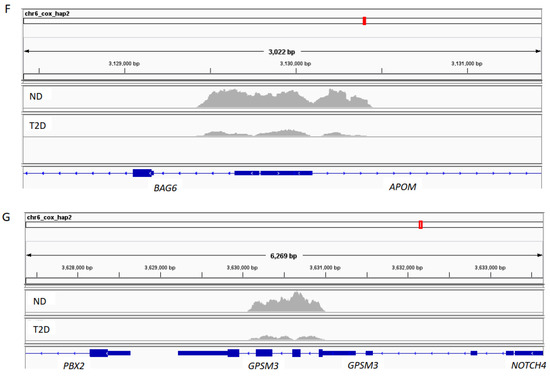
Figure 3.
H3K9ac-enriched genomic regions in T2D. (A) Genomic region distribution of H3K9ac enrichment in T2D. (B–G) Representative UCSC Genome browser track views of H3K9ac changes in respective genes.
3.4. Regions of H3K9ac Changes Are Enriched for T2D Single-Nucleotide Polymorphisms (SNPs)
Genome-wide association studies (GWAS) in large population studies have led to the discovery of T2D-associated genetic variants loci, e.g., PPARG and TCF7L2 [20,21]. The identified T2D SNPs are often located in non-coding regions and may colocalize with enhancers and promoters that are subject to epigenetic regulations. Since H3K9ac has been shown to be one of the major enhancer-associated chromatin modifications [22], we aimed to explore the overlap between the H3K9ac enrichment changes that we identified in T2D and the T2D SNPs that emerged from GWAS. To study this, we retrieved the GWAS summary statistics from the DIAGRAM [23]. We applied INterval enRICHment analysis (INRICH), an interval-based GWAS analysis tool, to map SNPs with their overlap regions of H3K9ac changes. Notably, we found significant associations between the T2D-specific H3K9ac enrichment that we identified and the T2D and T1D SNPs (Table 4). The most significant SNP loci are at rs7903146 in TCF7L2 (p = 2.45E-39); and HLA SNPs including HLA-B (p = 0.0004), HLA-DQB1 (p = 0.0006), HLA-DRB1 (p = 0.001), HLA-DRB5 (p = 0.01) and HLA-DQA1 (p = 0.02) (Table 4). These data underscore the significant association of H3K9ac changes in T2D with the GWAS SNPs. This relationship reinforced the biological relevance of epigenetic changes to the genetic factors impacting T2D.
Table 4.
T2D-associated genetic variant loci with overlap regions of H3K9ac changes.
3.5. Functional Pathways Related to T2D-Specific H3K9ac Enrichment Changes
We next examined the functional pathways related to T2D-specific H3K9ac enrichment changes. Categories of genes showing significantly increased or decreased H3K9ac (p < 0.05, Welch’s t test) in T2D included pathways related to a response to allograft rejection, cell adhesion molecules, ErbB signaling, T1D, autoimmune thyroid disease, graft-versus-host disease, endocytosis, antigen processing and presentation, Wnt signaling pathway, etc., the majority of which are linked to immune responses (Table 5 and Table S3). It has been suggested that hyperglycemia and oxidative stress in diabetes may accelerate the development of atherosclerosis; one mechanism for this could be via the promotion of immune reactions [24]. Our results on epigenetic changes in the immune response pathways in atherosclerotic patients with T2D may further support this view.
Table 5.
Functional pathways related to T2D-specific H3K9ac enrichment changes.
4. Discussion
Our study presents the first genome-wide profile of histone acetylation in humans affected with atherosclerosis and T2D. We performed ChIP-seq on PBMCs and traced the natural changes in how the T2D condition affects the epigenetic profile of atherosclerosis.
Previous studies have elucidated DNA methylation alterations in atherosclerosis [25], such as in vascular smooth muscle cells [26], aorta and coronary arteries [27], and aortic endothelial cells [28], as well as non-coding RNAs as epigenetic regulators [29]. The role of histone modification in atherosclerosis is, however, unclear. Several studies on cell lines and animal models have linked histone modifications to proinflammatory gene expression in atherosclerosis (detailed review by Khyzha et al. [30]). In human atherosclerotic plaques, changes in histone modifications were only supported by immunohistochemistry findings [31,32]. In this study, we investigated changes in histone modifications in PBMCs in association with atherosclerosis and T2D. PBMCs are clinically relevant cells with well-established roles in different diseases and previous studies have shown that PBMCs may provide disease-specific epigenetic signatures [33,34,35,36]. Therefore, an understanding of epigenetic changes linked to diabetes and atherosclerosis of PBMCs may contribute to identifying biologically promising epigenetic markers for pathogenesis of the diseases. To the best of our knowledge, no previous study has been performed to investigate genome-wide histone modification changes in atherosclerosis in humans, especially under diabetic conditions.
In this study, we investigated the modification of H3K9ac due to its association with T2D from previous studies. In T2D, despite the discovery of a large number of genetic loci associated with T2D by GWAS, the identified variants only explain a small proportion (~10%) of the heritability of T2D [37]. A growing body of evidence suggests that epigenetic mechanisms may contribute to explain the “missing heritability” in T2D. Epigenetic regulation via histone acetylation plays an important role in gene expression regulation and H3K9ac is commonly linked with gene activation by allowing genomic regions access to transcription machinery. In this study, we used ChIP-seq to map H3K9ac enrichment in PBMCs in T2D and ND patients with advanced cerebrovascular atherosclerosis and identified modifications at genomic regions unique to T2D. Notably, our analysis linked these epigenetic changes in T2D with genetics and pathways related to immunity. It is worth highlighting that we identified a genomic locus in TCF7L2 at rs7903146 as one of the major sites for H3K9ac enrichment modifications in T2D. This specific locus in TCF7L2 has been shown in multiple large population studies to be strongly associated with T2D risk [21]. Our novel finding, therefore, sheds light on the direct interaction between genetic and epigenetic mechanisms in T2D susceptibility. This is in line with previous studies where TCF7L2 rs7903146 was identified to be significantly associated with angiographically diagnosed coronary artery disease (CAD) in the presence of T2D [38], and in PBMCs from CAD patients, where TCF7L2 was identified as a key gene to be differentially expressed in CAD patients with T2D [39]. At this stage, we do not know if the H3K9ac enrichment pattern differs from risk- and non-risk-allele carriers at this specific locus, which requires further investigations.
Another surprising finding from our study is that we also identified several loci in the HLAs with most modifications in H3K9ac enrichment in T2D. Furthermore, we also found a significant association between T2D H3K9ac enrichment and pathways related to immunity, notably, T1D as one of the major identified pathways. The HLAs are reported to account for up to 50% of the familial aggregation of T1D, with the major genetic determinants in polymorphisms of class II HLA DQ and DR [40]. In our study, we identified several genetic loci in HLA that have been associated with T1D to be the most differentially enriched in H3K9ac, e.g., HLA-B, HLA-DQB1, HLA-DRB, HLA-DRB5, and HLA-DQA1. It has previously been shown that there is no fundamental difference between the immune activation and inflammation present in atherosclerosis among non-diabetics as compared to diabetics [24]. Albeit speculation, we may suggest that immune responses in T1D may also be operating in T2D, or that the two disease conditions may share common pathways.
Comparison of the ND vs. T2D ChIP-seq profile revealed a redistribution of H3K9ac with T2D. Previous in vitro models mimicking hyperinsulinemia showed that high insulin leads to a global increase in chromatin-associated histone acetylation, in particular at H3K9 [41]. An earlier investigation on PBMCs in T1D also demonstrated association between HbA1c level and H3K9ac enrichment [42]. In our study, all patients with T2D were diagnosed based on glycemic levels. We may only speculate at this stage that the epigenetic profile that we identified associated with T2D may be affected by both glucose and/or insulin levels; this requires further investigations.
In conclusion, our study provides fine mapping of genome-wide histone acetylation changes in patients with T2D and advanced atherosclerotic disease. By identifying loci linked to T2D and T1D genetics, we revealed the potential mechanisms of epigenetic and genetic interactions. Furthermore, we also suggest epigenetic modifications in pathways related to immunity in T2D. These findings open the possibility that prevention of T2D-dysregulation at the chromatin level may present novel therapeutic avenues for T2D.
Supplementary Materials
The following are available online at https://www.mdpi.com/article/10.3390/biomedicines9121908/s1, Table S1: Increaed H3K9ac in T2D, Table S2: Decreaed H3K9ac in T2D, Table S3: Group2b-VS-group4.
Author Contributions
P.B., C.L., B.A.M. and O.H. performed experiments. C.W., R.G. and J.S. performed data analysis. I.G. and A.E. provided the clinical samples and co-designed the study. E.R., L.G., J.W., I.G. and Y.D.M. supervised the study and critically revised the manuscript for important intellectual content. Y.D.M. conceived and supervised the study and wrote the manuscript with input from all co-authors. Y.D.M. is the guarantor of this work and, as such, had full access to all the data in the study and takes responsibility for the integrity of the data and the accuracy of the data analysis. All authors gave final approval of the manuscript and gave consent to publication. All authors have read and agreed to the published version of the manuscript.
Funding
This project has received funding from the Innovative Medicines Initiative 2 Joint Undertaking under grant agreement No 115974 (BEAt-DKD). This Joint Undertaking receives support from the European Union’s Horizon 2020 research and innovation programme and EFPIA with JDRF. This study was supported by the Swedish Research Council (A.E 2019-01907, I.G 2019-01260), the Swedish heart and lung foundation (A.E 20200504, I.G 20200403), Swedish Society for Medical Research (A.E S16-0100), Skåne University Hospital grants (A.E, I.G), Crafoord Foundation (A.E 20210796), Strategic Research Area Exodiab, Dnr 2009-1039; and the Swedish Foundation for Strategic Research Dnr IRC15-0067; European Foundation for the Study of Diabetes (EFSD) grant; Hjelt Foundation grant; Påhlsson foundation, Exodiab pilot study grant and the Swedish Society of Medicine (A.E SLS-961085). The Knut and Alice Wallenberg foundation, the Medical Faculty at Lund University and Region Skåne are acknowledged for generous financial support (A.E).
Institutional Review Board Statement
The study was conducted according to the guidelines of the Declaration of Helsinki, and approved by the Lund/Malmö ethical committee (472/2005-20050908, 2014/904-20141214). All experiments were performed in accordance with relevant guidelines and regulations.
Informed Consent Statement
Informed consent was obtained from all subjects involved in the study.
Data Availability Statement
The data underlying this article will be shared on reasonable request and in compliance with the appropriate GDPR regulations.
Acknowledgments
We thank Ana Persson and Mihaela Nitulescu for technical help.
Conflicts of Interest
The authors declare no conflict of interest.
References
- Kannel, W.B.; McGee, D.L. Diabetes and Glucose Tolerance as Risk Factors for Cardiovascular Disease: The Framingham Study. Diabetes Care 1979, 2, 120–126. [Google Scholar] [CrossRef] [PubMed]
- Turner, R.C.; Millns, H.; Neil, H.A.W.; Stratton, I.; Manley, S.E.; Matthews, D.R.; Holman, R.R. Risk factors for coronary artery disease in non-insulin dependent diabetes mellitus: United Kingdom prospective diabetes study (UKPDS: 23). BMJ 1998, 316, 823–828. [Google Scholar] [CrossRef] [Green Version]
- Bowes, A.J.; Werstuck, G.H. Diabetes, Hyperglycemia and Accelerated Atherosclerosis: Evidence Supporting a Role for Endoplasmic Reticulum (ER) Stress Signaling. Cardiovasc. Hematol. Disord. Targets 2010, 10, 151–157. [Google Scholar] [CrossRef]
- Chait, A.; Bornfeldt, K.E. Diabetes and atherosclerosis: Is there a role for hyperglycemia? J. Lipid Res. 2009, 50, S335–S339. [Google Scholar] [CrossRef] [PubMed] [Green Version]
- Aronson, D.; Rayfield, E.J. How hyperglycemia promotes atherosclerosis: Molecular mechanisms. Cardiovasc. Diabetol. 2002, 1, 1. [Google Scholar] [CrossRef] [Green Version]
- Bompada, P.; Atac, D.; Luan, C.; Andersson, R.; Omella, J.D.; Laakso, E.O.; Wright, J.; Groop, L.; De Marinis, Y. Histone acetylation of glucose-induced thioredoxin-interacting protein gene expression in pancreatic islets. Int. J. Biochem. Cell Biol. 2016, 81, 82–91. [Google Scholar] [CrossRef] [PubMed] [Green Version]
- De Marinis, Y.; Cai, M.; Bompada, P.; Atac, D.G.; Kotova, O.; Johansson, M.E.; Garcia-Vaz, E.; Gomez, M.F.; Laakso, M.; Groop, L. Epigenetic regulation of the thioredoxin-interacting protein (TXNIP) gene by hyperglycemia in kidney. Kidney Int. 2016, 89, 342–353. [Google Scholar] [CrossRef] [Green Version]
- Ling, C.; Groop, L. Epigenetics: A Molecular Link Between Environmental Factors and Type 2 Diabetes. Diabetes 2009, 58, 2718–2725. [Google Scholar] [CrossRef] [Green Version]
- Yucel, N.; Wang, Y.X.; Mai, T.; Porpiglia, E.; Lund, P.J.; Markov, G.; Garcia, B.A.; Bendall, S.C.; Angelo, M.; Blau, H.M. Glucose Metabolism Drives Histone Acetylation Landscape Transitions that Dictate Muscle Stem Cell Function. Cell Rep. 2019, 27, 3939–3955.e6. [Google Scholar] [CrossRef] [PubMed] [Green Version]
- Evertts, A.G.; Zee, B.; DiMaggio, P.; Gonzales-Cope, M.; Coller, H.A.; Garcia, B.A. Quantitative Dynamics of the Link between Cellular Metabolism and Histone Acetylation. J. Biol. Chem. 2013, 288, 12142–12151. [Google Scholar] [CrossRef] [Green Version]
- Wellen, K.E.; Hatzivassiliou, G.; Sachdeva, U.M.; Bui, T.V.; Cross, J.R.; Thompson, C.B. ATP-Citrate Lyase Links Cellular Metabolism to Histone Acetylation. Science 2009, 324, 1076–1080. [Google Scholar] [CrossRef] [Green Version]
- Galdieri, L.; Vancura, A. Acetyl-CoA Carboxylase Regulates Global Histone Acetylation. J. Biol. Chem. 2012, 287, 23865–23876. [Google Scholar] [CrossRef] [PubMed] [Green Version]
- Davey, C.A.; Sargent, D.F.; Luger, K.; Maeder, A.W.; Richmond, T.J. Solvent Mediated Interactions in the Structure of the Nucleosome Core Particle at 1.9Å Resolution. J. Mol. Biol. 2002, 319, 1097–1113. [Google Scholar] [CrossRef]
- Kouzarides, T. Chromatin Modifications and Their Function. Cell 2007, 128, 693–705. [Google Scholar] [CrossRef] [PubMed] [Green Version]
- Sharma, N.; Gaikwad, A.B. Histone Acetylation Regulates Natriuretic Peptides and Neprilysin Gene Expressions in Diabetic Cardiomyopathy and Nephropathy. Curr. Mol. Pharmacol. 2019, 12, 61–71. [Google Scholar] [CrossRef]
- Miao, F.; Gonzalo, I.G.; Lanting, L.; Natarajan, R. In Vivo Chromatin Remodeling Events Leading to Inflammatory Gene Transcription under Diabetic Conditions. J. Biol. Chem. 2004, 279, 18091–18097. [Google Scholar] [CrossRef] [PubMed] [Green Version]
- Kremlitzka, M.; Nowacka, A.A.; Mohlin, F.C.; Bompada, P.; De Marinis, Y.; Blom, A.M. Interaction of Serum-Derived and Internalized C3 With DNA in Human B Cells—A Potential Involvement in Regulation of Gene Transcription. Front. Immunol. 2019, 10, 493. [Google Scholar] [CrossRef]
- Audic, S.; Claverie, J.-M. The Significance of Digital Gene Expression Profiles. Genome Res. 1997, 7, 986–995. [Google Scholar] [CrossRef]
- Grant, S.F. The TCF7L2 Locus: A Genetic Window Into the Pathogenesis of Type 1 and Type 2 Diabetes. Diabetes Care 2019, 42, 1624–1629. [Google Scholar] [CrossRef] [PubMed] [Green Version]
- Altshuler, D.; Hirschhorn, J.N.; Klannemark, M.; Lindgren, C.; Vohl, M.-C.; Nemesh, J.; Lane, C.R.; Schaffner, S.F.; Bolk, S.; Brewer, C.G.; et al. The common PPARγ Pro12Ala polymorphism is associated with decreased risk of type 2 diabetes. Nat. Genet. 2000, 26, 76–80. [Google Scholar] [CrossRef] [PubMed]
- Grant, S.F.A.; Thorleifsson, G.; Reynisdottir, I.; Benediktsson, R.; Manolescu, A.; Sainz, J.; Helgason, A.; Stefansson, H.; Emilsson, V.; Helgadottir, A.; et al. Variant of transcription factor 7-like 2 (TCF7L2) gene confers risk of type 2 diabetes. Nat. Genet. 2006, 38, 320–323. [Google Scholar] [CrossRef] [PubMed]
- Calo, E.; Wysocka, J. Modification of Enhancer Chromatin: What, How, and Why? Mol. Cell 2013, 49, 825–837. [Google Scholar] [CrossRef] [Green Version]
- Scott, R.A.; Scott, L.J.; Mägi, R.; Marullo, L.; Gaulton, K.J.; Kaakinen, M.; Pervjakova, N.; Pers, T.H.; Johnson, A.D.; Eicher, J.D.; et al. An Expanded Genome-Wide Association Study of Type 2 Diabetes in Europeans. Diabetes 2017, 66, 2888–2902. [Google Scholar] [CrossRef] [Green Version]
- Frostegård, J. Immune Mechanisms in Atherosclerosis, Especially in Diabetes Type. Front. Endocrinol. 2013, 4, 162. [Google Scholar] [CrossRef] [Green Version]
- Dong, C.; Yoon, W.; Goldschmidt-Clermont, P.J. DNA Methylation and Atherosclerosis. J. Nutr. 2002, 132, 2406S–2409S. [Google Scholar] [CrossRef] [PubMed] [Green Version]
- Kim, J.; Kim, J.Y.; Song, K.S.; Lee, Y.H.; Seo, J.S.; Jelinek, J.; Goldschmidt-Clermont, P.J.; Issa, J.-P.J. Epigenetic changes in estrogen receptor β gene in atherosclerotic cardiovascular tissues and in-vitro vascular senescence. Biochim. Biophys. Acta Mol. Basis Dis. 2007, 1772, 72–80. [Google Scholar] [CrossRef] [Green Version]
- Zhu, S. Inactivation of Monocarboxylate Transporter MCT3 by DNA Methylation in Atherosclerosis. Circulation 2005, 112, 1353–1361. [Google Scholar] [CrossRef] [PubMed]
- El-Osta, A.; Brasacchio, D.; Yao, D.; Pocai, A.; Jones, P.L.; Roeder, R.G.; Cooper, M.E.; Brownlee, M. Transient high glucose causes persistent epigenetic changes and altered gene expression during subsequent normoglycemia. J. Exp. Med. 2008, 205, 2409–2417. [Google Scholar] [CrossRef]
- Van Rooij, E.; Olson, E.N. MicroRNAs: Powerful new regulators of heart disease and provocative therapeutic targets. J. Clin. Investig. 2007, 117, 2369–2376. [Google Scholar] [CrossRef] [PubMed] [Green Version]
- Khyzha, N.; Alizada, A.; Wilson, M.D.; Fish, J.E. Epigenetics of Atherosclerosis: Emerging Mechanisms and Methods. Trends Mol. Med. 2017, 23, 332–347. [Google Scholar] [CrossRef]
- Wierda, R.J.; Rietveld, I.M.; van Eggermond, M.C.; Belien, J.A.; van Zwet, E.W.; Lindeman, J.H.; Elsen, P.J.V.D. Global histone H3 lysine 27 triple methylation levels are reduced in vessels with advanced atherosclerotic plaques. Life Sci. 2015, 129, 3–9. [Google Scholar] [CrossRef] [PubMed]
- Greißel, A.; Culmes, M.; Burgkart, R.; Zimmermann, A.; Eckstein, H.-H.; Zernecke, A.; Pelisek, J. Histone acetylation and methylation significantly change with severity of atherosclerosis in human carotid plaques. Cardiovasc. Pathol. 2015, 25, 79–86. [Google Scholar] [CrossRef] [PubMed]
- Wang, H.; Wang, J.; Ning, C.; Zheng, X.; Fu, J.; Wang, A.; Zhang, Q.; Liu, J.-F. Genome-wide DNA methylation and transcriptome analyses reveal genes involved in immune responses of pig peripheral blood mononuclear cells to poly I:C. Sci. Rep. 2017, 7, 9709. [Google Scholar] [CrossRef] [PubMed]
- Li, Y.; Zhu, J.; Tian, G.; Li, N.; Li, Q.; Ye, M.; Zheng, H.; Yu, J.; Wu, H.; Sun, J.; et al. The DNA Methylome of Human Peripheral Blood Mononuclear Cells. PLoS Biol. 2010, 8, e1000533. [Google Scholar] [CrossRef] [PubMed]
- Matei, D.; Fang, F.; Shen, C.; Schilder, J.; Arnold, A.; Zeng, Y.; Berry, W.A.; Huang, T.; Nephew, K.P. Epigenetic Resensitization to Platinum in Ovarian Cancer. Cancer Res. 2012, 72, 2197–2205. [Google Scholar] [CrossRef] [PubMed] [Green Version]
- Di Francesco, A.; Arosio, B.; Falconi, A.; Di Bonaventura, M.V.M.; Karimi, M.; Mari, D.; Casati, M.; Maccarrone, M.; D’Addario, C. Global changes in DNA methylation in Alzheimer’s disease peripheral blood mononuclear cells. Brain Behav. Immun. 2015, 45, 139–144. [Google Scholar] [CrossRef]
- Manolio, T.A.; Collins, F.S.; Cox, N.J.; Goldstein, D.B.; Hindorff, L.A.; Hunter, D.J.; McCarthy, M.I.; Ramos, E.M.; Cardon, L.R.; Chakravarti, A.; et al. Finding the missing heritability of complex diseases. Nature 2009, 461, 747–753. [Google Scholar] [CrossRef] [PubMed] [Green Version]
- Muendlein, A.; Saely, C.H.; Geller-Rhomberg, S.; Sonderegger, G.; Rein, P.; Winder, T.; Beer, S.; Vonbank, A.; Drexel, H. Single Nucleotide Polymorphisms of TCF7L2 Are Linked to Diabetic Coronary Atherosclerosis. PLoS ONE 2011, 6, e17978. [Google Scholar] [CrossRef] [PubMed] [Green Version]
- Gong, R.; Chen, M.; Zhang, C.; Chen, M.; Li, H. A comparison of gene expression profiles in patients with coronary artery disease, type 2 diabetes, and their coexisting conditions. Diagn. Pathol. 2017, 12, 44. [Google Scholar] [CrossRef]
- Noble, J.A.; Valdes, A. Genetics of the HLA Region in the Prediction of Type 1 Diabetes. Curr. Diabetes Rep. 2011, 11, 533–542. [Google Scholar] [CrossRef] [Green Version]
- Senapati, P.; Kato, H.; Lee, M.; Leung, A.; Thai, C.; Sanchez, A.; Gallagher, E.J.; LeRoith, D.; Seewaldt, V.L.; Ann, D.K.; et al. Hyperinsulinemia promotes aberrant histone acetylation in triple-negative breast cancer. Epigenet. Chromatin 2019, 12, 44. [Google Scholar] [CrossRef] [PubMed] [Green Version]
- Miao, F.; Chen, Z.; Genuth, S.; Paterson, A.; Zhang, L.; Wu, X.; Li, S.M.; Cleary, P.; Riggs, A.; Harlan, D.M.; et al. Evaluating the Role of Epigenetic Histone Modifications in the Metabolic Memory of Type 1 Diabetes. Diabetes 2014, 63, 1748–1762. [Google Scholar] [CrossRef] [PubMed] [Green Version]
Publisher’s Note: MDPI stays neutral with regard to jurisdictional claims in published maps and institutional affiliations. |
© 2021 by the authors. Licensee MDPI, Basel, Switzerland. This article is an open access article distributed under the terms and conditions of the Creative Commons Attribution (CC BY) license (https://creativecommons.org/licenses/by/4.0/).