
Ability of a Combined FIB4/miRNA181a Score to Predict Significant Liver Fibrosis in NAFLD Patients

 , ,
, ,  ,
,
Abstract
1. Introduction
2. Methods
2.1. Clinical Design and Patient’s Selection
2.2. Clinical and Biochemical Analysis
2.3. Calculation of Noninvasive Fibrosis Scores
2.4. MicroRNA Expression and Analysis
2.4.1. Samples
2.4.2. RNA Quantification
2.4.3. Reverse Transcription and cDNA Synthesis
2.4.4. Detection of miRNAs by Real-Time PCR
2.4.5. Analysis of miRNAs Expression
2.5. Histological Analysis
2.6. Statistics
3. Results
4. Discussion
5. Conclusions
Author Contributions
Funding
Institutional Review Board Statement
Informed Consent Statement
Data Availability Statement
Conflicts of Interest
Lay Summary
Abbreviations
References
- Sherif, Z.A.; Saeed, A.; Ghavimi, S.; Nouraie, S.-M.; Laiyemo, A.O.; Brim, H.; Ashktorab, H. Global Epidemiology of Nonalcoholic Fatty Liver Disease and Perspectives on US Minority Populations. Dig. Dis. Sci. 2016, 61, 1214–1225. [Google Scholar] [CrossRef]
- European Association for the Study of the Liver (EASL); European Association for the Study of Diabetes (EASD); European Association for the Study of Obesity (EASO). EASL–EASD–EASO Clinical Practice Guidelines for the management of non-alcoholic fatty liver disease. J. Hepatol. 2016, 64, 1388–1402. [Google Scholar] [CrossRef] [PubMed]
- Cotter, T.G.; Rinella, M. Nonalcoholic Fatty Liver Disease 2020: The State of the Disease. Gastroenterology 2020, 158, 1851–1864. [Google Scholar] [CrossRef] [PubMed]
- Ciardullo, S.; Monti, T.; Grassi, G.; Mancia, G.; Perseghin, G. Blood pressure, glycemic status and advanced liver fibrosis assessed by transient elastography in the general United States population. J. Hypertens. 2021, 39, 1621–1627. [Google Scholar] [CrossRef]
- Hagström, H.; Nasr, P.; Ekstedt, M.; Hammar, U.; Stal, P.; Hultcrantz, R.; Kechagias, S. Fibrosis stage but not NASH predicts mortality and time to development of severe liver disease in biopsy-proven NAFLD. J. Hepatol. 2017, 67, 1265–1273. [Google Scholar] [CrossRef]
- Ekstedt, M.; Hagström, H.; Nasr, P.; Fredrikson, M.; Stål, P.; Kechagias, S.; Hultcrantz, R. Fibrosis stage is the strongest predictor for disease-specific mortality in NAFLD after up to 33 years of follow-up. Hepatology 2015, 61, 1547–1554. [Google Scholar] [CrossRef]
- Vilar-Gomez, E.; Chalasani, N. Non-invasive assessment of non-alcoholic fatty liver disease: Clinical prediction rules and blood-based biomarkers. J. Hepatol. 2018, 68, 305–315. [Google Scholar] [CrossRef]
- Rinella, M.E.; Sanyal, A.J. Management of NAFLD: A stage-based approach. Nat. Rev. Gastroenterol. Hepatol. 2016, 13, 196–205. [Google Scholar] [CrossRef]
- Eslam, M.; Sanyal, A.J.; George, J.; International Consensus Panel. MAFLD: A Consensus-Driven Proposed Nomenclature for Metabolic Associated Fatty Liver Disease. Gastroenterology 2020, 158, 1999–2014.e1. [Google Scholar] [CrossRef]
- Angulo, P.; Hui, J.M.; Marchesini, G.; Bugianesi, E.; George, J.; Farrell, G.C.; Enders, F.; Saksena, S.; Burt, A.D.; Bida, J.P.; et al. The NAFLD fibrosis score: A noninvasive system that identifies liver fibrosis in patients with NAFLD. Hepatology 2007, 45, 846–854. [Google Scholar] [CrossRef] [PubMed]
- Stefano, J.T.; Guedes, L.V.; De Souza, A.A.A.; Vanni, D.S.; Alves, V.A.F.; Carrilho, F.J.; Largura, A.; Arrese, M.; Oliveira, C.P. Usefulness of collagen type IV in the detection of significant liver fibrosis in nonalcoholic fatty liver disease. Ann. Hepatol. 2021, 20, 100253. [Google Scholar] [CrossRef]
- Boyle, M.; Tiniakos, D.; Schattenberg, J.M.; Ratziu, V.; Bugianessi, E.; Petta, S.; Oliveira, C.P.; Govaere, O.; Younes, R.; McPherson, S.; et al. Performance of the PRO-C3 collagen neo-epitope biomarker in non-alcoholic fatty liver disease. JHEP Rep. 2019, 1, 188–198. [Google Scholar] [CrossRef] [PubMed]
- Zambrano-Huailla, R.; Guedes, L.; Stefano, J.T.; de Souza, A.A.A.; Marciano, S.; Yvamoto, E.; Michalczuk, M.T.; Vanni, D.S.; Rodriguez, H.; Carrilho, F.J.; et al. Diagnostic performance of three non-invasive fibrosis scores (Hepamet, FIB-4, NAFLD fibrosis score) in NAFLD patients from a mixed Latin American population. Ann. Hepatol. 2020, 19, 622–626. [Google Scholar] [CrossRef] [PubMed]
- Chalasani, N.; Younossi, Z.; LaVine, J.E.; Charlton, M.; Cusi, K.; Rinella, M.; Harrison, S.A.; Brunt, E.M.; Sanyal, A.J. The diagnosis and management of nonalcoholic fatty liver disease: Practice guidance from the American Association for the Study of Liver Diseases. Hepatology 2017, 67, 328–357. [Google Scholar] [CrossRef] [PubMed]
- Szabo, G.; Csak, T. Role of MicroRNAs in NAFLD/NASH. Dig. Dis. Sci. 2016, 61, 1314–1324. [Google Scholar] [CrossRef]
- Gallego-Durán, R. Epigenetic mechanisms in non-alcoholic fatty liver disease: An emerging field. World J. Hepatol. 2015, 7, 2497–2502. [Google Scholar] [CrossRef]
- Cortez, M.A.; Bueso-Ramos, C.; Ferdin, J.; Lopez-Berestein, G.; Sood, A.K.; Calin, G.A. MicroRNAs in body fluids—The mix of hormones and biomarkers. Nat. Rev. Clin. Oncol. 2011, 8, 467–477. [Google Scholar] [CrossRef]
- Benhamouche-Trouillet, S.; Postic, C. Emerging role of miR-21 in non-alcoholic fatty liver disease. Gut 2016, 65, 1781–1783. [Google Scholar] [CrossRef]
- Pourhoseini, S.; Seth, R.K.; Das, S.; Dattaroy, D.; Kadiiska, M.B.; Xie, G.; Michelotti, G.A.; Nagarkatti, M.; Diehl, A.M.; Chatterjee, S. Upregulation of miR21 and Repression of Grhl3 by Leptin Mediates Sinusoidal Endothelial Injury in Experimental Nonalcoholic Steatohepatitis. PLoS ONE 2015, 10, e0116780. [Google Scholar] [CrossRef]
- Takeuchi-Yorimoto, A.; Yamaura, Y.; Kanki, M.; Ide, T.; Nakata, A.; Noto, T.; Matsumoto, M. MicroRNA-21 is associated with fibrosis in a rat model of nonalcoholic steatohepatitis and serves as a plasma biomarker for fibrotic liver disease. Toxicol. Lett. 2016, 258, 159–167. [Google Scholar] [CrossRef]
- Amaral, A.E.D.; Rode, M.P.; Cisilotto, J.; da Silva, T.E.; Fischer, J.; Matiollo, C.; Rateke, E.C.D.M.; Narciso-Schiavon, J.L.; Schiavon, L.L.; Creczynski-Pasa, T.B. MicroRNA profiles in serum samples from patients with stable cirrhosis and miRNA-21 as a predictor of transplant-free survival. Pharmacol. Res. 2018, 134, 179–192. [Google Scholar] [CrossRef] [PubMed]
- Murakami, Y.; Kawada, N. MicroRNAs in hepatic pathophysiology. Hepatol. Res. 2017, 47, 60–69. [Google Scholar] [CrossRef] [PubMed]
- Shah, N.; Nelson, J.E.; Kowdley, K.V. MicroRNAs in Liver Disease: Bench to Bedside. J. Clin. Exp. Hepatol. 2013, 3, 231–242. [Google Scholar] [CrossRef][Green Version]
- Roderburg, C.; Urban, G.W.; Bettermann, K.; Vucur, M.; Zimmermann, H.; Schmidt, S.; Janssen, J.; Koppe, C.; Knolle, P.; Castoldi, M.; et al. Micro-RNA profiling reveals a role for miR-29 in human and murine liver fibrosis. Hepatology 2011, 53, 209–218. [Google Scholar] [CrossRef]
- Yang, Y.-L.; Kuo, H.-C.; Wang, F.-S.; Huang, Y.-H. MicroRNA-29a Disrupts DNMT3b to Ameliorate Diet-Induced Non-Alcoholic Steatohepatitis in Mice. Int. J. Mol. Sci. 2019, 20, 1499. [Google Scholar] [CrossRef] [PubMed]
- Afonso, M.B.; Rodrigues, P.M.; Simão, A.L.; Castro, R.E. Circulating microRNAs as Potential Biomarkers in Non-Alcoholic Fatty Liver Disease and Hepatocellular Carcinoma. J. Clin. Med. 2016, 5, 30. [Google Scholar] [CrossRef]
- Miyaaki, H.; Ichikawa, T.; Kamo, Y.; Taura, N.; Honda, T.; Shibata, H.; Milazzo, M.; Fornari, F.; Gramantieri, L.; Bolondi, L.; et al. Significance of serum and hepatic microRNA-122 levels in patients with non-alcoholic fatty liver disease. Liver Int. 2014, 34, e302–e307. [Google Scholar] [CrossRef]
- Yamada, H.; Ohashi, K.; Suzuki, K.; Munetsuna, E.; Ando, Y.; Yamazaki, M.; Ishikawa, H.; Ichino, N.; Teradaira, R.; Hashimoto, S. Longitudinal study of circulating miR-122 in a rat model of non-alcoholic fatty liver disease. Clin. Chim. Acta 2015, 446, 267–271. [Google Scholar] [CrossRef] [PubMed]
- Blaya, D.; Aguilar-Bravo, B.; Hao, F.; Casacuberta-Serra, S.; Coll, M.; Perea, L.; Vallverdú, J.; Graupera, I.; Pose, E.; Llovet, L.; et al. Expression of microRNA-155 in inflammatory cells modulates liver injury. Hepatology 2018, 68, 691–706. [Google Scholar] [CrossRef]
- Expert Panel on Detection, Evaluation, and Treatment of High Blood Cholesterol in Adults. Executive Summary of the Third Report of the National Cholesterol Education Program (NCEP): Expert panel on detection, evaluation, and treatment of high blood cholesterol in adults (adults treatment panel III). J. Am. Med. Assoc. 2001, 285, 2486–2497. [Google Scholar] [CrossRef]
- Matthews, D.R.; Hosker, J.P.; Rudenski, A.S.; Naylor, B.A.; Treacher, D.F.; Turner, R.C. Homeostasis model assessment: Insulin resistance and β-cell function from fasting plasma glucose and insulin concentrations in man. Diabetologia 1985, 28, 412–419. [Google Scholar] [CrossRef]
- Sterling, R.K.; Lissen, E.; Clumeck, N.; Sola, R.; Correa, M.C.; Montaner, J.; Sulkowski, M.S.; Torriani, F.J.; Dieterich, D.T.; Thomas, D.L.; et al. Development of a simple noninvasive index to predict significant fibrosis in patients with HIV/HCV coinfection. Hepatology 2006, 43, 1317–1325. [Google Scholar] [CrossRef]
- Gennarino, V.A.; Sardiello, M.; Avellino, R.; Meola, N.; Maselli, V.; Anand, S.; Cutillo, L.; Ballabio, A.; Banfi, S. MicroRNA target prediction by expression analysis of host genes. Genome Res. 2008, 19, 481–490. [Google Scholar] [CrossRef]
- Schmittgen, T.D.; Livak, K.J. Analyzing real-time PCR data by the comparative CT method. Nat. Protoc. 2008, 3, 1101–1108. [Google Scholar] [CrossRef] [PubMed]
- Cassinotto, C.; Boursier, J.; De Lédinghen, V.; Lebigot, J.; Lapuyade, B.; Cales, P.; Hiriart, J.B.; Michalak, S.; Bail, B.L.; Cartier, V.; et al. Liver stiffness in nonalcoholic fatty liver disease: A comparison of supersonic shear imaging, FibroScan, and ARFI with liver biopsy. Hepatology 2016, 63, 1817–1827. [Google Scholar] [CrossRef] [PubMed]
- Kleiner, D.E.; Brunt, E.M.; Van Natta, M.; Behling, C.; Contos, M.J.; Cummings, O.W.; Ferrell, L.D.; Liu, Y.-C.; Torbenson, M.S.; Unalp-Arida, A.; et al. Design and validation of a histological scoring system for nonalcoholic fatty liver disease. Hepatology 2005, 41, 1313–1321. [Google Scholar] [CrossRef] [PubMed]
- Du, X.; Yang, Y.; Xu, C.; Peng, Z.; Zhang, M.; Lei, L.; Gao, W.; Dong, Y.; Shi, Z.; Sun, X.; et al. Upregulation of miR-181a impairs hepatic glucose and lipid homeostasis. Oncotarget 2017, 8, 91362–91378. [Google Scholar] [CrossRef]
- Li, H.; Zhang, P.; Sun, X.; Sun, Y.; Shi, C.; Liu, H.; Liu, X. MicroRNA-181a regulates epithelial-mesenchymal transition by targeting PTEN in drug-resistant lung adenocarcinoma cells. Int. J. Oncol. 2015, 47, 1379–1392. [Google Scholar] [CrossRef]
- Gori, M.; Arciello, M.; Balsano, C. MicroRNAs in Nonalcoholic Fatty Liver Disease: Novel Biomarkers and Prognostic Tools during the Transition from Steatosis to Hepatocarcinoma. BioMed Res. Int. 2014, 2014, 1–14. [Google Scholar] [CrossRef]
- Gupta, P.; Sata, T.N.; Yadav, A.K.; Mishra, A.; Vats, N.; Hossain, M.; Sanal, M.G.; Venugopal, S.K. TGF-β induces liver fibrosis via miRNA-181a-mediated down regulation of augmenter of liver regeneration in hepatic stellate cells. PLoS ONE 2019, 14, e0214534. [Google Scholar] [CrossRef]
- Younes, R.; Caviglia, G.P.; Govaere, O.; Rosso, C.; Armandi, A.; Sanavia, T.; Pennisi, G.; Liguori, A.; Francione, P.; Gallego-Durán, R.; et al. Long-term outcomes and predictive ability of non-invasive scoring systems in patients with non-alcoholic fatty liver disease. J. Hepatol. 2021, 3, 1. [Google Scholar] [CrossRef]
- Pérez-Gutiérrez, O.Z.; Hernández-Rocha, C.; Candia-Balboa, R.A.; Arrese, M.A.; Benítez, C.; Brizuela-Alcántara, D.C.; Méndez-Sánchez, N.; Uribe, M.; Chávez-Tapia, N.C. Validation study of systems for noninvasive diagnosis of fibrosis in nonalcoholic fatty liver disease in Latin population. Ann. Hepatol. 2013, 12, 416–424. [Google Scholar] [CrossRef]
- Jiang, W.; Huang, S.; Teng, H.; Wang, P.; Wu, M.; Zhou, X.; Ran, H. Diagnostic accuracy of point shear wave elastography and transient elastography for staging hepatic fibrosis in patients with non-alcoholic fatty liver disease: A meta-analysis. BMJ Open 2018, 8, e021787. [Google Scholar] [CrossRef] [PubMed]
- Mazo, D.F.; Malta, F.M.; Stefano, J.T.; Salles, A.P.M.; Gomes-Gouvea, M.S.; Nastri, A.C.S.; Almeida, J.R.; Pinho, J.R.R.; Carrilho, F.J.; Oliveira, C.P. Validation of PNPLA3 polymorphisms as risk factor for NAFLD and liver fibrosis in an admixed population. Ann. Hepatol. 2019, 18, 466–471. [Google Scholar] [CrossRef] [PubMed]
- Tovo, C.V.; Villela-Nogueira, C.A.; Leite, N.C.; Panke, C.L.; Port, G.Z.; Fernandes, S.; Buss, C.; Coral, G.P.; Cardoso, A.C.; Cravo, C.M.; et al. Transient hepatic elastography has the best performance to evaluate liver fibrosis in non-alcoholic fatty liver disease (NAFLD). Ann. Hepatol. 2019, 18, 445–449. [Google Scholar] [CrossRef]
- Boursier, J.; Vergniol, J.; Guillet, A.; Hiriart, J.-B.; Lannes, A.; Le Bail, B.; Michalak, S.; Chermak, F.; Bertrais, S.; Foucher, J.; et al. Diagnostic accuracy and prognostic significance of blood fibrosis tests and liver stiffness measurement by FibroScan in non-alcoholic fatty liver disease. J. Hepatol. 2016, 65, 570–578. [Google Scholar] [CrossRef] [PubMed]
- Yamada, H.; Suzuki, K.; Ichino, N.; Ando, Y.; Sawada, A.; Osakabe, K.; Sugimoto, K.; Ohashi, K.; Teradaira, R.; Inoue, T.; et al. Associations between circulating microRNAs (miR-21, miR-34a, miR-122 and miR-451) and non-alcoholic fatty liver. Clin. Chim. Acta 2013, 424, 99–103. [Google Scholar] [CrossRef]
- Sun, C.; Huang, F.; Liu, X.; Xiao, X.; Yang, M.; Hu, G.; Liu, H.; Liao, L. miR-21 regulates triglyceride and cholesterol metabolism in non-alcoholic fatty liver disease by targeting HMGCR. Int. J. Mol. Med. 2015, 35, 847–853. [Google Scholar] [CrossRef] [PubMed]


| Characteristic | Total | Fibrosis | p Value | |
|---|---|---|---|---|
| F0/F1 | F2–F4 | |||
| n (%) | n (%) | n (%) | ||
| n = 108 | n = 62 | n = 46 | ||
| Sex | 0.567 1 | |||
| Male | 23 (21.3%) | 12 (19.4%) | 11 (23.9%) | |
| Female | 85 (78.7%) | 50 (80.6%) | 35 (76.1%) | |
| Age (years) | 0.634 3 | |||
| Mean (SD) | 56.8 ± 9.4 | 56.8 ± 8.2 | 56.7 ± 10.9 | |
| Med (min-max) | 58 (27–74) | 58 (33–69) | 60.5 (27–74) | |
| Type 2 diabetes | 70 (67.3%) | 36 (60.0%) | 34 (77.3%) | 0.064 1 |
| Dyslipidemia | 81 (77.9%) | 52 (86.7%) | 29 (65.9%) | 0.012 1 |
| Hypertension | 68 (66.0%) | 39 (66.1%) | 29 (65.9%) | 0.984 1 |
| BMI (kg/m2) | ||||
| Mean (SD) | 32.2 ± 5.8 | 33.2 ± 6.1 | 31.0 ± 5.1 | 0.090 4 |
| Normal | 6 (6.3%) | 3 (5.3%) | 3 (7.7%) | 0.300 2 |
| Overweight | 25 (26.0%) | 12 (21.1%) | 13 (33.3%) | |
| Obese | 65 (67.7%) | 42 (73.7%) | 23 (59.0%) | |
| Fasting blood glucose | 0.053 3 | |||
| Mean (SD) | 118.9 ± 40.3 | 114.7 ± 42.4 | 124.7 ± 37.0 | |
| Med (min-max) | 105.5 (73–273) | 100 (73–273) | 109 (79–220) | |
| Insulin | 0.548 3 | |||
| Mean (SD) | 21.4 ± 14.2 | 21.5 ± 15.7 | 21.2 ± 11.9 | |
| Med (min-max) | 18.3 (3.7–70.5) | 17.4 (5.7–70.5) | 19.8 (3.7–63.4) | |
| Insulin resistance index (HOMA) | 0.182 3 | |||
| Mean (SD) | 6.4 ± 5.0 | 6.3 ± 5.6 | 6.5 ± 4.1 | |
| Med (min-max) | 4.9 (0.8–23) | 4.4 (1.2–23) | 5.7 (0.8–17.3) | |
| Metabolic syndrome | 83 (80.6%) | 47 (78.3%) | 36 (83.7%) | 0.495 1 |
| Aspartate aminotransferase | <0.001 3 | |||
| Mean (SD) | 40.7 ± 37.6 | 28.4 ± 18.3 | 57.1 ± 49.1 | |
| Med (min-max) | 32 (10–248) | 23 (10–141) | 41 (13–248) | |
| Alanine aminotransferase | <0.001 3 | |||
| Mean (SD) | 52.2 ± 51.9 | 37.5 ± 23.5 | 71.8 ± 70.4 | |
| Med (min-max) | 38 (13–479) | 29 (13–149) | 52.5 (19–479) | |
| Gamma-glutamyl transferase | 0.044 3 | |||
| Mean (SD) | 91.0 ± 99.6 | 68.9 ± 65.4 | 120.8 ± 127.2 | |
| Med (min-max) | 54 (12–476) | 45 (12–389) | 67.5 (13–476) | |
| Total cholesterol | 0.729 4 | |||
| Mean (SD) | 194.4 ± 46.5 | 193 ± 45.1 | 196.2 ± 48.7 | |
| Med (min-max) | 189 (86–313) | 193 (86–293) | 189 (95–313) | |
| HDL cholesterol | 0.049 3 | |||
| Mean (SD) | 47.0 ± 12.9 | 49 ± 13.4 | 44.3 ± 11.8 | |
| Med (min-max) | 45 (24–100) | 48 (25–100) | 42.5 (24–75) | |
| LDL cholesterol | 0.370 4 | |||
| Mean (SD) | 115.7 ± 41.0 | 112.5 ± 36.4 | 120 ± 46.6 | |
| Med (min-max) | 114 (22–245) | 114 (32–207) | 112 (22–245) | |
| Triglycerides | 0.219 3 | |||
| Mean (SD) | 162.8 ± 68.7 | 154.8 ± 64.6 | 173.6 ± 73.4 | |
| Med (min-max) | 151 (50–433) | 141 (50–319) | 156.5 (74–433) | |
| Albumin | 0.753 4 | |||
| Mean (SD) | 4.63 ± 0.3 | 4.6 ± 0.3 | 4.6 ± 0.3 | |
| Med (min-max) | 4.6 (3.9–5.2) | 4.7 (3.9–5.2) | 4.6 (4–5.1) | |
| Platelets | 0.034 3 | |||
| Mean (SD) | 239.4 ± 69.1 | 254.3 ± 61.8 | 220.4 ± 73.9 | |
| Med (min-max) | 245 (92–484) | 248 (146–484) | 218.5 (92–385) | |
| Characteristic | Total | Fibrosis | p b | |
|---|---|---|---|---|
| (n = 108) | F0/F1 (n = 62) | F2–F4 (n = 46) | ||
| miRNA-21 | 0.14 (0–37.98) | 0.14 (0–37.98) | 0.12 (0–16.34) | 0.2033 |
| miRNA-29a | 0.02 (0–3.55) | 0.02 (0–3.55) | 0.03 (0–3.18) | 0.7513 |
| miRNA-122 | 0.02 (0–5.72) | 0.02 (0–0.37) | 0.02 (0–5.72) | 0.5133 |
| miRNA-155 | 0.004 (0–8.74) | 0.004 (0–0.40) | 0.003 (0–8.74) | 0.9543 |
| miRNA-181a | 0.003 (0–1.07) | 0.004 (0–0.39) | 0.002 (0–1.07) | 0.0173 |
| miRNA | n | FIB-4 Categorization | Median (IQR) | p Value 1 |
|---|---|---|---|---|
| miRNA-21 | 54 | <1.3 (absence of significant fibrosis) | 0.143 (0.427–0.015) | 0.778 |
| 26 | 1.3–2.67 (indeterminate) | 0.131 (0.417–0.027) | ||
| 9 | >2.67 (presence of advanced fibrosis) | 0.063 (0.927–0.006) | ||
| miRNA-29a | 54 | <1.3 (absence of significant fibrosis) | 0.025 (0.061–0.008) | 0.602 |
| 26 | 1.3–2.67 (indeterminate) | 0.017 (0.094–0.006) | ||
| 9 | >2.67 (presence of advanced fibrosis) | 0.008 (0.071–0.004) | ||
| miRNA-122 | 53 | <1.3 (absence of significant fibrosis) | 0.017 (0.047–0.005) | 0.688 |
| 26 | 1.3–2.67 (indeterminate) | 0.011 (0.046–0.002) | ||
| 9 | >2.67 (presence of advanced fibrosis) | 0.014 (0.058–0.004) | ||
| miRNA-155 | 53 | <1.3 (absence of significant fibrosis) | 0.004 (0.012–0.001) | 0.630 |
| 26 | 1.3–2.67 (indeterminate) | 0.003 (0.007–0.001) | ||
| 9 | >2.67 (presence of advanced fibrosis) | 0.002 (0.010–0.0003) | ||
| miRNA-181a | 52 | <1.3 (absence of significant fibrosis) | 0.004 (0.014–0.001) | 0.277 |
| 26 | 1.3–2.67 (indeterminate) | 0.002 (0.009–0.001) | ||
| 9 | >2.67 (presence of advanced fibrosis) | 0.001 (0.019–0.0003) |
| miRNA | n | NFS Categorization | Median (IQR) | p Value 1 |
|---|---|---|---|---|
| miRNA-21 | 24 | <−1.45 (absence of significant fibrosis) | 0.164 (0.685–0.119) | 0.603 |
| 38 | −1.45–0.675 (indeterminate) | 0.137 (0.512–0.051) | ||
| 2 | >0.675 (presence of advanced fibrosis) | 0.179 (NA–0.001) | ||
| miRNA-29a | 24 | <−1.45 (absence of significant fibrosis) | 0.030 (0.055–0.012) | 0.987 |
| 38 | −1.45–0.675 (indeterminate) | 0.026 (0.098–0.007) | ||
| 2 | >0.675 (presence of advanced fibrosis) | 0.038 (NA–0.007) | ||
| miRNA-122 | 24 | <−1.45 (absence of significant fibrosis) | 0.018 (0.044–0.010) | 0.999 |
| 37 | −1.45–0.675 (indeterminate) | 0.023 (0.048–0.005) | ||
| 2 | >0.675 (presence of advanced fibrosis) | 0.038 (NA–0.003) | ||
| miRNA-155 | 34 | <−1.45 (absence of significant fibrosis) | 0.003 (0.010–0.001) | 0.518 |
| 37 | −1.45–0.675 (indeterminate) | 0.005 (0.013–0.001) | ||
| 2 | >0.675 (presence of advanced fibrosis) | 0.007 (NA–0.002) | ||
| miRNA-181a | 24 | <−1.45 (absence of significant fibrosis) | 0.004 (0.012–0.002) | 0.865 |
| 37 | −1.45–0.675 (indeterminate) | 0.003 (0.009–0.001) | ||
| 2 | >0.675 (presence of advanced fibrosis) | 0.014 (NA–0.0003) |
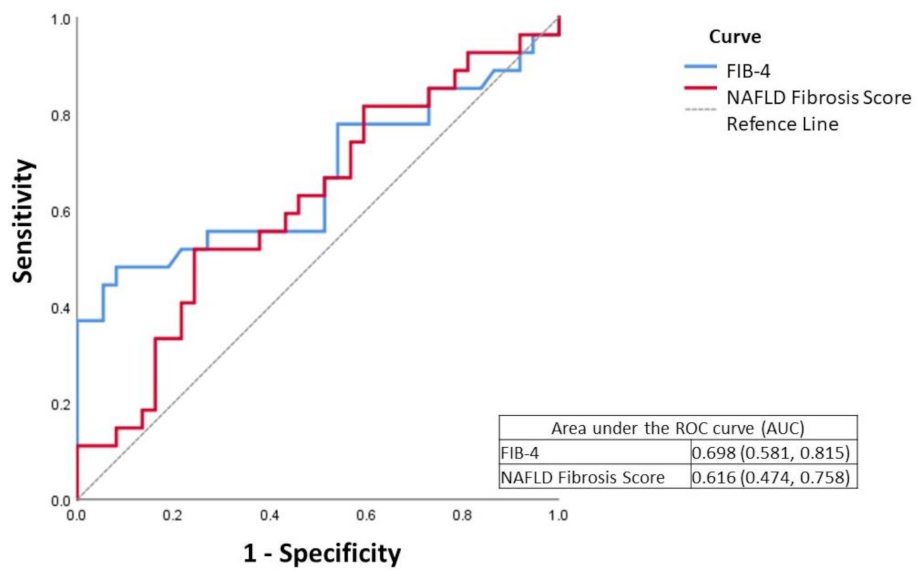
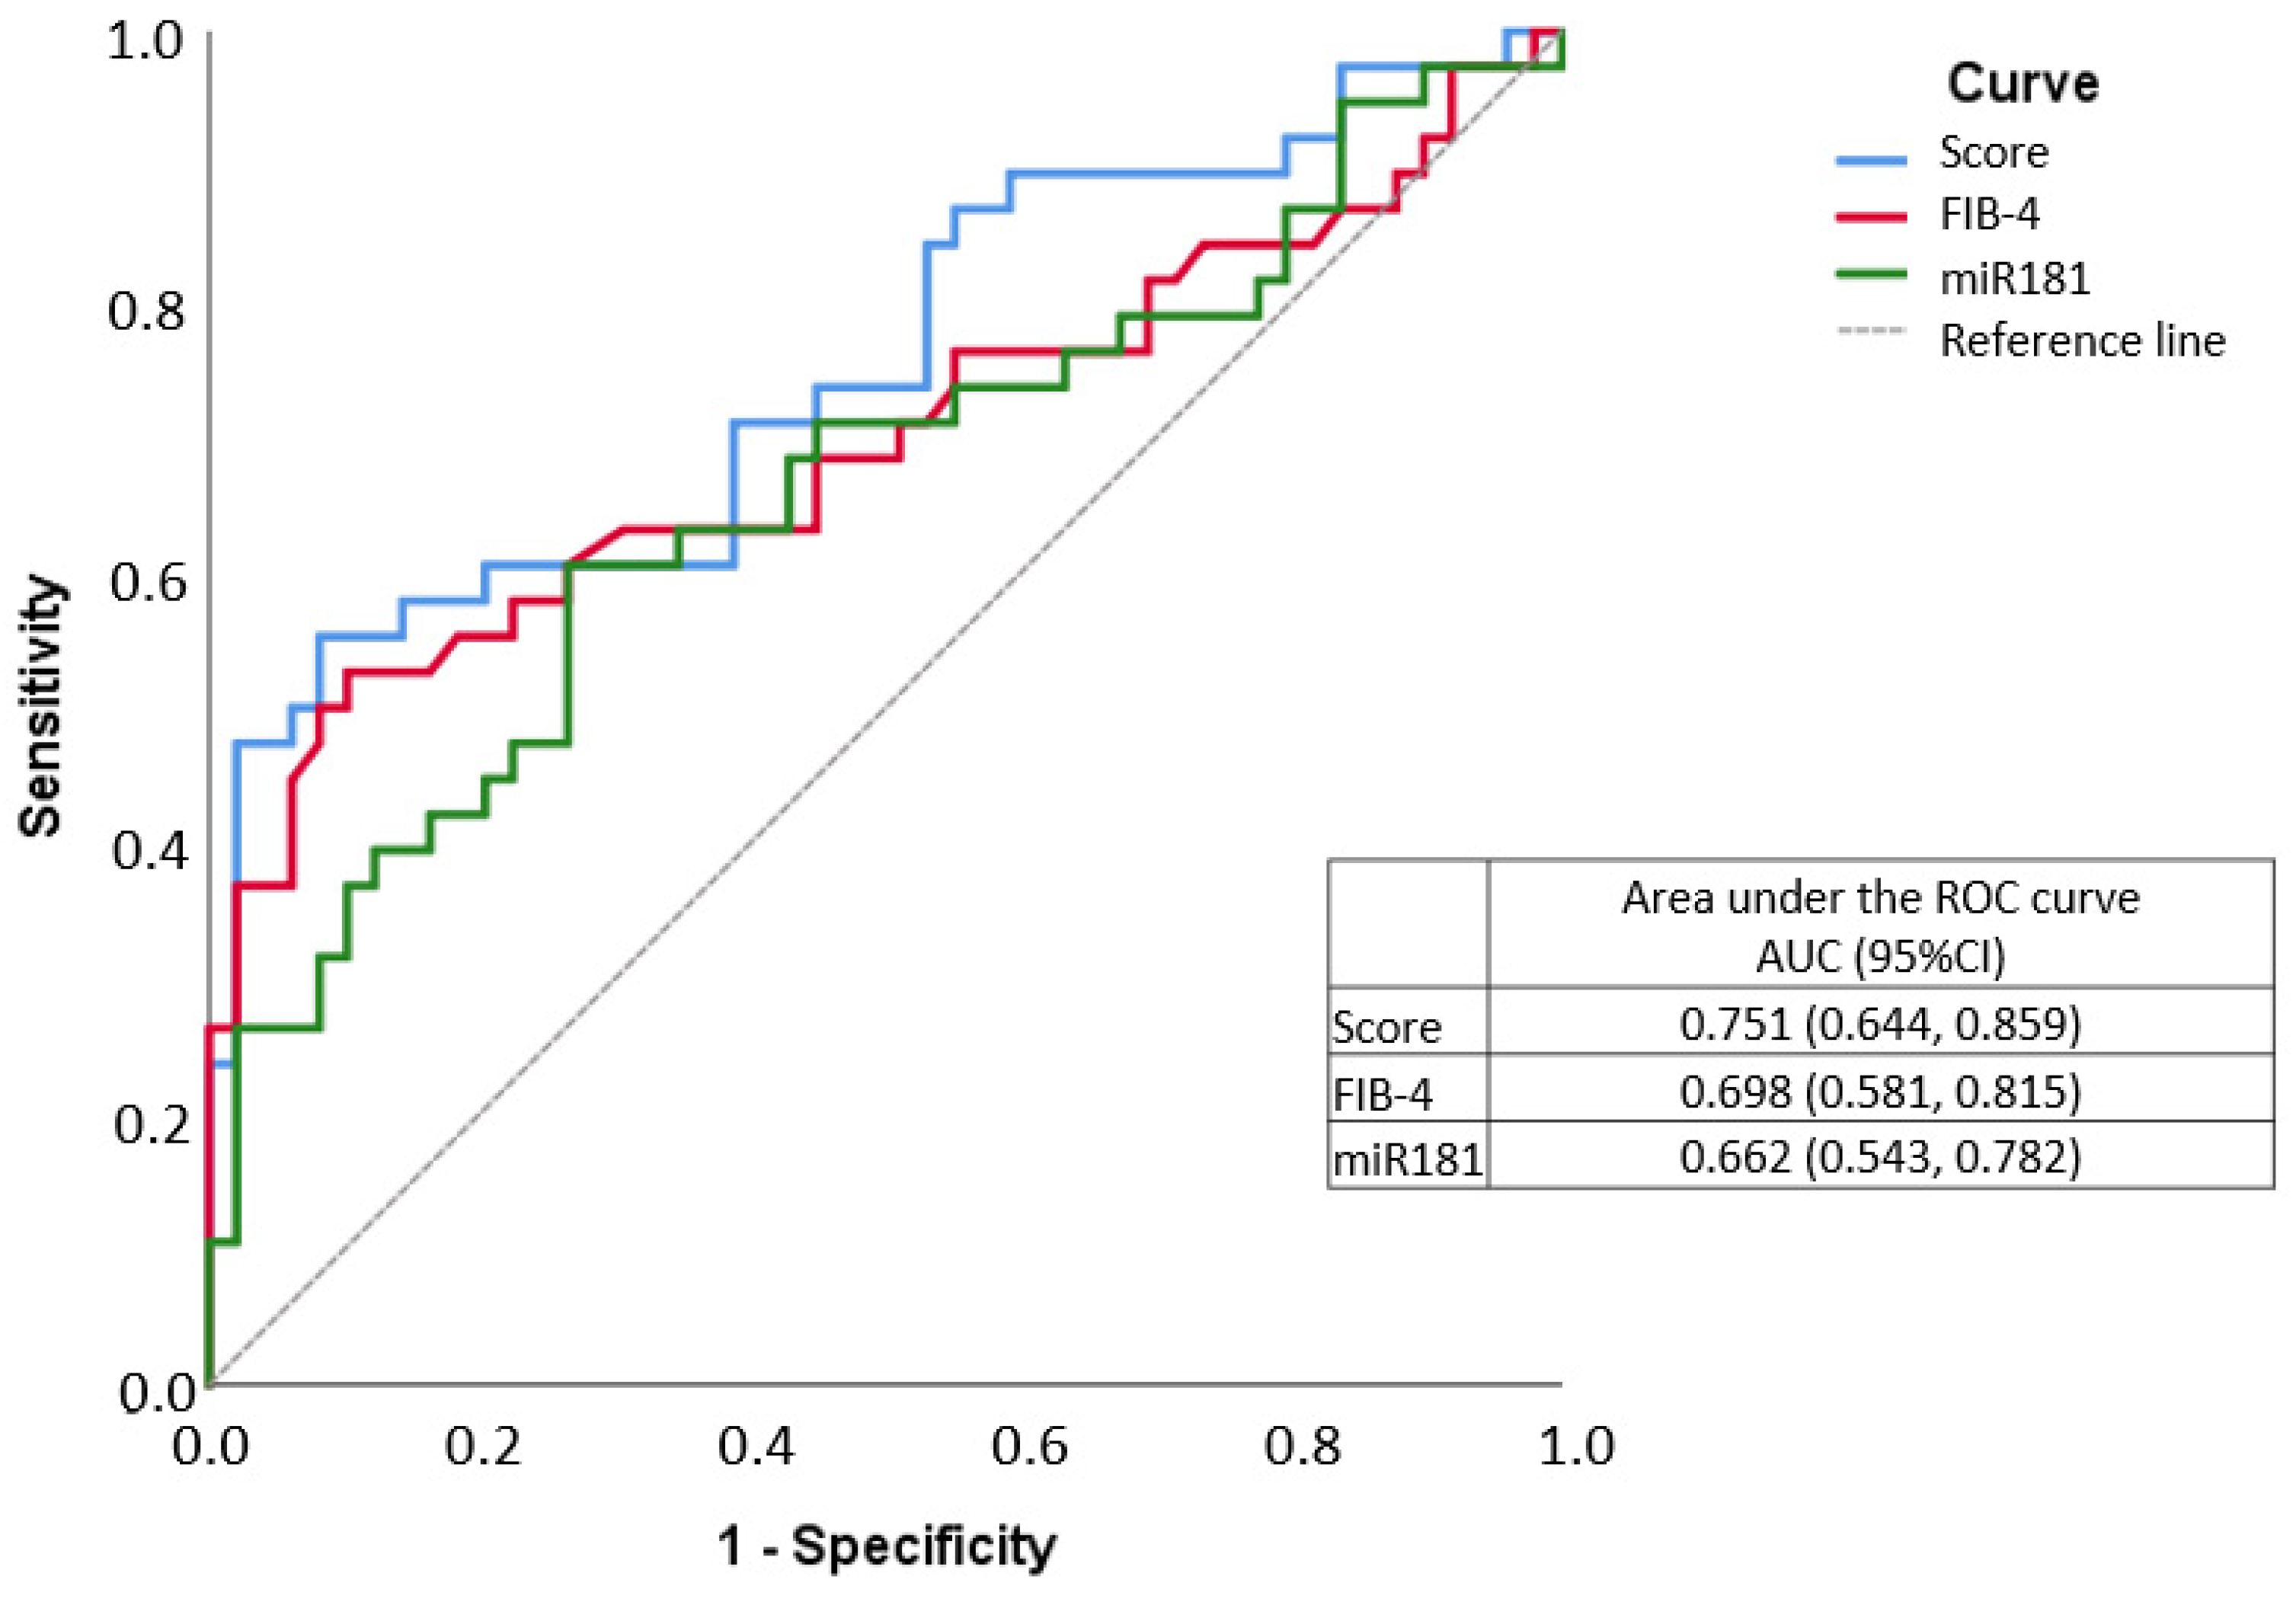
| Equation Variables | β | S.E. | OR (IC95%) | p |
|---|---|---|---|---|
| FIB-4 | 1.334 | 0.433 | 3.8 (1.63–8.87) | <0.01 |
| Ln(miR-181) | −0.269 | 0.138 | 1.31 (1–1.72) | 0.05 |
| Constant | −3.641 | 1.013 |
| Correlation (r) 1 | miRNA-21 | miRNA-29 | mirRNA-122 | miRNA-155 | miRNA-181 |
|---|---|---|---|---|---|
| p2 Value | |||||
| NAFLD activity score (NAS) | −0.048 | 0.007 | 0.061 | −0.005 | −0.075 |
| 0.622 | 0.942 | 0.533 | 0.958 | 0.449 |
Publisher’s Note: MDPI stays neutral with regard to jurisdictional claims in published maps and institutional affiliations. |
© 2021 by the authors. Licensee MDPI, Basel, Switzerland. This article is an open access article distributed under the terms and conditions of the Creative Commons Attribution (CC BY) license (https://creativecommons.org/licenses/by/4.0/).
Share and Cite
Lima, R.V.C.; Stefano, J.T.; Malta, F.d.M.; Pinho, J.R.R.; Carrilho, F.J.; Arrese, M.; Oliveira, C.P. Ability of a Combined FIB4/miRNA181a Score to Predict Significant Liver Fibrosis in NAFLD Patients. Biomedicines 2021, 9, 1751. https://doi.org/10.3390/biomedicines9121751
Lima RVC, Stefano JT, Malta FdM, Pinho JRR, Carrilho FJ, Arrese M, Oliveira CP. Ability of a Combined FIB4/miRNA181a Score to Predict Significant Liver Fibrosis in NAFLD Patients. Biomedicines. 2021; 9(12):1751. https://doi.org/10.3390/biomedicines9121751
Chicago/Turabian StyleLima, Rodrigo Vieira Costa, José Tadeu Stefano, Fernanda de Mello Malta, João Renato Rebello Pinho, Flair José Carrilho, Marco Arrese, and Claudia P. Oliveira. 2021. "Ability of a Combined FIB4/miRNA181a Score to Predict Significant Liver Fibrosis in NAFLD Patients" Biomedicines 9, no. 12: 1751. https://doi.org/10.3390/biomedicines9121751
APA StyleLima, R. V. C., Stefano, J. T., Malta, F. d. M., Pinho, J. R. R., Carrilho, F. J., Arrese, M., & Oliveira, C. P. (2021). Ability of a Combined FIB4/miRNA181a Score to Predict Significant Liver Fibrosis in NAFLD Patients. Biomedicines, 9(12), 1751. https://doi.org/10.3390/biomedicines9121751