Article

ATT-Myc Transgenic Mouse Model and Gene Expression Identify Genotoxic and Non-Genotoxic Chemicals That Accelerating Liver Tumor Growth in Short-Term Toxicity

by
Mahmoud Elalfy
1,*,
Jürgen Borlak
2,
Ahmed Jaafar Aljazzar
3 and
Mona G. Elhadidy
4,5
1
Clinical Science Department, College of Veterinary Medicine, King Faisal University, Al-Ahsa 3959-36362, Saudi Arabia
2
Pharmaco- and Toxicogenomics Research Institute, Hannover Medical School, 30625 Hannover, Germany
3
Pathology Department, College of Veterinary Medicine, King Faisal University, Al-Ahsa 3959-36362, Saudi Arabia
4
Medical Physiology, Faculty of Medicine, Mansoura University, Mansoura City 35516, Egypt
5
Medical Physiology, Faculty of Medicine, Al-Baha University, Alaqiq 65779-7738, Saudi Arabia
*
Author to whom correspondence should be addressed.
Biomedicines 2025, 13(3), 743; https://doi.org/10.3390/biomedicines13030743
Submission received: 14 January 2025 / Revised: 27 February 2025 / Accepted: 28 February 2025 / Published: 18 March 2025
(This article belongs to the Section Molecular and Translational Medicine)

Abstract

:
Introduction: Diethyl nitrosamine (DEN), a known carcinogen, has been used for validating the RasH2 and P53 transgenic models in chemical testing and has been shown to enhance primary liver tumor growth in the ATT-Myc transgenic mouse model of liver cancer. Material and Methods: to better understand the mechanism of hepatocellular carcinoma acceleration following DEN, BHT and vehicles treatments in ATT-Myc, transgenic and non-transgenic, mice. We employed an exon array, RT-PCR, Western blotting, and IHC to investigate the complex interplay between the c-Myc transgene and other growth factors in treated mice versus control transgenic and non-transgenic mice. Results: Notably, DEN treatment induced a 12-fold increase in c-Myc expression compared to non-transgenic mice. Furthermore, tumor growth in the DEN group was strongly associated with increased proliferation of transformed or carcinogenic hepatocytes, as evidenced by proliferative cell nuclear antigen and bromodeoxyuridine expression. Internally, the loss of c-Met signaling, enriched transcription factors, and the diminished expression of antioxidants, such as superoxide dismutase (SOD1) and NRF2, further enhanced c-Myc-induced liver tumor growth as early as four months post-DEN treatment. Discussion: Extensive tumor growth was observed at 8.5 months, coinciding with the downregulation of tumor suppressors such as p53. In contrast, at these time points, ATT-Myc transgenic mice exhibited only dysplastic hepatocytes without tumor formation. Additionally, the antioxidant butylated hydroxytoluene maintained c-Met expression and did not promote liver tumor formation. Conclusions: the persistent upregulation of c-Myc in the ATT-Myc liver cancer model, at both the gene and protein levels following DEN treatment inhibited the ETS1 transcription factor, further exacerbating the decline of c-Met signaling, SOD1, and NRF2. These changes led to increased reactive oxygen species production and promoted rapid liver tumor growth.

1. Introduction

Death rates from hepatocellular carcinoma (HCC) are rising globally, with particularly high incidences in developing countries [1]. Significant progress has been made in the systemic treatment of advanced HCC over the last decade [2], especially in studying the tumor immune microenvironment and predicting HCC outcomes [3]. However, not all patients with HCC respond well to recently developed treatment approaches, and many exhibit therapeutic resistance [4].
Chemicals are often classified as carcinogens based on the presence of hepatocellular tumors in rat livers, which has significant implications. There is now greater potential to integrate the scientific understanding of the etiology of these tumors into hazard characterization and dose–response assessments, aligning them with human relevance frameworks [5]. Diethylnitrosamine (DEN) is a mutagenic and genotoxic agent that causes DNA alterations and gene expression changes, leading to liver cancer in experimental wild-type or transgenic animal models [6]. The mechanisms of DEN-induced chemical carcinogenesis have provided additional insights [7] into preventive and protective mechanisms against DEN exposure [8,9], although some aspects remain controversial. Understanding the biology of liver tumors is crucial for developing therapeutic agents and improving patient survival following chemical or surgical treatment [10].
Cyto-truncated c-Met transgene expression provides resistance to apoptotic stimuli in vivo and establishes immortalized, non-transformed hepatocyte cell lines [11]. The loss of c-Met signaling in c-Met conditional knockout animals accelerates DEN-induced liver tumor formation due to the compensatory high expression of epidermal growth factor receptor (EGFR) [9]. Conversely, DEN accelerates liver tumor growth in a hepatocyte growth factor (HGF) transgenic mouse model via c-Met activation [12]. The c-Myc transcription factor (TF) is a well-known oncogene due to its critical role in cancer and stem cell maintenance. Many frequently occurring human malignancies, including breast, colon, stomach, and pancreatic cancers, involve dysregulated c-Myc expression. Several human malignancies are influenced by c-Myc through its regulation of genes involved in mitochondrial and ribosomal synthesis, as well as glucose and glutamine metabolism [13]. Although c-Myc is expressed in various tissue tumors, few studies have explored anti-c-Myc antibody therapy for HCC [14]. Additionally, the use of herbal extracts containing quercetin as an active component has been investigated for directly targeting c-Myc by reducing reactive oxygen species (ROS) production [15] or inhibiting the release of exosomes from tumor cells under hypoxic conditions [16].
The goal of this study was to investigate the complex interplay of growth factors that enhance liver tumor formation in a c-Myc model treated with DEN. This research could contribute to the development of more effective HCC management protocols and potentially improve the survival rate for individuals suffering from HCC.

2. Materials and Methods

2.1. Laboratory Animals, Transgenicity, and Treatment

The Guide for the Care and Use of Laboratory Animals, eighth edition, National Academies Press, was followed for animal treatment. The study was approved by the Animal Welfare Ethics Commission of Hannover, Germany (33.9-42502-04-08/1619), as well as by the ethical committee of King Faisal University (KFU-25-ETHIC53114). The ATT-Myc transgenic line (c-myc model under alpha 1 antitrypsin promotor) was previously described by Dalemans et al. [17]. The transgenic mouse strain was of the C57BL/6 background. PCR was performed using HotStarTaq DNA polymerase (Qiagen, Germantown, MD, USA). Annealing temperatures and cycle numbers are indicated in brackets after each primer pair. The transgene was verified by a PCR analysis of DNA extracted from tail biopsies using the following forward and reverse primers: forward primer: 5′-TCCTGTACCTCGT-CCGATTC-3′; reverse primer: 5′-GTTGTGCTGGTGAG-TGGAGA-3′ (60 °C, 31 cycles) (see Figure 1). Chemical treatments—DEN, butylated hydroxytoluene (BHT), corn oil, and saline vehicle—including doses and exposure conditions, were described earlier [3,4,5]. BrdU (Sigma-Aldrich, Burlington, NJ, USA) was injected once at 100 mg/kg two hours before sacrifice [8]. Mice were sacrificed at four different time points (4, 5.5, 7, and 8.5 months). Animals were euthanized using excess CO2, and histopathological analysis was performed. The remaining animals were disposed of safely.

2.2. Sample Collection and Preparation

Six mice were anesthetized using CO2 overdose and sacrificed at 4, 5.5, 7, and 8.5 months. The thoracic cavity was opened using standard surgical procedures, and the liver was excised and rinsed with PBS. Organ weights were recorded, and tumors were inspected macroscopically before being separated from liver tissue. Liver samples were preserved in 4% buffered formalin or immediately frozen in liquid nitrogen.

2.3. Histology

Liver tissues from transgenic and control animals were fixed in 4% formaldehyde in PBS and embedded in paraffin following standard procedures. Paraffin-embedded tissues were sectioned into 3–5 µm slices and stained with hematoxylin and eosin (H&E).

2.4. Isolation of RNA from Liver Tissues and Exon Array Procedures and Analysis

NA was isolated from liver tissue as previously described Target Labeling Assay Manuals were strictly followed. The assay involved ribosomal RNA reduction, cDNA synthesis, cRNA hydrolysis, fragmentation, terminal labeling, hybridization, washing, and staining of microarray chips. The sample preparation included RNA reduction and cDNA synthesis, purification of double-stranded cDNA, synthesis of biotin-labeled cRNA, purification of biotin-labeled cRNA, fragmentation of biotin-labeled cRNA, hybridization of GeneChip® arrays, washing and staining of GeneChip® arrays, and scanning of GeneChip® arrays.

2.5. Interpretation of GeneChip® Data

Quality indicators were assessed to determine the reliability of GeneChip® results. The GeneChip® Operating Software (Microarray. Suite 5.0 software) generated reports listing key expression ratios, including noise values (Q), target signal values, scale factors (SF), and hybridization controls. The software also provided normalized expression values for probe sets.

2.6. Validation of Gene Expression by Real Time-PCR (RT-PCR)

Total RNA was purified using QIAzol reagent (Qiagen, Germany). RNA quality was assessed using a Nanodrop 2000 spectrophotometer (Thermo Fisher Scientific, Waltham, MA, USA). cDNA synthesis was performed using reverse transcriptase enzyme (Bioline, London, UK). cDNA amplification was conducted using a real-time PCR machine (ThermoScientific, Waltham, MA, USA). The reaction volume was 20 µL. The PCR program was set at 95 °C for two minutes, followed by 40 cycles of denaturation at 95 °C for 10 s and annealing/extension at 60 °C for 30 s. The primer sequences used are listed in Table 1. β-actin was utilized as a reference gene. All experiments were performed in triplicate. Relative gene expression was calculated using the ∆Ct method (Ct target gene—Ct housekeeping gene), and the 2−∆∆Ct method was utilized to determine fold changes (FCs) in gene expression. PCR products were imaged using a Kodak Image Station 440CF under UV light after agarose gel electrophoresis with ethidium bromide staining.

2.7. Western Blotting

Frozen liver tissue samples were lysed in lysis buffer 3 supplemented with protease inhibitors (Benzonase). Whole-cell lysates were obtained by homogenization using an ultrasonic processor, followed by centrifugation at 10,000 rpm and 20 °C for 20 min. The supernatant was recovered, and the protein content of the lysate was determined using the Bradford protein assay (Bio-Rad), with bovine serum albumin as the standard.
A total of 100 μg of total protein extract was separated on 8%, 12%, and 15% SDS–polyacrylamide gels and subsequently blotted onto a PVDF membrane using 25 mM Tris and 190 mM glycine at 4 °C for two hours at 350 mA. Blots were blocked in Rotiblock (Roth, Karlsruhe, Germany) for one hour and then incubated with the primary antibodies listed in Table 2. After washing with Tris-buffered saline (25 mM Tris and 135 mM NaCl; pH 7.6) containing 0.1% Tween, the membranes were incubated with the corresponding secondary anti-mouse IgG κ antibody (sc-516102, Santa Cruz) at room temperature for one hour.
Following extensive washing, the blot was developed using enhanced chemiluminescent detection (Perkin-Elmer, Juegesheim, Germany) and recorded using a Kodak IS 440CF imaging system (Kodak; Biostep GmbH, Jahnsdorf, Germany). GAPDH was used as a reference protein. All experiments were performed in triplicate.

2.8. Immunohistochemistry

After embedding in paraffin, fixed liver tissue was sectioned at a distance of 4–5 mm. The sections were de-paraffinized, rehydrated, and heated to boiling in 0.01 M citrate buffer (pH 6.0) in a microwave oven. After the portions boiled, they were cooked for a further 15 min on low heat. After that, the portions were blocked for 10 min at room temperature using 1.5% normal serum. The antisera c-Myc, c-Met, proliferative cell nuclear antigen (PCNA), and bromodeoxyuridine (BrdU) are included in Table 3 of the antibody list. The following 1:200 dilutions of antisera were used to incubate the liver sections for a whole night at room temperature. The DAKO Staining System was then used to visualize immunoreactivity (shown in brown) to the corresponding protein in accordance with the manufacturer’s instructions. Normal rabbit or goat IgG was used in place of a primary antibody in the negative control sections for the anti-PCNA and anti-BrdU antisera. We used Mayer’s hematoxylin as a counterstain for the sections. An Axiom vision light microscope and a Nikon DXM1200F digital camera were then employed to take pictures of the sections.

2.9. Statistical Analysis

The study utilized a mixed model analysis of variance to compare six hybridizations of DEN treatments with six hybridizations of BHT at the age of 8.5 months. Exon array expression was normalized to the control non-transgenic background on the MouseExon10ST array. The analysis was conducted using XRAY software (version 3.2). Gene expression probes were normalized against historical data. FCs were considered significant at p ≤ 0.05, and the Student’s t-test was used for statistical analysis.

3. Results

3.1. Acceleration of Tumor Growth in ATT-Myc Transgenic Mice Treated with DEN

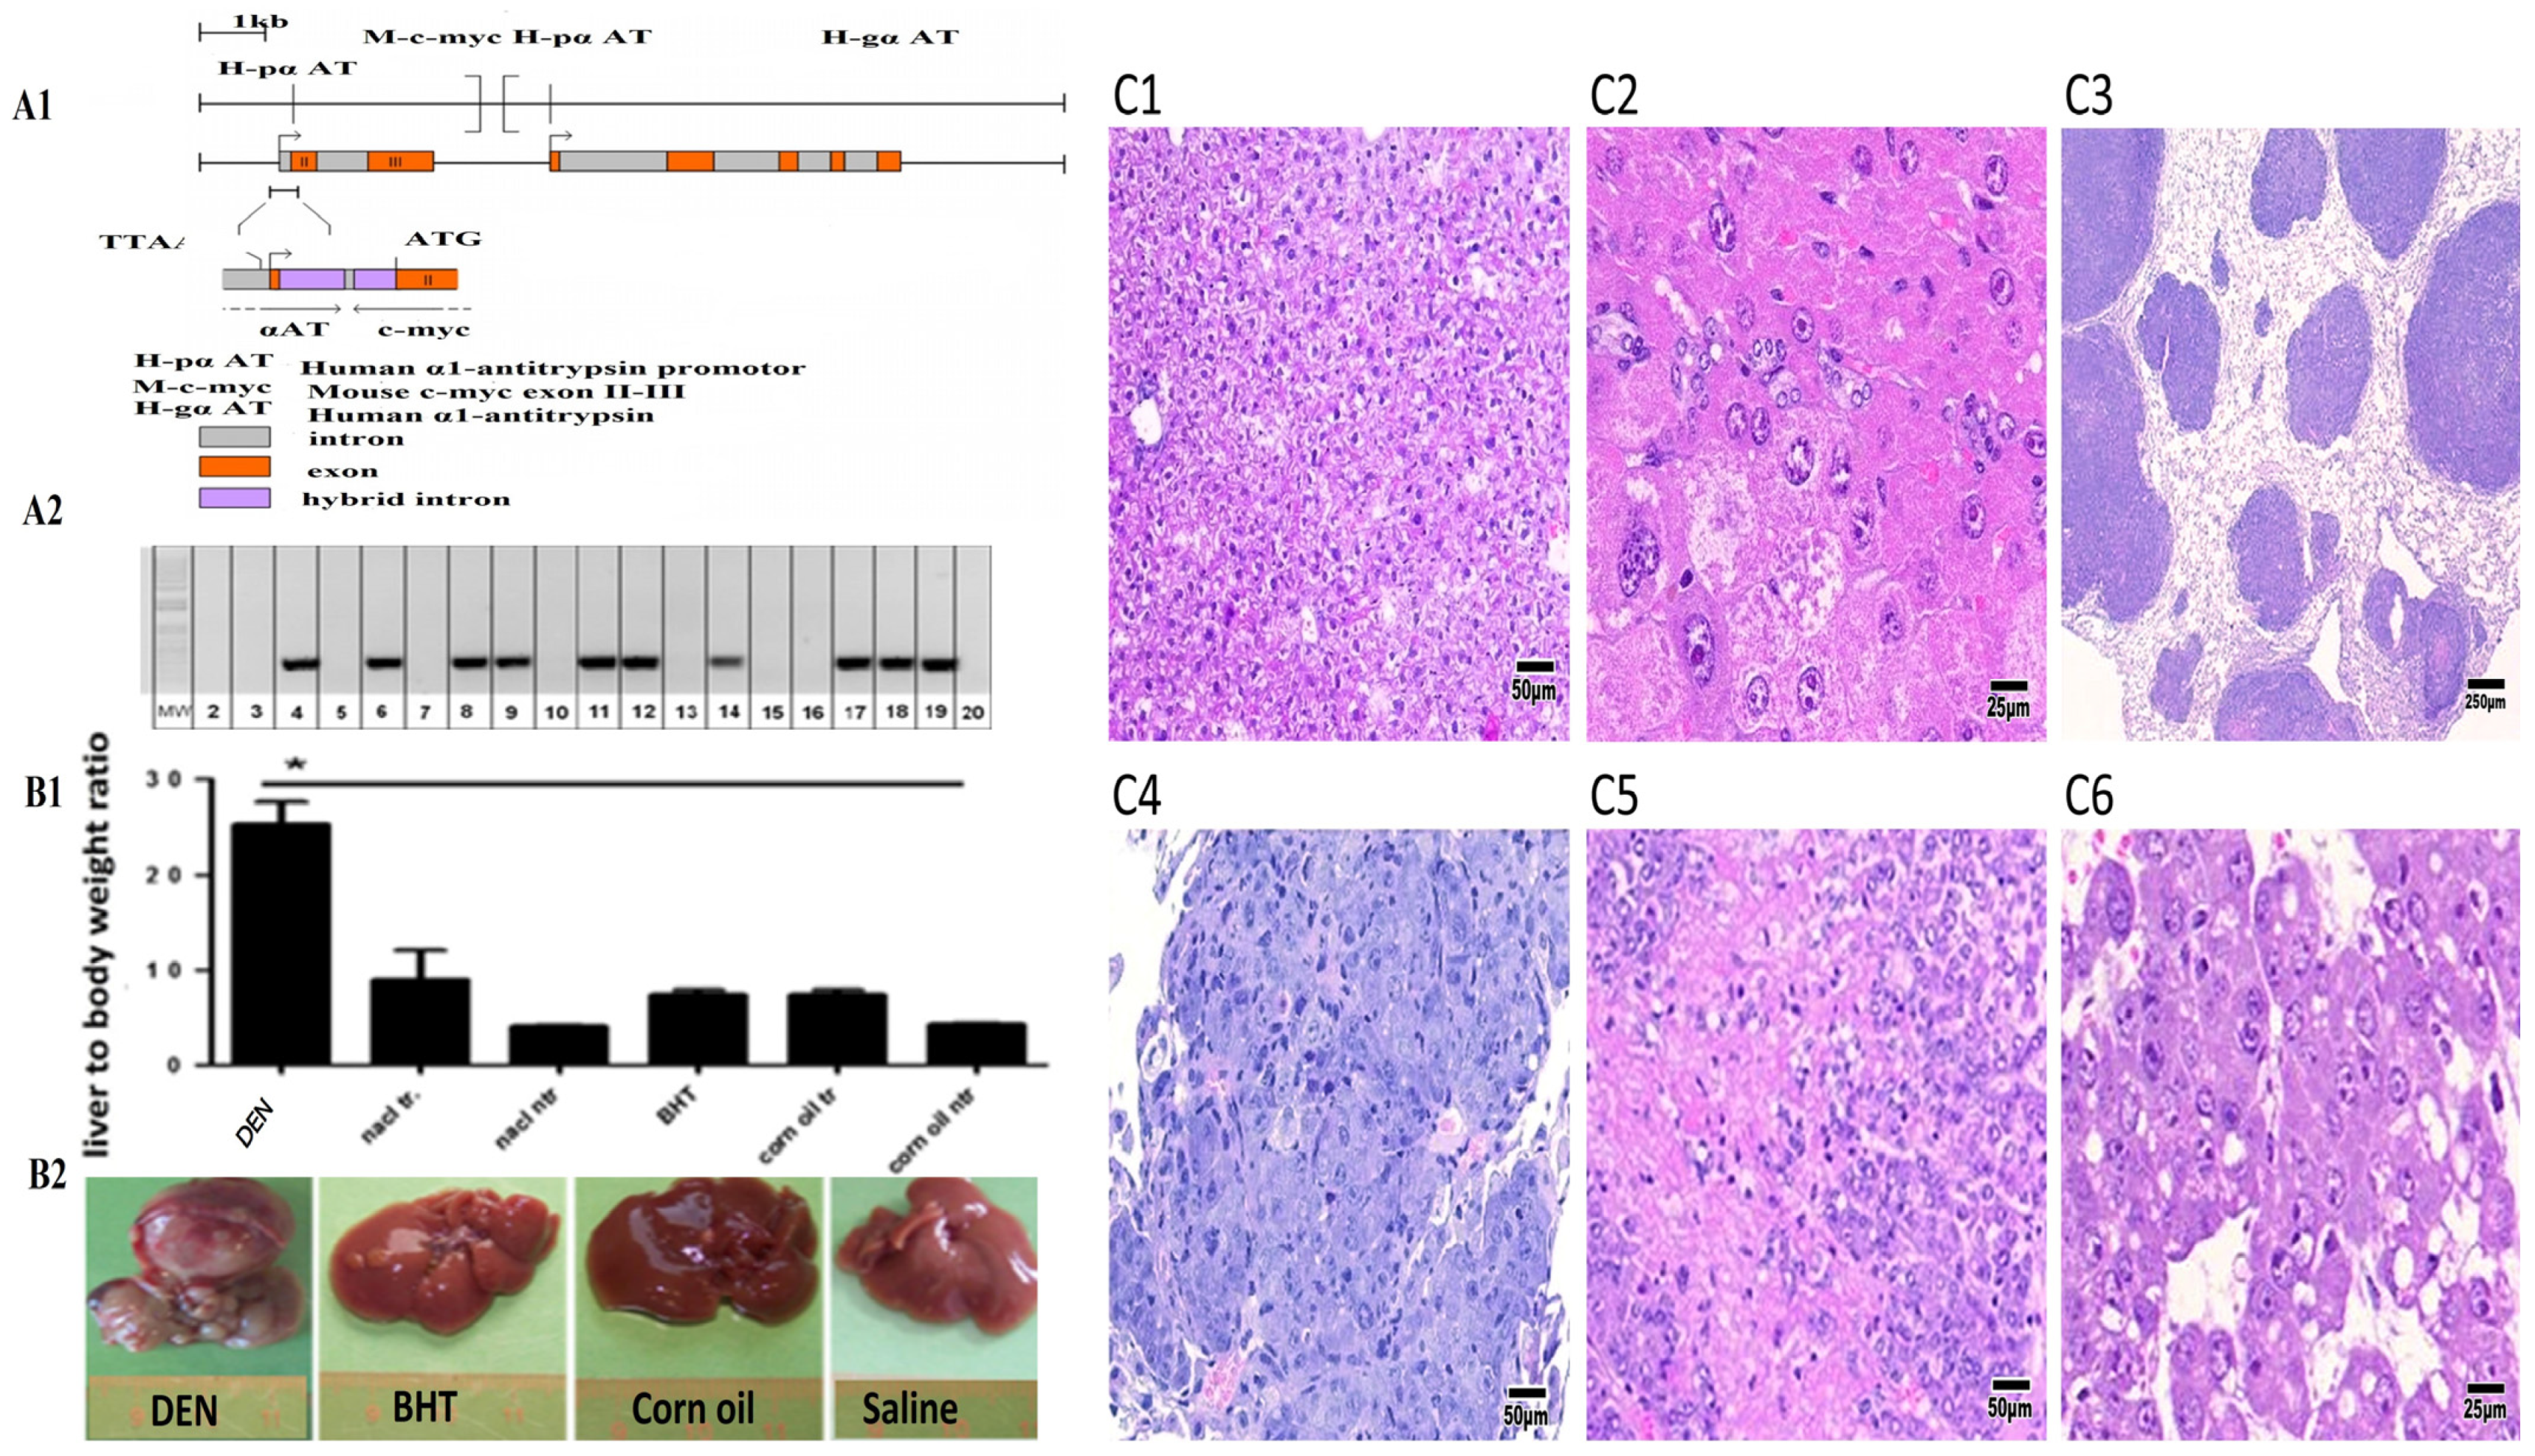
Figure 1A1,A2 presents the construction of an ATT-Myc mouse model of liver cancer and the expression of the c-Myc transgene as a PCR product in gel electrophoresis. The ratio of liver weight to body weight was significantly increased in 5.5–8.5-month-old ATT-Myc transgenic mice treated with DEN compared with transgenic mice treated with saline, BHT, or paracetamol. This increase in liver weight was due to rapid tumor growth, which is also shown in the overall image (see Figure 1B1,B2).
Notably, the liver parenchyma of non-transgenic mice showed no discernible alterations, with intact bile ducts, vasculature, and lobular architecture. Only a small percentage of transgenic animals exhibited uni- or multi-focal dysplastic liver nodules, affecting 10–80% of the liver parenchyma, with nodule sizes ranging from 1 to 10 mm. The hepatocytes in these foci displayed a nodular architecture, uni- to bi-cellular layers, and a maintained nuclear/cytoplasmic ratio. Pseudoglandular regions, cystic gaps within tumors, and multilayered trabecular architecture were observed in HCC (see Figure 1C1–C6). In some DEN-treated animals, metastasis of primary liver cancer to the lungs was observed. Additionally, in rodent bioassays, the primary target organs for DEN-induced carcinogenesis included the liver and lungs,

3.2. Gene Expression Differences Between Genotoxic and Non-Genotoxic Liver Carcinogens

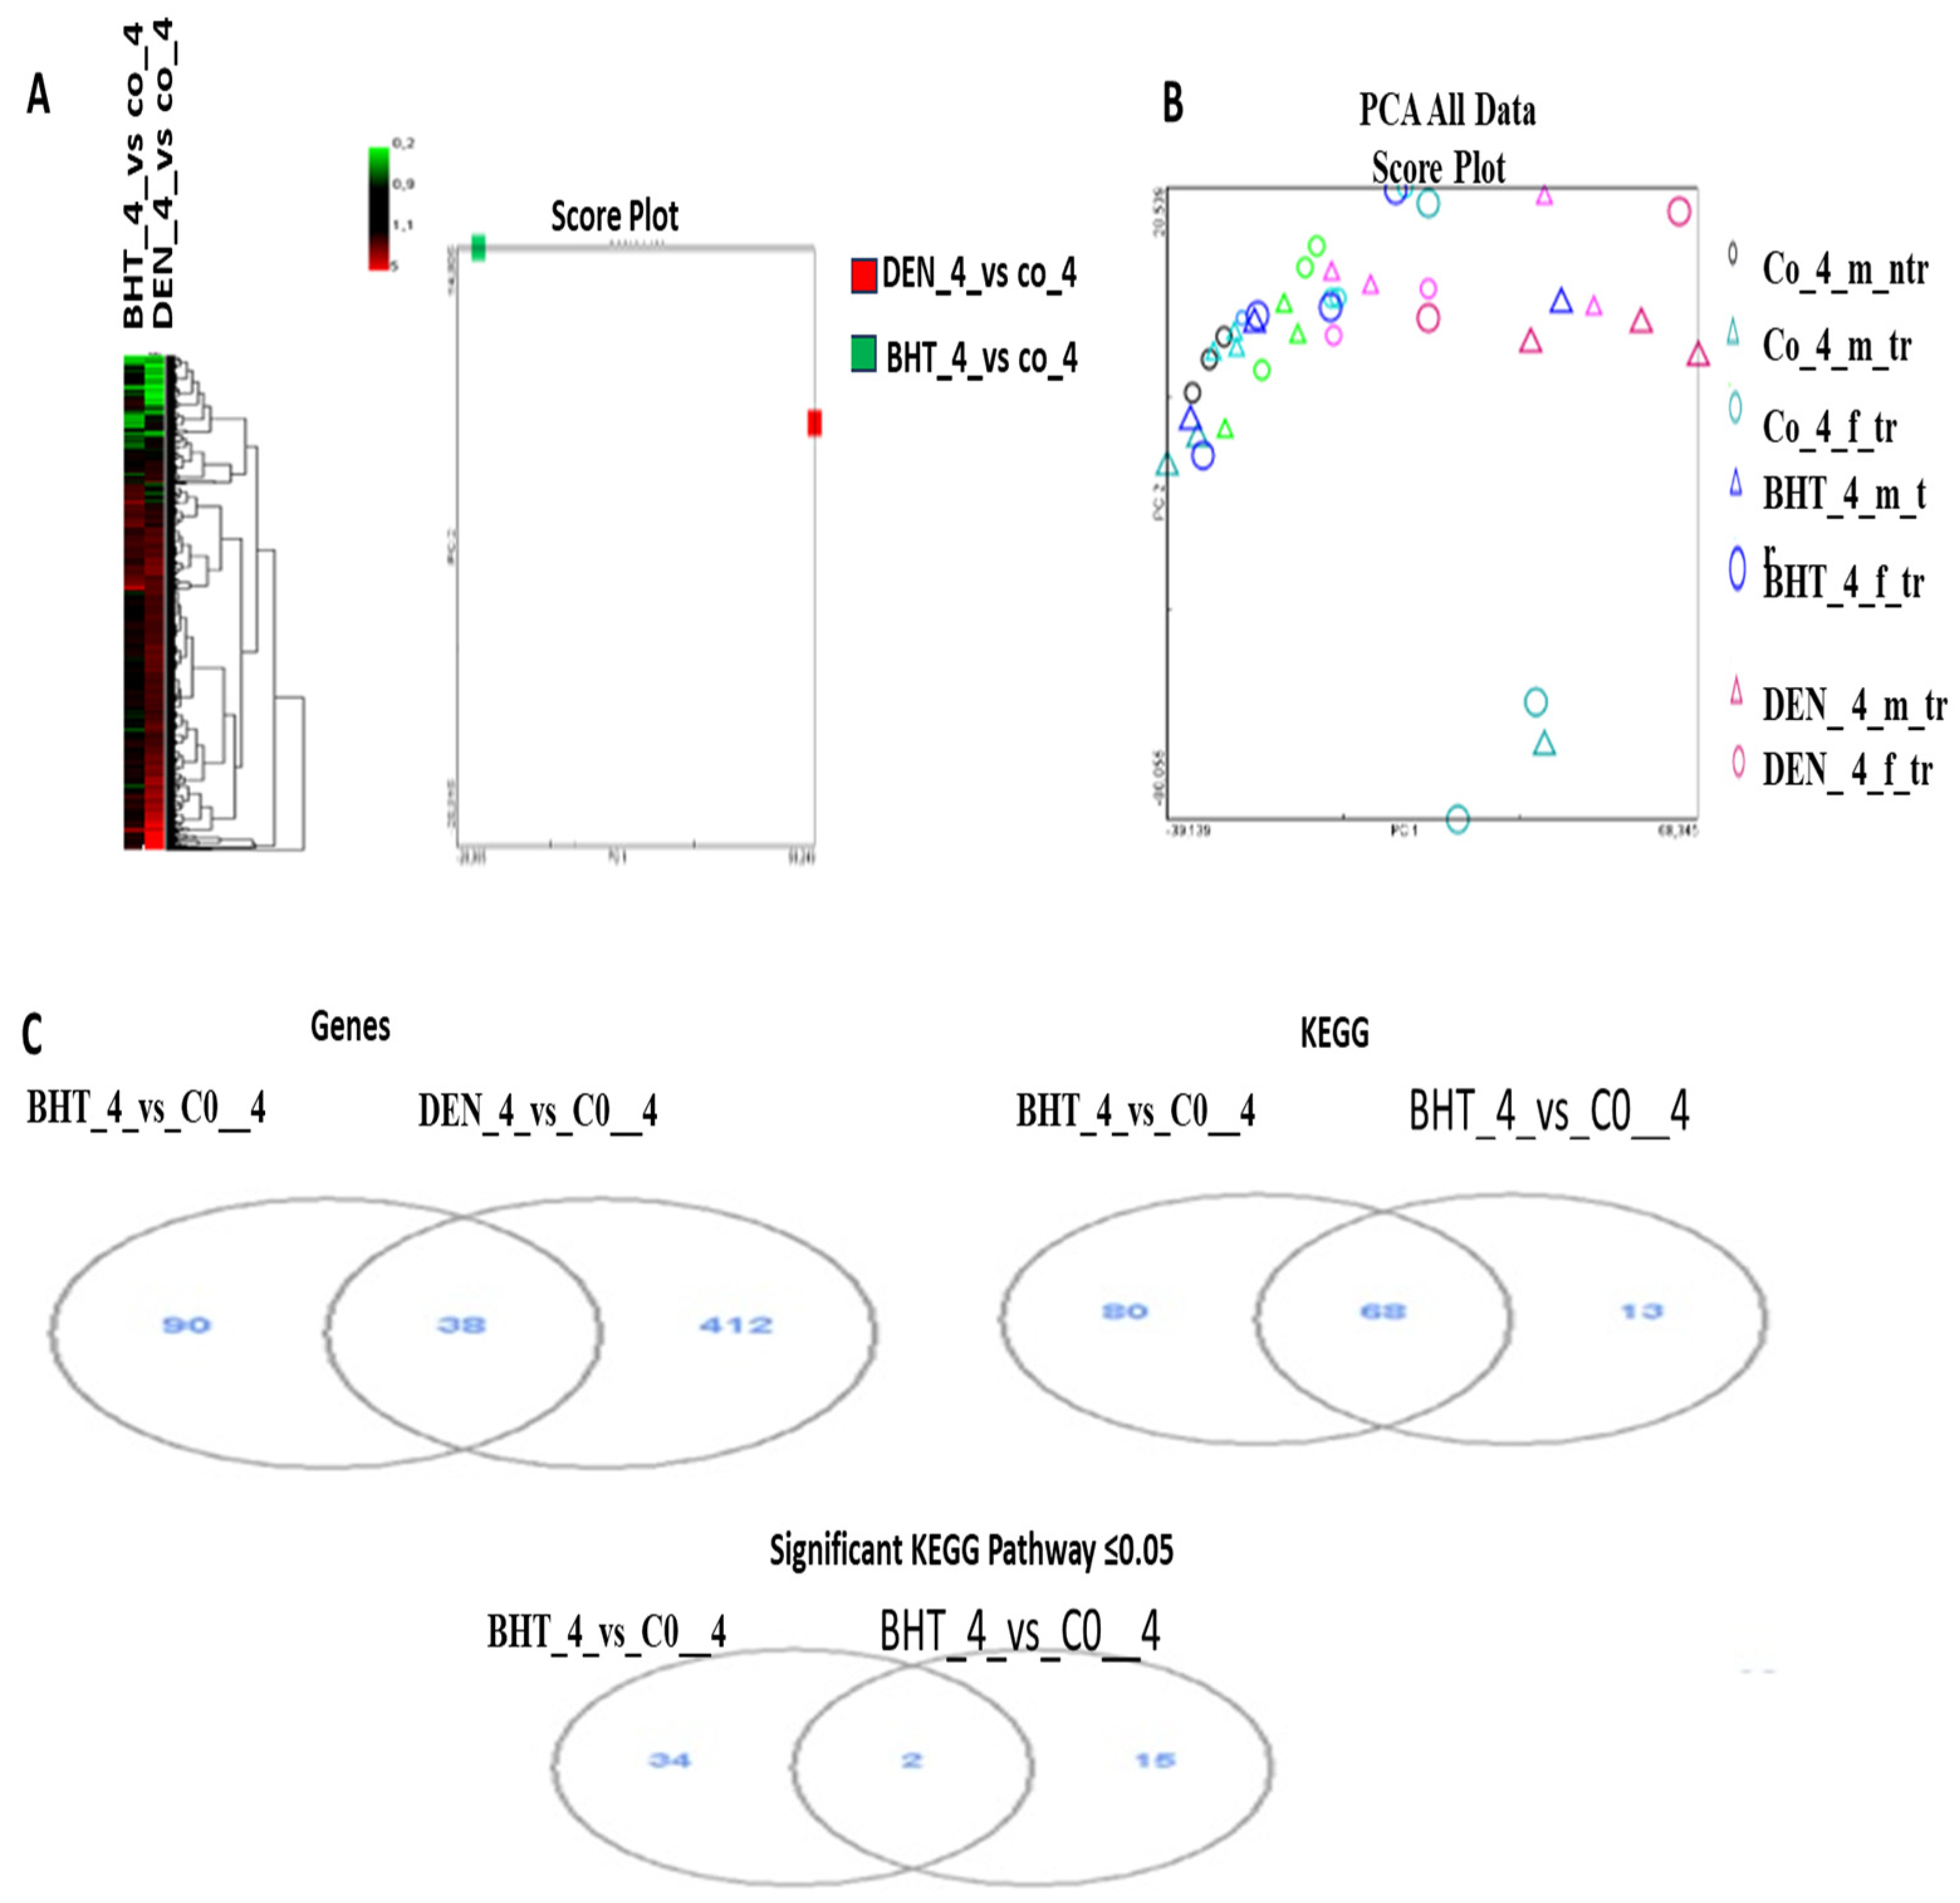
Hierarchical clustering analysis (HCA) and principal component analysis (PCA) were performed to compare changes in gene expression in the livers of AAT-Myc transgenic mice treated with BHT and DEN at the age of 8.5 months with transgenic control mice given vehicles. The analysis was conducted on the FCs of 666 significantly regulated genes (SRGs). Compared to control transgenic mice, there were distinct differences, particularly at 8.5 months, in both HCA and PCA analyses. Additionally, the significance of these differences was greater when compared to non-transgenic control mice than when compared to transgenic mice (Figure 2).
Once AAT-Myc transgenic mice were treated with BHT and DEN at the age of 8.5 months, their livers were analyzed using VD analysis to identify the genes that were significantly regulated. The results showed that 450 genes were significantly upregulated by DEN treatment, while only 128 genes were affected by BHT treatment. For both DEN and BHT, the most prevalent gene function pathway (KEGG) count was 148. For DEN, the significant KEGG pathway count was 36, while for BHT, it was 17 pathways. While BHT did not influence any of the genes linked to these pathways, DEN strongly regulated the cell cycle, DNA replication, p53 signaling pathway, mismatch repair, retinol metabolism, pyrimidine metabolism, and arachidonic acid metabolism. Furthermore, many more genes were regulated by DEN, and even though one or two genes were also regulated by BHT in several pathways, these pathways were not found to be significantly regulated.
Meanwhile, pathways largely controlled by BHT were mostly associated with drug detoxification and cellular metabolism, such as Cyp1a2 and Tpmt, which were downregulated in mice receiving DEN treatment. Additionally, most of the genes associated with metabolism of xenobiotics by cytochrome P450 (KEGG), linoleic acid metabolism (KEGG), and arachidonic acid metabolism (KEGG) were downregulated in DEN-treated transgenic mice but remained unchanged in BHT-treated mice. Furthermore, the metabolism of ascorbate and aldarate (KEGG) was largely downregulated in DEN-treated mice but remained mostly intact with BHT therapy.
Notably, tumor growth in the DEN group was significantly correlated with an increase in transformed or carcinogenic hepatocyte proliferation, which requires increased glucose metabolism. This included upregulation of Glut-1 and subsequent upregulation of glycosaminoglycan degradation (KEGG), starch and sucrose metabolism (KEGG), pentose phosphate pathway (KEGG), fructose and mannose metabolism (KEGG), other glycan degradation (KEGG), glycosphingolipid biosynthesis ganglioside (KEGG), galactose metabolism (KEGG), and inositol phosphate metabolism (KEGG). Conversely, livers with advanced disease progression were unable to process lipids, as evidenced by the downregulation of fatty acid metabolism (KEGG), linoleic acid metabolism (KEGG), and arachidonic acid metabolism (KEGG).
There were 270,096 transcript clusters in total in the MouseExon10ST array. Upon applying the designated criteria, 8090 clusters containing between 4 and 200 probe sets were identified. These clusters were subsequently tested for alternative splicing and differential gene expression using the previously described statistical techniques. An overview of the expressed genes (transcript clusters) in each group among the tested clusters is given in the transcript clusters below.
GroupNumber of transcript clusters with significant expression in the group
DEN_4_mf7501 92.7% of genes tested
bht_4_mf7162 88.5% of genes tested
Using the same test, the following deferential comparison of gene expression summarizes frequencies of pairwise co-expression between the study groups.
DENBHT
DEN-7 (0.609)
BHT7162 (0.270) -
The unmodified number is inclusive, while the figures in parentheses, if supplied, indicate exclusivity. For example, the DEN_4_mf group is significantly expressed above the background in 7501 genes, and is solely expressed in 609 genes without any other group exceeding the background. All co-expression patterns are summarized in the following table, which shows frequencies only. For example, the group DEN_4_mf+bht_4_mf is solely expressed by 6892 genes, and no other tissues exhibit expression above the background.
  • DEN_4_mf+bht_4_mf 6892
  • DEN_4_mf 609
  • bht_4_mf 270

3.2.1. Differential Gene Expression and Alternative Splicing

Six hundred and three genes showed statistically significant variations in gene expression across the groups, according to the statistical analysis described in the Section 2. Furthermore, 434 genes demonstrated substantial exon-group interaction, suggesting alternative splicing; of these, 71 genes showed significant variations in gene expression as well as interaction. In Table 3, the top tenfold alterations in genes showing a substantial difference in gene expression when comparing DEN to BHT treatment in transgenic mice are listed. The FC is expressed in terms of the normalized, untransformed data. Table 4 presents the top 10 genes with significant differential alternative splicing.

False Discovery Rate

To ascertain that the false discovery rate for the differential alternative splicing and gene expression assays in this study is annotation below 8 × 10³, the step-down approach previously described was utilized.

3.2.2. Examining and Contrasting Differentially Expressed Genes and Exons with Established Gene Classifications

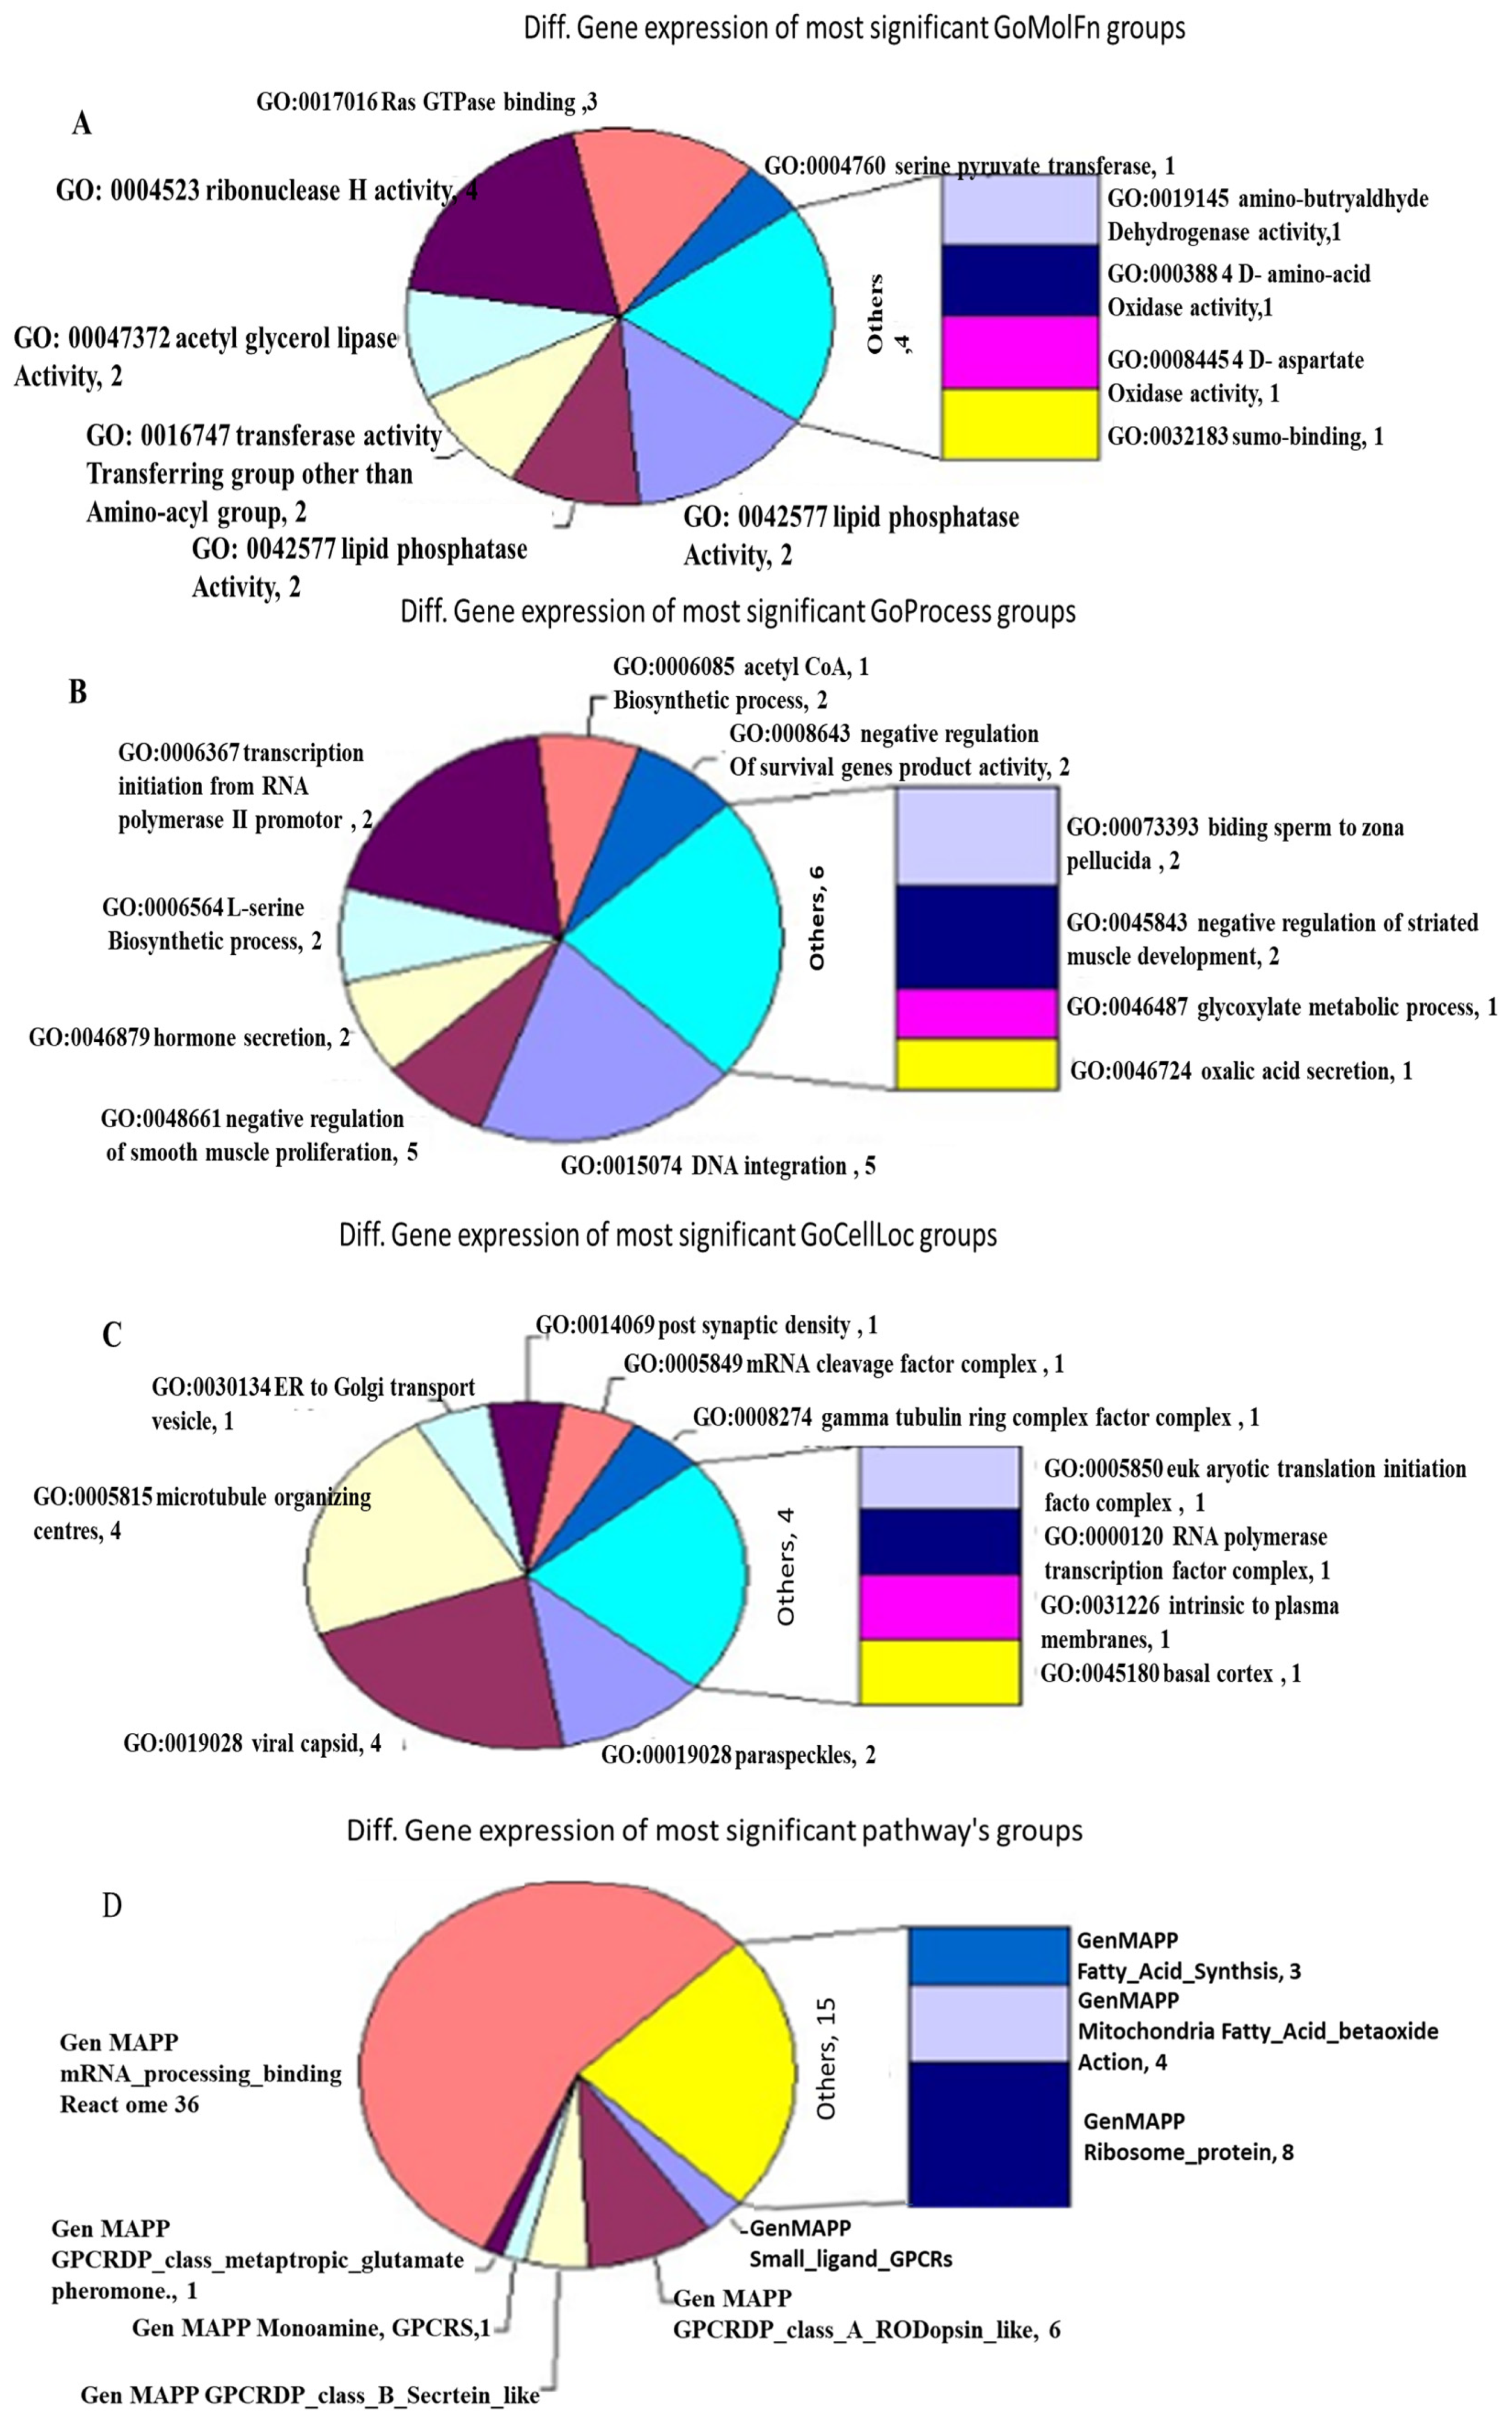
Existing gene classifications were compared to the 8090 genes that were tested for differential alternative splicing and gene expression, as detailed in the MouseExon10ST.info file. The objective was to identify any significant over-representation in the GOMolFn, GOProcess, GOCellLoc, or Pathway classes (Figure 3). Contingency table analysis was utilized to identify the groups in which genes exhibiting significant splicing or expression changes were over-represented. Under random conditions, the distribution of key genes in a group is hypergeometric.

3.2.3. Significant Representation Within the GOMolFn Categorization Group

As identified by the procedure outlined for evaluating differential splicing and gene expression, 219 groupings within the GOMolFn gene categorization showed a notable over-representation within the list of differently spliced or expressed genes. Table 5 below shows the top 30 groups. The columns represent the group name, the number of tested genes exhibiting significant differential splicing (along with the corresponding p-value of over-representation), and the count of genes displaying significant differential gene expression (along with the corresponding p-value of over-representation). Each row corresponds to a distinct group (Table 5).

3.2.4. Significant Representation Within the GOProcess Classification Group

The top 30 most significant differential gene expressions in the GOProcess classification group, based on the previously reported method of evaluating differential splicing and gene expression, are reported. Two hundred and eighty-five groups in the GOProcess gene classification showed substantial over-representation within the set of differently spliced or expressed genes. Table 6 lists the top 30 groups, detailing the count of tested genes displaying significant differential splicing (along with the corresponding p-value of over-representation), the count of genes exhibiting significant differential gene expression (along with the corresponding p-value of over-representation), and the group name.

3.2.5. Significant Representation Within the GOCellLoc Group

As identified by the previously outlined method of evaluating differential splicing and gene expression, 44 groups demonstrated considerable over-representation within the set of differentially spliced or expressed genes in the significant representation category of the GOCellLoc classification. Table 7 lists the top 30 groups, with each row corresponding to a different group. The columns indicate the group name, the number of tested genes exhibiting significant differential splicing (accompanied by the corresponding p-value of over-representation), and the count of genes displaying significant differential gene expression.

3.2.6. Significant Representation Within the Pathway Classification Group

Using the previously published method of evaluating differential splicing and gene expression, nine groups within the Pathway gene classification group showed a substantial over-representation among the set of genes that were either expressed or differentially spliced. Table 8 lists the top nine groups, with each row representing a different group.

3.3. Confirmation of Gene Expression by Rt-PCR

Microarray gene expression data revealed an increase in the levels of rpl23, rfc4, mmp12, and bzwz compared to the non-transgenic control. Conversely, c9 exhibited a reduction, and there were no observed changes in dynll1, slc10a, gas6, and the housekeeping gene b-actin (Figure 4).

3.4. Protein Expression Explored by Western Blotting of Treated Groups

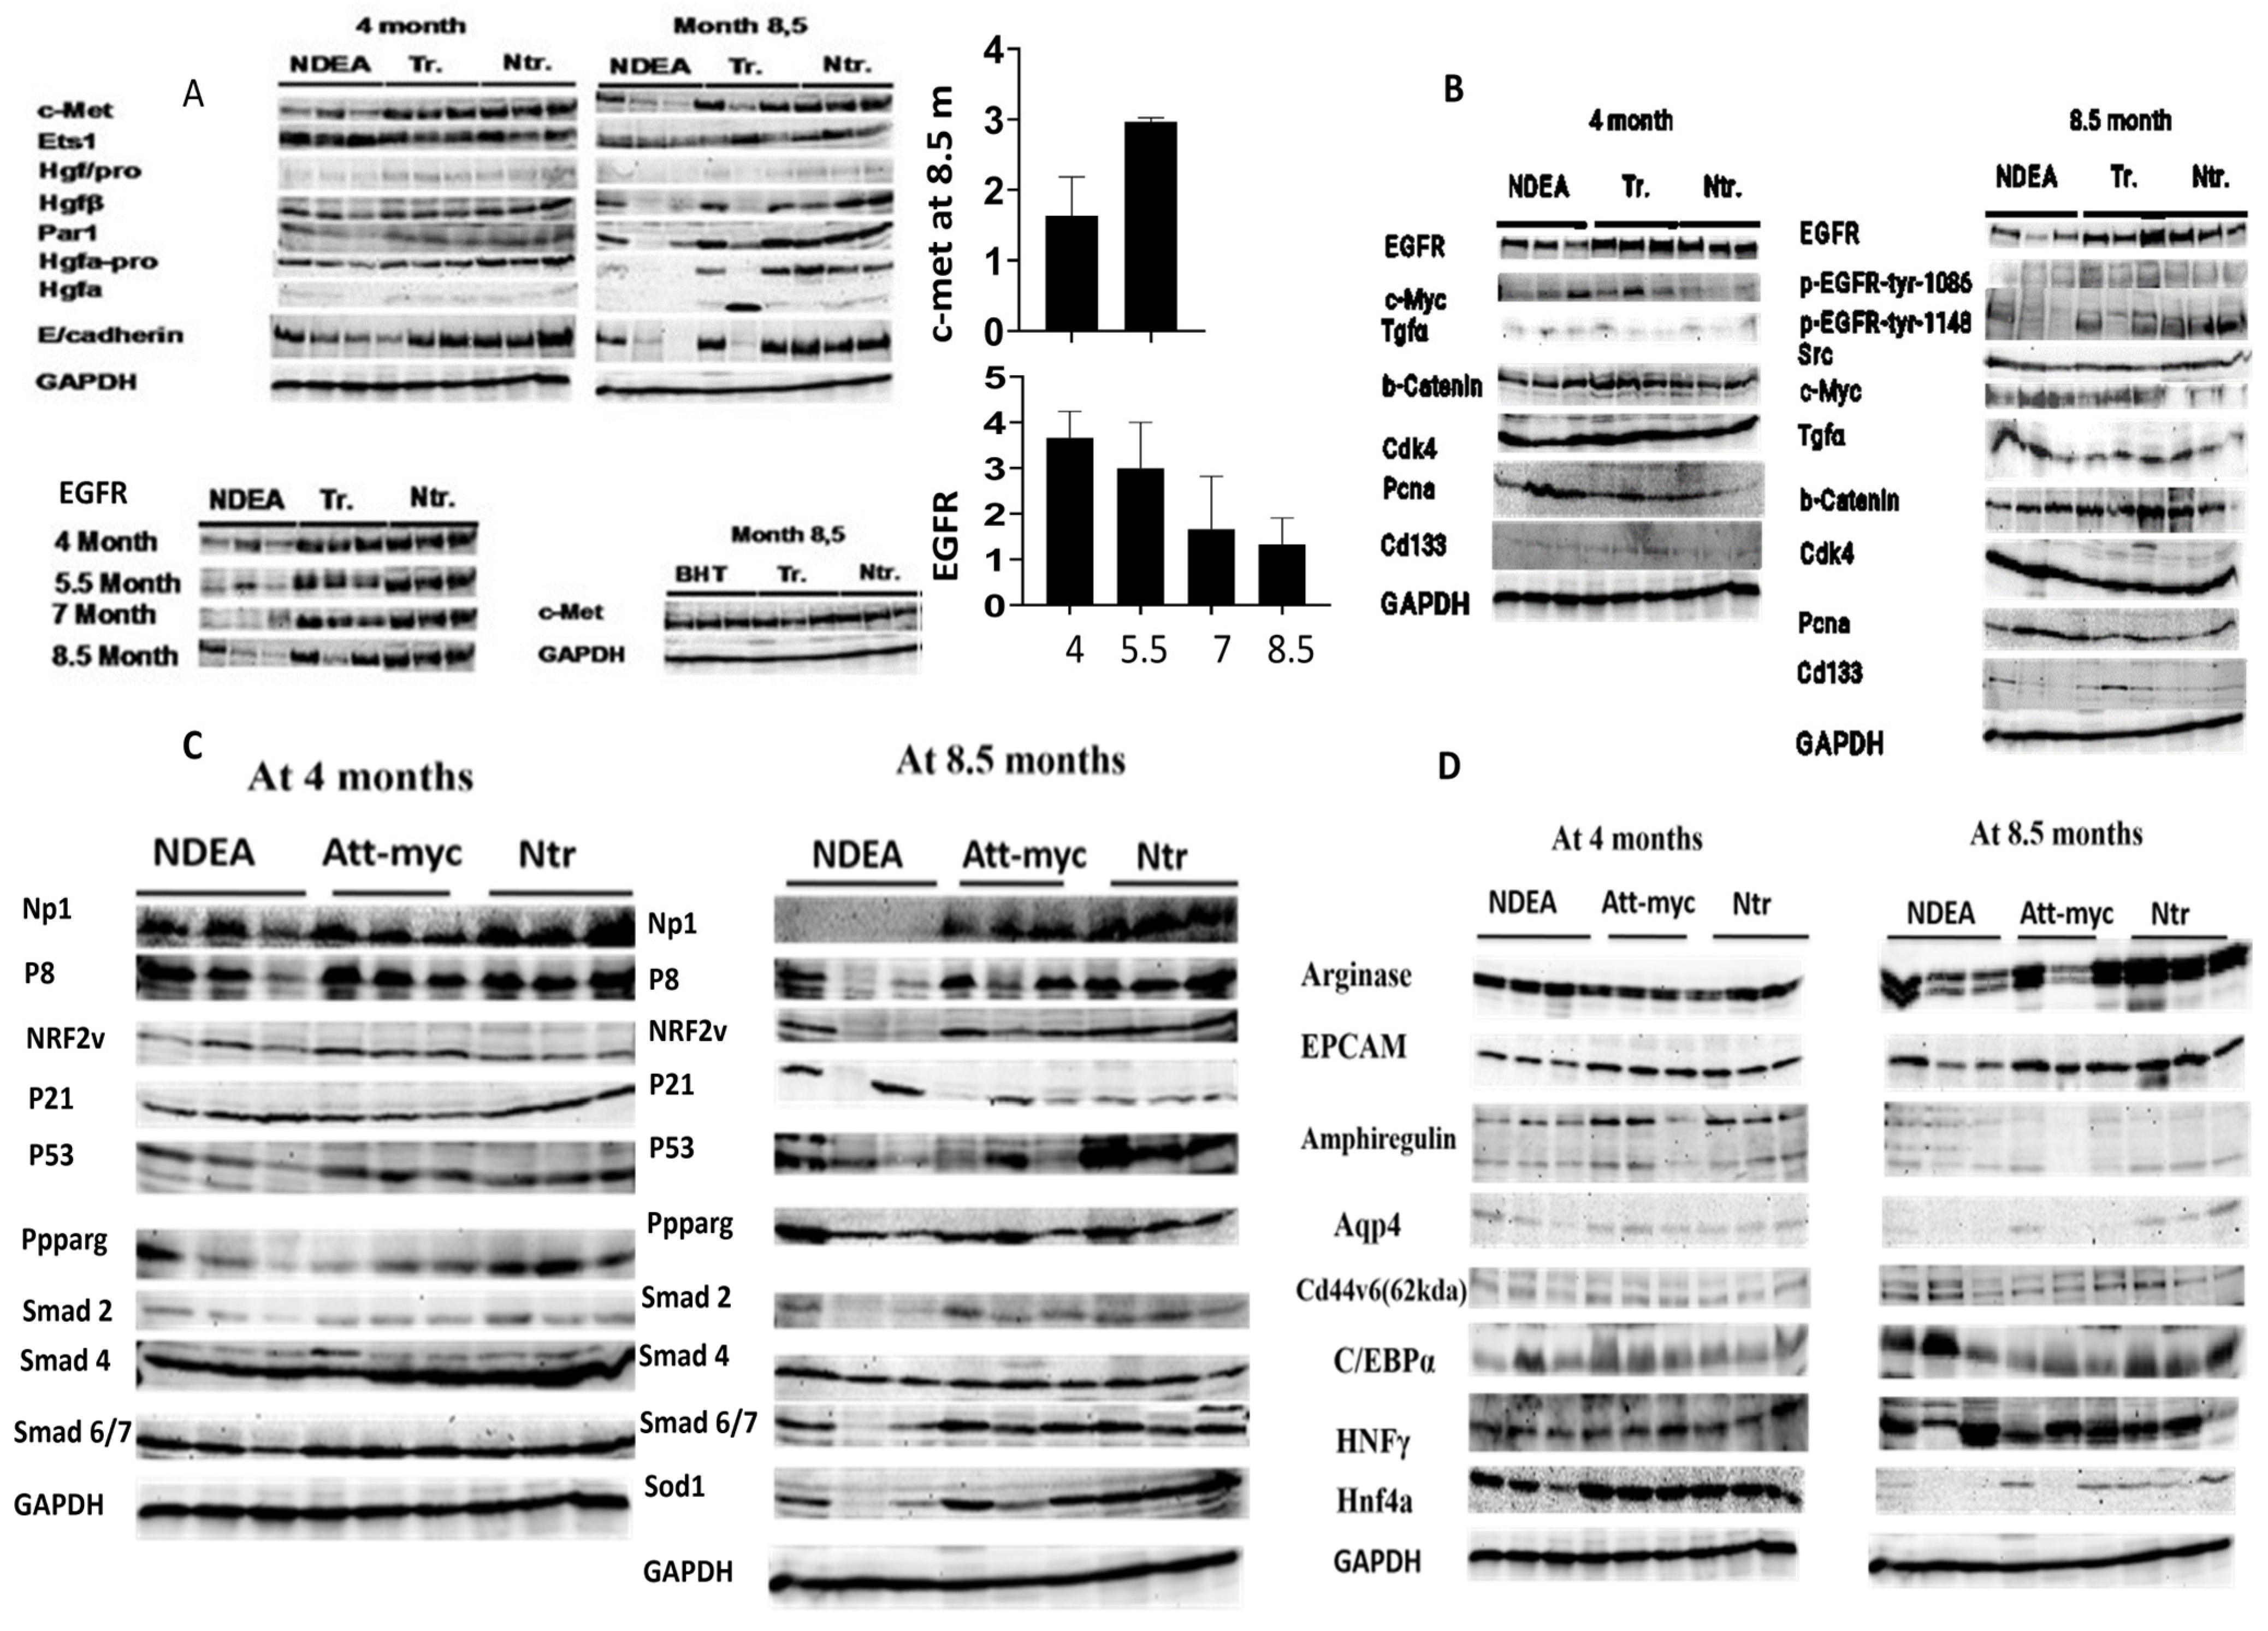
Remarkably, DEN therapy resulted in a greater loss of HGF/c-Met signaling, which may have contributed to the tumor’s rapid growth. Specifically, only ATT-Myc HCC mice that were untreated at the 12-month mark exhibited a decrease in c-Met. Meanwhile, BHT did not accelerate tumor growth at the experimental dose and instead preserved c-Met expression, similar to the control group. Notably, compared to the non-transgenic control group, c-Myc expression was consistently elevated by a factor of 12 in all treatment groups at both gene and protein levels. This suggests that the loss of c-Met/HGF signaling, accompanied by a loss of antioxidants such as superoxide dismutase (SOD1) and NRF2, and its down regulation led to enhancement of liver tumor growth in the c-myc model of liver cancer by promoting a more favorable environment for cancerous growth. This enhancement was observed four months after DEN treatment. Additional factors contributing to unchecked tumor proliferation include DNA damage, increased ROS production, loss of tumor suppressors such as p53, and compromised tissue repair systems (Figure 5A–D).

3.5. Immunohistochemistry of DEN-Treated ATT-Myc Transgenic Mice

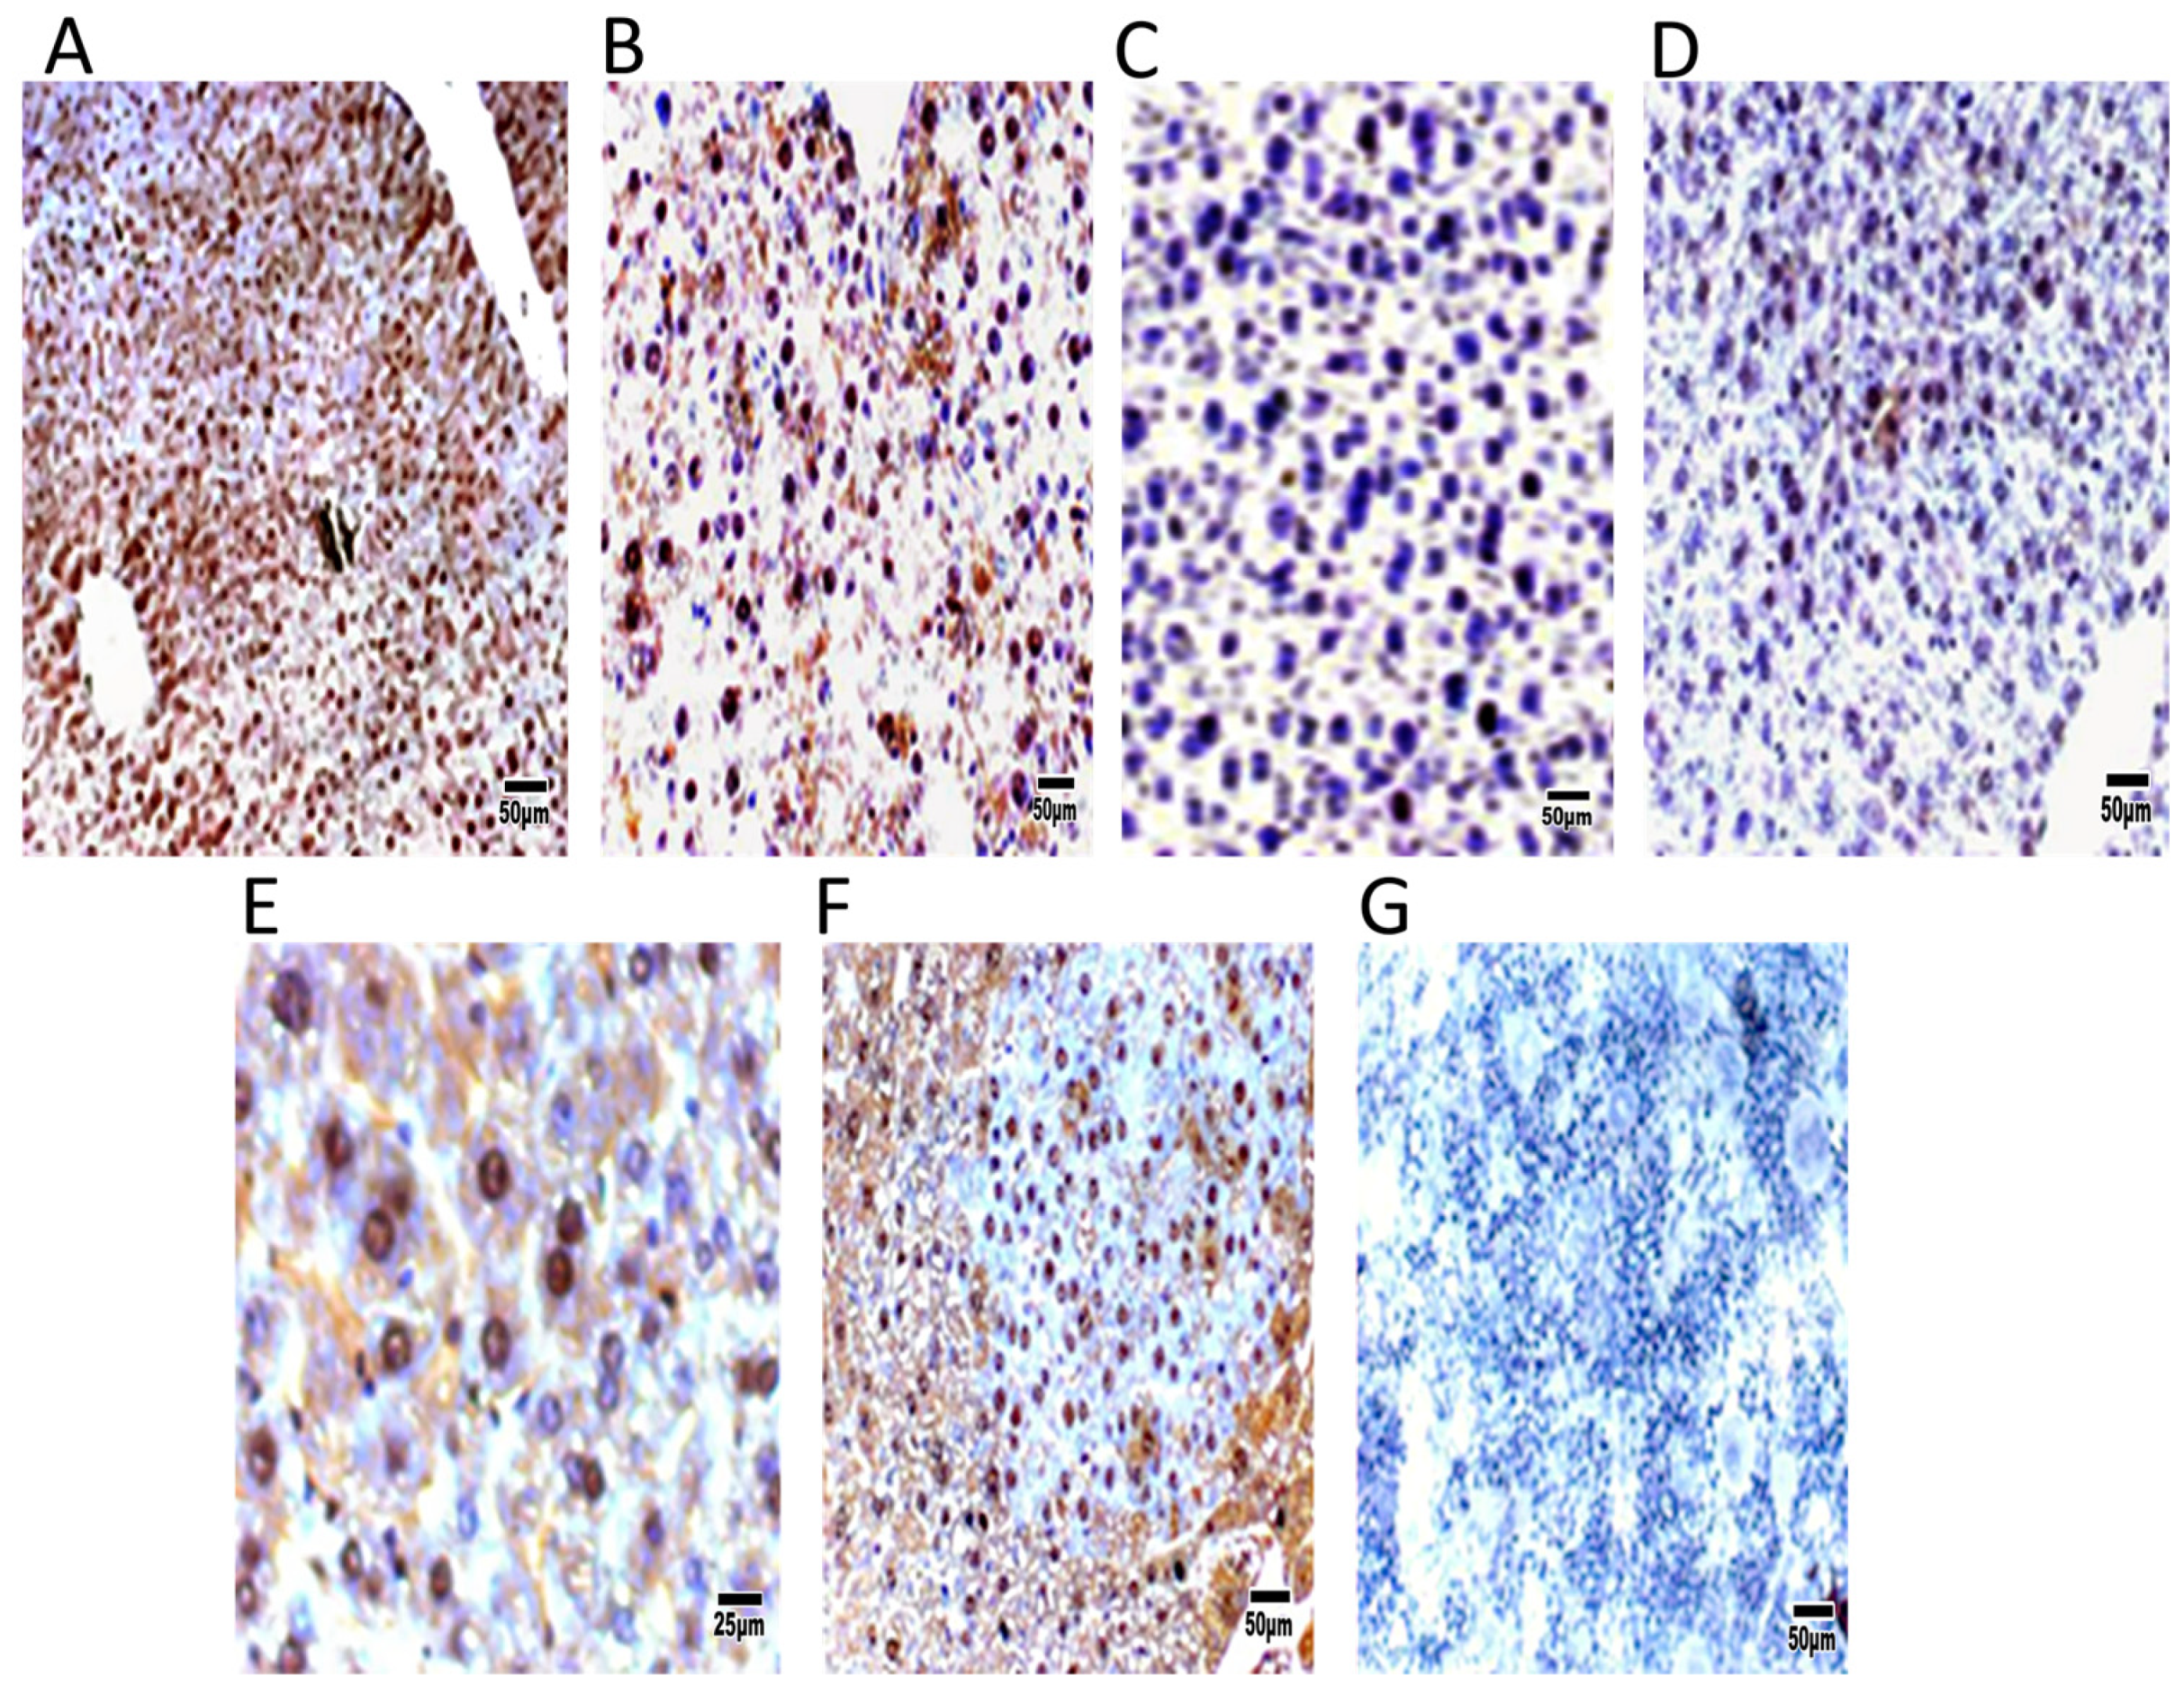
Remarkably, the DEN group exhibited an elevated proliferation rate of carcinogenic cells, as indicated by an increase in cells positive for PCNA or BrdU. Immunohistochemical detection of liver tumor tissue revealed an increase in c-Myc expression and a reduction in c-Met expression in DEN-treated mice compared to control transgenic mice (Figure 6).

4. Discussion

We previously examined the genotoxic carcinogen DEN and the non-genotoxic compound BHT as a proof of concept and found that DEN enhanced liver tumor growth in c-Myc as early as four months after the end of treatment [3]. According to the current study, the liver mass increased as soon as the DEN treatment ended (Figure 2), while the c-Myc transgenic model genetically caused hepatocellular cancer in mice at 12 months of age [2].
The fact that DEN therapy failed to cause tumors in other genetic models, such as rasH2 and p53 defective mice, in six months is extremely significant [4,5]. According to histopathology, transgenic mice given BHT only showed dysplastic nodules until the end of their lives or at 8.5 months. All things considered, the c-Myc transgenic mouse model responded to a genotoxic carcinogen and could distinguish between safe and dangerous substances, as seen by the HCC that appeared at 5.5 months of age. This result is in line with findings from c-Met knock-out mice treated with DEN, where tumor growth was also increased following DEN treatment [6]. Thus, shortening the time of cancer bioassays in the ATT-Myc model may accelerate the carcinogenicity testing of chemicals compared to old classic methods.
At 8.5 months, we used mixed model analysis of variance to examine 16 additional hybridizations on the MouseExon10ST array in order to confirm the selection of the most important genes that were elevated in the liver tumors that formed after DEN treatment. There were 434 genes with significant exon-group interactions (a marker of alternative splicing) and about 603 genes with significant gene expression changes across the groups; 71 genes had both gene and potential splicing differences (p < 0.01). The SNRK (SNF-Related Kinase) gene belongs to the family of serine/threonine kinases known as sucrose non-fermenting–related kinases and is one of the important genes expressed at 8.5 months [7]. Previous array data demonstrated that SNRK overexpression increased the levels of genes involved in cell proliferation. Moreover, SNRK increased CacyBP mRNA and protein and decreased β-catenin protein in HCT116 and RKO colon cancer cells [8]. After 8.5 months, DEN treatment led to the expression of Alpha1b. adrenergic receptor gene (Adra1b). Similarly, Alpha1 and α2c adrenergic receptor genes were over-expressed in basal-like breast tumors with poor prognosis [9].
In the present array data, Fgl1 was downregulated 8.5 months after DEN treatment. This is in line with the study by Nayeb-Hashemi et al. [10], who found that Fgl1 expression is decreased in HCC and that its loss correlates with a poorly differentiated phenotype.
In the c-Myc transgenic model of liver cancer, the emergence of large liver tumors and the loss of c-Met signaling were noted at 12 months of age [2]. In the current investigation, we first showed that at different times throughout the mice’s lives, the genotoxic DEN increased the loss of c-Met and the aggressiveness of liver cancer growth. While the BHT-treated group and the transgenic vehicle-treated group did not exhibit any liver tumor growth that was confirmed by histological analysis, they preserved the expression of c-Met, except for one of the three transgenic mice at 8.5 months. Similarly, in c-Met knockout animals given DEN treatment, c-Met deletion increased liver tumor growth [6]. Notably, persistent BHT maintained c-Met expression and reversed the detrimental consequences of c-Met depletion. Therapy with N-acetyl-L-cysteine, an antioxidant, and decreasing DEN initiated hepatocarcinogenesis in Cre-Ctrl mice [6].
Furthermore, after 12 months, the liver weight of the c-Myc transgenic mice increased significantly, reaching 10% of the body weight by 16 months. This was indicative of the development of enormous liver tumors. Conversely, the liver weight of double transgenic c-Myc/HGF mice that were older than a year did not show any variation from their younger counterparts [2]. Similarly, the expression of the shortened c-Met transgene produced immortalized and non-transformed hepatocyte cell lines and induced tolerance to apoptotic stimuli in vivo [11]. The present investigation revealed the downregulation of antioxidant pathways, such as SOD1 and NRF2, along with c-Met expression, particularly at the age of 8.5 months. Thus, the expression of HGF/c-Met has been identified as a crucial regulator of cellular redox homeostasis and oxidative stress [12]. Unstimulated Met-knockout cells experienced oxidative stress, as evidenced by elevated ROS production. This was associated with increased Nicotinamide adenine dinucleotide phosphate (NADPH) and Rac1 activities, which were suppressed by known NADPH oxidase inhibitors. Furthermore, oxidative stress correlated with enhanced lipid peroxidation and reduced glutathione (GSH) levels. Administration of N-acetylcysteine, an antioxidant and GSH precursor, notably reduced agonistic anti-Fas (Jo2)-induced cell death [13]. Additionally, Takami et al. [6] reported that the detrimental effects of c-Met deficiency were alleviated by long-term oral administration of the antioxidant N-acetyl-l-cysteine. This treatment inhibited EGFR activation and reduced N-nitrosodiethylamine-induced hepatocarcinogenesis to levels observed in Cre-Ctrl mice. Similarly, BHT, considered an antioxidant, maintained c-Met expression and did not promote liver cancer in the ATT-Myc liver of the transgenic model.
Furthermore, the genetic deletion of c-Met in hepatocytes disrupts redox homeostasis [13]. Moreover, the development of liver-specific c-Met–knockout mice has demonstrated the significance of HGF/c-Met signaling in the control of cellular redox state by regulating the expression of antioxidant proteins and a parallel inhibition of pro-oxidant systems [14]. In the current study, DEN-treated mice reduced the NP-1 protein in liver tumor tissue in comparison to transgenic and non-transgenic control mice at the age of 8.5 months. In this regard, NP-1 controls endothelial homeostasis by regulating mitochondrial function and iron-based oxidative stress [15].
Notably, DEN, as a genotoxic carcinogen, enhanced ROS production in the liver tumor microenvironment [16] and the loss of an antioxidant such as SOD1 [6]. In the current study, DEN treatment enhanced the loss of enriched transcriptional factors, such as HNF4a1 and HNFγ [2], due to extensive DNA damage and expression of C/EBPα. In this regard, there was a correlation between the expression of enriched transcriptional factors in hepatocytes and the cyto-met expression [16] in cell lines and transgenic models [11]. Moreover, in the current study, the c-Myc gene expression increased 12-fold after DEN treatment, and c-Myc protein expression was monitored by IHC. In this regard, previous reports showed that the loss of p53-mediated genomic surveillance and over-expression of c-Myc result in the suppression of DNA repair and enhancement of the mutation rate in cancer cells [18], and once the tumors become established, c-Myc is a key gene player in alternative macrophage activation and pro-tumorigenic gene expression [2]. While DEN enhanced the liver tumors in other transgenic models after six months of treatment [4,5], the expression of c-Myc and c-Met in a double transgenic mouse model (WHV/c-Myc transgenic mice) induced a dramatic increase in Myc-induced tumorigenesis in animals as young as 3–4-months old [1].
Intriguingly, the mechanism of the loss of c-Met signaling in the current study was due to the loss of its transcriptional factor (ets1), as the expression of c-Myc suppressed the expression of ets1 and consequently enhanced the loss of c-Met [17]. There was also extensive ROS production in the liver microenvironment due to the high expression of c-Myc. [18]. Notably, treatment with an antioxidant such as N-acetyl-l-cysteine in previous studies maintained c-Met expression and protected against DEN treatment [6]. Likewise, BHT treatment maintained hepatocytes in the dysplastic stage and prevented their conversion into liver tumors. Moreover, the use of a herbal extract, with quercetin as the active component, targeted c-Myc directly via reduction of ROS production [19,20] or release of exosomes from tumor cells under hypoxic conditions [21].
The ETS family TF—ETS1—was recognized as a key regulator of the intrahepatic cholangiocarcinoma lineage, which Myc was found to suppress during HCC progression. Notably, shRNA-mediated knockdown of FOXA1 and FOXA2, along with sustained ETS1 expression, completely shifted HCC to intrahepatic cholangiocarcinoma development in primary liver cancer mouse models [22].
Conclusions: In the ATT-Myc liver cancer model, the persistent upregulation of c-Myc at both gene and protein levels inhibits the ETS1 transcription factor, further aggravating the decline of c-Met signaling, SOD1, and NRF2. This increased ROS production and promoted rapid liver tumor growth. The present study reinforces the potential of a monoclonal antibody targeting c-Myc as a therapeutic strategy for liver cancer, underscoring its significance in future clinical research. Moreover, it encourages researchers to finalize the validation of the ATT-Myc model as a liver tumor model alongside the Rash2 transgenic model.
The limitation of the current study is the cost of validation, as developing alternative short-term toxicity research is still expensive. However, once the model is validated, testing chemicals will become cheaper and take less time.
Author Contributions

M.E., J.B., A.J.A. and M.G.E. designed the study, conducted the experiments, analyzed the data, and revised the manuscript. M.E. prepared the result figures. All authors have read and agreed to the published version of the manuscript.

Funding

This work was supported by the Deanship of Scientific Research, Vice Presidency for Graduate Studies and Scientific Research, King Faisal University, Saudi Arabia (Project No. GRANT- KFU250379).

Institutional Review Board Statement

The study was conducted in accordance with the Declaration of Helsinki and approved by the Institutional Review Board (the Ethical Committee of Hannover, Germany, AZ:.33.9-42502-04-08/1619 march, 2009 & the ethical committee of the King Faisal University (KFU-25-ETHIC53114, January 2025).

Informed Consent Statement

Not applicable.

Data Availability Statement

Data are provided within the manuscript.

Acknowledgments

We thank Roman Halter, a postdoctoral researcher who helped during the experimental stage at the Fraunhofer Institute of Toxicology and Experimental Medicine (Hanover, Germany). In addition, we are grateful to Reinhard Spanel, who supported us in the pathological examination of the ATT-Myc liver tumor. Moreover, we thank Tatiana Miere, a postdoctoral researcher who supported us with gene expression on array tracking of liver tumors.

Conflicts of Interest

The authors have no conflict of interest.

Abbreviations

ATT-mycAlpha-1-antitrypsin-c-myc transgenic model
AblAbelson murine leukemia oncogene 1
Bag3family molecular chaperone regulator 3
C/ebpa,bCCAAT/enhancer-binding protein alpha, beta
C-AblTyrosine kinase ABL1
Casp3Caspase 3
Casp8Caspase 8
Casp9caspase 9
Cav-1Caveolin-1
CMetHepatocyte growth factor receptor
Col1a1Collagen 1a1
EGFEpidermal growth factor
EGFREpidermal growth factor receptor
ERKsExtracellular-signal-regulated kinases
FAKFocal Adhesion Kinase
FAS (CD95)FAS-legand apoptosis pathway
HGFHepatocyte growth factor
HGFAHepatocyte growth factor activator
HNFHepatocyte nuclear factor
HSChepatocyte stellate cells
IGF1Insulin-like growth factor 1
Ikkbinhibitor of nuclear factor kappa-B kinase subunit beta
INTGα1Integrin alpha1
INTGβ1Integrin Beta 1
JnkC-Jun N-terminal kinases
Nek 6NIMA (never in mitosis)-related kinase 6
NF-kbnuclear factor kappa-light-chain-enhancer of activated B
Ntrnon-transgenic or wild
PAI-1Plasminogen activator inhibitor-1
PparαPeroxisome proliferator-activated receptor alpha
PparγPeroxisome proliferator-activated receptor gamma
SOD1Superoxide dismutase
SrcRous sarcoma oncogene
TFTranscription factor
Trtransgenic
ntrNon-transgenic
TGFaTransforming growth factor alpha
TGFb1Transforming growth factor beta 1
TGFbr2Transforming growth factor beta receptor 2
TNF-r1tumor necrosis superfamily receptor 1
BHT_4_m_trBHT-treated mice for fourth sacrifice or 8.5 months, male, transgenic
BHT_4_f_trBHT-treated mice for fourth sacrifice or 8.5 months, female, transgenic
DEN_4_m_trDEN-treated mice for fourth sacrifice or 8.5 months, male, transgenic
DEN_4_f_trDEN-treated mice for fourth sacrifice or 8.5 months, female, transgenic
Co_4_m_ntrComparison with male non-transgenic mice as a background
Co_4_m_trComparison with male transgenic mice as a background
Co_4_f_trComparison with female transgenic mice as a background

References

  1. Dalemans, W.; Perraud, F.; Le Meur, M.; Gerlinger, P.; Courthey, M.; Pavirani, A. Heterologous protein expression by transimmortalized differentiated liver cell lines derived from transgenic mice (hepatomas/α1 antitrypsin/ONC mouse). Biologicals 1990, 18, 191–198. [Google Scholar] [CrossRef] [PubMed]
  2. Santoni-Rugiu, E.; Preisegger, K.H.; Kiss, A.; Audolfsson, T.; Shiota, G.; Schmidt, E.V.; Thorgeirsson, S.S. Inhibition of neoplastic development in the liver by hepatocyte growth factor in a transgenic mouse model. Proc. Natl. Acad. Sci. USA 1996, 93, 9577–9582. [Google Scholar] [CrossRef]
  3. Hueper, K.; Elalfy, M.; Laenger, F.; Halter, R.; Rodt, T.; Galanski, M.; Borlak, J. PET/CT imaging of c-Myc Transgenic mice identifies the genotoxic N-nitroso-diethylamine as carcinogen in a short-term cancer bioassay. PLoS ONE 2012, 7, e30432. [Google Scholar] [CrossRef] [PubMed]
  4. Finnberg, N.; Stenius, U.; Högberg, J. Heterozygous p53-deficient (+/−) mice develop fewer p53-negative preneoplastic focal liver lesions in response to treatment with diethylnitrosamine than do wild-type (+/+) mice. Cancer Lett. 2004, 207, 149–155. [Google Scholar] [CrossRef]
  5. Usui, T.; Mutai, M.; Hisada, S.; Takoaka, M.; Soper, K.A.; Mccullough, B.; Alden, C. CB6F1-rasH2 mouse: Overview of available data. Toxicol. Pathol. 2001, 29, 90–108. [Google Scholar] [CrossRef] [PubMed]
  6. Takami, T.; Kaposi-Novak, P.; Uchida, K.; Gomez-Quiroz, L.E.; Conner, E.A.; Factor, V.M.; Thorgeirsson, S.S. Loss of hepatocyte growth factor/c-Met signaling pathway accelerates early stages of N-nitrosodiethylamine–induced hepatocarcinogenesis. Cancer Res. 2007, 67, 9844–9851. [Google Scholar] [CrossRef] [PubMed]
  7. Kertesz, N.; Samson, J.; Debacker, C.; Wu, H.; Labastie, M.-C. Cloning and characterization of human and mouse SNRK sucrose non-fermenting protein (SNF-1)-related kinases. Gene 2002, 294, 13–24. [Google Scholar] [CrossRef]
  8. Rines, A.K.; Burke, M.A.; Fernandez, R.P.; Volpert, O.V.; Ardehali, H. Snf1-related kinase inhibits colon cancer cell proliferation through calcyclin-binding protein-dependent reduction of β-catenin. FASEB J. 2012, 26, 4685. [Google Scholar] [CrossRef]
  9. Powe, D.G.; Voss, M.J.; Habashy, H.O.; Zänker, K.S.; Green, A.R.; Ellis, I.O.; Entschladen, F. Alpha- and beta-adrenergic receptor (AR) protein expression is associated with poor clinical outcome in breast cancer: An immunohistochemical study. Breast Cancer Res. Treat. 2011, 130, 457–463. [Google Scholar] [CrossRef]
  10. Nayeb-Hashemi, H.; Desai, A.; Demchev, V.; Bronson, R.T.; Hornick, J.L.; Cohen, D.E.; Ukomadu, C. Targeted disruption of fibrinogen like protein-1 accelerates hepatocellular carcinoma development. Biochem. Biophys. Res. Commun. 2015, 465, 167–173. [Google Scholar] [CrossRef]
  11. Amicone, L.; Spagnoli, F.M.; Späth, G.; Giordano, S.; Tommasini, C.; Bernardini, S.; De Luca, V.; Della Rocca, C.; Weiss, M.C.; Comoglio, P.M.; et al. Transgenic expression in the liver of truncated Met blocks apoptosis and permits immortalization of hepatocytes. EMBO J. 1997, 16, 495–503. [Google Scholar] [CrossRef] [PubMed]
  12. Clavijo-Cornejo, D.; Enriquez-Cortina, C.; López-Reyes, A.; Domínguez-Pérez, M.; Nuño, N.; Domínguez-Meraz, M.; Bucio, L.; Souza, V.; Factor, V.M.; Thorgeirsson, S.S.; et al. Biphasic regulation of the NADPH oxidase by HGF/c-Met signaling pathway in primary mouse hepatocytes. Biochimie 2013, 95, 1177–1184. [Google Scholar] [CrossRef] [PubMed]
  13. Gómez-Quiroz, L.E.; Factor, V.M.; Kaposi-Novak, P.; Coulouarn, C.; Conner, E.A.; Thorgeirsson, S.S. Hepatocyte-specific c-Met Deletion Disrupts Redox Homeostasis and Sensitizes to Fas-mediated Apoptosis. J. Biol. Chem. 2008, 283, 14581–14589. [Google Scholar] [CrossRef]
  14. Gómez-Quiroz, L.; Gutiérrez-Ruiz, M.; Marquardt, J.; Factor, V.; Thorgeirsson, S. Redox regulation by HGF/c-Met in liver disease. In Liver Pathophysiology; Elsevier: Amsterdam, The Netherlands, 2017; pp. 375–387. [Google Scholar]
  15. Issitt, T.; Bosseboeuf, E.; De Winter, N.; Dufton, N.; Gestri, G.; Senatore, V.; Chikh, A.; Randi, A.M.; Raimondi, C. Neuropilin-1 controls endothelial homeostasis by regulating mitochondrial function and iron-dependent oxidative stress. iScience 2018, 11, 205–223. [Google Scholar] [CrossRef]
  16. Shalini, S.; Nikolic, A.; Wilson, C.H.; Puccini, J.; Sladojevic, N.; Finnie, J.; Dorstyn, L.; Kumar, S. Caspase-2 deficiency accelerates chemically induced liver cancer in mice. Cell Death Differ. 2016, 23, 1727–1736. [Google Scholar] [CrossRef] [PubMed]
  17. Mantovani, A.; Allavena, P.; Sica, A.; Balkwill, F. Cancer-related inflammation. Nature 2008, 454, 436–444. [Google Scholar] [CrossRef]
  18. Amicone, L.; Terradillos, O.; Calvo, L.; Costabile, B.; Cicchini, C.; Della Rocca, C.; Lozupone, F.; Piacentini, M.; Buendia, M.A.; Tripodi, M. Synergy between truncated c-Met (cyto-Met) and c-Myc in liver oncogenesis: Importance of TGF-β signalling in the control of liver homeostasis and transformation. Oncogene 2002, 21, 1335–1345. [Google Scholar] [CrossRef]
  19. Pello, O.M.; De Pizzol, M.; Mirolo, M.; Soucek, L.; Zammataro, L.; Amabile, A.; Doni, A.; Nebuloni, M.; Swigart, L.B.; Evan, G.I.; et al. Role of c-MYC in alternative activation of human macrophages and tumor-associated macrophage biology. Blood 2012, 119, 411–421. [Google Scholar] [CrossRef]
  20. Maksymchuk, O.; Shysh, A.; Kotliarova, A. Quercetin inhibits the expression of MYC and CYP2E1 and reduces oxidative stress in the myocardium of spontaneously hypertensive rats. Acta Biochim. Pol. 2023, 70, 199–204. [Google Scholar] [CrossRef]
  21. Jia, W.-T.; Xiang, S.; Zhang, J.-B.; Yuan, J.-Y.; Wang, Y.-Q.; Liang, S.-F.; Lin, W.-F.; Zhai, X.-F.; Shang, Y.; Ling, C.-Q.; et al. Jiedu recipe, a compound Chinese herbal medicine, suppresses hepatocellular carcinoma metastasis by inhibiting the release of tumor-derived exosomes in a hypoxic microenvironment. J. Integr. Med. 2024, 22, 696–708. [Google Scholar] [CrossRef]
  22. D’artista, L.; Moschopoulou, A.A.; Barozzi, I.; Craig, A.J.; Seehawer, M.; Herrmann, L.; Minnich, M.; Kang, T.-W.; Rist, E.; Henning, M.; et al. MYC determines lineage commitment in KRAS-driven primary liver cancer development. J. Hepatol. 2023, 79, 141–149. [Google Scholar] [CrossRef] [PubMed]
Figure 1. (A1,A2) ATT-Myc transgene construction and the positive band for transgenic ATT-Myc transgenes were confirmed by PCR tail DNA testing. (B1) The increase in liver weight to body weight ratio in DEN-treated transgenic mice at 8.5 months was due to massive liver tumor growth, as shown in the corresponding gross images. Moreover, these images illustrate a large liver in DEN-treated transgenic mice, small nodular structures in BHT-treated transgenic animals, and normal liver architecture in both transgenic and non-transgenic controls (B2). (C1) Histopathological analysis revealed that the normal liver parenchyma in non-transgenic mice remained unaltered. (C2) In BHT-treated transgenic animals, macrocytic dysplastic nodules were observed. (C3) illustrates liver cirrhosis and nodular regeneration in DEN-treated transgenic mice, large trabecular HCC, and pseudoglandular HCC (C4). Necrosis (C5) and fat changes (C6) were also detected. * p < 0.05.
Biomedicines 13 00743 g001
Figure 2. (A) shows HCA and PCA of gene expression changes in the livers of AAT-Myc transgenic mice induced by BHT and DEN at 8.5 months compared to transgenic control mice treated with a vehicle. FCs of 666 SRGs were analyzed. (B) presents the HCA and PCA of gene expression changes in the livers of AAT-Myc transgenic mice induced by BHT and DEN at 8.5 months compared to non-transgenic control mice treated with a vehicle, where FCs of 533 SRGs were analyzed. (C) illustrates PCA of the whole dataset of gene expression changes in the livers of AAT-Myc transgenic mice induced by BHT and DEN at 8.5 months compared to transgenic control mice treated with vehicles, with FCs of 666 SRGs included. The figure also depicts the volume differential (VD) analysis of genes significantly regulated in the liver of AAT-Myc transgenic mice treated with BHT and DEN versus transgenic control mice treated with vehicle (NaCl) at 8.5 months.
Biomedicines 13 00743 g002
Figure 3. Group (A) represents most of the strongly varying gene expressions in the GOMolFn classification groups. Group (B) of the GOProcess classification exhibits the most significant gene expression. The GOCellLoc classification’s group with significant gene expression is represented in (C), while group (D) shows significant gene expression within the Pathway classification group.
Biomedicines 13 00743 g003
Figure 4. RT-PCR products were analyzed using gel electrophoresis and visualized using Kodak Image Station 440CF under UV light to validate exon array expression. All samples were normalized to β-actin levels. The densometrical scan of the gene expression analysis showed elevated levels of RPL23, RFC4, MMP12, and BZWZ after treatment with DEN in comparison to the non-transgenic control. In contrast, C9 displayed a decrease, while no significant variations were detected in DYNL1, SLC10A, GAS6, or the housekeeping gene β-actin. * p < 0.05.
Biomedicines 13 00743 g004
Figure 5. (A) This shows the loss of c-Met and its transcriptional factor ETS1 in liver tumors after DEN treatment at 8.5 months. (B) Loss of c-Met is time-dependent in liver tumors induced by DEN at different time points, while BHT maintains c-Met expression. additionally, Liver protein extracts from DEN-treated transgenic mice showing increased expressions of c-Myc, TGFα, PCNA, and CDK4 contributing to accelerated tumor growth. (C) DEN treatment enhances the loss of antioxidants, such as SOD1, NRF2, Neuropilin-1 (NP-1), and PPARγ, compared to control non-transgenic animals at 8.5 months. (D) DEN treatment reduces enriched transcriptional factors, such as HNF4α and HNFγ, while increasing the expression of C/EBPα and CD44 compared to control transgenic and non-transgenic mice.
Biomedicines 13 00743 g005
Figure 6. Immunohistochemistry staining demonstrated increased c-Myc expression in transgenic mice (A), while the distribution of c-Met expression was uneven (B). The unstained control group provided a reference for comparison (C). Increased PCNA expression was noted in DEN-treated mice (D) compared to the BHT-treated group (E), along with increased BrdU in the BHT-treated group (F). (G) shows control unstained sections.
Biomedicines 13 00743 g006
Table 1. Sequences of primers used in RT-PCR.
Primers: Forward (fw) and Reverse (rev)SequencesProduct Size (bp)
Myc fwTCCTGTACCTCGTCCGATTC303
Myc revGTTGTGCTGGTGAGTGGAGA
C9 fwATGGAGCAATTGGTCAGAGTG241
C9 revATCTCCACAGTCGTTGTCACC
Nola2 fwATTGCCGATTGAGGTGTACTG156
Nola2 revGCACTTGTCGTAGGTCTCCTG
Bzw2 fwCAGGCACTGAAGCACCTAAAG194
Bzw2 revCACTTCAGTATCGCCTCTTCG
Mmp12_2 fwCCAGAGGTCAAGATGGATGAA237
Mmp12_2 revTGGGCTAGTGTACCACCTTTG
Rpl13a fwCTGCTGCTCTCAAGGTTGTTC235
Rpl13a revTTGGTCTTGAGGACCTCTGTG
Rfc4 fwAGCCATGTCCTCCCTTTAAGA223
Rfc4 revCCAGTAATCGCTCCTGTTGAA
Dynll1 fwGAAGAGATGCAACAGGACTCG
Dynll1 revCCACCTGACCCAGGTAGAAGT202
Slc10a1_fwCACCATGGAGTTCAGCAAGAT238
Slc10a1_revGGTCATCACAATGCTGAGGTT
Gas6_fwCGATGAATGCACAGACTCAGA166
Gas6_revGTTGACACAGGTCTGCTCACA
ß-Actin fwGGCATTGTTACCAACTGGGACG423
ß-Actin revCTCTTTGATGTCACGCACGATTTC
Table 2. List of antibodies used for Western blot (WB) and immunohistochemistry (IHC) assays.
NameCompanyDilution for WBLot No.
EGF ab-3Calbiochem (Darmstadt, Germany)1:200GF07L
EGFRUpstate (Boulevard, CA, USA)1:100006-847
phospho-EGFR (Tyr1086)Upstate1:100007-818
P-EGFRPhospho-EGFR (Tyr1148)1:100007-819
Phospho-Src (Tyr416)Cell Signaling1:10002101
Fak c20Santa Cruz1:200sc-558
Ets2Santa Cruz1:200sc-351x
CMetSanta Cruz1:200sc-162
p-Met (Tyr 1234)Santa Cruz1:200sc-101736
HgfSanta Cruz1:200sc-7949
Hgfa n-19Santa Cruz1:200sc-1371
Itga1Santa Cruz1:200Sc-271034
Itgb1Santa Cruz1:200Sc-271034
Col1a1Santa Cruz1:200sc-25974
TcptpSanta Cruz1:200Sc-21345
Cav-1 h-97Santa Cruz1:200sc-7875
PpargSanta Cruz1:200Sc-7196
E-cadherin (H-108)Santa Cruz1:200sc-7870
PparaSanta Cruz1:2000Sc-1985x
Igf1Santa Cruz1:200Sc1422
TgfaSanta Cruz1:200Sc-1338
Tgfb1Santa Cruz1:200Sc-146
Tgfbr2Santa Cruz1:200Sc-220
Smad2-3Santa Cruz1:2000Sc-6202x
Smad6-7Santa Cruz1:200Sc-7004
Smad4Santa Cruz1:2000sc-1909x
FasSanta Cruz1:200sc-74540
Tnfr1Santa Cruz1:200sc-8436
p53 (FL-393)Santa Cruz1:333sc-6243
Bag3Abecam (Cambridge, UK)1:2000ab47107
Casp3Santa Cruz1:200Sc-7148
Casp8Santa Cruz1:200Sc-7890
Casp9Santa Cruz1:200Sc-7885
P21 (c-19)Santa Cruz1:200Sc-397
Cyclind1Calbiochem1:2009940109
p-JNK (G-7)Santa Cruz1:200sc-6254
Nek6Abgent1:100AP8077a
h-rasSanta Cruz1:200Sc-35
Raf1Santa Cruz1:200Sc-133
Mek1Abcam1:200Ab-32091-100
Erk1-2Santa Cruz1:200Sc-135900
p-ERK (E-4)Santa Cruz1:200sc-7383
Dusp6Santa Cruz1:200Sc-137245
P38Santa Cruz1:200Sc-7972
SOD1Santa Cruz1:200Sc-8637
Stat5aSanta Cruz1:2000Sc-1081x
P=stat5aNEB (Ipswich, MA, USA)1:2009351s
NfkbSanta Cruz1:100sc-109
IkkbSanta Cruz1:200Sc-9130
c/ebpaSanta Cruz1:2000Sc-61x
c/ebpbSanta Cruz1:2000sc-150x
Hnf1aSanta Cruz1:200Sc-6547x
Hnf3aSanta Cruz1:200sc-6553
Hnf3bSanta Cruz1:100sc-6554
Hnf4aSanta Cruz1:2000Sc6556x
Hnf6Santa Cruz1:2000Sc-6559x
AhrBiomed (Cambridge, UK)1:200SA-210
Cyp4a1Santa Cruz1:200Sc-53247
PcnaSanta Cruz1:200sc-7907
Cdk4Santa Cruz1:200sc-260
b-cateninUpstate1:20006-734
GAPDH (fl-355)GAPDH (FL-335) (Santa Cruz, TX, USA)1:200sc-25778
Table 3. The top tenfold alterations in genes show a substantial difference in gene expression (fold change is expressed in terms of normalized, untransformed data).
Gene SymbolTCluster IDDescriptionFold ChangeDifferential Expression p-Value
Pcdh126864783protocadherin121.413.54 × 102
Snrk6993055SNF related kinase1.51 × 1025.01 × 102
Ldb16873393LIM domain binding 1−1.41 × 1026.87 × 102
010Ertd641e6774274DNA segment Chr 10 ERATO−1.717.50 × 102
Prtl.rir6962829Interferon-inducible double-strand RNA activated protein kinase−1.316.78 × 102
Adra1b6787614Adrenergic receptor alpha lb2.916.17 × 102
Fg116981914Fibrinogen Fike protein 1−2.417.35 × 102
Serinc36892831Serine inoorpora10 < 3−1.817.77 × 102
Npt16906895Natriuretic peptide receptor 11.518.02 × 102
Rbm37015454RNA binding motif protein 3−5.518.03 × 102
Table 4. The top 10 genes with significant differential alternative splicing.
Gene SymbolTCluster IDDescriptionExon-Tissue p-Value
Dst6748525Dystonin1.06 × 1020
Abcc66967022ATP-binding cassette subfamily C (CFTR)1.38 × 10²⁰
Slc17a46811714Solute carrier family 17 (sodium phosphate)1.49 × 10¹⁵
Ivns1abp6754014Influenza virus NS1A binding protein4.71 × 1015
Agxt2l26780858Alanine-glyoxylate aminotransferase 2-li2.19 × 1010
Fn16759621Fibronectin 12.66 × 10¹⁰
Stab26775762Stabilin 27.40 × 10¹⁰
Slc7a26975658Solute carrier family 7 (cationic amino)9.87 × 10⁹
Lipc6996667Lipase hepatic9.11 × 108
Pard36979993Par-3 (partitioning defective 3) homolog1.28 × 107
Table 5. The 30 most significantly differentially expressed genes in the GOMolFn classification group.
Number GENumber ASGroup Name
12 (7.90 × 10³)5 (0.00 × 100)GO:0016717 oxidoreductase activity
21 (9.08 × 10²)3 (3.18 × 10¹⁰)GO:0004768
30 (1.00 × 100)3 (3.18 × 10¹⁰)GO:0015020 glucuronosyltransferase activity
43 (5.20 × 10¹⁰)2 (1.22 × 10⁶)GO:0016298 lipase activity
51 (1.10 × 10²)2 (1.43 × 10⁹)GO:00311 Binding to phosphopantetheine
62 (3.13 × 10⁷)0 (1.00 × 100)GO:00425 lipid phosphatase activity
72 (3.13 × 10⁷)1 (2.54 × 10³)GO:0016747 acyltransferase activity
82 (3.13 × 10⁷)0 (1.00 × 100)G9O:0047372 acylglycerol lipase
91 (4.39 × 10²)2 (1.22 × 10⁶)Activity
101 (4.39 × 10²)2 (1.22 × 10⁶)GO:0003872 phosphofructokinase
111 (4.39 × 10²)2 (1.22 × 10⁶)GO:0005550 pheromone binding
120 (1.00 × 100)2 (1.22 × 10⁶)GO:0008559
1312 (6.78 × 101)24 (1.64 × 10⁶)GO:0008800 beta-lactamase activity
141 (2.46 × 101)3 (5.35 × 10⁶)GO:0005506 iron ion binding
157 (4.53 × 101)14 (8.90 × 10⁶)GO:0004467 long-chain fatty acid-CoA ligase activity
161 (2.13 × 10⁴)1 (1.33 × 10⁵)GO-0020037 heme binding
171 (2.13 × 10⁴)1 (1.33 × 10⁵)GO:0019103 pyrimidine nucleotide binding
181 (2.13 × 10⁴)1 (1.33 × 10⁵)GO:0004312 fatty-acid synthase activity
191 (2.13 × 10⁴)1 (1.33 × 10⁵)GO:0004313 [acy·l-cafrier-protein] S- acetyl coA
201 (2.13 × 10⁴)1 (1.33 × 10⁵)GO:0004314 acyl carrier proteinmalonyltransferase activity
211 (2.13 × 10⁴)1 (1.33 × 10⁵)GO:0004317 3-hydroxypalmitoyl-ACP dehydratase activity
221 (2.13 × 10⁴)1 (1.33 × 10⁵)GO:0004319 enoyl-(acyl-carrier protein)
231 (2.13 × 10⁴)1 (1.33 × 10⁵)GO:0004320 oleoyl-(acyl-carrier- protein)
241 (2.13 × 10⁴)1 (1.33 × 10⁵)GO:0010281 Acyl-ACP thioesterase
251 (2.13 × 10⁴)1 (1.33 × 10⁵)GO:0003865 3-oxo-5-alpha-steroid 4-dehydrogenase activity
261 (2.13 × 10⁴)1 (1.33 × 10⁵)GO:0004903 growth hormone receptor activity
271 (2.13 × 10⁴)1 (1.33 × 10⁵)GO:0017046 peptide hormone binding
281 (2.13 × 10⁴)1 (1.33 × 10⁵)GO:0050051 leukotriene-B4 20-monooxygenase activity
291 (2.13 × 10⁴)1 (1.33 × 10⁵)GO:0016213 linoleoyl-CoA desaturase activity
301 (2.13 × 10⁴)1 (1.33 × 10⁵)GO:0003987 acetate-CoA ligase activity
Table 6. The 30 most significantly expressed genes in the GOProcess group.
Number GENumber ASGroup Name
15 (1.51 × 10⁷)0 (1.00 × 100)GO:0015074 DNA integration
22 (3.13 × 10⁷)0 (1.00 × 100)GO:0048661 positive regulation of smooth
32 (3.13 × 10⁷)0 (1.00 × 100)GO:0046879 hormone secretion
42 (3.13 × 10⁷)0 (1.00 × 100)GO:0006564 L-serine biosynthetic process
51 (4.39 × 10²)2 (1.22 × 10⁶)GO:0006235 dTTP biosynthetic process
60 (1.00 × 100)2 (1.22 × 10⁶)GO:0030655 beta-lactam antibiotic
70 (1.00 × 100)2 (1.22 × 10⁶)GO:0046677 response to antibiotic
80 (1.00 × 100)2 (1.22 × 10⁶)GO:0006884 regulation of cell volume
91 (2.46 × 101)3 (5.35 × 10⁶)GO:0042060 wound healing
100 (1.00 × 100)3 (5.35 × 10⁶)GO:0006559 L-phenylalanine catabolic process
117 (4.64 × 10⁴)7 (6.27 × 10⁶)GO:0006633 fatty acid biosynthetic process
121 (2.13 × 10⁴)1 (1.33 × 10⁵)GO:0042276 error-prone translation synthesis
131 (2.13 × 10⁴)1 (1.33 × 10⁵)GO:0016050 vesicle organization Biological Process
141 (2.13 × 10⁴)1 (1.33 × 10⁵)GO:0035249 synaptic transmission, glutamatergic
151 (2.13 × 10⁴)1 (1.33 × 10⁵)GO:0009223 pyrimidine deoxyribonucleotide
161 (2.13 × 10⁴)1 (1.33 × 10⁵)GO:0009264 deoxyribonucleotide catabolic
171 (2.13 × 10⁴)1 (1.33 × 10⁵)GO:0006702 androgen biosynthetic process
181 (2.13 × 10⁴)1 (1.33 × 10⁵)GO:0006636 fatty acid desaturation
191 (2.13 × 10⁴)1 (1.33 × 10⁵)GO:0009124 nucleoside monophosphate metabolic process
201 (2.13 × 10⁴)1 (1.33 × 10⁵)GO:0009133 nucleoside diphosphate biosynthetic process
211 (2.13 × 10⁴)1 (1.33 × 10⁵)GO:0006021 inositol biosynthetic process
221 (2.13 × 10⁴)1 (1.33 × 10⁵)GO:0050983 spermidine catabolic process
230 (1.00 × 100)1 (1.33 × 10⁵)GO:0031110 regulation of microtubule polymerization
240 (1.00 × 100)1 (1.33 × 10⁵)GO:0045104 intermediate filament cytoskeleton organization
250 (1.00 × 100)1 (1.33 × 10⁵)GO:0019585 glucuronate metabolic process
260 (1.00 × 100)1 (1.33 × 10⁵)GO:0001811 negative regulation of type I
270 (1.00 × 100)1 (1.33 × 10⁵)GO:0002862 negative regulation of inflammatory response
280 (1.00 × 100)1 (1.33 × 10⁵)GO:0002839 positive regulation of immune
290 (1.00 × 100)1 (1.33 × 10⁵)GO:0032816 positive regulation of natural killer cell activation.
300 (1.00 × 100)1 (1.33 × 10⁵)Group Name
Table 7. The 30 significantly expressed genes in the GOCellLoc classification.
Number GENumber ASGroup Name
12 (3.13 × 10⁷)0 (1.00 × 100)GO:0042382 paraspeckles
21 (4.39 × 10²)2 (1.22 × 10⁶)GO:0005945 6-phosphofructokinase complex
32 (1.67 × 10²)3 (5.35 × 10⁶)GO:0046581 intercellular canaliculus
40 (1.00 × 100)3 (5.35 × 10⁶)GO:0017053 transcriptional repressor complex
51 (2.13 × 10⁴)1 (1.33 × 10⁵)GO:0014069 postsynaptic density
60 (1.00 × 100)1 (1.33 × 10⁵)GO:0005674 transcription factor TFIIF complex
70 (1.00 × 100)1 (1.33 × 10⁵)GO:0019815 B cell receptor complex
80 (1.00 × 100)1 (1.33 × 10⁵)GO:0042571 immunoglobulin complex
90 (1.00 × 100)1 (1.33 × 10⁵)GO:0009346 citrate lyase complex
100 (1.00 × 100)1 (1.33 × 10⁵)GO:0031074 nucleocytoplasmic shuttling complex
110 (1.00 × 100)1 (1.33 × 10⁵)GO:0001917 photoreceptor inner segment
120 (1.00 × 100)1 (1.33 × 10⁵)GO:0008352 Katanin complex
130 (1.00 × 100)1 (1.33 × 10⁵)GO:0000137 Golgi cis cisterna
144 (1.31 × 10⁴)1 (2.92 × 101)GO:0019028 viral capsid. Cellular Component
154 (1.31 × 10⁴)0 (1.00 × 100)GO:0005815 microtubule organizing center
161 (2.13 × 10⁴)0 (1.00 × 100)GO:0030134 ER to Golgi transport vesicle
171 (2.13 × 10⁴)0 (1.00 × 100)GO:0005849 mRNA cleavage factor complex
181 (2.13 × 10⁴)0 (1.00 × 100)GO:0008274 gamma-tubulin ring complex
191 (2.13 × 10⁴)0 (1.00 × 100)GO:0005850 eukaryotic translation initiation factor 2 complex
201 (2.13 × 10⁴)0 (1.00 × 100)GO:0000120 RNA polymerase I transcription regulator
211 (2.13 × 10⁴)0 (1.00 × 100)GO:0031226 intrinsic to plasma membrane
221 (2.13 × 10⁴)0 (1.00 × 100)GO:0045180 basal cortex
231 (2.13 × 10⁴)0 (1.00 × 100)GO:0019185 snRNA-activating protein comp
241 (2.13 × 10⁴)0 (1.00 × 100)GO:0030530 heterogeneous nuclear ribonucleoprotein
251 (2.13 × 10⁴)0 (1.00 × 100)GO:0030014 CCR4-NOT complex
261 (2.13 × 10⁴)0 (1.00 × 100)GO:0005672 transcription factor TFllA complex
271 (2.13 × 10⁴)0 (1.00 × 100)GO:0000506 glycosylphosphatidylinositol-N-acetylglucosaminyl-transferase (GPI-GnT) complex
282 (5.98 × 10⁴)1 (4.0 × 10²)GO:0043197 dendritic spine
292 (5.98 × 10⁴)0 (1.00 × 100)GO:0019005 SCF ubiquitin ligase complex
303 (1.56 × 10³)1 (2.22 × 101)GO:0005669 transcription factor TFllD complex
Table 8. The nine most significantly expressed genes in the Pathway classification group.
Number GENumber ASGroup Name
12 (3.13 × 10⁷)0 (1.00 × 100)GenMAPP Small_ligand_GPCRs
26 (6.20 × 10⁶)0 (1.00 × 100)GenMAPP GPCRDB_Class_A_Rhodopsin-like
33 (1.81 × 10⁴)1 (1.47 × 101)GenMAPP GPCRDB_Class_B_Secretin-like
41 (2.13 × 10⁴)0 (1.00 × 100)GenMAPP Monoamine_GPCRs
51 (2.13 × 10⁴)0 (1.00 × 100)GenMAPP GPCRDB_Class_C_Metabotropic_glutamate receptors
63 (3.32 × 10³)3 (2.73 × 10⁴)GenMAPP Fatty_Acid_Synthesis
736 (1.56 × 10³)22 (6.93 × 10²)GenMAPP mRNA_processing_binding_Reactom
84 (3.77 × 10³)2 (1.03 × 101)GenMAPP Mitochondrial_fatty_acid_betaoxi
98 (9.02 × 10³)6 (1.63 × 10²)GenMAPP Ribosomal_Proteins
Disclaimer/Publisher’s Note: The statements, opinions and data contained in all publications are solely those of the individual author(s) and contributor(s) and not of MDPI and/or the editor(s). MDPI and/or the editor(s) disclaim responsibility for any injury to people or property resulting from any ideas, methods, instructions or products referred to in the content.