1. Introduction
Death rates from hepatocellular carcinoma (HCC) are rising globally, with particularly high incidences in developing countries [
1]. Significant progress has been made in the systemic treatment of advanced HCC over the last decade [
2], especially in studying the tumor immune microenvironment and predicting HCC outcomes [
3]. However, not all patients with HCC respond well to recently developed treatment approaches, and many exhibit therapeutic resistance [
4].
Chemicals are often classified as carcinogens based on the presence of hepatocellular tumors in rat livers, which has significant implications. There is now greater potential to integrate the scientific understanding of the etiology of these tumors into hazard characterization and dose–response assessments, aligning them with human relevance frameworks [
5]. Diethylnitrosamine (DEN) is a mutagenic and genotoxic agent that causes DNA alterations and gene expression changes, leading to liver cancer in experimental wild-type or transgenic animal models [
6]. The mechanisms of DEN-induced chemical carcinogenesis have provided additional insights [
7] into preventive and protective mechanisms against DEN exposure [
8,
9], although some aspects remain controversial. Understanding the biology of liver tumors is crucial for developing therapeutic agents and improving patient survival following chemical or surgical treatment [
10].
Cyto-truncated c-Met transgene expression provides resistance to apoptotic stimuli in vivo and establishes immortalized, non-transformed hepatocyte cell lines [
11]. The loss of c-Met signaling in c-Met conditional knockout animals accelerates DEN-induced liver tumor formation due to the compensatory high expression of epidermal growth factor receptor (EGFR) [
9]. Conversely, DEN accelerates liver tumor growth in a hepatocyte growth factor (HGF) transgenic mouse model via c-Met activation [
12]. The c-Myc transcription factor (TF) is a well-known oncogene due to its critical role in cancer and stem cell maintenance. Many frequently occurring human malignancies, including breast, colon, stomach, and pancreatic cancers, involve dysregulated c-Myc expression. Several human malignancies are influenced by c-Myc through its regulation of genes involved in mitochondrial and ribosomal synthesis, as well as glucose and glutamine metabolism [
13]. Although c-Myc is expressed in various tissue tumors, few studies have explored anti-c-Myc antibody therapy for HCC [
14]. Additionally, the use of herbal extracts containing quercetin as an active component has been investigated for directly targeting c-Myc by reducing reactive oxygen species (ROS) production [
15] or inhibiting the release of exosomes from tumor cells under hypoxic conditions [
16].
The goal of this study was to investigate the complex interplay of growth factors that enhance liver tumor formation in a c-Myc model treated with DEN. This research could contribute to the development of more effective HCC management protocols and potentially improve the survival rate for individuals suffering from HCC.
2. Materials and Methods
2.1. Laboratory Animals, Transgenicity, and Treatment
The Guide for the Care and Use of Laboratory Animals, eighth edition, National Academies Press, was followed for animal treatment. The study was approved by the Animal Welfare Ethics Commission of Hannover, Germany (33.9-42502-04-08/1619), as well as by the ethical committee of King Faisal University (KFU-25-ETHIC53114). The ATT-Myc transgenic line (c-myc model under alpha 1 antitrypsin promotor) was previously described by Dalemans et al. [
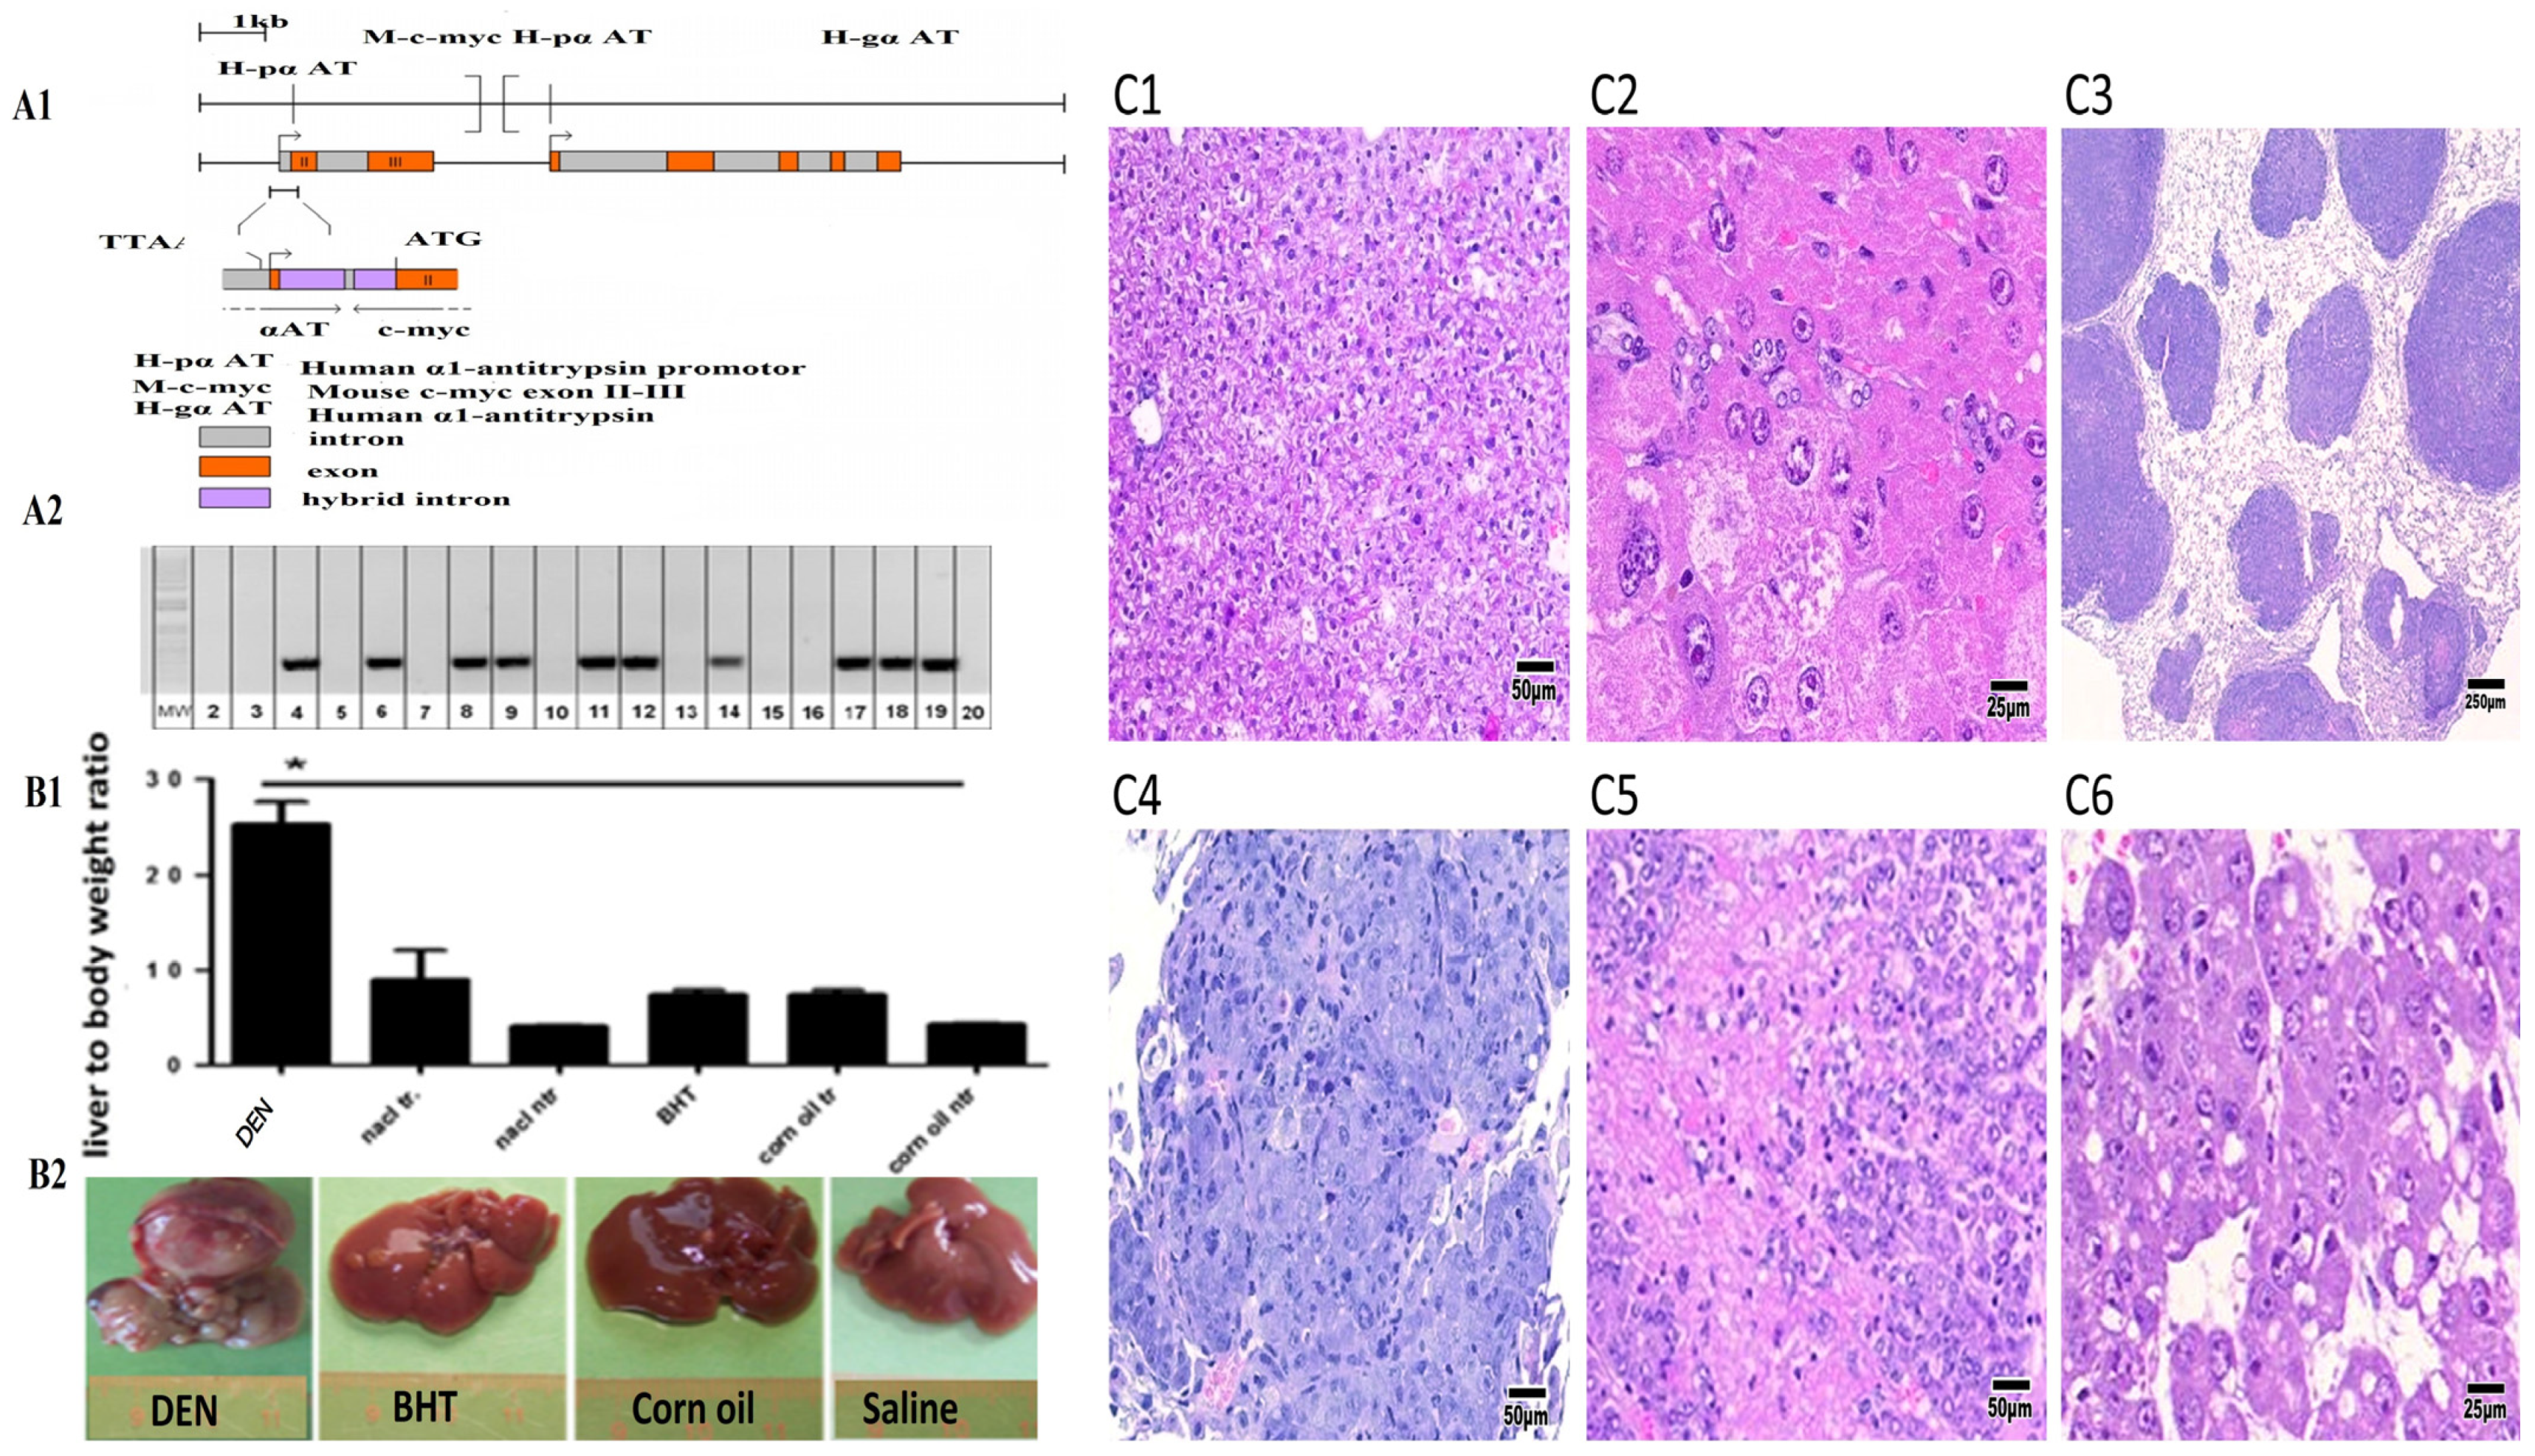
17]. The transgenic mouse strain was of the C57BL/6 background. PCR was performed using HotStarTaq DNA polymerase (Qiagen, Germantown, MD, USA). Annealing temperatures and cycle numbers are indicated in brackets after each primer pair. The transgene was verified by a PCR analysis of DNA extracted from tail biopsies using the following forward and reverse primers: forward primer: 5′-TCCTGTACCTCGT-CCGATTC-3′; reverse primer: 5′-GTTGTGCTGGTGAG-TGGAGA-3′ (60 °C, 31 cycles) (see
Figure 1). Chemical treatments—DEN, butylated hydroxytoluene (BHT), corn oil, and saline vehicle—including doses and exposure conditions, were described earlier [
3,
4,
5]. BrdU (Sigma-Aldrich, Burlington, NJ, USA) was injected once at 100 mg/kg two hours before sacrifice [
8]. Mice were sacrificed at four different time points (4, 5.5, 7, and 8.5 months). Animals were euthanized using excess CO
2, and histopathological analysis was performed. The remaining animals were disposed of safely.
2.2. Sample Collection and Preparation
Six mice were anesthetized using CO2 overdose and sacrificed at 4, 5.5, 7, and 8.5 months. The thoracic cavity was opened using standard surgical procedures, and the liver was excised and rinsed with PBS. Organ weights were recorded, and tumors were inspected macroscopically before being separated from liver tissue. Liver samples were preserved in 4% buffered formalin or immediately frozen in liquid nitrogen.
2.3. Histology
Liver tissues from transgenic and control animals were fixed in 4% formaldehyde in PBS and embedded in paraffin following standard procedures. Paraffin-embedded tissues were sectioned into 3–5 µm slices and stained with hematoxylin and eosin (H&E).
2.4. Isolation of RNA from Liver Tissues and Exon Array Procedures and Analysis
NA was isolated from liver tissue as previously described Target Labeling Assay Manuals were strictly followed. The assay involved ribosomal RNA reduction, cDNA synthesis, cRNA hydrolysis, fragmentation, terminal labeling, hybridization, washing, and staining of microarray chips. The sample preparation included RNA reduction and cDNA synthesis, purification of double-stranded cDNA, synthesis of biotin-labeled cRNA, purification of biotin-labeled cRNA, fragmentation of biotin-labeled cRNA, hybridization of GeneChip® arrays, washing and staining of GeneChip® arrays, and scanning of GeneChip® arrays.
2.5. Interpretation of GeneChip® Data
Quality indicators were assessed to determine the reliability of GeneChip® results. The GeneChip® Operating Software (Microarray. Suite 5.0 software) generated reports listing key expression ratios, including noise values (Q), target signal values, scale factors (SF), and hybridization controls. The software also provided normalized expression values for probe sets.
2.6. Validation of Gene Expression by Real Time-PCR (RT-PCR)
Total RNA was purified using QIAzol reagent (Qiagen, Germany). RNA quality was assessed using a Nanodrop 2000 spectrophotometer (Thermo Fisher Scientific, Waltham, MA, USA). cDNA synthesis was performed using reverse transcriptase enzyme (Bioline, London, UK). cDNA amplification was conducted using a real-time PCR machine (ThermoScientific, Waltham, MA, USA). The reaction volume was 20 µL. The PCR program was set at 95 °C for two minutes, followed by 40 cycles of denaturation at 95 °C for 10 s and annealing/extension at 60 °C for 30 s. The primer sequences used are listed in
Table 1. β-actin was utilized as a reference gene. All experiments were performed in triplicate. Relative gene expression was calculated using the ∆Ct method (Ct target gene—Ct housekeeping gene), and the 2−∆∆Ct method was utilized to determine fold changes (FCs) in gene expression. PCR products were imaged using a Kodak Image Station 440CF under UV light after agarose gel electrophoresis with ethidium bromide staining.
2.7. Western Blotting
Frozen liver tissue samples were lysed in lysis buffer 3 supplemented with protease inhibitors (Benzonase). Whole-cell lysates were obtained by homogenization using an ultrasonic processor, followed by centrifugation at 10,000 rpm and 20 °C for 20 min. The supernatant was recovered, and the protein content of the lysate was determined using the Bradford protein assay (Bio-Rad), with bovine serum albumin as the standard.
A total of 100 μg of total protein extract was separated on 8%, 12%, and 15% SDS–polyacrylamide gels and subsequently blotted onto a PVDF membrane using 25 mM Tris and 190 mM glycine at 4 °C for two hours at 350 mA. Blots were blocked in Rotiblock (Roth, Karlsruhe, Germany) for one hour and then incubated with the primary antibodies listed in
Table 2. After washing with Tris-buffered saline (25 mM Tris and 135 mM NaCl; pH 7.6) containing 0.1% Tween, the membranes were incubated with the corresponding secondary anti-mouse IgG κ antibody (sc-516102, Santa Cruz) at room temperature for one hour.
Following extensive washing, the blot was developed using enhanced chemiluminescent detection (Perkin-Elmer, Juegesheim, Germany) and recorded using a Kodak IS 440CF imaging system (Kodak; Biostep GmbH, Jahnsdorf, Germany). GAPDH was used as a reference protein. All experiments were performed in triplicate.
2.8. Immunohistochemistry
After embedding in paraffin, fixed liver tissue was sectioned at a distance of 4–5 mm. The sections were de-paraffinized, rehydrated, and heated to boiling in 0.01 M citrate buffer (pH 6.0) in a microwave oven. After the portions boiled, they were cooked for a further 15 min on low heat. After that, the portions were blocked for 10 min at room temperature using 1.5% normal serum. The antisera c-Myc, c-Met, proliferative cell nuclear antigen (PCNA), and bromodeoxyuridine (BrdU) are included in
Table 3 of the antibody list. The following 1:200 dilutions of antisera were used to incubate the liver sections for a whole night at room temperature. The DAKO Staining System was then used to visualize immunoreactivity (shown in brown) to the corresponding protein in accordance with the manufacturer’s instructions. Normal rabbit or goat IgG was used in place of a primary antibody in the negative control sections for the anti-PCNA and anti-BrdU antisera. We used Mayer’s hematoxylin as a counterstain for the sections. An Axiom vision light microscope and a Nikon DXM1200F digital camera were then employed to take pictures of the sections.
2.9. Statistical Analysis
The study utilized a mixed model analysis of variance to compare six hybridizations of DEN treatments with six hybridizations of BHT at the age of 8.5 months. Exon array expression was normalized to the control non-transgenic background on the MouseExon10ST array. The analysis was conducted using XRAY software (version 3.2). Gene expression probes were normalized against historical data. FCs were considered significant at p ≤ 0.05, and the Student’s t-test was used for statistical analysis.
3. Results
3.1. Acceleration of Tumor Growth in ATT-Myc Transgenic Mice Treated with DEN
Figure 1A1,A2 presents the construction of an ATT-Myc mouse model of liver cancer and the expression of the c-Myc transgene as a PCR product in gel electrophoresis. The ratio of liver weight to body weight was significantly increased in 5.5–8.5-month-old ATT-Myc transgenic mice treated with DEN compared with transgenic mice treated with saline, BHT, or paracetamol. This increase in liver weight was due to rapid tumor growth, which is also shown in the overall image (see
Figure 1B1,B2).
Notably, the liver parenchyma of non-transgenic mice showed no discernible alterations, with intact bile ducts, vasculature, and lobular architecture. Only a small percentage of transgenic animals exhibited uni- or multi-focal dysplastic liver nodules, affecting 10–80% of the liver parenchyma, with nodule sizes ranging from 1 to 10 mm. The hepatocytes in these foci displayed a nodular architecture, uni- to bi-cellular layers, and a maintained nuclear/cytoplasmic ratio. Pseudoglandular regions, cystic gaps within tumors, and multilayered trabecular architecture were observed in HCC (see
Figure 1C1–C6). In some DEN-treated animals, metastasis of primary liver cancer to the lungs was observed. Additionally, in rodent bioassays, the primary target organs for DEN-induced carcinogenesis included the liver and lungs,
3.2. Gene Expression Differences Between Genotoxic and Non-Genotoxic Liver Carcinogens
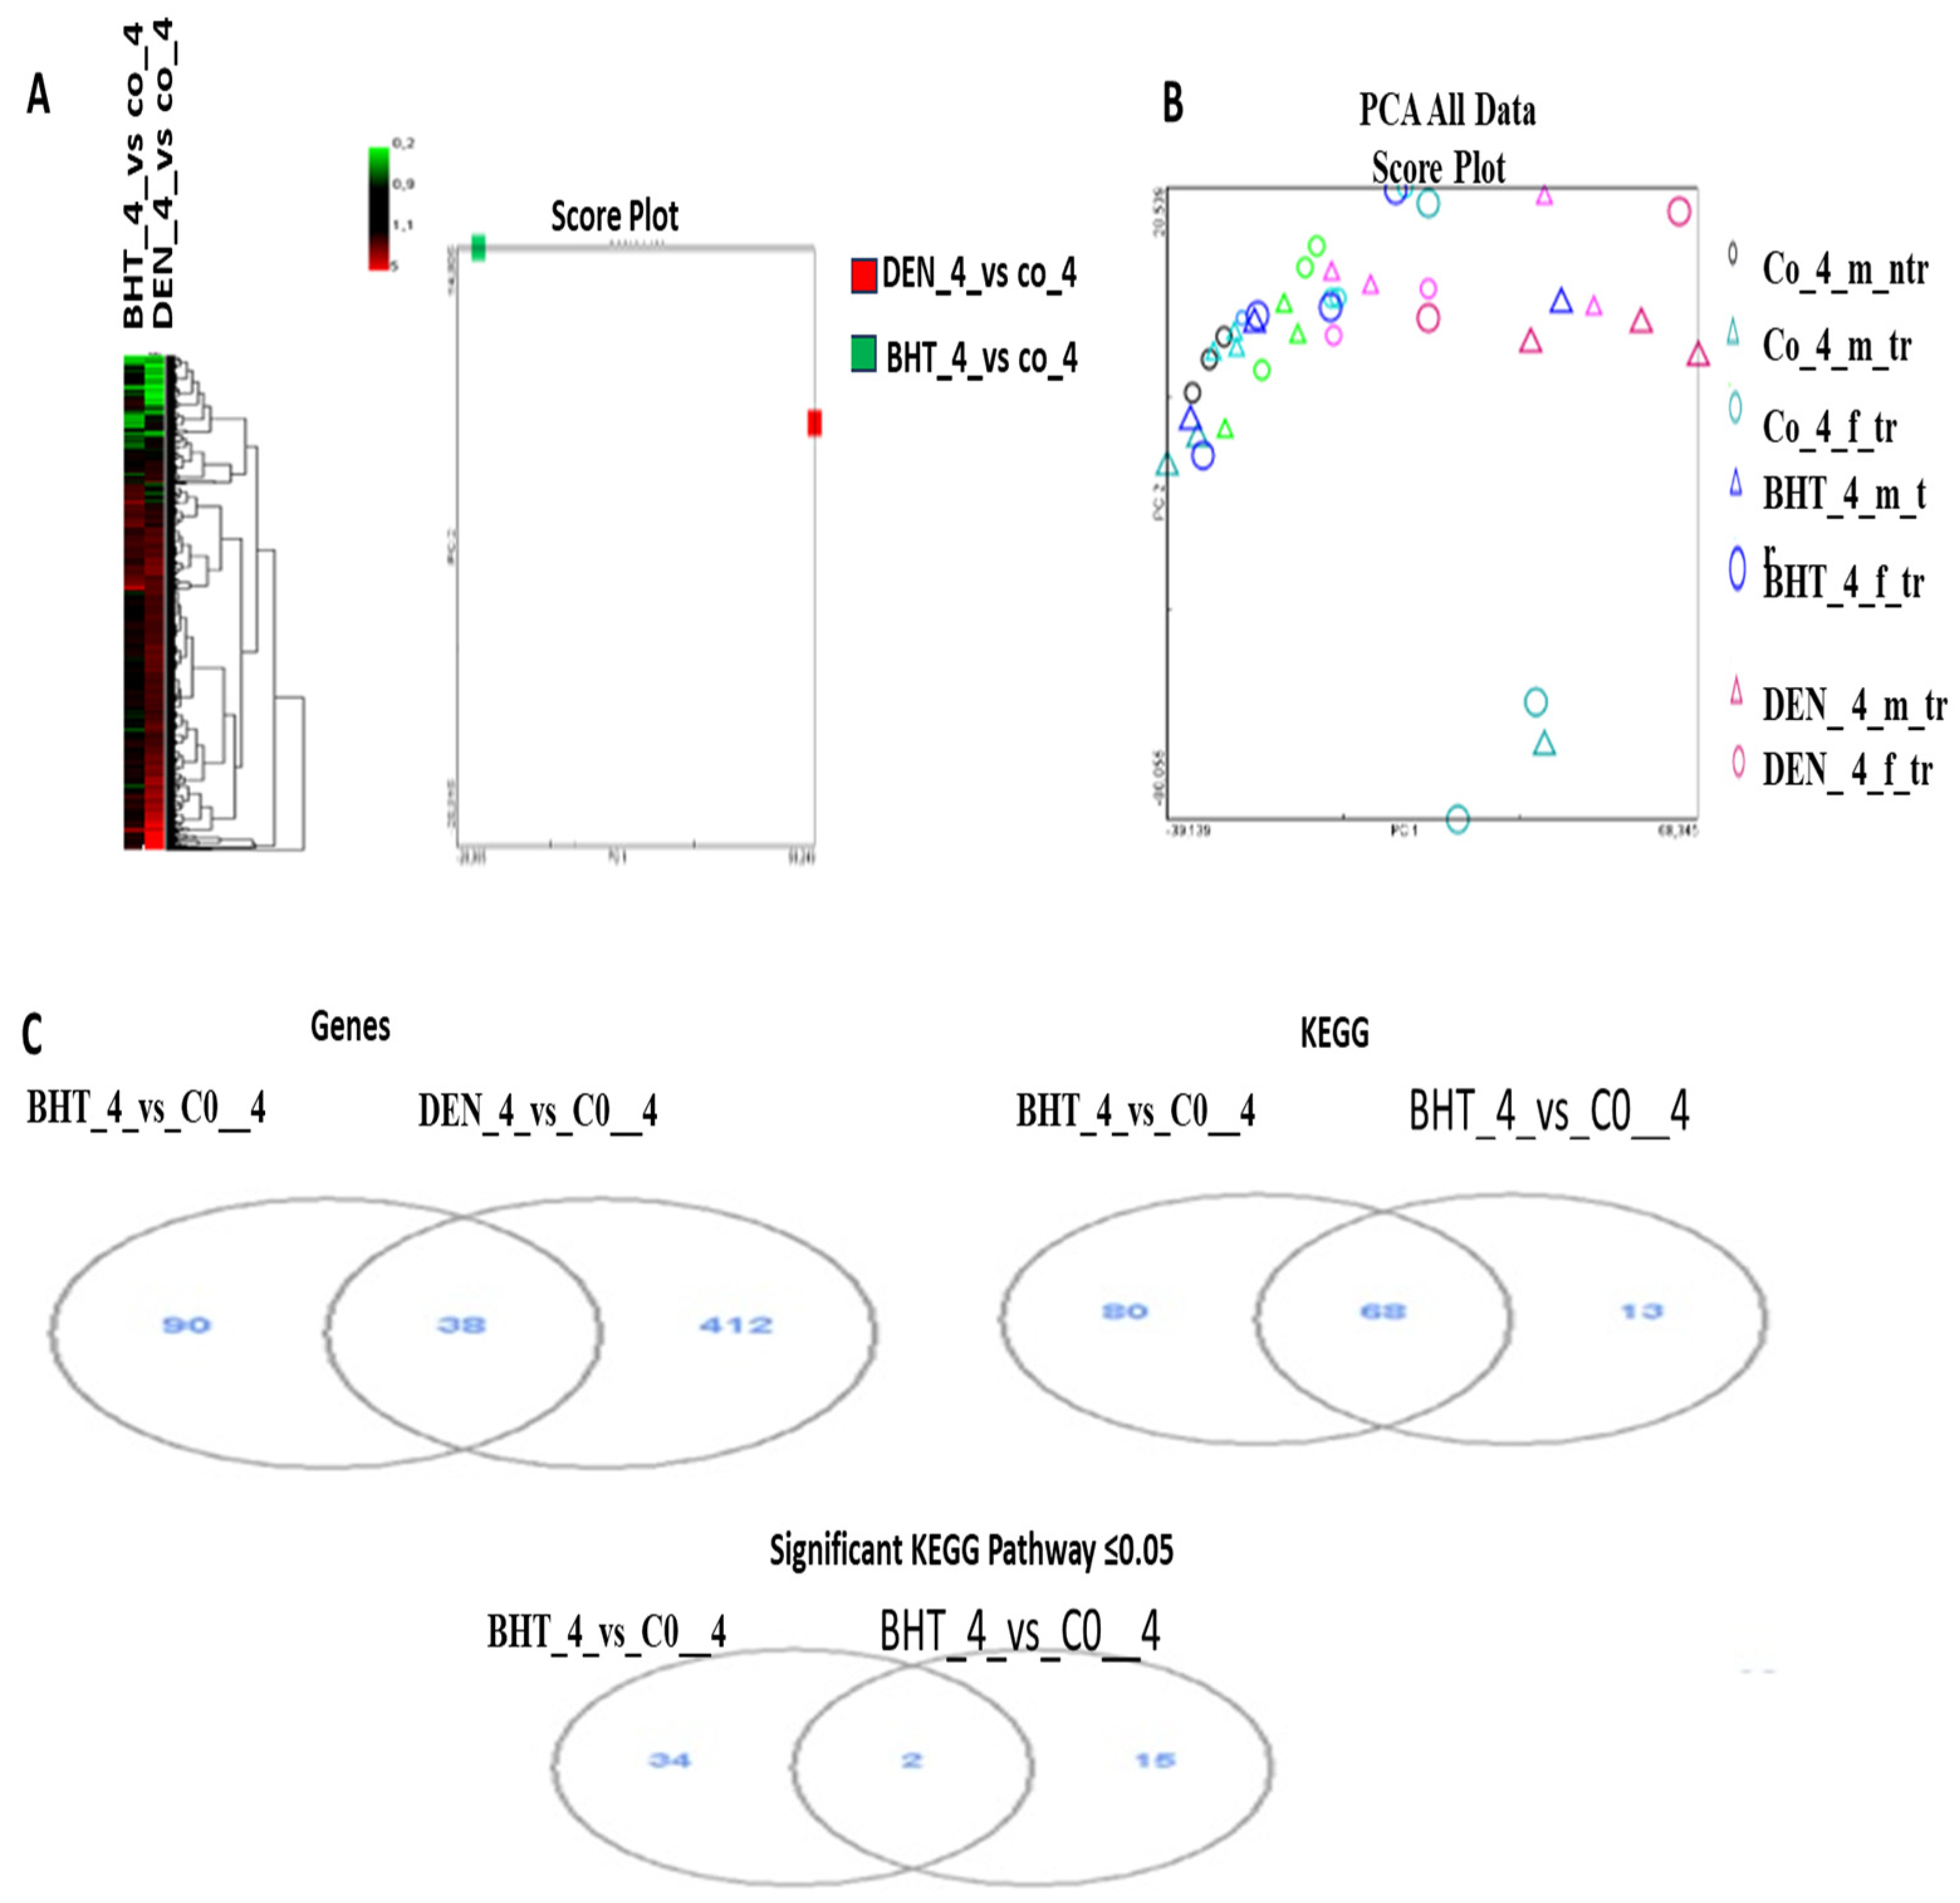
Hierarchical clustering analysis (HCA) and principal component analysis (PCA) were performed to compare changes in gene expression in the livers of AAT-Myc transgenic mice treated with BHT and DEN at the age of 8.5 months with transgenic control mice given vehicles. The analysis was conducted on the FCs of 666 significantly regulated genes (SRGs). Compared to control transgenic mice, there were distinct differences, particularly at 8.5 months, in both HCA and PCA analyses. Additionally, the significance of these differences was greater when compared to non-transgenic control mice than when compared to transgenic mice (
Figure 2).
Once AAT-Myc transgenic mice were treated with BHT and DEN at the age of 8.5 months, their livers were analyzed using VD analysis to identify the genes that were significantly regulated. The results showed that 450 genes were significantly upregulated by DEN treatment, while only 128 genes were affected by BHT treatment. For both DEN and BHT, the most prevalent gene function pathway (KEGG) count was 148. For DEN, the significant KEGG pathway count was 36, while for BHT, it was 17 pathways. While BHT did not influence any of the genes linked to these pathways, DEN strongly regulated the cell cycle, DNA replication, p53 signaling pathway, mismatch repair, retinol metabolism, pyrimidine metabolism, and arachidonic acid metabolism. Furthermore, many more genes were regulated by DEN, and even though one or two genes were also regulated by BHT in several pathways, these pathways were not found to be significantly regulated.
Meanwhile, pathways largely controlled by BHT were mostly associated with drug detoxification and cellular metabolism, such as Cyp1a2 and Tpmt, which were downregulated in mice receiving DEN treatment. Additionally, most of the genes associated with metabolism of xenobiotics by cytochrome P450 (KEGG), linoleic acid metabolism (KEGG), and arachidonic acid metabolism (KEGG) were downregulated in DEN-treated transgenic mice but remained unchanged in BHT-treated mice. Furthermore, the metabolism of ascorbate and aldarate (KEGG) was largely downregulated in DEN-treated mice but remained mostly intact with BHT therapy.
Notably, tumor growth in the DEN group was significantly correlated with an increase in transformed or carcinogenic hepatocyte proliferation, which requires increased glucose metabolism. This included upregulation of Glut-1 and subsequent upregulation of glycosaminoglycan degradation (KEGG), starch and sucrose metabolism (KEGG), pentose phosphate pathway (KEGG), fructose and mannose metabolism (KEGG), other glycan degradation (KEGG), glycosphingolipid biosynthesis ganglioside (KEGG), galactose metabolism (KEGG), and inositol phosphate metabolism (KEGG). Conversely, livers with advanced disease progression were unable to process lipids, as evidenced by the downregulation of fatty acid metabolism (KEGG), linoleic acid metabolism (KEGG), and arachidonic acid metabolism (KEGG).
There were 270,096 transcript clusters in total in the MouseExon10ST array. Upon applying the designated criteria, 8090 clusters containing between 4 and 200 probe sets were identified. These clusters were subsequently tested for alternative splicing and differential gene expression using the previously described statistical techniques. An overview of the expressed genes (transcript clusters) in each group among the tested clusters is given in the transcript clusters below.
| Group | Number of transcript clusters with significant expression in the group |
| DEN_4_mf | 7501 92.7% of genes tested |
| bht_4_mf | 7162 88.5% of genes tested |
Using the same test, the following deferential comparison of gene expression summarizes frequencies of pairwise co-expression between the study groups.
| | DEN | BHT |
| DEN | - | 7 (0.609) |
| BHT | 7162 (0.270) | - |
The unmodified number is inclusive, while the figures in parentheses, if supplied, indicate exclusivity. For example, the DEN_4_mf group is significantly expressed above the background in 7501 genes, and is solely expressed in 609 genes without any other group exceeding the background. All co-expression patterns are summarized in the following table, which shows frequencies only. For example, the group DEN_4_mf+bht_4_mf is solely expressed by 6892 genes, and no other tissues exhibit expression above the background.
DEN_4_mf+bht_4_mf 6892
DEN_4_mf 609
bht_4_mf 270
3.2.1. Differential Gene Expression and Alternative Splicing
Six hundred and three genes showed statistically significant variations in gene expression across the groups, according to the statistical analysis described in the
Section 2. Furthermore, 434 genes demonstrated substantial exon-group interaction, suggesting alternative splicing; of these, 71 genes showed significant variations in gene expression as well as interaction. In
Table 3, the top tenfold alterations in genes showing a substantial difference in gene expression when comparing DEN to BHT treatment in transgenic mice are listed. The FC is expressed in terms of the normalized, untransformed data.
Table 4 presents the top 10 genes with significant differential alternative splicing.
False Discovery Rate
To ascertain that the false discovery rate for the differential alternative splicing and gene expression assays in this study is annotation below 8 × 10³, the step-down approach previously described was utilized.
3.2.2. Examining and Contrasting Differentially Expressed Genes and Exons with Established Gene Classifications
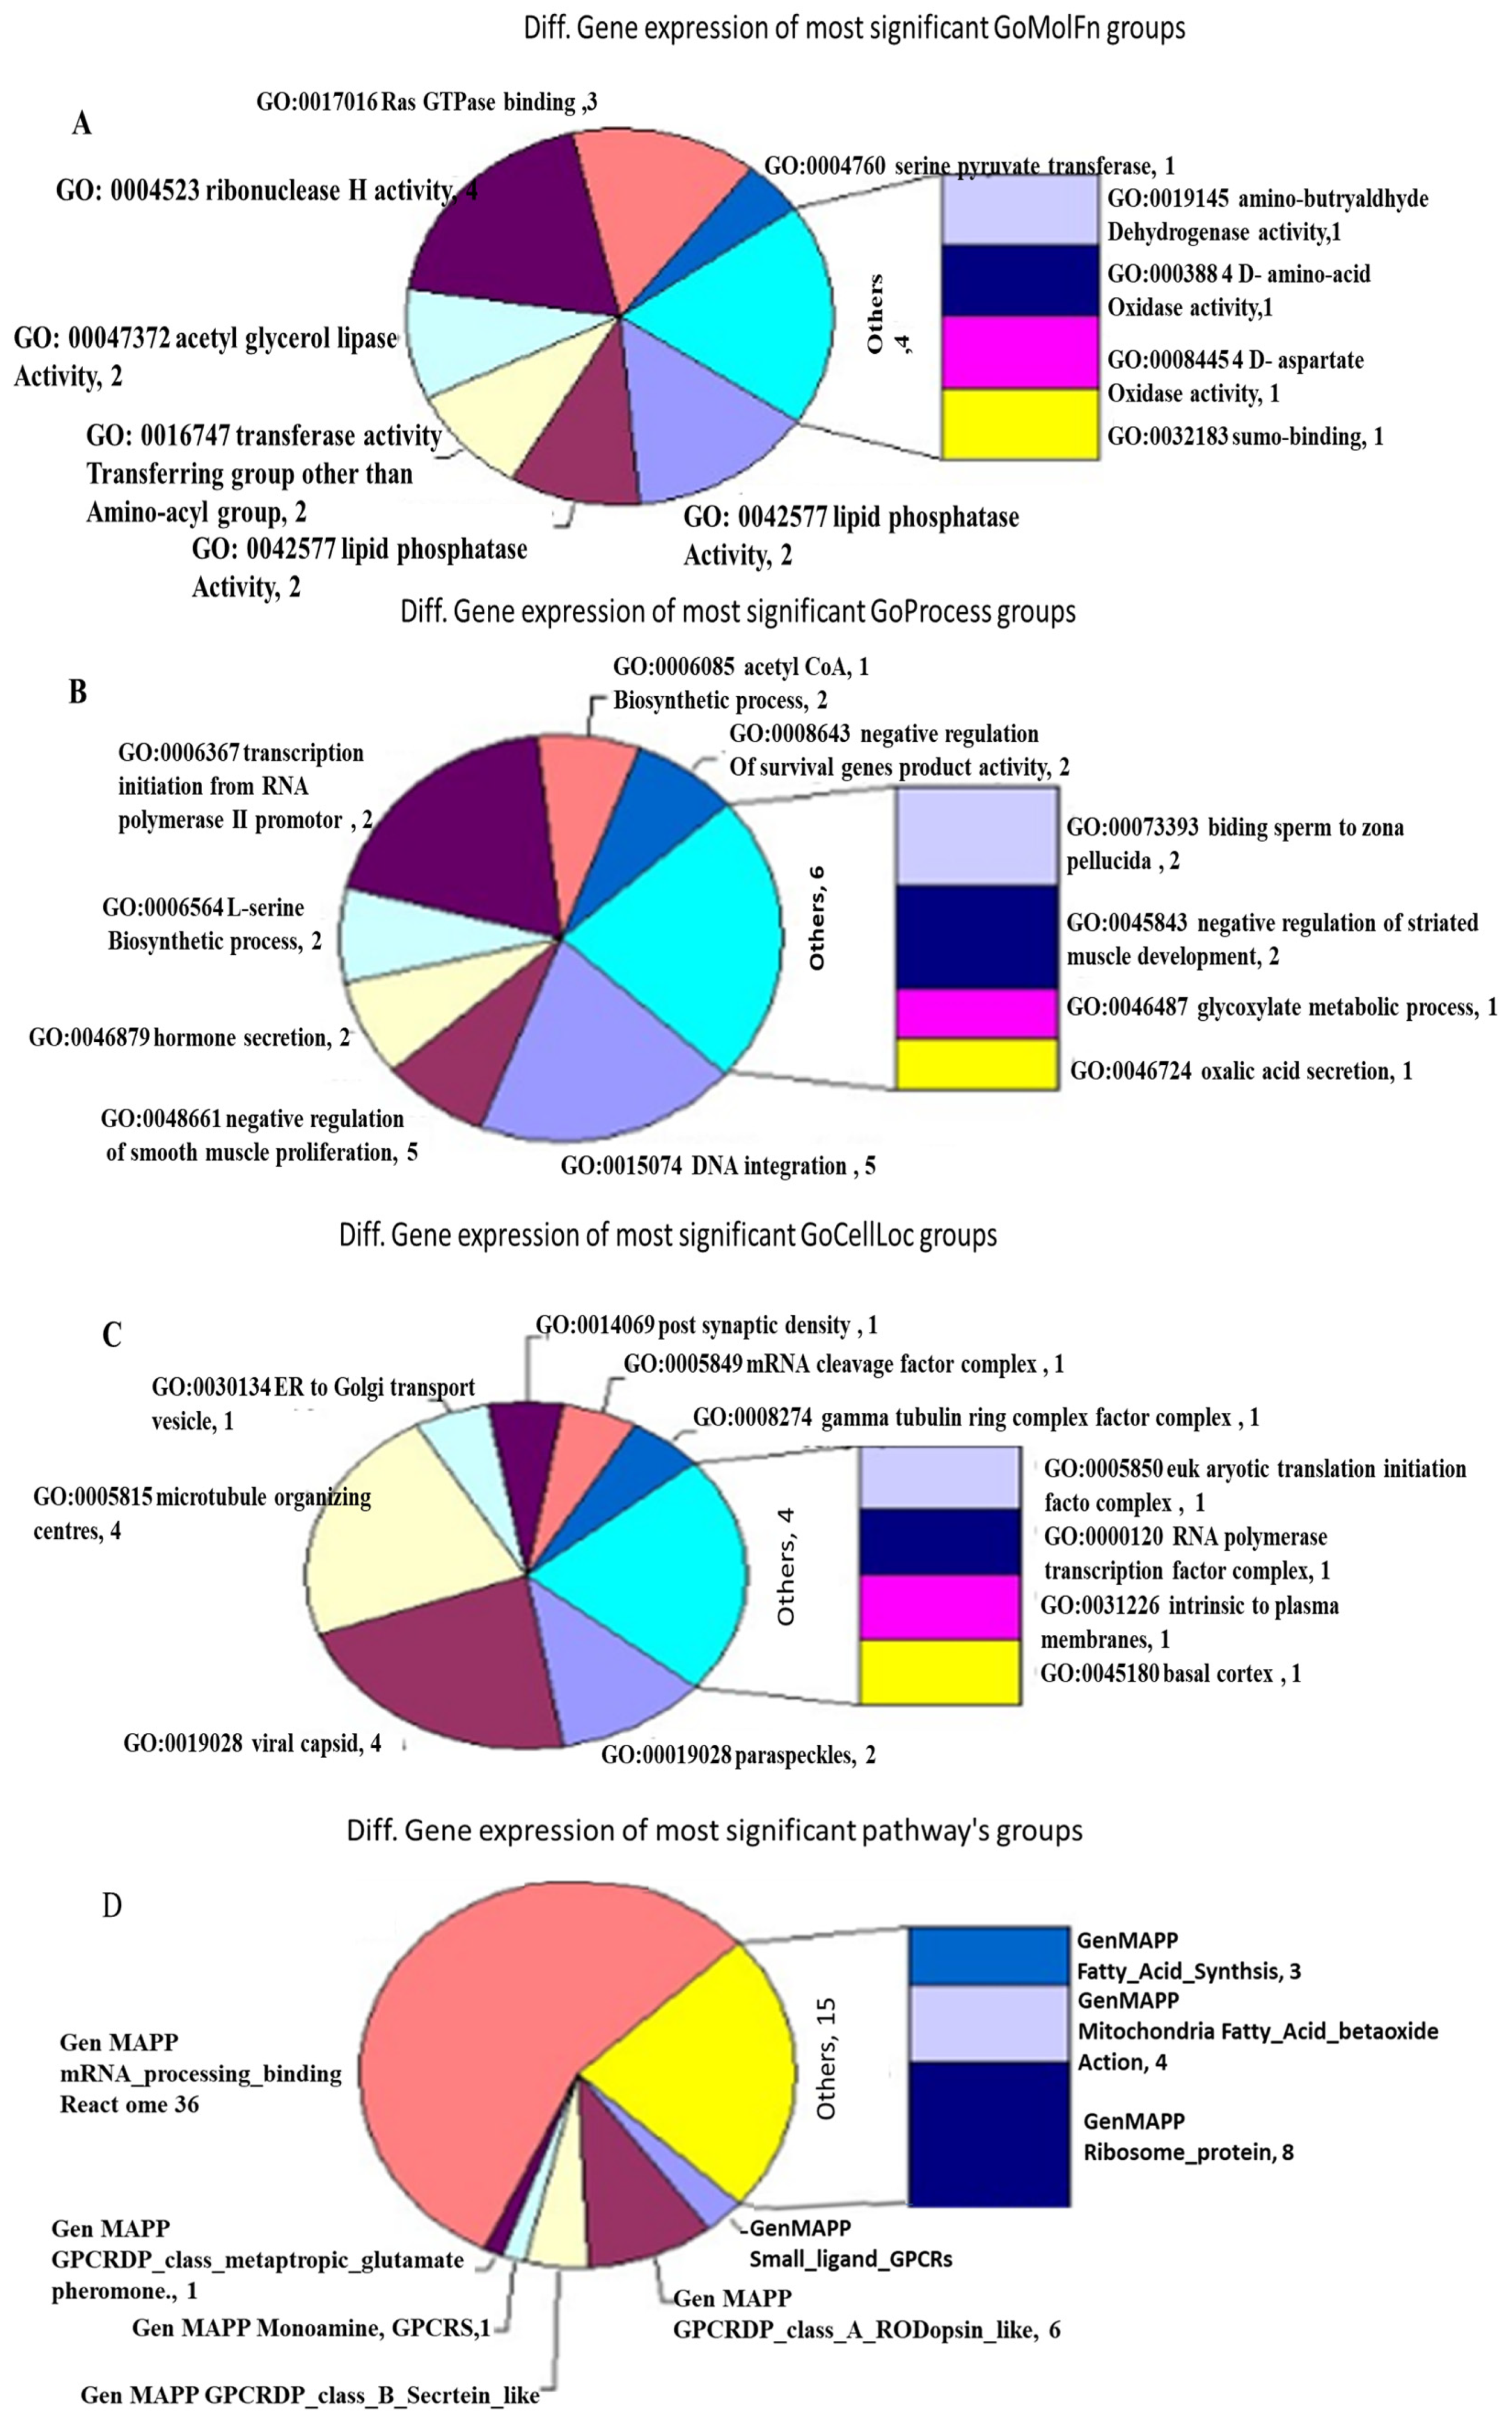
Existing gene classifications were compared to the 8090 genes that were tested for differential alternative splicing and gene expression, as detailed in the MouseExon10ST.info file. The objective was to identify any significant over-representation in the GOMolFn, GOProcess, GOCellLoc, or Pathway classes (
Figure 3). Contingency table analysis was utilized to identify the groups in which genes exhibiting significant splicing or expression changes were over-represented. Under random conditions, the distribution of key genes in a group is hypergeometric.
3.2.3. Significant Representation Within the GOMolFn Categorization Group
As identified by the procedure outlined for evaluating differential splicing and gene expression, 219 groupings within the GOMolFn gene categorization showed a notable over-representation within the list of differently spliced or expressed genes.
Table 5 below shows the top 30 groups. The columns represent the group name, the number of tested genes exhibiting significant differential splicing (along with the corresponding
p-value of over-representation), and the count of genes displaying significant differential gene expression (along with the corresponding
p-value of over-representation). Each row corresponds to a distinct group (
Table 5).
3.2.4. Significant Representation Within the GOProcess Classification Group
The top 30 most significant differential gene expressions in the GOProcess classification group, based on the previously reported method of evaluating differential splicing and gene expression, are reported. Two hundred and eighty-five groups in the GOProcess gene classification showed substantial over-representation within the set of differently spliced or expressed genes.
Table 6 lists the top 30 groups, detailing the count of tested genes displaying significant differential splicing (along with the corresponding
p-value of over-representation), the count of genes exhibiting significant differential gene expression (along with the corresponding
p-value of over-representation), and the group name.
3.2.5. Significant Representation Within the GOCellLoc Group
As identified by the previously outlined method of evaluating differential splicing and gene expression, 44 groups demonstrated considerable over-representation within the set of differentially spliced or expressed genes in the significant representation category of the GOCellLoc classification.
Table 7 lists the top 30 groups, with each row corresponding to a different group. The columns indicate the group name, the number of tested genes exhibiting significant differential splicing (accompanied by the corresponding
p-value of over-representation), and the count of genes displaying significant differential gene expression.
3.2.6. Significant Representation Within the Pathway Classification Group
Using the previously published method of evaluating differential splicing and gene expression, nine groups within the Pathway gene classification group showed a substantial over-representation among the set of genes that were either expressed or differentially spliced.
Table 8 lists the top nine groups, with each row representing a different group.
3.3. Confirmation of Gene Expression by Rt-PCR
Microarray gene expression data revealed an increase in the levels of rpl23, rfc4, mmp12, and bzwz compared to the non-transgenic control. Conversely, c9 exhibited a reduction, and there were no observed changes in dynll1, slc10a, gas6, and the housekeeping gene b-actin (
Figure 4).
3.4. Protein Expression Explored by Western Blotting of Treated Groups
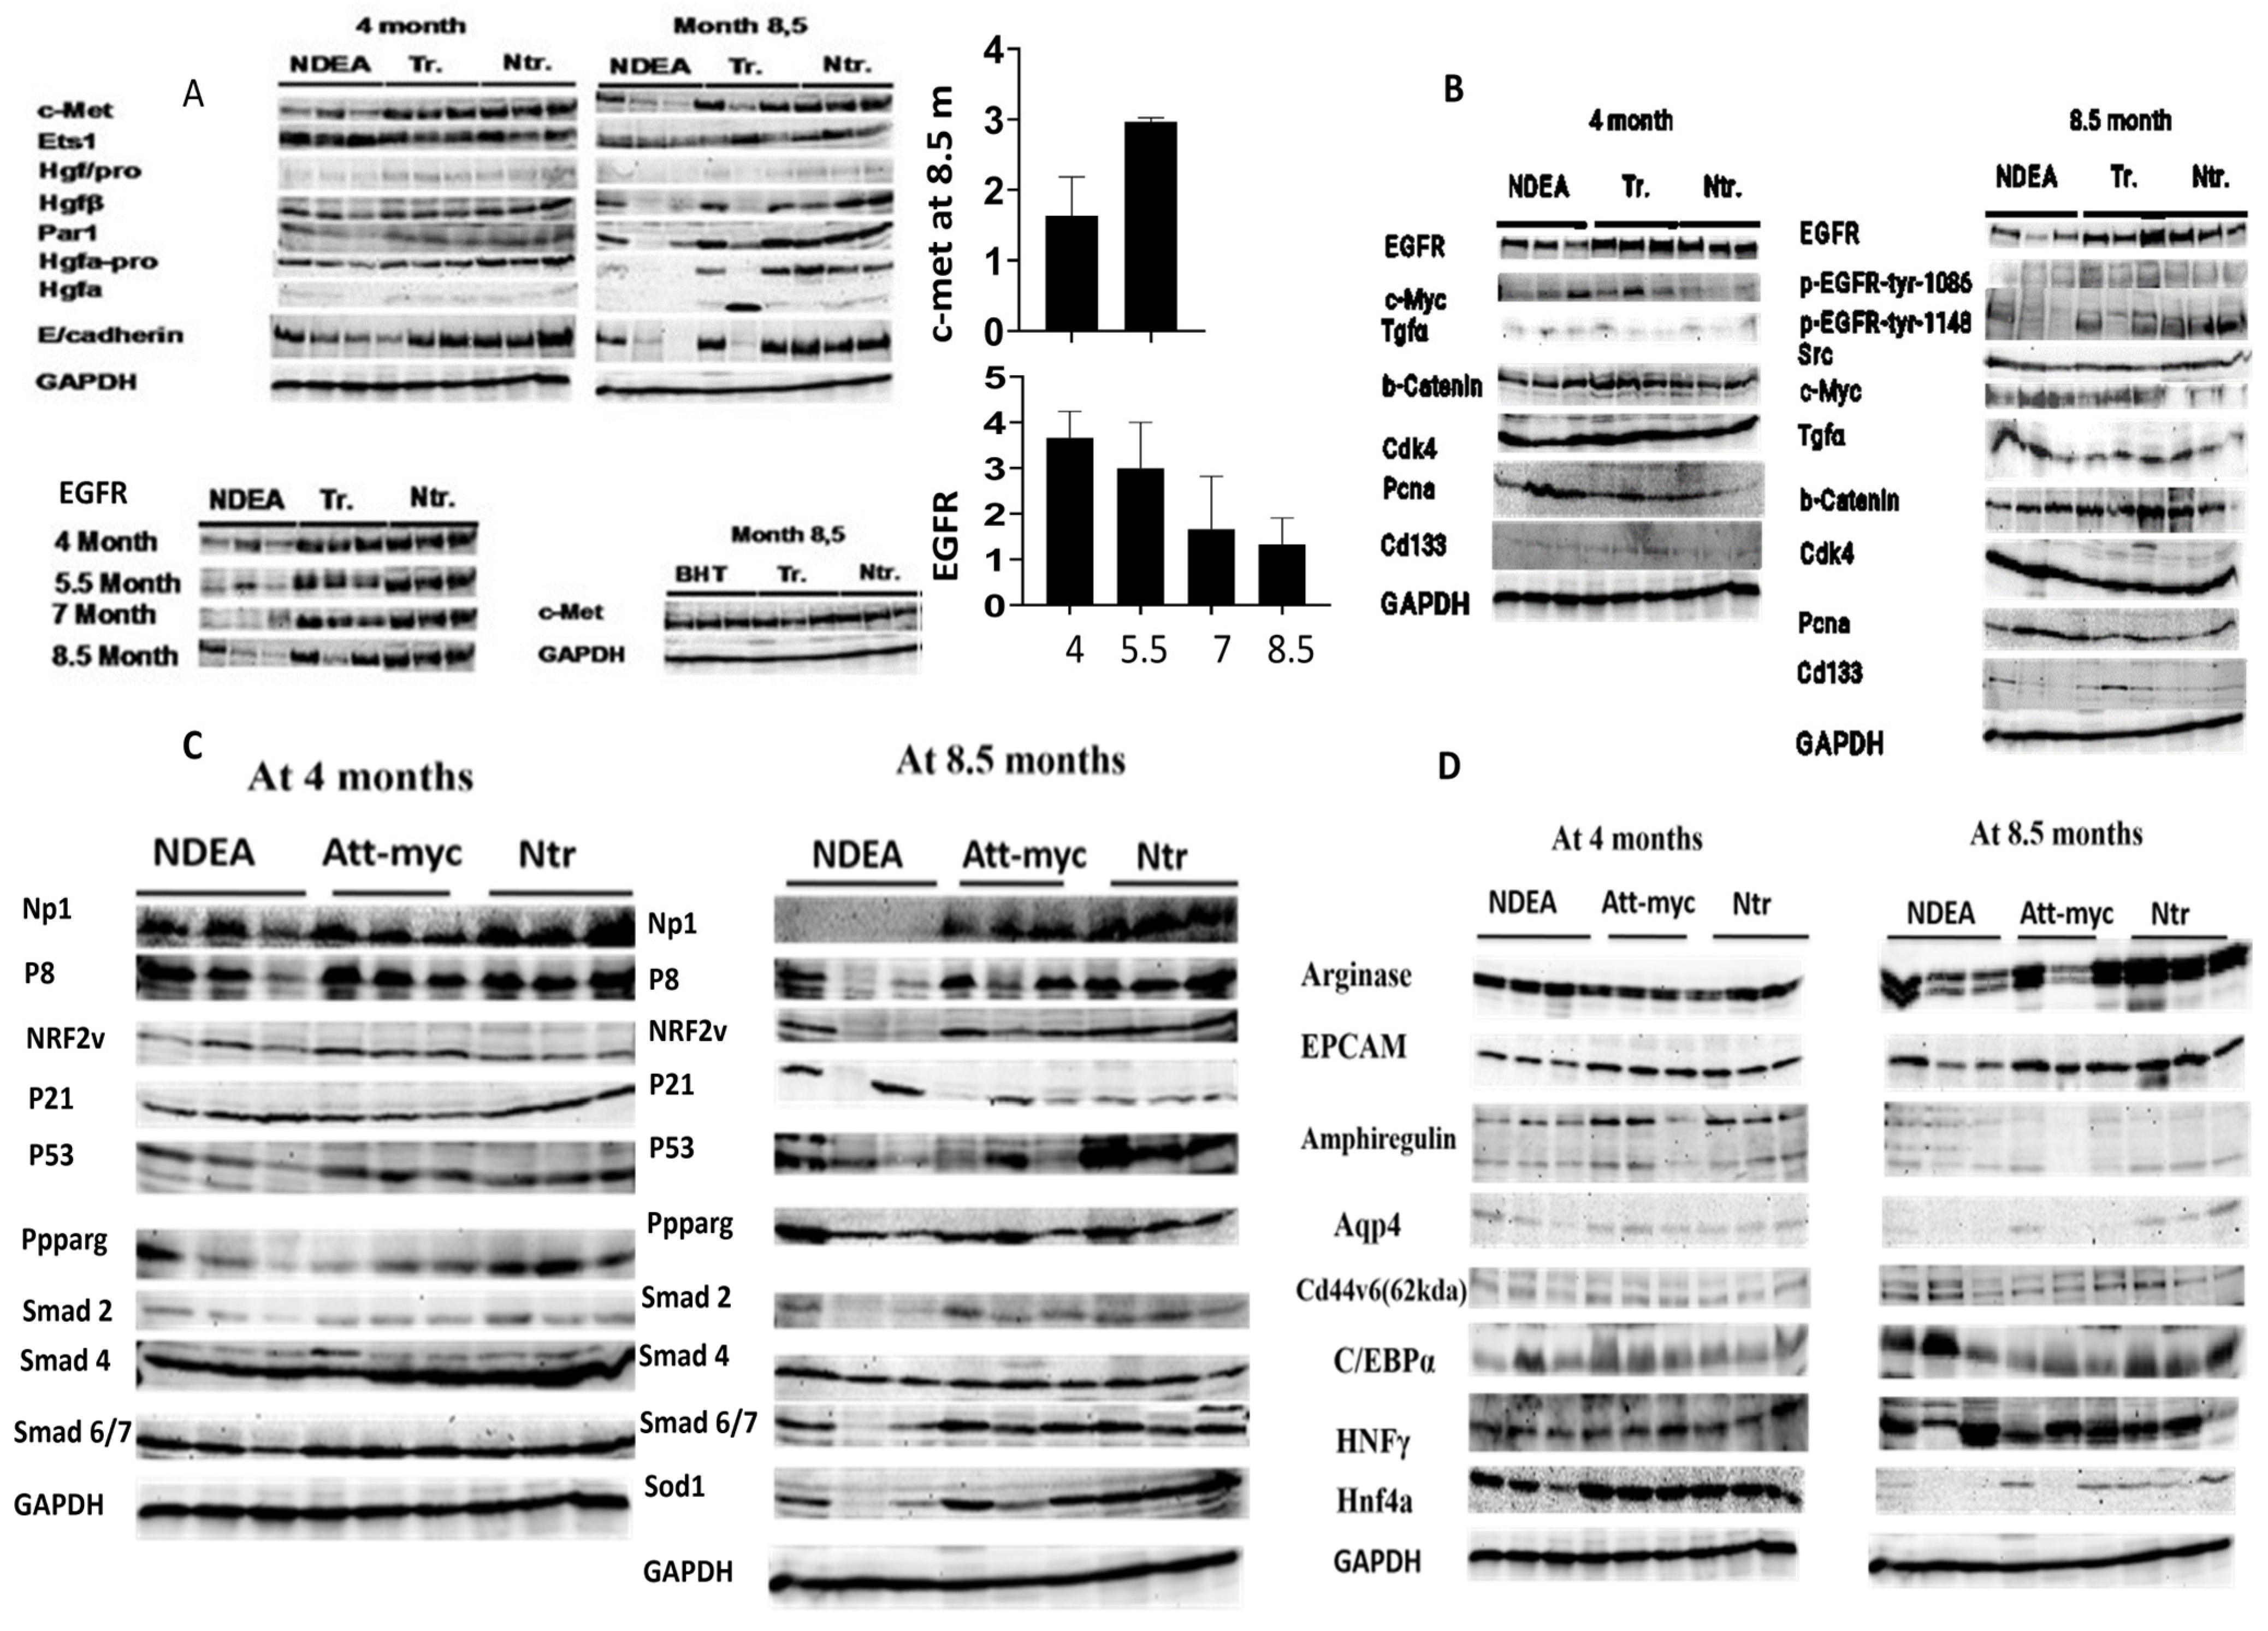
Remarkably, DEN therapy resulted in a greater loss of HGF/c-Met signaling, which may have contributed to the tumor’s rapid growth. Specifically, only ATT-Myc HCC mice that were untreated at the 12-month mark exhibited a decrease in c-Met. Meanwhile, BHT did not accelerate tumor growth at the experimental dose and instead preserved c-Met expression, similar to the control group. Notably, compared to the non-transgenic control group, c-Myc expression was consistently elevated by a factor of 12 in all treatment groups at both gene and protein levels. This suggests that the loss of c-Met/HGF signaling, accompanied by a loss of antioxidants such as superoxide dismutase (SOD1) and NRF2, and its down regulation led to enhancement of liver tumor growth in the c-myc model of liver cancer by promoting a more favorable environment for cancerous growth. This enhancement was observed four months after DEN treatment. Additional factors contributing to unchecked tumor proliferation include DNA damage, increased ROS production, loss of tumor suppressors such as p53, and compromised tissue repair systems (
Figure 5A–D).
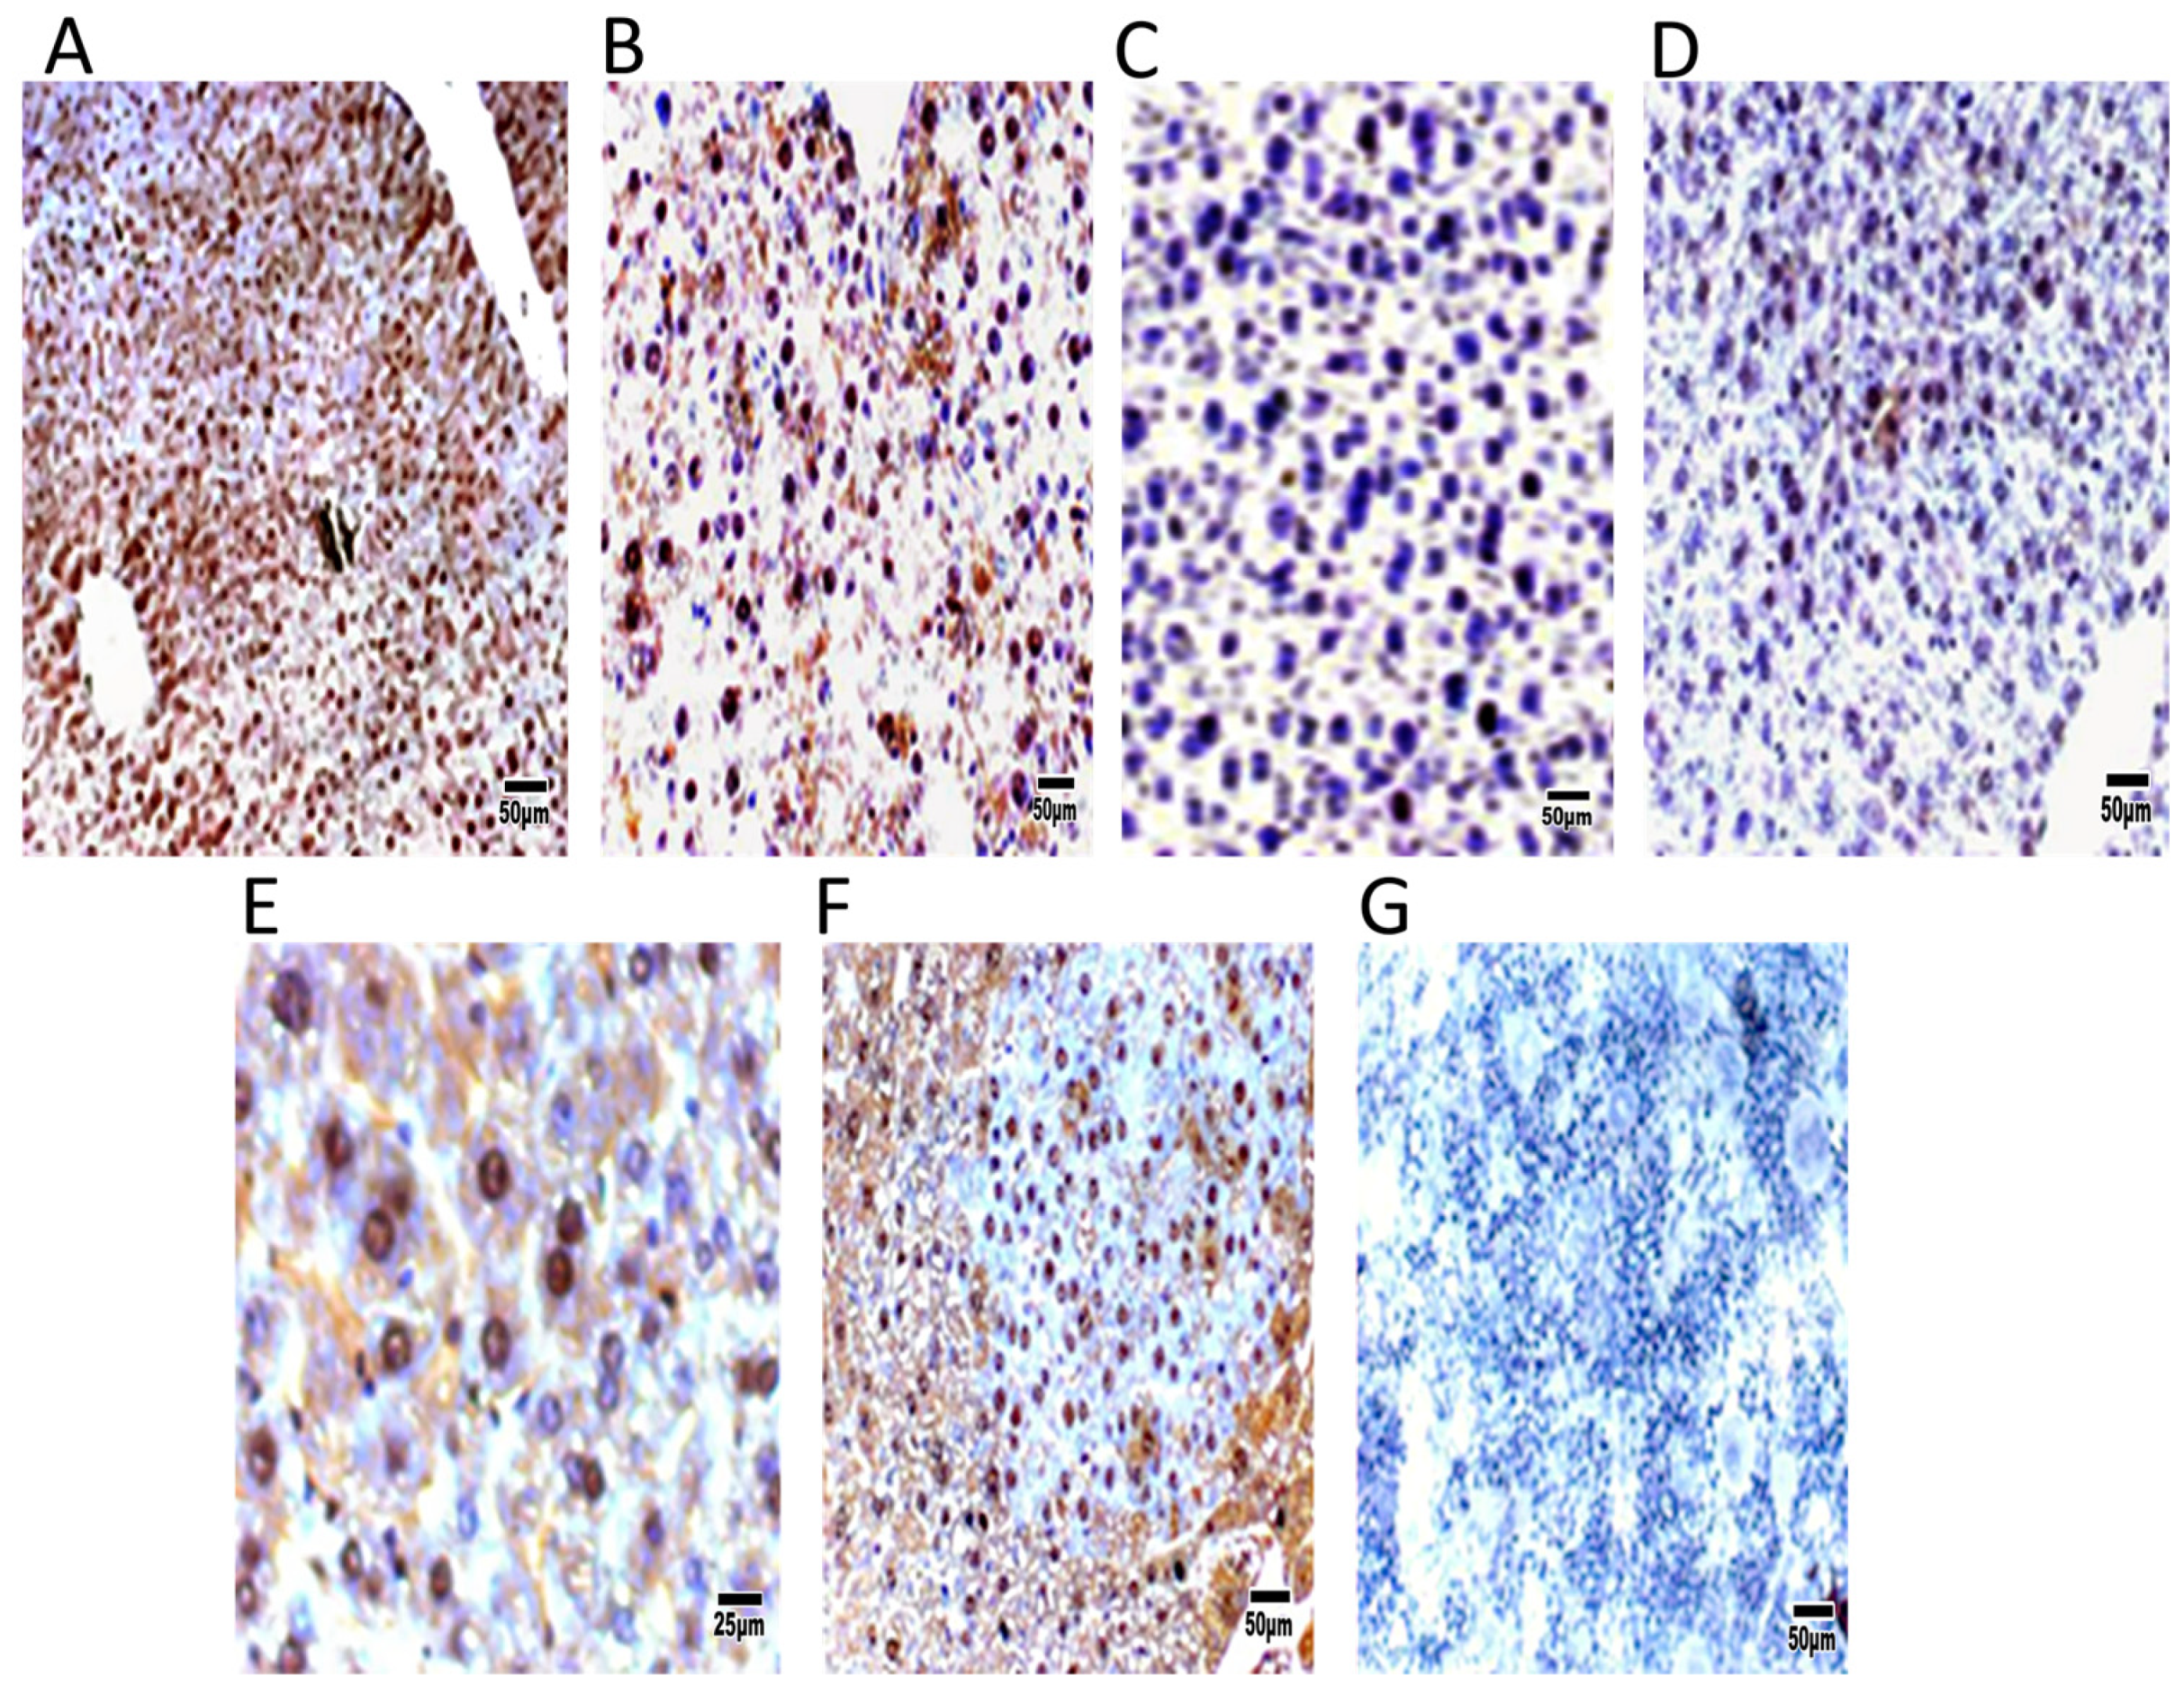
3.5. Immunohistochemistry of DEN-Treated ATT-Myc Transgenic Mice
Remarkably, the DEN group exhibited an elevated proliferation rate of carcinogenic cells, as indicated by an increase in cells positive for PCNA or BrdU. Immunohistochemical detection of liver tumor tissue revealed an increase in c-Myc expression and a reduction in c-Met expression in DEN-treated mice compared to control transgenic mice (
Figure 6).
4. Discussion
We previously examined the genotoxic carcinogen DEN and the non-genotoxic compound BHT as a proof of concept and found that DEN enhanced liver tumor growth in c-Myc as early as four months after the end of treatment [
3]. According to the current study, the liver mass increased as soon as the DEN treatment ended (
Figure 2), while the c-Myc transgenic model genetically caused hepatocellular cancer in mice at 12 months of age [
2].
The fact that DEN therapy failed to cause tumors in other genetic models, such as rasH2 and p53 defective mice, in six months is extremely significant [
4,
5]. According to histopathology, transgenic mice given BHT only showed dysplastic nodules until the end of their lives or at 8.5 months. All things considered, the c-Myc transgenic mouse model responded to a genotoxic carcinogen and could distinguish between safe and dangerous substances, as seen by the HCC that appeared at 5.5 months of age. This result is in line with findings from c-Met knock-out mice treated with DEN, where tumor growth was also increased following DEN treatment [
6]. Thus, shortening the time of cancer bioassays in the ATT-Myc model may accelerate the carcinogenicity testing of chemicals compared to old classic methods.
At 8.5 months, we used mixed model analysis of variance to examine 16 additional hybridizations on the MouseExon10ST array in order to confirm the selection of the most important genes that were elevated in the liver tumors that formed after DEN treatment. There were 434 genes with significant exon-group interactions (a marker of alternative splicing) and about 603 genes with significant gene expression changes across the groups; 71 genes had both gene and potential splicing differences (
p < 0.01). The SNRK (SNF-Related Kinase) gene belongs to the family of serine/threonine kinases known as sucrose non-fermenting–related kinases and is one of the important genes expressed at 8.5 months [
7]. Previous array data demonstrated that SNRK overexpression increased the levels of genes involved in cell proliferation. Moreover, SNRK increased CacyBP mRNA and protein and decreased β-catenin protein in HCT116 and RKO colon cancer cells [
8]. After 8.5 months, DEN treatment led to the expression of Alpha1b. adrenergic receptor gene (Adra1b). Similarly, Alpha1 and α2c adrenergic receptor genes were over-expressed in basal-like breast tumors with poor prognosis [
9].
In the present array data, Fgl1 was downregulated 8.5 months after DEN treatment. This is in line with the study by Nayeb-Hashemi et al. [
10], who found that Fgl1 expression is decreased in HCC and that its loss correlates with a poorly differentiated phenotype.
In the c-Myc transgenic model of liver cancer, the emergence of large liver tumors and the loss of c-Met signaling were noted at 12 months of age [
2]. In the current investigation, we first showed that at different times throughout the mice’s lives, the genotoxic DEN increased the loss of c-Met and the aggressiveness of liver cancer growth. While the BHT-treated group and the transgenic vehicle-treated group did not exhibit any liver tumor growth that was confirmed by histological analysis, they preserved the expression of c-Met, except for one of the three transgenic mice at 8.5 months. Similarly, in c-Met knockout animals given DEN treatment, c-Met deletion increased liver tumor growth [
6]. Notably, persistent BHT maintained c-Met expression and reversed the detrimental consequences of c-Met depletion. Therapy with N-acetyl-L-cysteine, an antioxidant, and decreasing DEN initiated hepatocarcinogenesis in Cre-Ctrl mice [
6].
Furthermore, after 12 months, the liver weight of the c-Myc transgenic mice increased significantly, reaching 10% of the body weight by 16 months. This was indicative of the development of enormous liver tumors. Conversely, the liver weight of double transgenic c-Myc/HGF mice that were older than a year did not show any variation from their younger counterparts [
2]. Similarly, the expression of the shortened c-Met transgene produced immortalized and non-transformed hepatocyte cell lines and induced tolerance to apoptotic stimuli in vivo [
11]. The present investigation revealed the downregulation of antioxidant pathways, such as SOD1 and NRF2, along with c-Met expression, particularly at the age of 8.5 months. Thus, the expression of HGF/c-Met has been identified as a crucial regulator of cellular redox homeostasis and oxidative stress [
12]. Unstimulated Met-knockout cells experienced oxidative stress, as evidenced by elevated ROS production. This was associated with increased Nicotinamide adenine dinucleotide phosphate (NADPH) and Rac1 activities, which were suppressed by known NADPH oxidase inhibitors. Furthermore, oxidative stress correlated with enhanced lipid peroxidation and reduced glutathione (GSH) levels. Administration of N-acetylcysteine, an antioxidant and GSH precursor, notably reduced agonistic anti-Fas (Jo2)-induced cell death [
13]. Additionally, Takami et al. [
6] reported that the detrimental effects of c-Met deficiency were alleviated by long-term oral administration of the antioxidant N-acetyl-l-cysteine. This treatment inhibited EGFR activation and reduced N-nitrosodiethylamine-induced hepatocarcinogenesis to levels observed in Cre-Ctrl mice. Similarly, BHT, considered an antioxidant, maintained c-Met expression and did not promote liver cancer in the ATT-Myc liver of the transgenic model.
Furthermore, the genetic deletion of c-Met in hepatocytes disrupts redox homeostasis [
13]. Moreover, the development of liver-specific c-Met–knockout mice has demonstrated the significance of HGF/c-Met signaling in the control of cellular redox state by regulating the expression of antioxidant proteins and a parallel inhibition of pro-oxidant systems [
14]. In the current study, DEN-treated mice reduced the NP-1 protein in liver tumor tissue in comparison to transgenic and non-transgenic control mice at the age of 8.5 months. In this regard, NP-1 controls endothelial homeostasis by regulating mitochondrial function and iron-based oxidative stress [
15].
Notably, DEN, as a genotoxic carcinogen, enhanced ROS production in the liver tumor microenvironment [
16] and the loss of an antioxidant such as SOD1 [
6]. In the current study, DEN treatment enhanced the loss of enriched transcriptional factors, such as HNF4a1 and HNFγ [
2], due to extensive DNA damage and expression of C/EBPα. In this regard, there was a correlation between the expression of enriched transcriptional factors in hepatocytes and the cyto-met expression [
16] in cell lines and transgenic models [
11]. Moreover, in the current study, the c-Myc gene expression increased 12-fold after DEN treatment, and c-Myc protein expression was monitored by IHC. In this regard, previous reports showed that the loss of p53-mediated genomic surveillance and over-expression of c-Myc result in the suppression of DNA repair and enhancement of the mutation rate in cancer cells [
18], and once the tumors become established, c-Myc is a key gene player in alternative macrophage activation and pro-tumorigenic gene expression [
2]. While DEN enhanced the liver tumors in other transgenic models after six months of treatment [
4,
5], the expression of c-Myc and c-Met in a double transgenic mouse model (WHV/c-Myc transgenic mice) induced a dramatic increase in Myc-induced tumorigenesis in animals as young as 3–4-months old [
1].
Intriguingly, the mechanism of the loss of c-Met signaling in the current study was due to the loss of its transcriptional factor (ets1), as the expression of c-Myc suppressed the expression of ets1 and consequently enhanced the loss of c-Met [
17]. There was also extensive ROS production in the liver microenvironment due to the high expression of c-Myc. [
18]. Notably, treatment with an antioxidant such as N-acetyl-l-cysteine in previous studies maintained c-Met expression and protected against DEN treatment [
6]. Likewise, BHT treatment maintained hepatocytes in the dysplastic stage and prevented their conversion into liver tumors. Moreover, the use of a herbal extract, with quercetin as the active component, targeted c-Myc directly via reduction of ROS production [
19,
20] or release of exosomes from tumor cells under hypoxic conditions [
21].
The ETS family TF—ETS1—was recognized as a key regulator of the intrahepatic cholangiocarcinoma lineage, which Myc was found to suppress during HCC progression. Notably, shRNA-mediated knockdown of FOXA1 and FOXA2, along with sustained ETS1 expression, completely shifted HCC to intrahepatic cholangiocarcinoma development in primary liver cancer mouse models [
22].
Conclusions: In the ATT-Myc liver cancer model, the persistent upregulation of c-Myc at both gene and protein levels inhibits the ETS1 transcription factor, further aggravating the decline of c-Met signaling, SOD1, and NRF2. This increased ROS production and promoted rapid liver tumor growth. The present study reinforces the potential of a monoclonal antibody targeting c-Myc as a therapeutic strategy for liver cancer, underscoring its significance in future clinical research. Moreover, it encourages researchers to finalize the validation of the ATT-Myc model as a liver tumor model alongside the Rash2 transgenic model.
The limitation of the current study is the cost of validation, as developing alternative short-term toxicity research is still expensive. However, once the model is validated, testing chemicals will become cheaper and take less time.


