
White Matter Microstructural Abnormalities in Children with Familial vs. Non-Familial Attention-Deficit/Hyperactivity Disorder (ADHD)


Abstract
1. Introduction
2. Materials and Methods
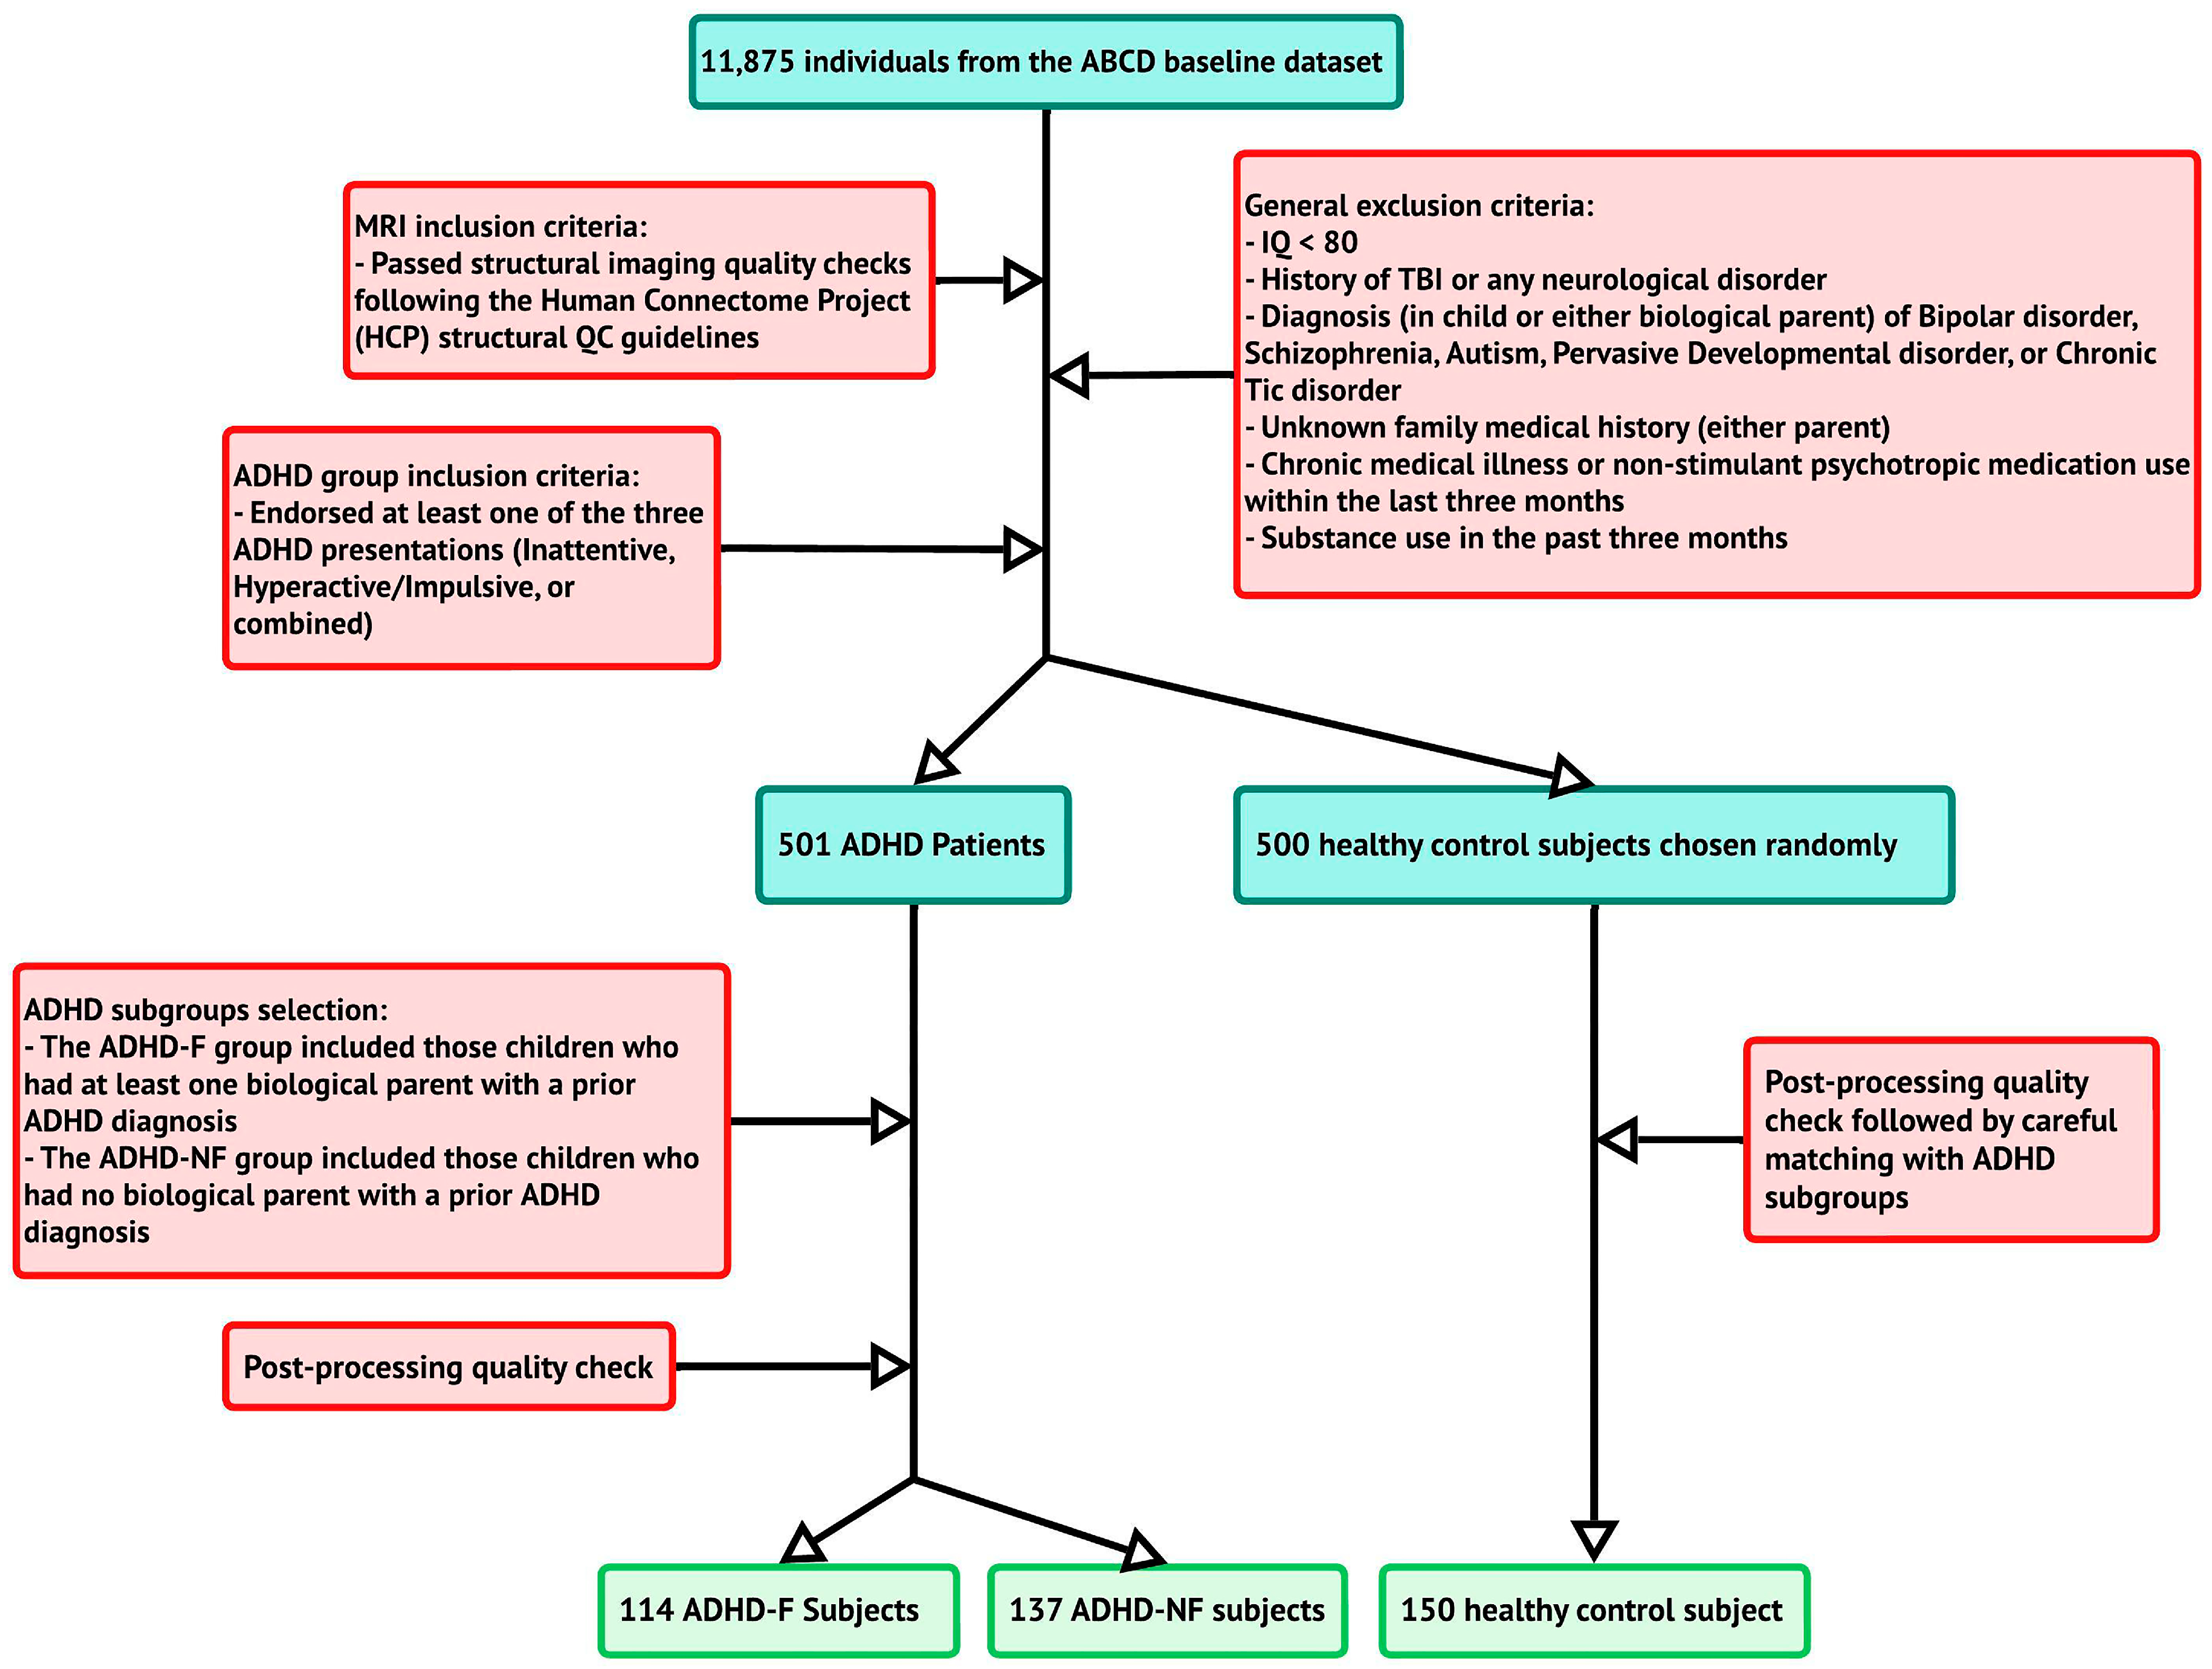
2.1. Participants
2.2. ADHD Assessments
2.3. Demographic, Neurocognitive, and Clinical/Behavioral Measures
2.4. Imaging Data Acquisition Protocol
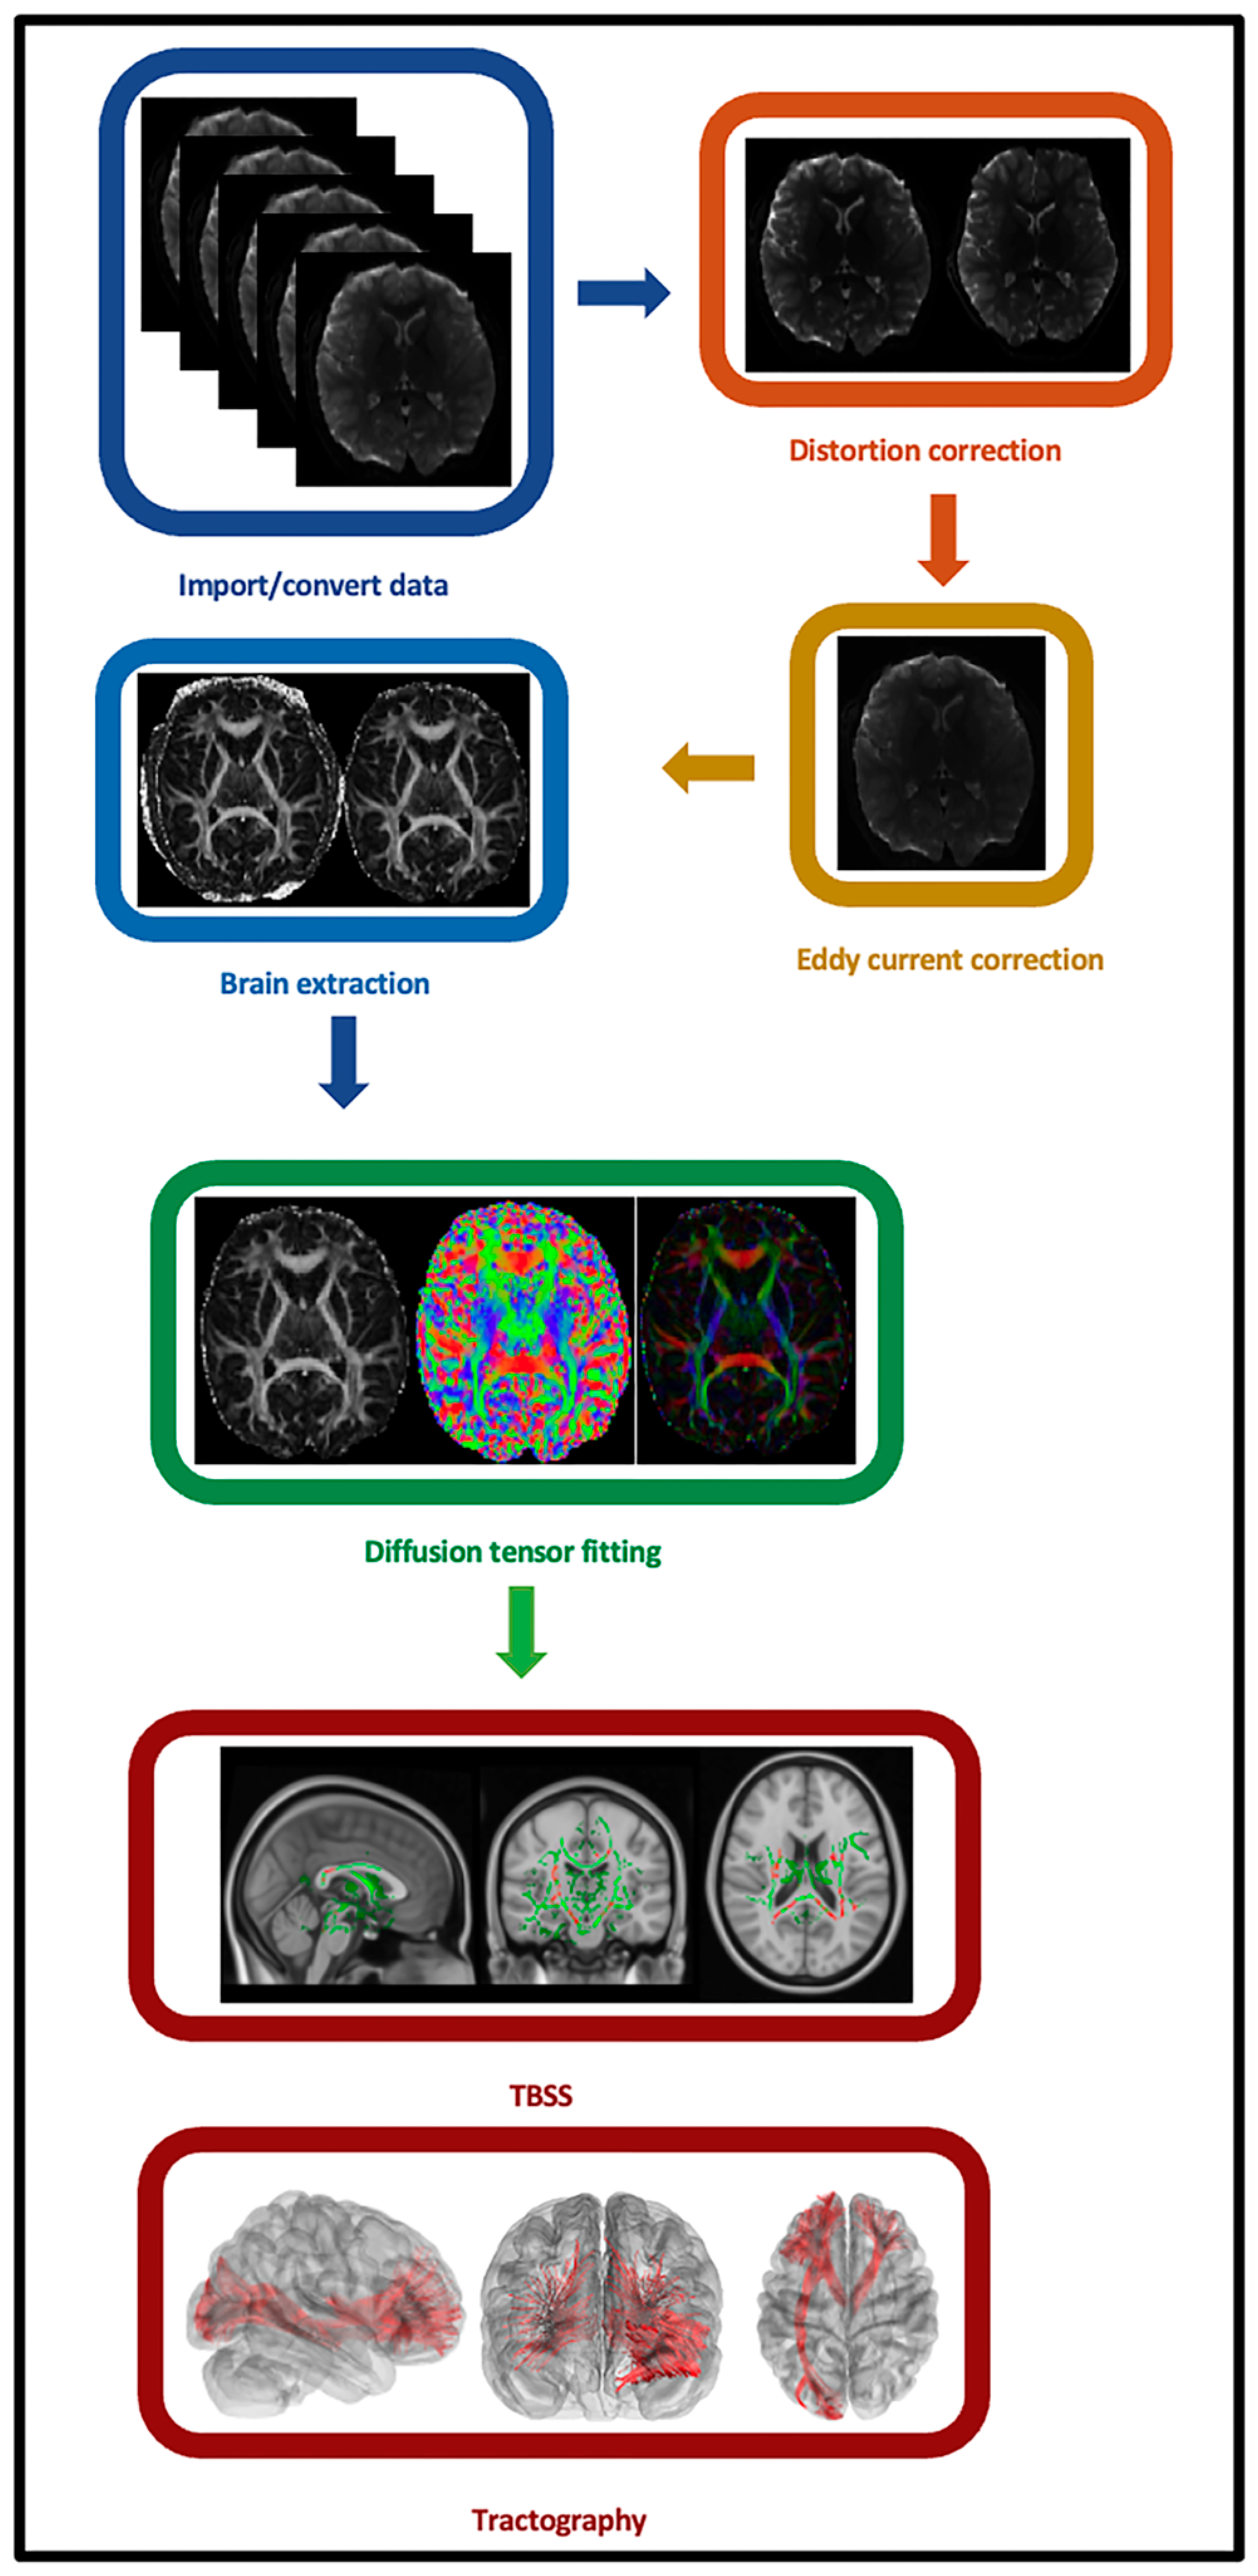
2.5. Individual-Level Imaging Data Preprocessing
2.6. Individual-Level Imaging Data Processing and Analyses
2.7. Secondary Tract-Based Spatial Statistics (TBSS) Analysis
2.8. Group-Level Statistical Analyses
3. Results
4. Discussion
5. Limitations and Future Directions
6. Conclusions
Supplementary Materials
Author Contributions
Funding
Informed Consent Statement
Data Availability Statement
Acknowledgments
Conflicts of Interest
Abbreviations
| ADHD | Attention-deficit/hyperactivity disorder |
| ADHD-F | ADHD with positive family history |
| ADHD-NF | ADHD without a family history of ADHD |
| ML | Machine learning |
| DL | Deep learning |
| EFs | Executive functions |
| MZ | Monozygotic |
| GM | Gray matter |
| WM | White matter |
| FA | Fractional anisotropy |
| DTI | Diffusion tensor imaging |
| ABCD | Adolescent Brain Cognitive Development |
| IQ | Intelligence quotient |
| KSADS-5 | Kiddie Schedule for Affective Disorder and Schizophrenia |
| ASR | Adult Self-Report |
| TVPT | Toolbox Picture Vocabulary Task |
| PCS | Puberty Category Score |
| CBCL | Child Behavior Checklist |
| DWI | Diffusion-weighted imaging |
| TR | Repetition time |
| TE | Echo time |
| FOV | Field of view |
| RMS | root mean squared |
| MD | Mean diffusivity |
| TBSS | Tract-based spatial statistics |
| TFCE | Threshold-free cluster enhancement |
References
- Faraone, S.V.; Perlis, R.H.; Doyle, A.E.; Smoller, J.W.; Goralnick, J.J.; Holmgren, M.A.; Sklar, P. Molecular Genetics of Attention-Deficit/Hyperactivity Disorder. Biol. Psychiatry 2005, 57, 1313–1323. [Google Scholar] [CrossRef] [PubMed]
- Barkley, R.A. Major life activity and health outcomes associated with attention-deficit/hyperactivity disorder. J. Clin. Psychiatry 2002, 63, 10–15. [Google Scholar] [PubMed]
- Edition, F. Diagnostic and statistical manual of mental disorders. Am. Psychiatr. Assoc. 2013, 21, 591–643. [Google Scholar]
- Polanczyk, G.V.; Willcutt, E.G.; Salum, G.A.; Kieling, C.; Rohde, L.A. ADHD prevalence estimates across three decades: An updated systematic review and meta-regression analysis. Int. J. Epidemiol. 2014, 43, 434–442. [Google Scholar] [CrossRef]
- Faraone, S.V.; Biederman, J.; Mick, E. The age-dependent decline of attention deficit hyperactivity disorder: A meta-analysis of follow-up studies. Psychol. Med. 2006, 36, 159–165. [Google Scholar] [CrossRef]
- Doshi, J.A.; Hodgkins, P.; Kahle, J.; Sikirica, V.; Cangelosi, M.J.; Setyawan, J.; Erder, M.H.; Neumann, P.J. Economic impact of childhood and adult attention-deficit/hyperactivity disorder in the United States. J. Am. Acad. Child Adolesc. Psychiatry 2012, 51, 990–1002.e1002. [Google Scholar] [CrossRef]
- Chang, Z.; Lichtenstein, P.; Larsson, H. The effects of childhood ADHD symptoms on early-onset substance use: A Swedish twin study. J. Abnorm. Child Psychol. 2012, 40, 425–435. [Google Scholar] [CrossRef]
- Dalsgaard, S.; Mortensen, P.B.; Frydenberg, M.; Thomsen, P.H. ADHD, stimulant treatment in childhood and subsequent substance abuse in adulthood—A naturalistic long-term follow-up study. Addict. Behav. 2014, 39, 325–328. [Google Scholar] [CrossRef]
- Ogundele, M.O.; Yemula, C. Management of sleep disorders among children and adolescents with neurodevelopmental disorders: A practical guide for clinicians. World J. Clin. Pediatr. 2022, 11, 239–252. [Google Scholar] [CrossRef]
- León-Barriera, R.; Ortegon, R.S.; Chaplin, M.M.; Modesto-Lowe, V. Treating ADHD and Comorbid Anxiety in Children: A Guide for Clinical Practice. Clin. Pediatr. 2023, 62, 39–46. [Google Scholar] [CrossRef]
- Dorani, F.; Bijlenga, D.; Beekman, A.T.F.; van Someren, E.J.W.; Kooij, J.J.S. Prevalence of hormone-related mood disorder symptoms in women with ADHD. J. Psychiatr. Res. 2021, 133, 10–15. [Google Scholar] [CrossRef] [PubMed]
- Faraone, S.V.; Asherson, P.; Banaschewski, T.; Biederman, J.; Buitelaar, J.K.; Ramos-Quiroga, J.A.; Rohde, L.A.; Sonuga-Barke, E.J.; Tannock, R.; Franke, B. Attention-deficit/hyperactivity disorder. Nat. Rev. Dis. Primers 2015, 1, 15020. [Google Scholar] [CrossRef] [PubMed]
- Dalsgaard, S.; Leckman, J.F.; Mortensen, P.B.; Nielsen, H.S.; Simonsen, M. Effect of drugs on the risk of injuries in children with attention deficit hyperactivity disorder: A prospective cohort study. Lancet Psychiatry 2015, 2, 702–709. [Google Scholar] [CrossRef] [PubMed]
- Curry, A.E.; Yerys, B.E.; Metzger, K.B.; Carey, M.E.; Power, T.J. Traffic Crashes, Violations, and Suspensions Among Young Drivers With ADHD. Pediatrics 2019, 143, e20182305. [Google Scholar] [CrossRef]
- Wymbs, B.T.; Pelham, W.E., Jr.; Molina, B.S.; Gnagy, E.M.; Wilson, T.K.; Greenhouse, J.B. Rate and predictors of divorce among parents of youths with ADHD. J. Consult. Clin. Psychol. 2008, 76, 735–744. [Google Scholar] [CrossRef]
- Larsson, H.; Asherson, P.; Chang, Z.; Ljung, T.; Friedrichs, B.; Larsson, J.O.; Lichtenstein, P. Genetic and environmental influences on adult attention deficit hyperactivity disorder symptoms: A large Swedish population-based study of twins. Psychol. Med. 2013, 43, 197–207. [Google Scholar] [CrossRef]
- Uchida, M.; Spencer, T.J.; Faraone, S.V.; Biederman, J. Adult Outcome of ADHD: An Overview of Results From the MGH Longitudinal Family Studies of Pediatrically and Psychiatrically Referred Youth With and Without ADHD of Both Sexes. J. Atten. Disord. 2018, 22, 523–534. [Google Scholar] [CrossRef]
- Bonvicini, C.; Faraone, S.V.; Scassellati, C. Common and specific genes and peripheral biomarkers in children and adults with attention-deficit/hyperactivity disorder. World J. Biol. Psychiatry 2018, 19, 80–100. [Google Scholar] [CrossRef]
- Biederman, J.; Faraone, S.V.; Keenan, K.; Knee, D.; Tsuang, M.T. Family-genetic and psychosocial risk factors in DSM-III attention deficit disorder. J. Am. Acad. Child Adolesc. Psychiatry 1990, 29, 526–533. [Google Scholar] [CrossRef]
- Thapar, A.; Cooper, M.; Eyre, O.; Langley, K. Practitioner Review: What have we learnt about the causes of ADHD? J. Child Psychol. Psychiatry 2013, 54, 3–16. [Google Scholar] [CrossRef]
- Johnston, B.A.; Mwangi, B.; Matthews, K.; Coghill, D.; Konrad, K.; Steele, J.D. Brainstem abnormalities in attention deficit hyperactivity disorder support high accuracy individual diagnostic classification. Hum. Brain Mapp. 2014, 35, 5179–5189. [Google Scholar] [CrossRef] [PubMed]
- Riglin, L.; Collishaw, S.; Thapar, A.K.; Dalsgaard, S.; Langley, K.; Smith, G.D.; Stergiakouli, E.; Maughan, B.; O’Donovan, M.C.; Thapar, A. Association of Genetic Risk Variants With Attention-Deficit/Hyperactivity Disorder Trajectories in the General Population. JAMA Psychiatry 2016, 73, 1285–1292. [Google Scholar] [CrossRef] [PubMed]
- Faraone, S.V.; Biederman, J.; Friedman, D. Validity of DSM-IV subtypes of attention-deficit/hyperactivity disorder: A family study perspective. J. Am. Acad. Child Adolesc. Psychiatry 2000, 39, 300–307. [Google Scholar] [CrossRef] [PubMed]
- Luo, Y.; Weibman, D.; Halperin, J.M.; Li, X. A Review of Heterogeneity in Attention Deficit/Hyperactivity Disorder (ADHD). Front. Hum. Neurosci. 2019, 13, 42. [Google Scholar] [CrossRef]
- Makris, N.; Biederman, J.; Valera, E.M.; Bush, G.; Kaiser, J.; Kennedy, D.N.; Caviness, V.S.; Faraone, S.V.; Seidman, L.J. Cortical thinning of the attention and executive function networks in adults with attention-deficit/hyperactivity disorder. Cereb. Cortex 2007, 17, 1364–1375. [Google Scholar] [CrossRef]
- Zhang-James, Y.; Helminen, E.C.; Liu, J.; Group, E.-A.W.; Franke, B.; Hoogman, M.; Faraone, S.V. Evidence for similar structural brain anomalies in youth and adult attention-deficit/hyperactivity disorder: A machine learning analysis. Transl. Psychiatry 2021, 11, 82. [Google Scholar] [CrossRef]
- Luo, Y.; Alvarez, T.L.; Halperin, J.M.; Li, X. Multimodal neuroimaging-based prediction of adult outcomes in childhood-onset ADHD using ensemble learning techniques. Neuroimage Clin. 2020, 26, 102238. [Google Scholar] [CrossRef]
- Yao, D.; Guo, X.; Zhao, Q.; Liu, L.; Cao, Q.; Wang, Y.; Calhoun, V.D.; Sun, L.; Sui, J. Discriminating ADHD From Healthy Controls Using a Novel Feature Selection Method Based on Relative Importance and Ensemble Learning. Annu. Int. Conf. IEEE Eng. Med. Biol. Soc. 2018, 2018, 4632–4635. [Google Scholar] [CrossRef]
- Riaz, A.; Asad, M.; Alonso, E.; Slabaugh, G. DeepFMRI: End-to-end deep learning for functional connectivity and classification of ADHD using fMRI. J. Neurosci. Methods 2020, 335, 108506. [Google Scholar] [CrossRef]
- Chen, Y.; Tang, Y.; Wang, C.; Liu, X.; Zhao, L.; Wang, Z. ADHD classification by dual subspace learning using resting-state functional connectivity. Artif. Intell. Med. 2020, 103, 101786. [Google Scholar] [CrossRef]
- Willcutt, E.G.; Nigg, J.T.; Pennington, B.F.; Solanto, M.V.; Rohde, L.A.; Tannock, R.; Loo, S.K.; Carlson, C.L.; McBurnett, K.; Lahey, B.B. Validity of DSM-IV attention deficit/hyperactivity disorder symptom dimensions and subtypes. J. Abnorm. Psychol. 2012, 121, 991–1010. [Google Scholar] [CrossRef] [PubMed]
- O’Neill, S.; Rajendran, K.; Mahbubani, S.M.; Halperin, J.M. Preschool Predictors of ADHD Symptoms and Impairment During Childhood and Adolescence. Curr. Psychiatry Rep. 2017, 19, 95. [Google Scholar] [CrossRef] [PubMed]
- Curchack-Lichtin, J.T.; Chacko, A.; Halperin, J.M. Changes in ADHD symptom endorsement: Preschool to school age. J. Abnorm. Child Psychol. 2014, 42, 993–1004. [Google Scholar] [CrossRef] [PubMed]
- Overgaard, K.R.; Oerbeck, B.; Friis, S.; Pripp, A.H.; Aase, H.; Biele, G.; Ingeborgrud, C.B.; Polanczyk, G.V.; Zeiner, P. Attention-deficit/hyperactivity disorder from preschool to school age: Change and stability of parent and teacher reports. Eur. Child Adolesc. Psychiatry 2022, 32, 1947–1955. [Google Scholar] [CrossRef]
- Luciana, M.; Bjork, J.M.; Nagel, B.J.; Barch, D.M.; Gonzalez, R.; Nixon, S.J.; Banich, M.T. Adolescent neurocognitive development and impacts of substance use: Overview of the adolescent brain cognitive development (ABCD) baseline neurocognition battery. Dev. Cogn. Neurosci. 2018, 32, 67–79. [Google Scholar] [CrossRef]
- Chen, Y.C.; Sudre, G.; Sharp, W.; Donovan, F.; Chandrasekharappa, S.C.; Hansen, N.; Elnitski, L.; Shaw, P. Neuroanatomic, epigenetic and genetic differences in monozygotic twins discordant for attention deficit hyperactivity disorder. Mol. Psychiatry 2018, 23, 683–690. [Google Scholar] [CrossRef]
- Castellanos, F.X.; Sharp, W.S.; Gottesman, R.F.; Greenstein, D.K.; Giedd, J.N.; Rapoport, J.L. Anatomic Brain Abnormalities in Monozygotic Twins Discordant for Attention Deficit Hyperactivity Disorder. Am. J. Psychiatry 2003, 160, 1693–1696. [Google Scholar] [CrossRef]
- Van’t Ent, D.; van Beijsterveldt, C.E.; Derks, E.M.; Hudziak, J.J.; Veltman, D.J.; Todd, R.D.; Boomsma, D.I.; De Geus, E.J. Neuroimaging of response interference in twins concordant or discordant for inattention and hyperactivity symptoms. Neuroscience 2009, 164, 16–29. [Google Scholar] [CrossRef]
- Godinez, D.A.; Willcutt, E.G.; Burgess, G.C.; Depue, B.E.; Andrews-Hanna, J.R.; Banich, M.T. Familial risk and ADHD-specific neural activity revealed by case-control, discordant twin pair design. Psychiatry Res. Neuroimaging 2015, 233, 458–465. [Google Scholar] [CrossRef]
- Pironti, V.A.; Lai, M.C.; Muller, U.; Dodds, C.M.; Suckling, J.; Bullmore, E.T.; Sahakian, B.J. Neuroanatomical abnormalities and cognitive impairments are shared by adults with attention-deficit/hyperactivity disorder and their unaffected first-degree relatives. Biol. Psychiatry 2014, 76, 639–647. [Google Scholar] [CrossRef]
- Casey, B.J.; Epstein, J.N.; Buhle, J.; Liston, C.; Davidson, M.C.; Tonev, S.T.; Spicer, J.; Niogi, S.; Millner, A.J.; Reiss, A.; et al. Frontostriatal Connectivity and Its Role in Cognitive Control in Parent-Child Dyads With ADHD. Am. J. Psychiatry 2007, 164, 1729–1736. [Google Scholar] [CrossRef] [PubMed]
- Connaughton, M.; Whelan, R.; O’Hanlon, E.; McGrath, J. White matter microstructure in children and adolescents with ADHD. Neuroimage Clin. 2022, 33, 102957. [Google Scholar] [CrossRef] [PubMed]
- Gau, S.; Tseng, W.-L.; Tseng, W.-Y.; Wu, Y.-H.; Lo, Y.-C. Association between microstructural integrity of frontostriatal tracts and school functioning: ADHD symptoms and executive function as mediators. Psychol. Med. 2015, 45, 529–543. [Google Scholar] [CrossRef] [PubMed]
- Chiang, H.-L.; Chen, Y.-J.; Shang, C.-Y.; Tseng, W.-Y.; Gau, S.-F. Different neural substrates for executive functions in youths with ADHD: A diffusion spectrum imaging tractography study. Psychol. Med. 2016, 46, 1225–1238. [Google Scholar] [CrossRef]
- Tung, Y.-H.; Lin, H.-Y.; Chen, C.-L.; Shang, C.-Y.; Yang, L.-Y.; Hsu, Y.-C.; Tseng, W.-Y.I.; Gau, S.S.-F. Whole brain white matter tract deviation and idiosyncrasy from normative development in autism and ADHD and unaffected siblings link with dimensions of psychopathology and cognition. Am. J. Psychiatry 2021, 178, 730–743. [Google Scholar] [CrossRef]
- Aoki, Y.; Cortese, S.; Castellanos, F.X. Research Review: Diffusion tensor imaging studies of attention-deficit/hyperactivity disorder: Meta-analyses and reflections on head motion. J. Child Psychol. Psychiatry 2018, 59, 193–202. [Google Scholar] [CrossRef]
- Chiang, H.L.; Tseng, W.I.; Tseng, W.L.; Tung, Y.H.; Hsu, Y.C.; Chen, C.L.; Gau, S.S. Atypical development in white matter microstructures in ADHD: A longitudinal diffusion imaging study. Asian J. Psychiatr. 2023, 79, 103358. [Google Scholar] [CrossRef]
- Qiu, M.-g.; Ye, Z.; Li, Q.-y.; Liu, G.-j.; Xie, B.; Wang, J. Changes of brain structure and function in ADHD children. Brain Topogr. 2011, 24, 243–252. [Google Scholar] [CrossRef]
- Peterson, D.J.; Ryan, M.; Rimrodt, S.L.; Cutting, L.E.; Denckla, M.B.; Kaufmann, W.E.; Mahone, E.M. Increased regional fractional anisotropy in highly screened attention-deficit hyperactivity disorder (ADHD). J. Child Neurol. 2011, 26, 1296–1302. [Google Scholar] [CrossRef]
- Hoogman, M.; Bralten, J.; Hibar, D.P.; Mennes, M.; Zwiers, M.P.; Schweren, L.S.J.; van Hulzen, K.J.E.; Medland, S.E.; Shumskaya, E.; Jahanshad, N.; et al. Subcortical brain volume differences in participants with attention deficit hyperactivity disorder in children and adults: A cross-sectional mega-analysis. Lancet Psychiatry 2017, 4, 310–319. [Google Scholar] [CrossRef]
- Lawrence, K.E.; Levitt, J.G.; Loo, S.K.; Ly, R.; Yee, V.; O’Neill, J.; Alger, J.; Narr, K.L. White matter microstructure in subjects with attention-deficit/hyperactivity disorder and their siblings. J. Am. Acad. Child Adolesc. Psychiatry 2013, 52, 431–440.e434. [Google Scholar] [CrossRef] [PubMed]
- Baboli, R.; Cao, M.; Martin, E.; Halperin, J.M.; Wu, K.; Li, X. Distinct structural brain network properties in children with familial versus non-familial attention-deficit/hyperactivity disorder (ADHD). Cortex 2024, 179, 1–13. [Google Scholar] [CrossRef] [PubMed]
- Li, X.; Motwani, C.; Cao, M.; Martin, E.; Halperin, J.M. Working Memory-Related Neurofunctional Correlates Associated with the Frontal Lobe in Children with Familial vs. Non-Familial Attention Deficit/Hyperactivity Disorder. Brain Sci. 2023, 13, 1469. [Google Scholar] [CrossRef] [PubMed]
- Baboli, R.; Cao, M.; Halperin, J.M.; Li, X. Distinct Thalamic and Frontal Neuroanatomical Substrates in Children with Familial vs. Non-Familial Attention-Deficit/Hyperactivity Disorder (ADHD). Brain Sci. 2022, 13, 46. [Google Scholar] [CrossRef]
- Xia, S.; Li, X.; Kimball, A.E.; Kelly, M.S.; Lesser, I.; Branch, C. Thalamic shape and connectivity abnormalities in children with attention-deficit/hyperactivity disorder. Psychiatry Res. 2012, 204, 161–167. [Google Scholar] [CrossRef]
- Saad, J.F.; Griffiths, K.R.; Korgaonkar, M.S. A Systematic Review of Imaging Studies in the Combined and Inattentive Subtypes of Attention Deficit Hyperactivity Disorder. Front. Integr. Neurosci. 2020, 14, 31. [Google Scholar] [CrossRef]
- Garavan, H.; Bartsch, H.; Conway, K.; Decastro, A.; Goldstein, R.Z.; Heeringa, S.; Jernigan, T.; Potter, A.; Thompson, W.; Zahs, D. Recruiting the ABCD sample: Design considerations and procedures. Dev. Cogn. Neurosci. 2018, 32, 16–22. [Google Scholar] [CrossRef]
- Barch, D.M.; Albaugh, M.D.; Avenevoli, S.; Chang, L.; Clark, D.B.; Glantz, M.D.; Hudziak, J.J.; Jernigan, T.L.; Tapert, S.F.; Yurgelun-Todd, D.; et al. Demographic, physical and mental health assessments in the adolescent brain and cognitive development study: Rationale and description. Dev. Cogn. Neurosci. 2018, 32, 55–66. [Google Scholar] [CrossRef]
- Bogner, J.A.; Whiteneck, G.G.; MacDonald, J.; Juengst, S.B.; Brown, A.W.; Philippus, A.M.; Marwitz, J.H.; Lengenfelder, J.; Mellick, D.; Arenth, P.; et al. Test-Retest Reliability of Traumatic Brain Injury Outcome Measures: A Traumatic Brain Injury Model Systems Study. J. Head. Trauma. Rehabil. 2017, 32, E1–E16. [Google Scholar] [CrossRef]
- Gershon, R.C.; Wagster, M.V.; Hendrie, H.C.; Fox, N.A.; Cook, K.F.; Nowinski, C.J. NIH toolbox for assessment of neurological and behavioral function. Neurology 2013, 80, S2–S6. [Google Scholar] [CrossRef]
- Kobak, K.A.; Kratochvil, C.; Stanger, C.; Kaufman, J. Computerized screening of comorbidity in adolescents with substance or psychiatric disorders. Presented at the 33rd Annual Anxiety Disorders and Depression Conference, La Jolaa, CA, USA, 6 April 2013. [Google Scholar]
- Achenbach, T.M.; Verhulst, F. Achenbach System of Empirically Based Assessment (ASEBA); University of Vermont, Research Center for Children, Youth, & Families: Burlington, VT, USA, 2010. [Google Scholar]
- Gershon, R.C.; Cook, K.F.; Mungas, D.; Manly, J.J.; Slotkin, J.; Beaumont, J.L.; Weintraub, S. Language measures of the NIH toolbox cognition battery. J. Int. Neuropsychol. Soc. 2014, 20, 642–651. [Google Scholar] [CrossRef] [PubMed]
- Oldfield, R.C. The assessment and analysis of handedness: The Edinburgh inventory. Neuropsychologia 1971, 9, 97–113. [Google Scholar] [CrossRef] [PubMed]
- Veale, J.F. Edinburgh handedness inventory–short form: A revised version based on confirmatory factor analysis. Laterality Asymmetries Body Brain Cogn. 2014, 19, 164–177. [Google Scholar] [CrossRef] [PubMed]
- Achenbach, T.M.; Ruffle, T.M. The Child Behavior Checklist and related forms for assessing behavioral/emotional problems and competencies. Pediatr. Rev. 2000, 21, 265–271. [Google Scholar] [CrossRef]
- Constantinidis, C.; Luna, B. Neural Substrates of Inhibitory Control Maturation in Adolescence. Trends Neurosci. 2019, 42, 604–616. [Google Scholar] [CrossRef]
- Gogtay, N.; Giedd, J.N.; Lusk, L.; Hayashi, K.M.; Greenstein, D.; Vaituzis, A.C.; Nugent, T.F., 3rd; Herman, D.H.; Clasen, L.S.; Toga, A.W.; et al. Dynamic mapping of human cortical development during childhood through early adulthood. Proc. Natl. Acad. Sci. USA 2004, 101, 8174–8179. [Google Scholar] [CrossRef]
- Tamnes, C.K.; Herting, M.M.; Goddings, A.L.; Meuwese, R.; Blakemore, S.J.; Dahl, R.E.; Guroglu, B.; Raznahan, A.; Sowell, E.R.; Crone, E.A.; et al. Development of the Cerebral Cortex across Adolescence: A Multisample Study of Inter-Related Longitudinal Changes in Cortical Volume, Surface Area, and Thickness. J. Neurosci. 2017, 37, 3402–3412. [Google Scholar] [CrossRef]
- Goddings, A.L.; Roalf, D.; Lebel, C.; Tamnes, C.K. Development of white matter microstructure and executive functions during childhood and adolescence: A review of diffusion MRI studies. Dev. Cogn. Neurosci. 2021, 51, 101008. [Google Scholar] [CrossRef]
- Baron Nelson, M.; O’Neil, S.H.; Wisnowski, J.L.; Hart, D.; Sawardekar, S.; Rauh, V.; Perera, F.; Andrews, H.F.; Hoepner, L.A.; Garcia, W.; et al. Maturation of Brain Microstructure and Metabolism Associates with Increased Capacity for Self-Regulation during the Transition from Childhood to Adolescence. J. Neurosci. 2019, 39, 8362–8375. [Google Scholar] [CrossRef]
- Moura, L.M.; Crossley, N.A.; Zugman, A.; Pan, P.M.; Gadelha, A.; Del Aquilla, M.A.G.; Picon, F.A.; Anes, M.; Amaro, E., Jr.; de Jesus Mari, J.; et al. Coordinated brain development: Exploring the synchrony between changes in grey and white matter during childhood maturation. Brain Imaging Behav. 2017, 11, 808–817. [Google Scholar] [CrossRef]
- Carskadon, M.A.; Acebo, C. A self-administered rating scale for pubertal development. J. Adolesc. Health 1993, 14, 190–195. [Google Scholar] [CrossRef] [PubMed]
- Herting, M.M.; Uban, K.A.; Gonzalez, M.R.; Baker, F.C.; Kan, E.C.; Thompson, W.K.; Granger, D.A.; Albaugh, M.D.; Anokhin, A.P.; Bagot, K.S. Correspondence between perceived pubertal development and hormone levels in 9–10 year-olds from the adolescent brain cognitive development study. Front. Endocrinol. 2021, 11, 549928. [Google Scholar] [CrossRef] [PubMed]
- Casey, B.J.; Cannonier, T.; Conley, M.I.; Cohen, A.O.; Barch, D.M.; Heitzeg, M.M.; Soules, M.E.; Teslovich, T.; Dellarco, D.V.; Garavan, H.; et al. The Adolescent Brain Cognitive Development (ABCD) study: Imaging acquisition across 21 sites. Dev. Cogn. Neurosci. 2018, 32, 43–54. [Google Scholar] [CrossRef] [PubMed]
- Marcus, D.S.; Harms, M.P.; Snyder, A.Z.; Jenkinson, M.; Wilson, J.A.; Glasser, M.F.; Barch, D.M.; Archie, K.A.; Burgess, G.C.; Ramaratnam, M.; et al. Human Connectome Project informatics: Quality control, database services, and data visualization. Neuroimage 2013, 80, 202–219. [Google Scholar] [CrossRef] [PubMed]
- Zhuang, J.; Hrabe, J.; Kangarlu, A.; Xu, D.; Bansal, R.; Branch, C.A.; Peterson, B.S. Correction of eddy-current distortions in diffusion tensor images using the known directions and strengths of diffusion gradients. J. Magn. Reson. Imaging Off. J. Int. Soc. Magn. Reson. Med. 2006, 24, 1188–1193. [Google Scholar] [CrossRef]
- Hagler, D.J., Jr.; Ahmadi, M.E.; Kuperman, J.; Holland, D.; McDonald, C.R.; Halgren, E.; Dale, A.M. Automated white-matter tractography using a probabilistic diffusion tensor atlas: Application to temporal lobe epilepsy. Hum. Brain Mapp. 2009, 30, 1535–1547. [Google Scholar] [CrossRef]
- Morgan, P.S.; Bowtell, R.W.; McIntyre, D.J.; Worthington, B.S. Correction of spatial distortion in EPI due to inhomogeneous static magnetic fields using the reversed gradient method. J. Magn. Reson. Imaging 2004, 19, 499–507. [Google Scholar] [CrossRef]
- Holland, D.; Kuperman, J.M.; Dale, A.M. Efficient correction of inhomogeneous static magnetic field-induced distortion in Echo Planar Imaging. Neuroimage 2010, 50, 175–183. [Google Scholar] [CrossRef]
- Fischl, B. FreeSurfer. Neuroimage 2012, 62, 774–781. [Google Scholar] [CrossRef]
- Alexander, A.L.; Lee, J.E.; Lazar, M.; Field, A.S. Diffusion tensor imaging of the brain. Neurotherapeutics 2007, 4, 316–329. [Google Scholar] [CrossRef]
- Smith, S.M.; Jenkinson, M.; Woolrich, M.W.; Beckmann, C.F.; Behrens, T.E.; Johansen-Berg, H.; Bannister, P.R.; De Luca, M.; Drobnjak, I.; Flitney, D.E.; et al. Advances in functional and structural MR image analysis and implementation as FSL. Neuroimage 2004, 23 (Suppl. 1), S208–S219. [Google Scholar] [CrossRef]
- Hartigan, J.A.; Hartigan, P.M. The dip test of unimodality. Ann. Stat. 1985, 13, 70–84. [Google Scholar] [CrossRef]
- Masterman, D.L.; Cummings, J.L. Frontal-subcortical circuits: The anatomic basis of executive, social and motivated behaviors. J. Psychopharmacol. 1997, 11, 107–114. [Google Scholar] [CrossRef] [PubMed]
- Tekin, S.; Cummings, J.L. Frontal–subcortical neuronal circuits and clinical neuropsychiatry: An update. J. Psychosom. Res. 2002, 53, 647–654. [Google Scholar] [CrossRef] [PubMed]
- Biesbroek, J.M.; Kuijf, H.J.; van der Graaf, Y.; Vincken, K.L.; Postma, A.; Mali, W.P.T.M.; Biessels, G.J.; Geerlings, M.I.; on behalf of the SMART Study Group. Association between Subcortical Vascular Lesion Location and Cognition: A Voxel-Based and Tract-Based Lesion-Symptom Mapping Study. The SMART-MR Study. PLoS ONE 2013, 8, e60541. [Google Scholar] [CrossRef]
- Bouziane, C.; Caan, M.W.A.; Tamminga, H.G.H.; Schrantee, A.; Bottelier, M.A.; de Ruiter, M.B.; Kooij, S.J.J.; Reneman, L. ADHD and maturation of brain white matter: A DTI study in medication naive children and adults. Neuroimage Clin. 2018, 17, 53–59. [Google Scholar] [CrossRef]
- Hung, Y.; Dallenbach, N.T.; Green, A.; Gaillard, S.; Capella, J.; Hoskova, B.; Vater, C.H.; Cooper, E.; Rudberg, N.; Takahashi, A.; et al. Distinct and shared white matter abnormalities when ADHD is comorbid with ASD: A preliminary diffusion tensor imaging study. Psychiatry Res. 2023, 320, 115039. [Google Scholar] [CrossRef]
- Svatkova, A.; Nestrasil, I.; Rudser, K.; Goldenring Fine, J.; Bledsoe, J.; Semrud-Clikeman, M. Unique white matter microstructural patterns in ADHD presentations-a diffusion tensor imaging study. Hum. Brain Mapp. 2016, 37, 3323–3336. [Google Scholar] [CrossRef]
- Ercan, E.S.; Suren, S.; Bacanlı, A.; Yazıcı, K.U.; Callı, C.; Ardic, U.A.; Aygunes, D.; Kosova, B.; Ozyurt, O.; Aydın, C.; et al. Altered structural connectivity is related to attention deficit/hyperactivity subtypes: A DTI study. Psychiatry Res. Neuroimaging 2016, 256, 57–64. [Google Scholar] [CrossRef]
- Shaw, P.; Sudre, G.; Wharton, A.; Weingart, D.; Sharp, W.; Sarlls, J. White matter microstructure and the variable adult outcome of childhood attention deficit hyperactivity disorder. Neuropsychopharmacology 2015, 40, 746–754. [Google Scholar] [CrossRef]
- Cortese, S.; Imperati, D.; Zhou, J.; Proal, E.; Klein, R.G.; Mannuzza, S.; Ramos-Olazagasti, M.A.; Milham, M.P.; Kelly, C.; Castellanos, F.X. White matter alterations at 33-year follow-up in adults with childhood attention-deficit/hyperactivity disorder. Biol. Psychiatry 2013, 74, 591–598. [Google Scholar] [CrossRef] [PubMed]
- Mills, K.L.; Bathula, D.; Dias, T.G.; Iyer, S.P.; Fenesy, M.C.; Musser, E.D.; Stevens, C.A.; Thurlow, B.L.; Carpenter, S.D.; Nagel, B.J.; et al. Altered cortico-striatal-thalamic connectivity in relation to spatial working memory capacity in children with ADHD. Front. Psychiatry 2012, 3, 2. [Google Scholar] [CrossRef] [PubMed]
- Bralten, J.; Greven, C.U.; Franke, B.; Mennes, M.; Zwiers, M.P.; Rommelse, N.N.; Hartman, C.; van der Meer, D.; O’Dwyer, L.; Oosterlaan, J. Voxel-based morphometry analysis reveals frontal brain differences in participants with ADHD and their unaffected siblings. J. Psychiatry Neurosci. JPN 2016, 41, 272. [Google Scholar] [CrossRef]
- Mulder, M.J.; Baeyens, D.; Davidson, M.C.; Casey, B.J.; Van Den Ban, E.; Van Engeland, H.; Durston, S. Familial vulnerability to ADHD affects activity in the cerebellum in addition to the prefrontal systems. J. Am. Acad. Child Adolesc. Psychiatry 2008, 47, 68–75. [Google Scholar] [CrossRef] [PubMed]
- Rapoport, J.L.; Shaw, P. Defining the contribution of genetic risk to structural and functional anomalies in ADHD. J. Am. Acad. Child Adolesc. Psychiatry 2008, 47, 2–3. [Google Scholar] [CrossRef]
- Sarubbo, S.; De Benedictis, A.; Maldonado, I.L.; Basso, G.; Duffau, H. Frontal terminations for the inferior fronto-occipital fascicle: Anatomical dissection, DTI study and functional considerations on a multi-component bundle. Brain Struct. Funct. 2013, 218, 21–37. [Google Scholar] [CrossRef]
- Hattori, T.; Ito, K.; Nakazawa, C.; Numasawa, Y.; Watanabe, M.; Aoki, S.; Mizusawa, H.; Ishiai, S.; Yokota, T. Structural connectivity in spatial attention network: Reconstruction from left hemispatial neglect. Brain Imaging Behav. 2018, 12, 309–323. [Google Scholar] [CrossRef]
- Martino, J.; Brogna, C.; Robles, S.G.; Vergani, F.; Duffau, H. Anatomic dissection of the inferior fronto-occipital fasciculus revisited in the lights of brain stimulation data. Cortex 2010, 46, 691–699. [Google Scholar] [CrossRef]
- Zhou, R.; Dong, P.; Chen, S.; Qian, A.; Tao, J.; Zheng, X.; Cheng, J.; Yang, C.; Huang, X.; Wang, M. The long-range white matter microstructural alterations in drug-naive children with ADHD: A tract-based spatial statistics study. Psychiatry Res. Neuroimaging 2022, 327, 111548. [Google Scholar] [CrossRef]
- Tremblay, L.K.; Hammill, C.; Ameis, S.H.; Bhaijiwala, M.; Mabbott, D.J.; Anagnostou, E.; Lerch, J.P.; Schachar, R.J. Tracking Inhibitory Control in Youth With ADHD: A Multi-Modal Neuroimaging Approach. Front. Psychiatry 2020, 11, 00831. [Google Scholar] [CrossRef]
- Sudre, G.; Choudhuri, S.; Szekely, E.; Bonner, T.; Goduni, E.; Sharp, W.; Shaw, P. Estimating the Heritability of Structural and Functional Brain Connectivity in Families Affected by Attention-Deficit/Hyperactivity Disorder. JAMA Psychiatry 2017, 74, 76–84. [Google Scholar] [CrossRef]
- González-Madruga, K.; Staginnus, M.; Fairchild, G. Alterations in Structural and Functional Connectivity in ADHD: Implications for Theories of ADHD. In New Discoveries in the Behavioral Neuroscience of Attention-Deficit Hyperactivity Disorder; Stanford, S.C., Sciberras, E., Eds.; Springer International Publishing: Cham, Switzerland, 2022; pp. 445–481. [Google Scholar]


| ADHD-F Mean (±95% CI) or N | ADHD-NF Mean (±95% CI) or N (%) [CI Range] | Control Mean (±95% CI) or N (%) [CI Range] | F or χ2 | p-Value | |
|---|---|---|---|---|---|
| Age (months) | 119.90 [118.51, 121.29] | 118.07 [116.77, 119.37] | 119.16 [117.97, 120.35] | 1.91 | 0.148 |
| Sex: | 2.54 | 0.280 | |||
| Female | 38 (34) [24.6, 42.0] | 59 (43) [36.8, 49.4] | 60 (40) [32.2, 47.8] | ||
| Male | 76 (66) [58.0, 75.4] | 78 (57) [50.6, 63.2] | 90 (60) [52.2, 67.8] | ||
| Handedness: | 2.40 | 0.662 | |||
| Right-Handed | 86 (76) [ 67.5, 83.37] | 110 (80) [73.6, 86.9] | 124 (83) [76.7, 88.7] | ||
| Left-Handed | 7 (6) [1.7, 10.6] | 8 (6) [1.9, 9.8] | 8 (5) [1.7, 9.3] | ||
| Both-Handed | 21 (18) [11.3, 25.6] | 19 (14) [8.1, 19.6] | 18 (12) [6.8, 17.2] | ||
| Puberty category score: | - | 0.548 | |||
| Pre-Pubertal | 65 (57) [47.9, 66.1] | 80 (58) [50.1, 66.7] | 91 (61) [52.8, 68.5] | ||
| Early-Pubertal | 30 (26) [18.2, 34.4] | 26 (19) [12.4, 25.6] | 36 (24) [17.2, 30.8] | ||
| Mid-Pubertal | 18 (16) [9.0, 22.5] | 30 (22) [14.9, 28.8] | 21 (14) [8.5, 19.5] | ||
| Late-Pubertal | 1 (1) [0.0, 2.6] | 1 (1) [0.0, 2.1] | 2 (1) [0.0, 3.2] | ||
| IQ (Picture Vocabulary) | 109.85 [106.29, 113.42] | 105.39 [102.41, 108.37] | 107.43 [104.87, 109.99] | 2.02 | 0.133 |
| Race: | 1.72 | 0.943 | |||
| Caucasian | 85 (75) [67.0, 82.2] | 101 (74) [66.1, 81.3] | 112 (75) [67.5, 81.9] | ||
| African-American | 11 (10) [4.3, 14.9] | 18 (13) [7.4, 18.8] | 14 (9) [4.6, 14.0] | ||
| More than one race | 12 (10) [5.0, 16.1] | 12 (9) [4.0, 13.6] | 15 (10) [5.2, 14.8] | ||
| Other races | 6 (5) [1.2, 9.4] | 6 (4) [0.9, 7.9] | 9 (6) [2.2, 9.8] | ||
| Annual income: | 6.50 | 0.164 | |||
| <USD 50,000 | 51 (45) [35.7, 53.6] | 44 (32) [24.3, 39.9] | 60 (40) [32.2, 47.8] | ||
| USD 50,000–10,0000 | 24 (21) [3.7, 28.5] | 28 (20) [16.5, 32.3] | 24 [(16) [10.2, 21.8] | ||
| >USD 100,000 | 39 (34) [25.3, 43.1] | 65 (48) [39.3, 55.5] | 66 (44) [36.4, 51.6] | ||
| Parental education: | 6.12 | 0.633 | |||
| No high school diploma | 4 (4) [0.1, 6.9] | 8 (6) [1.8, 9.8] | 11 (7) [3.0, 11.5] | ||
| High school diploma | 6 (5) [1.2, 9.4] | 9 (7) [2.4, 10.8] | 16 (11) [5.7, 15.7] | ||
| Some college | 40 (35) [26.3, 43.8] | 45 (33) [24.7, 40.9] | 47 (31) [23.8, 38.8] | ||
| Bachelor’s degree | 31 (27) [19.0, 35.5] | 42 (31) [22.7, 38.6] | 42 (28) [20.5, 35.7] | ||
| Graduate degree | 33 (29) [20.6, 37.3] | 33 (24) [16.9, 31.4] | 34 (23) [15.7, 29.7] | ||
| Medication status: | - | 0.619 | |||
| No medication | 81 (71) [62.7, 79.3] | 104 (76) [68.5, 83.3] | - | ||
| Stimulant medication | 31 (27) [18.6, 35.8] | 29 (21) [14.0, 28.4] | - | ||
| No stimulant medication | 1 (1) [0.0, 2.6] | 3 (2) [0.0, 4.7] | - | ||
| Mixed medications | 1 (1) [0.0, 2.6] | 1 (1) [0.0, 2.1] | - | ||
| ADHD symptom presentation: | 1.97 | 0.373 | |||
| Inattentive | 48 (42) [32.9, 51.3] | 48 (35) [27.0, 43.0] | - | ||
| Hyperactive-Impulsive | 12 (11) [4.8, 16.1] | 21 (15) [9.1, 21.6] | - | ||
| Combined | 54 (47) [37.9, 56.9] | 68 (50) [41.3, 58.0] | - |
| White Matter Tract | Fractional Anisotropy | p-Value After Bonferroni Correction | ||||
|---|---|---|---|---|---|---|
| ADHD-F (±95% CI) | ADHD-NF (±95% CI) | Control (±95% CI) | ADHD-F vs. ADHD-NF | ADHD-F vs. Control | ADHD-NF vs. Control | |
| Left inferior longitudinal fasciculus | 0.492 (0.487, 0.496) | 0.486 (0.482, 0.491) | 0.499 (0.495, 0.503) | 0.145 | 0.076 | 0.001 |
| Forceps major | 0.631 (0.626, 0.637) | 0.633 (0.628, 0.639) | 0.642 (0.638, 0.647) | 0.376 | 0.023 | 0.057 |
| White Matter Tract | Volume | p-Value After Bonferroni Correction | ||||
|---|---|---|---|---|---|---|
| ADHD-F (±95% CI) | ADHD-NF (±95% CI) | Control (±95% CI) | ADHD-F vs. ADHD-NF | ADHD-F vs. Control | ADHD-NF vs. Control | |
| Left inferior longitudinal fasciculus | 13,529 (13,157, 13,902) | 12,796 (12,506, 13,086) | 13,571 (13,288, 13,854) | 0.008 | 0.150 | 0.064 |
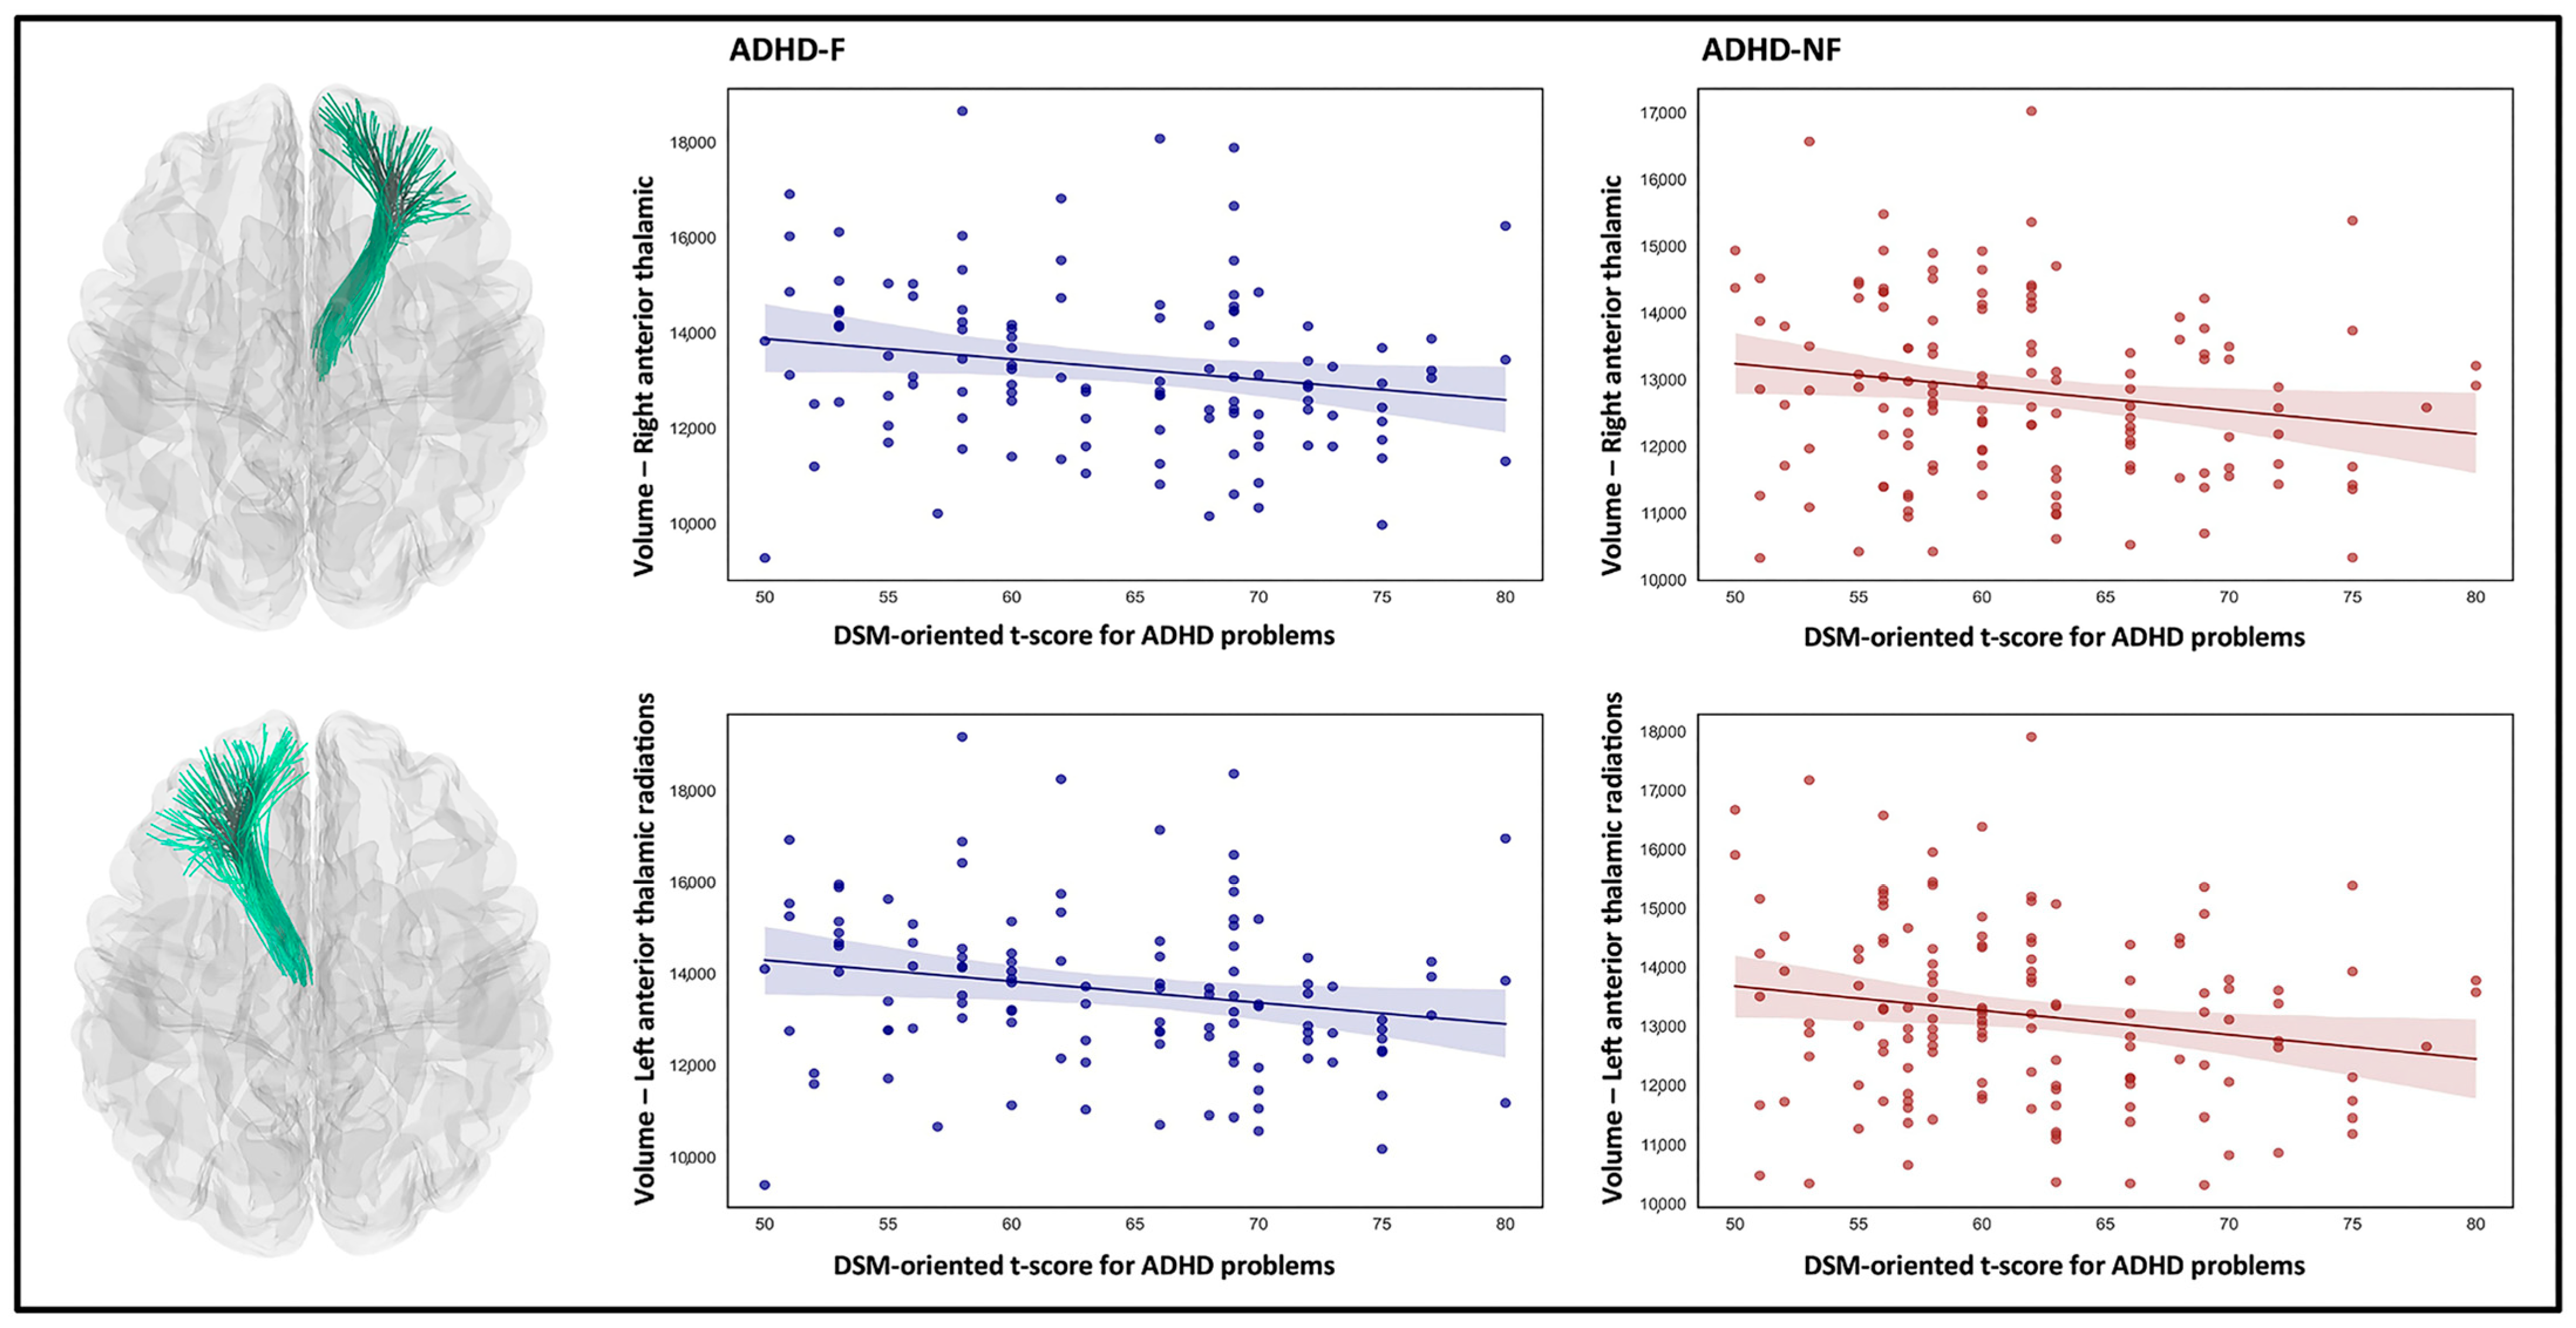
| Right anterior thalamic radiations | 13,273 (12,950, 13,596) | 12,843 (12,607, 13,061) | 13,123 (12,872, 13,374) | 0.188 | 0.001 | 0.193 |
| Left anterior thalamic radiations | 13,639 (13,309, 13,969) | 13,202 (12,945, 13,459) | 13,553 (13,287, 13,818) | 0.209 | 0.007 | 0.283 |
| Left inferior fronto-occipital fasciculus | 14,643 (14,309, 14,977) | 14,202 (13,942, 14,463) | 14,599 (14,338, 14,860) | 0.305 | 0.005 | 0.567 |
Disclaimer/Publisher’s Note: The statements, opinions and data contained in all publications are solely those of the individual author(s) and contributor(s) and not of MDPI and/or the editor(s). MDPI and/or the editor(s) disclaim responsibility for any injury to people or property resulting from any ideas, methods, instructions or products referred to in the content. |
© 2025 by the authors. Licensee MDPI, Basel, Switzerland. This article is an open access article distributed under the terms and conditions of the Creative Commons Attribution (CC BY) license (https://creativecommons.org/licenses/by/4.0/).
Share and Cite
Baboli, R.; Wu, K.; Halperin, J.M.; Li, X. White Matter Microstructural Abnormalities in Children with Familial vs. Non-Familial Attention-Deficit/Hyperactivity Disorder (ADHD). Biomedicines 2025, 13, 676. https://doi.org/10.3390/biomedicines13030676
Baboli R, Wu K, Halperin JM, Li X. White Matter Microstructural Abnormalities in Children with Familial vs. Non-Familial Attention-Deficit/Hyperactivity Disorder (ADHD). Biomedicines. 2025; 13(3):676. https://doi.org/10.3390/biomedicines13030676
Chicago/Turabian StyleBaboli, Rahman, Kai Wu, Jeffrey M. Halperin, and Xiaobo Li. 2025. "White Matter Microstructural Abnormalities in Children with Familial vs. Non-Familial Attention-Deficit/Hyperactivity Disorder (ADHD)" Biomedicines 13, no. 3: 676. https://doi.org/10.3390/biomedicines13030676
APA StyleBaboli, R., Wu, K., Halperin, J. M., & Li, X. (2025). White Matter Microstructural Abnormalities in Children with Familial vs. Non-Familial Attention-Deficit/Hyperactivity Disorder (ADHD). Biomedicines, 13(3), 676. https://doi.org/10.3390/biomedicines13030676