
Early Changes in the Plasma Lipidome of People at Very High Cardiovascular Risk: A New Approach to Assessing the Risk of Cardiovascular Changes

 , , ,
, , ,
Abstract
1. Introduction
2. Materials and Methods
2.1. Study Population
2.2. Blood Sampling
2.3. Sample Preparation
2.4. Lipidomic Analysis
2.5. Statistical Analysis

| Demographic Data * | Patient Group | Control Group | p-Values |
|---|---|---|---|
| n = 20 | n = 20 | ||
| Age {year}, median (IQR) | 51 (46–56) | 50 (41–55) | 0.520 |
| Male, n (%) | 10 (50) | 10 (50) | 1.00 |
| CA/CAD, n (%) ** | 8 (40) | 0 (0) | 0.003 |
| BMI (kg/m2), (mean ± SD) | 28.3 ± 4.3 | 26.2 ± 5.1 | 0.064 |
| High cardiovascular risk evaluation during recruiting ** | |||
| High cardiovascular risk, n (%) | 12 (60) | 0 (0) | <0.001 |
| Very high cardiovascular risk, n (%) | 8 (40) | 0 (0) | 0.003 |
| Hypertension, n (%) | 7 (35) | 0 (0) | 0.008 |
| Hypercholesterolemia, n (%) | 10 (50) | 0 (0) | <0.001 |
| CKD, n (%) | 2 (10) | 0 (0) | 0.487 |
| CThD, n (%) | 1 (5) | 0 (0) | 1.00 |
| Cholesterol and general fraction evaluation | |||
| Total cholesterol {mg/dL}, median (IQR) | 212 (145–285) | 190 (172–235) | 0.797 |
| HDL {mg/dL}, median (IQR) | 53 (43–62) | 53 (42–65) | 0.914 |
| HDL %, median (IQR) | 30.4 (22–38) | 278 (20–37) | 0.882 |
| Non-HDL {mg/dL}, median (IQR) | 143 (53–223) | 146 (102–174) | 0.968 |
| LDL {mg/dL}, median (IQR) | 125 (54–204) | 133 (95–162) | 0.745 |
| Triglyceride {mg/dL}, median (IQR) | 132 (103–189) | 116 (89–202) | 0.546 |
| Atherogenic index, median (IQR) | 3.30 (2.64–4.57) | 3.73 (2.69–4.97) | 0.882 |
| Lipid-lowering therapy | |||
| Statin | 6 (30) | 0 (0) | 0.020 |
| PCSK9 | 5 (25) | 0 (0) | 0.047 |
3. Results
4. Discussion
Limitation of the Study
5. Conclusions
Supplementary Materials
Author Contributions
Funding
Institutional Review Board Statement
Informed Consent Statement
Data Availability Statement
Conflicts of Interest
References
- Beyene, H.B.; Giles, C.; Huynh, K.; Wang, T.; Cinel, M.; Mellett, N.A.; Olshansky, G.; Meikle, T.G.; Watts, G.F.; Hung, J.; et al. Metabolic phenotyping of BMI to characterize cardiometabolic risk: Evidence from large population-based cohorts. Nat. Commun. 2023, 14, 6280. [Google Scholar] [CrossRef] [PubMed]
- Meikle, P.J.; Wong, G.; Barlow, C.K.; Kingwell, B.A. Lipidomics: Potential role in risk prediction and therapeutic monitoring for diabetes and cardiovascular disease. Pharmacol. Ther. 2014, 143, 12–23. [Google Scholar] [CrossRef]
- Gu, P.S.; Su, K.W.; Yeh, K.W.; Huang, J.L.; Lo, F.S.; Chiu, C.Y. Metabolomics Analysis Reveals Molecular Signatures of Metabolic Complexity in Children with Hypercholesterolemia. Nutrients 2023, 15, 1726. [Google Scholar] [CrossRef] [PubMed]
- Dobrowolski, P.; Kabat, M.; Kępka, C.; Januszewicz, A.; Prejbisz, A. Atherosclerotic cardiovascular disease burden in patients with familial hypercholesterolemia: Interpretation of data on involvement of different vascular beds. Pol. Arch. Intern. Med. 2022, 132, 16248. [Google Scholar] [CrossRef] [PubMed]
- Nurmohamed, N.S.; Kraaijenhof, J.M.; Mayr, M.; Nicholls, S.J.; Koenig, W.; Catapano, A.L.; Stroes, E.S.G. Proteomics and lipidomics in atherosclerotic cardiovascular disease risk prediction. Eur. Heart J. 2023, 44, 1594–1607. [Google Scholar] [CrossRef]
- Duan, Y.; Gong, K.; Xu, S.; Zhang, F.; Meng, X.; Han, J. Regulation of cholesterol homeostasis in health and diseases: From mechanisms to targeted therapeutics. Signal Transduct. Target. Ther. 2022, 7, 265. [Google Scholar] [CrossRef]
- Jayawardana, K.S.; Mundra, P.A.; Giles, C.; Barlow, C.K.; Nestel, P.J.; Barnes, E.H.; Kirby, A.; Thompson, P.; Sullivan, D.R.; Alshehry, Z.H.; et al. Changes in plasma lipids predict pravastatin efficacy in secondary prevention. JCI Insight 2019, 4, e128438. [Google Scholar] [CrossRef]
- Mundra, P.A.; Barlow, C.K.; Nestel, P.J.; Barnes, E.H.; Kirby, A.; Thompson, P.; Sullivan, D.R.; Alshehry, Z.H.; Mellett, N.A.; Huynh, K.; et al. Large-scale plasma lipidomic profiling identifies lipids that predict cardiovascular events in secondary prevention. JCI Insight 2018, 3, e121326. [Google Scholar] [CrossRef]
- Fahy, E.; Cotter, D.; Sud, M.; Subramaniam, S. Lipid classification, structures and tools. Biochim. Biophys. Acta 2011, 1811, 637–647. [Google Scholar] [CrossRef]
- Gibellini, F.; Smith, T.K. The Kennedy pathway—De novo synthesis of phosphatidylethanolamine and phosphatidylcholine. IUBMB Life 2010, 62, 414–428. [Google Scholar] [CrossRef]
- Patel, D.; Witt, S.N. Ethanolamine and Phosphatidylethanolamine: Partners in Health and Disease. Oxid. Med. Cell. Longev. 2017, 2017, 4829180. [Google Scholar] [CrossRef] [PubMed]
- Vance, D.E. Role of phosphatidylcholine biosynthesis in the regulation of lipoprotein homeostasis. Curr. Opin. Lipidol. 2008, 19, 229–234. [Google Scholar] [CrossRef] [PubMed]
- Avela, H.F.; Sirén, H. Advances in lipidomics. Clin. Chim. Acta 2020, 510, 123–141. [Google Scholar] [CrossRef] [PubMed]
- Visseren, F.L.J.; Mach, F.; Smulders, Y.M.; Carballo, D.; Koskinas, K.C.; Bäck, M.; Benetos, A.; Biffi, A.; Boavida, J.M.; Capodanno, D.; et al. 2021 ESC Guidelines on cardiovascular disease prevention in clinical practice. Eur. Heart J. 2021, 42, 3227–3337. [Google Scholar] [CrossRef]
- Ryan, M.J.; Grant-St James, A.; Lawler, N.G.; Fear, M.W.; Raby, E.; Wood, F.M.; Maker, G.L.; Wist, J.; Holmes, E.; Nicholson, J.K.; et al. Comprehensive Lipidomic Workflow for Multicohort Population Phenotyping Using Stable Isotope Dilution Targeted Liquid Chromatography-Mass Spectrometry. J. Proteome Res. 2023, 22, 1419–1433. [Google Scholar] [CrossRef]
- Zivkovic, A.M.; Wiest, M.M.; Nguyen, U.T.; Davis, R.; Watkins, S.M.; German, J.B. Effects of sample handling and storage on quantitative lipid analysis in human serum. Metabolomics 2009, 5, 507–516. [Google Scholar] [CrossRef]
- Lin, D.Y. A simple and accurate method to determine genomewide significance for association tests in sequencing studies. Genet. Epidemiol. 2019, 43, 365–372. [Google Scholar] [CrossRef]
- Arnett, D.K.; Blumenthal, R.S.; Albert, M.A.; Buroker, A.B.; Goldberger, Z.D.; Hahn, E.J.; Himmelfarb, C.D.; Khera, A.; Lloyd-Jones, D.; McEvoy, J.W.; et al. 2019 ACC/AHA Guideline on the Primary Prevention of Cardiovascular Disease: A Report of the American College of Cardiology/American Heart Association Task Force on Clinical Practice Guidelines. Circulation 2019, 140, e596–e646. [Google Scholar] [CrossRef]
- Wang, J.; Xu, J.; Liu, T.; Yu, C.; Xu, F.; Wang, G.; Li, S.; Dai, X. Biomechanics-mediated endocytosis in atherosclerosis. Front. Cardiovasc. Med. 2024, 11, 1337679. [Google Scholar] [CrossRef]
- Sánchez-Vinces, S.; Garcia, P.H.D.; Silva, A.A.R.; Fernandes, A.M.A.P.; Barreto, J.A.; Duarte, G.H.B.; Antonio, M.A.; Birbrair, A.; Porcari, A.M.; Carvalho, P.O. Mass-Spectrometry-Based Lipidomics Discriminates Specific Changes in Lipid Classes in Healthy and Dyslipidemic Adults. Metabolites 2023, 13, 222. [Google Scholar] [CrossRef]
- Züllig, T.; Köfeler, H.C. High resolution mass spectrometry in lipidomics. Mass Spectrom. Rev. 2021, 40, 162–176. [Google Scholar] [CrossRef] [PubMed]
- Köfeler, H.C.; Ahrends, R.; Baker, E.S.; Ekroos, K.; Han, X.; Hoffmann, N.; Holčapek, M.; Wenk, M.R.; Liebisch, G. Recommendations for good practice in MS-based lipidomics. J. Lipid Res. 2021, 62, 100138. [Google Scholar] [CrossRef] [PubMed]
- Hishikawa, D.; Hashidate, T.; Shimizu, T.; Shindou, H. Diversity and function of membrane glycerophospholipids generated by the remodeling pathway in mammalian cells. J. Lipid Res. 2014, 55, 799–807. [Google Scholar] [CrossRef]
- Meikle, P.J.; Wong, G.; Tsorotes, D.; Barlow, C.K.; Weir, J.M.; Christopher, M.J.; MacIntosh, G.L.; Goudey, B.; Stern, L.; Kowalczyk, A.; et al. Plasma lipidomic analysis of stable and unstable coronary artery disease. Arterioscler. Thromb. Vasc. Biol. 2011, 31, 2723–2732. [Google Scholar] [CrossRef] [PubMed]
- Ekroos, K.; Jänis, M.; Tarasov, K.; Hurme, R.; Laaksonen, R. Lipidomics: A tool for studies of atherosclerosis. Curr. Atheroscler. Rep. 2010, 12, 273–281. [Google Scholar] [CrossRef]
- Zhang, Z.; Karu, N.; Kindt, A.; Singh, M.; Lamont, L.; van Gammeren, A.J.; Ermens, A.A.M.; Harms, A.C.; Portengen, L.; Vermeulen, R.C.H.; et al. Association of Altered Plasma Lipidome with Disease Severity in COVID-19 Patients. Biomolecules 2024, 14, 296. [Google Scholar] [CrossRef]
- Stegemann, C.; Pechlaner, R.; Willeit, P.; Langley, S.R.; Mangino, M.; Mayr, U.; Menni, C.; Moayyeri, A.; Santer, P.; Rungger, G.; et al. Lipidomics profiling and risk of cardiovascular disease in the prospective population-based Bruneck study. Circulation 2014, 129, 1821–1831. [Google Scholar] [CrossRef]
- Eggers, L.F.; Schwudke, D. Shotgun Lipidomics Approach for Clinical Samples. Methods Mol. Biol. 2018, 1730, 163–174. [Google Scholar] [CrossRef]
- Meikle, T.G.; Huynh, K.; Giles, C.; Meikle, P.J. Clinical lipidomics: Realizing the potential of lipid profiling. J. Lipid Res. 2021, 62, 100127. [Google Scholar] [CrossRef]
- Gencer, B.; Morrow, D.A.; Braunwald, E.; Goodrich, E.L.; Hilvo, M.; Kauhanen, D.; Sabatine, M.S.; Laaksonen, R.; O’Donoghue, M.L. Plasma ceramide and phospholipid-based risk score and the risk of cardiovascular death in patients after acute coronary syndrome. Eur. J. Prev. Cardiol. 2022, 29, 895–902. [Google Scholar] [CrossRef]
- Laaksonen, R.; Ekroos, K.; Sysi-Aho, M.; Hilvo, M.; Vihervaara, T.; Kauhanen, D.; Suoniemi, M.; Hurme, R.; März, W.; Scharnagl, H.; et al. Plasma ceramides predict cardiovascular death in patients with stable coronary artery disease and acute coronary syndromes beyond LDL-cholesterol. Eur. Heart J. 2016, 37, 1967–1976. [Google Scholar] [CrossRef] [PubMed]
- Timmerman, N.; Waissi, F.; Dekker, M.; de Borst, G.J.; van Bennekom, J.; de Winter, R.J.; Hilvo, M.; Jylhä, A.; Pasterkamp, G.; de Kleijn, D.P.V.; et al. Ceramides and phospholipids in plasma extracellular vesicles are associated with high risk of major cardiovascular events after carotid endarterectomy. Sci. Rep. 2022, 12, 5521. [Google Scholar] [CrossRef] [PubMed]
- Dobrowolski, P.; Prejbisz, A.; Kuryłowicz, A.; Baska, A.; Burchardt, P.; Chlebus, K.; Dzida, G.; Jankowski, P.; Jaroszewicz, J.; Jaworski, P.; et al. Metabolic syndrome—A new definition and management guidelines: A joint position paper by the Polish Society of Hypertension, Polish Society for the Treatment of Obesity, Polish Lipid Association, Polish Association for Study of Liver, Polish Society of Family Medicine, Polish Society of Lifestyle Medicine, Division of Prevention and Epidemiology Polish Cardiac Society, “Club 30” Polish Cardiac Society, and Division of Metabolic and Bariatric Surgery Society of Polish Surgeons. Arch. Med. Sci. 2022, 18, 1133–1156. [Google Scholar] [CrossRef] [PubMed]

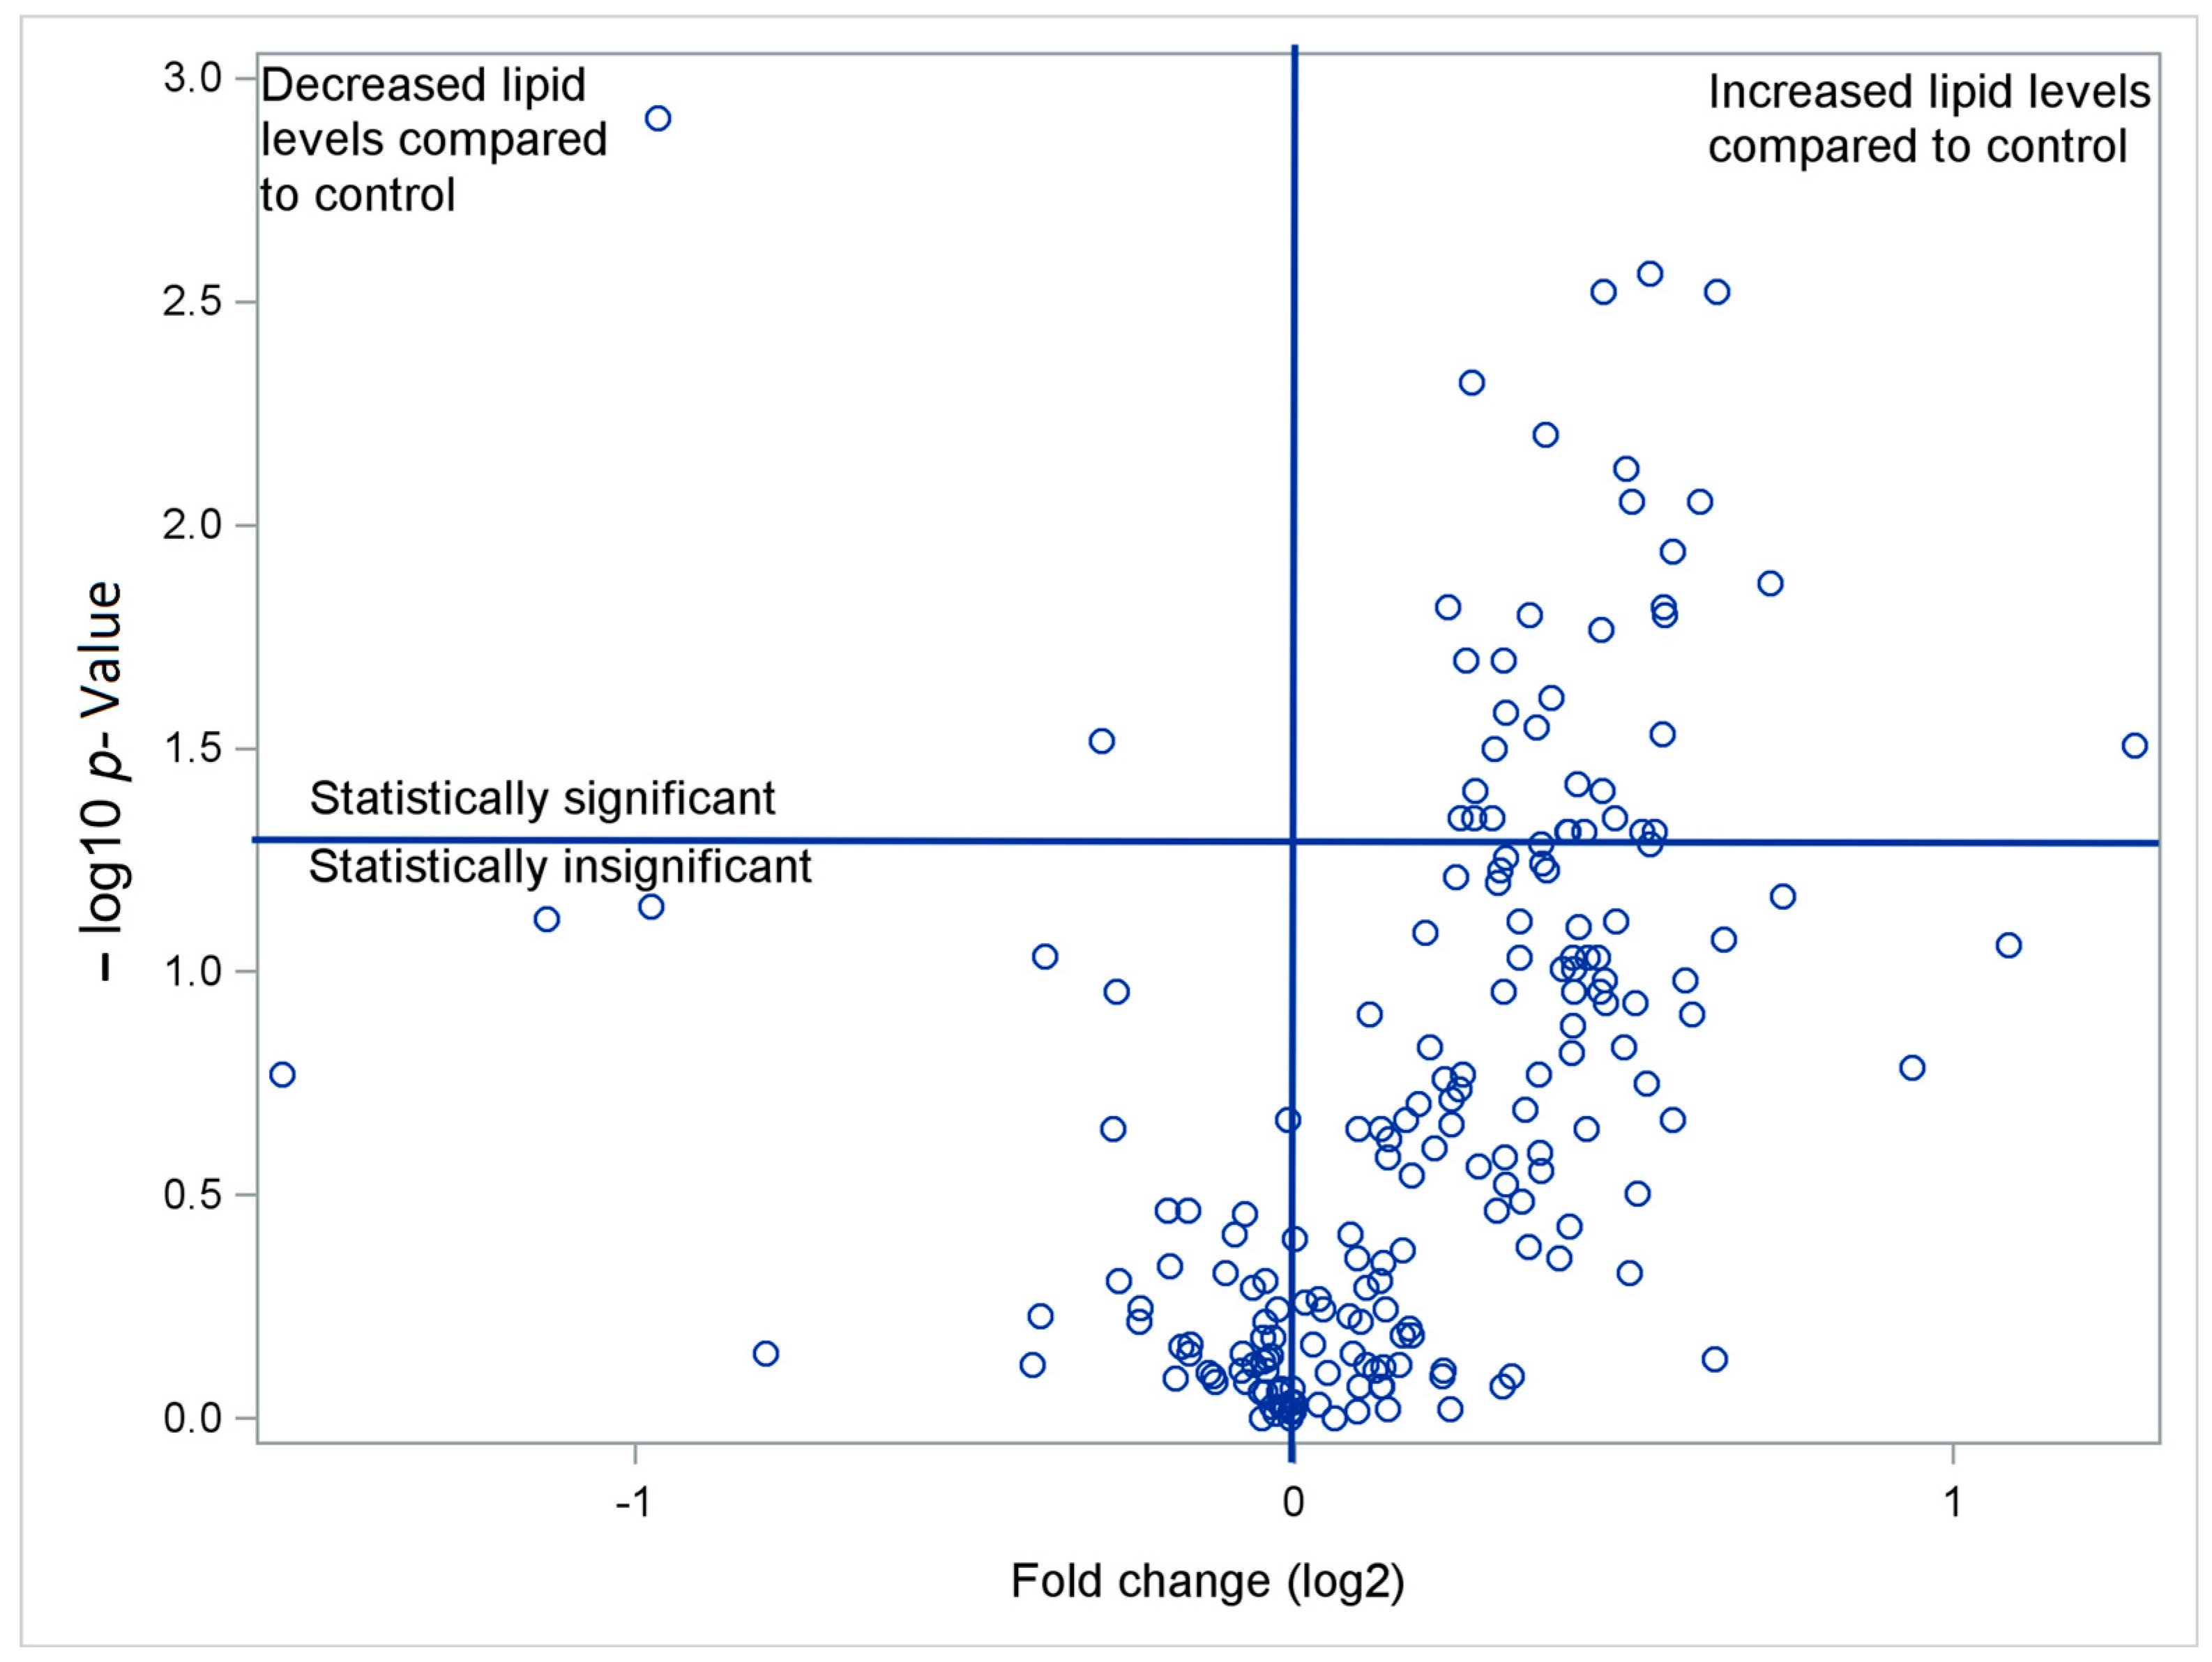
| Glycerophospholipids | Patient Group | Control Group | Fold-Change | p-Value | |||||
|---|---|---|---|---|---|---|---|---|---|
| Median {m/z} | Lower Quartile | Upper Quartile | Median {m/z} | Lower Quartile | Upper Quartile | Raw | FDR * | ||
| Phosphatidylcholine (PC) | |||||||||
| PC (O-36:0/16:0) | 181.8 | 150.8 | 245.2 | 134.3 | 101.8 | 167.5 | 1.35 | 0.006 | 0.0339 |
| PC (O-36:5/20:5) | 89.3 | 43.0 | 214.8 | 0.0 | 0.0 | 83.2 | NA | 0.016 | 0.0339 |
| Phosphatidylethanolamine (PE) | |||||||||
| PE (36:1/16:0) | 220.7 | 129.3 | 255.2 | 133.7 | 73.3 | 173.5 | 1.65 | 0.019 | 0.0339 |
| PE (36:4/20:4) | 833.7 | 572.3 | 935.2 | 571.0 | 448.8 | 749.7 | 1.46 | 0.048 | 0.0479 |
| PE (38:3/16:0) | 45.5 | 0.0 | 192.0 | 0.0 | 0.0 | 0.0 | NA | 0.033 | 0.0407 |
| PE (38:4/16:0) | 336.5 | 258.0 | 379.8 | 256.8 | 211.7 | 281.8 | 1.31 | 0.021 | 0.0339 |
| PE (38:4/18:0) | 1213.5 | 1005.8 | 1559.2 | 1003.8 | 789.0 | 1171.3 | 1.21 | 0.040 | 0.0441 |
| PE (38:4/20:4) | 3042.3 | 2741.7 | 3904.0 | 2524.3 | 1937.8 | 2890.2 | 1.21 | 0.008 | 0.0339 |
| PE (38:5/20:4) | 593.0 | 420.3 | 733.0 | 412.8 | 312.5 | 504.8 | 1.44 | 0.005 | 0.0339 |
| PE (40:4/18:1) | 0.0 | 0.0 | 1364.7 | 0.0 | 0.0 | 0.0 | NA | 0.018 | 0.0339 |
| PE (40:5/18:1) | 224.7 | 190.7 | 290.8 | 175.3 | 118.7 | 217.3 | 1.28 | 0.028 | 0.0382 |
| PE (40:5/20:4) | 265.8 | 198.5 | 336.3 | 180.2 | 87.2 | 212.3 | 1.48 | 0.005 | 0.0339 |
| PE (O-38:5/20:4) | 3455.2 | 2813.3 | 4838.8 | 2449.0 | 1509.7 | 3369.3 | 1.41 | 0.010 | 0.0339 |
| PE (O-40:7/22:6) | 309.7 | 253.5 | 412.3 | 127.3 | 0.0 | 330.7 | 2.43 | 0.014 | 0.0339 |
| Phosphatidylglycerol (PG) | |||||||||
| PG (36:5/20:4) | 793.2 | 702.3 | 1021.3 | 662.5 | 530.2 | 800.0 | 1.20 | 0.025 | 0.0359 |
| PG (38:6/16:0) | 621.5 | 499.5 | 1020.8 | 458.2 | 387.7 | 631.8 | 1.36 | 0.040 | 0.0441 |
| PG (40:6/18:2) | 131.3 | 0.0 | 445.8 | 0.0 | 0.0 | 0.0 | NA | 0.014 | 0.0339 |
| PG (40:8/20:4) | 797.0 | 626.5 | 1123.8 | 597.8 | 469.7 | 942.3 | 1.33 | 0.045 | 0.0473 |
| Phosphatidylserine (PS) | |||||||||
| PS (36:1/18:1) | 259.8 | 176.8 | 349.2 | 166.7 | 155.7 | 215.7 | 1.56 | 0.007 | 0.0339 |
| PS (38:6/18:1) | 249.2 | 177.7 | 266.8 | 153.8 | 31.0 | 248.0 | 1.62 | 0.033 | 0.0407 |
| PS (O-36:1/18:0) | 190.3 | 141.5 | 243.3 | 79.5 | 13.3 | 175.0 | 2.39 | 0.013 | 0.0339 |
| PS (O-38:5/20:4) | 353.7 | 287.0 | 427.3 | 230.7 | 150.3 | 338.2 | 1.53 | 0.022 | 0.0339 |
| Lysophosphatidylcholine (LysoPC) | |||||||||
| No statistical significance observed | |||||||||
| Phosphatidic acid (PA) | |||||||||
| No statistical significance observed | |||||||||
| Phosphatidylinositol (PI) | |||||||||
| No statistical significance observed | |||||||||
| Phosphatidylinositol phosphate (PIP) | |||||||||
| No statistical significance observed | |||||||||
| Glycerophospholipids | Patient Group | Control Group | Fold-Change | p-Value | |||||
|---|---|---|---|---|---|---|---|---|---|
| Median {m/z} | Lower Quartile | Upper Quartile | Median {m/z} | Lower Quartile | Upper Quartile | Raw | FDR * | ||
| Cardiolipin (CL) | |||||||||
| CL (56:1/18:1) | 56.7 | 29.8 | 105.5 | 110.7 | 85.3 | 147.0 | 0.51 | 0.001 | 0.0293 |
| CL (68:3/18:1) | 347.3 | 290.3 | 416.3 | 258.0 | 197.0 | 359.0 | 1.35 | 0.038 | 0.0485 |
| CL (72:3/18:1) | 402.7 | 352.7 | 494.0 | 291.7 | 268.7 | 388.3 | 1.38 | 0.017 | 0.0394 |
| CL (72:8/20:4) | 596.0 | 417.2 | 720.2 | 400.3 | 295.7 | 525.0 | 1.49 | 0.011 | 0.0387 |
| CL (74:2/18:1) | 323.5 | 250.7 | 472.8 | 267.8 | 195.0 | 282.7 | 1.21 | 0.045 | 0.0485 |
| CL (76:10/20:4) | 472.0 | 346.8 | 663.5 | 341.3 | 286.0 | 470.0 | 1.38 | 0.039 | 0.0485 |
| CL (76:14/18:1) | 345.2 | 275.8 | 398.7 | 267.7 | 224.0 | 326.7 | 1.29 | 0.028 | 0.0457 |
| CL (76:7/20:4) | 348.3 | 320.5 | 503.3 | 282.8 | 218.0 | 383.7 | 1.23 | 0.045 | 0.0485 |
| CL (76:8/20:4) | 971.3 | 831.0 | 1198.5 | 685.7 | 612.0 | 974.7 | 1.42 | 0.007 | 0.0385 |
| CL (78:6/20:4) | 793.2 | 702.3 | 1021.3 | 662.5 | 483.7 | 806.7 | 1.20 | 0.020 | 0.0413 |
| CL (78:7/18:0) | 1213.5 | 1005.8 | 1559.2 | 1003.8 | 750.3 | 1182.0 | 1.21 | 0.039 | 0.0485 |
| CL (78:7/20:4) | 3042.3 | 2741.7 | 3904.0 | 2524.3 | 1771.3 | 2828.3 | 1.21 | 0.005 | 0.0373 |
| CL (78:9/20:4) | 593.0 | 420.3 | 733.0 | 408.0 | 302.0 | 469.3 | 1.45 | 0.003 | 0.0293 |
| CL (80:13/18:0) | 242.8 | 181.8 | 283.5 | 194.8 | 109.3 | 215.0 | 1.25 | 0.020 | 0.0413 |
| CL (80:9/20:4) | 366.8 | 310.3 | 511.2 | 281.7 | 215.0 | 333.7 | 1.30 | 0.006 | 0.0385 |
| CL (82:13/18:1) | 259.8 | 176.8 | 349.2 | 166.7 | 152.0 | 211.7 | 1.56 | 0.003 | 0.0293 |
| CL (82:4/18:1) | 493.7 | 255.3 | 625.7 | 370.2 | 261.7 | 416.0 | 1.33 | 0.048 | 0.0485 |
| CL (82:7/20:4) | 376.0 | 328.3 | 447.5 | 320.0 | 229.3 | 361.3 | 1.18 | 0.015 | 0.0387 |
| CL (82:9/20:4) | 283.2 | 229.7 | 358.5 | 204.7 | 127.7 | 253.3 | 1.38 | 0.003 | 0.0293 |
| CL (84:15/20:4) | 196.2 | 142.3 | 241.7 | 144.7 | 123.3 | 185.0 | 1.36 | 0.048 | 0.0485 |
| CL (88:11/16:0) | 0.0 | 0.0 | 85.5 | 89.0 | 0.0 | 161.3 | 0.00 | 0.030 | 0.0457 |
| CL (88:11/18:1) | 0.0 | 0.0 | 190.3 | 262.3 | 0.0 | 529.0 | 0.00 | 0.015 | 0.0387 |
| Diacylglycerolpyrophosphate (DGPP) | |||||||||
| DGPP (O-36:1/18:0) | 358.7 | 276.0 | 467.7 | 290.7 | 195.7 | 345.7 | 1.23 | 0.032 | 0.0457 |
| Dimethyl Phosphatidylethanolamine (DMPE) | |||||||||
| DMPE (24:5) | 285.5 | 239.8 | 324.8 | 349.8 | 299.3 | 414.7 | 0.82 | 0.031 | 0.0457 |
| DMPE (32:1/18:1) | 485.3 | 346.8 | 624.2 | 346.7 | 301.0 | 489.7 | 1.40 | 0.045 | 0.0485 |
| DMPE (34:1/18:0) | 187.0 | 118.2 | 209.5 | 127.0 | 108.3 | 170.3 | 1.47 | 0.029 | 0.0457 |
| DMPE (34:1/18:1) | 1183.7 | 882.7 | 1380.2 | 994.2 | 856.0 | 1105.0 | 1.19 | 0.045 | 0.0485 |
| DMPE (34:2/18:1) | 538.2 | 415.8 | 627.0 | 365.2 | 326.7 | 454.0 | 1.47 | 0.015 | 0.0387 |
| DMPE (34:4/20:4) | 833.7 | 572.3 | 935.2 | 571.0 | 427.0 | 737.0 | 1.46 | 0.048 | 0.0485 |
| DMPE (36:4/16:0) | 336.5 | 258.0 | 379.8 | 256.8 | 211.3 | 286.0 | 1.31 | 0.024 | 0.0457 |
| DMPE (38:3/16:0) | 821.7 | 390.8 | 999.5 | 570.0 | 366.7 | 646.0 | 1.44 | 0.048 | 0.0485 |
| DMPE (38:5/18:1) | 224.7 | 190.7 | 290.8 | 175.5 | 145.0 | 214.0 | 1.28 | 0.016 | 0.0387 |
| DMPE (38:6/20:4) | 137.2 | 107.2 | 206.8 | 83.2 | 59.0 | 138.0 | 1.65 | 0.013 | 0.0387 |
| DMPE (40:7/20:4) | 3202.3 | 2312.0 | 4661.7 | 2404.2 | 1613.7 | 3542.0 | 1.33 | 0.048 | 0.0485 |
| DMPE (42:8/20:4) | 1125.2 | 384.3 | 1410.3 | 465.0 | 248.7 | 859.3 | 2.42 | 0.031 | 0.0457 |
| DMPE (42:8/22:6) | 208.3 | 156.8 | 333.3 | 141.2 | 109.3 | 211.7 | 1.48 | 0.016 | 0.0387 |
| Monomethyl Phosphatidylethanolamine (MMPE) | |||||||||
| MMPE (34:5/20:4) | 2529.0 | 1809.3 | 2991.7 | 1651.2 | 1286.0 | 2259.3 | 1.53 | 0.009 | 0.0385 |
| MMPE (36:5/20:4) | 3861.8 | 3311.0 | 4983.8 | 2706.8 | 2312.0 | 3798.0 | 1.43 | 0.009 | 0.0385 |
| MMPE (38:7/22:6) | 413.5 | 339.8 | 508.5 | 331.0 | 219.0 | 377.0 | 1.25 | 0.026 | 0.0457 |
| Phosphoethanolamine (NAPE) | |||||||||
| No statistical significance observed | |||||||||
| Sphingolipids (SM) | |||||||||
| SM 36:2;O4 | 368.7 | 354.0 | 403.2 | 329.0 | 303.7 | 374.0 | 1.12 | 0.030 | |
| SM 38:2;O4 | 270.8 | 228.2 | 333.2 | 233.2 | 178.3 | 271.5 | 1.16 | 0.033 | |
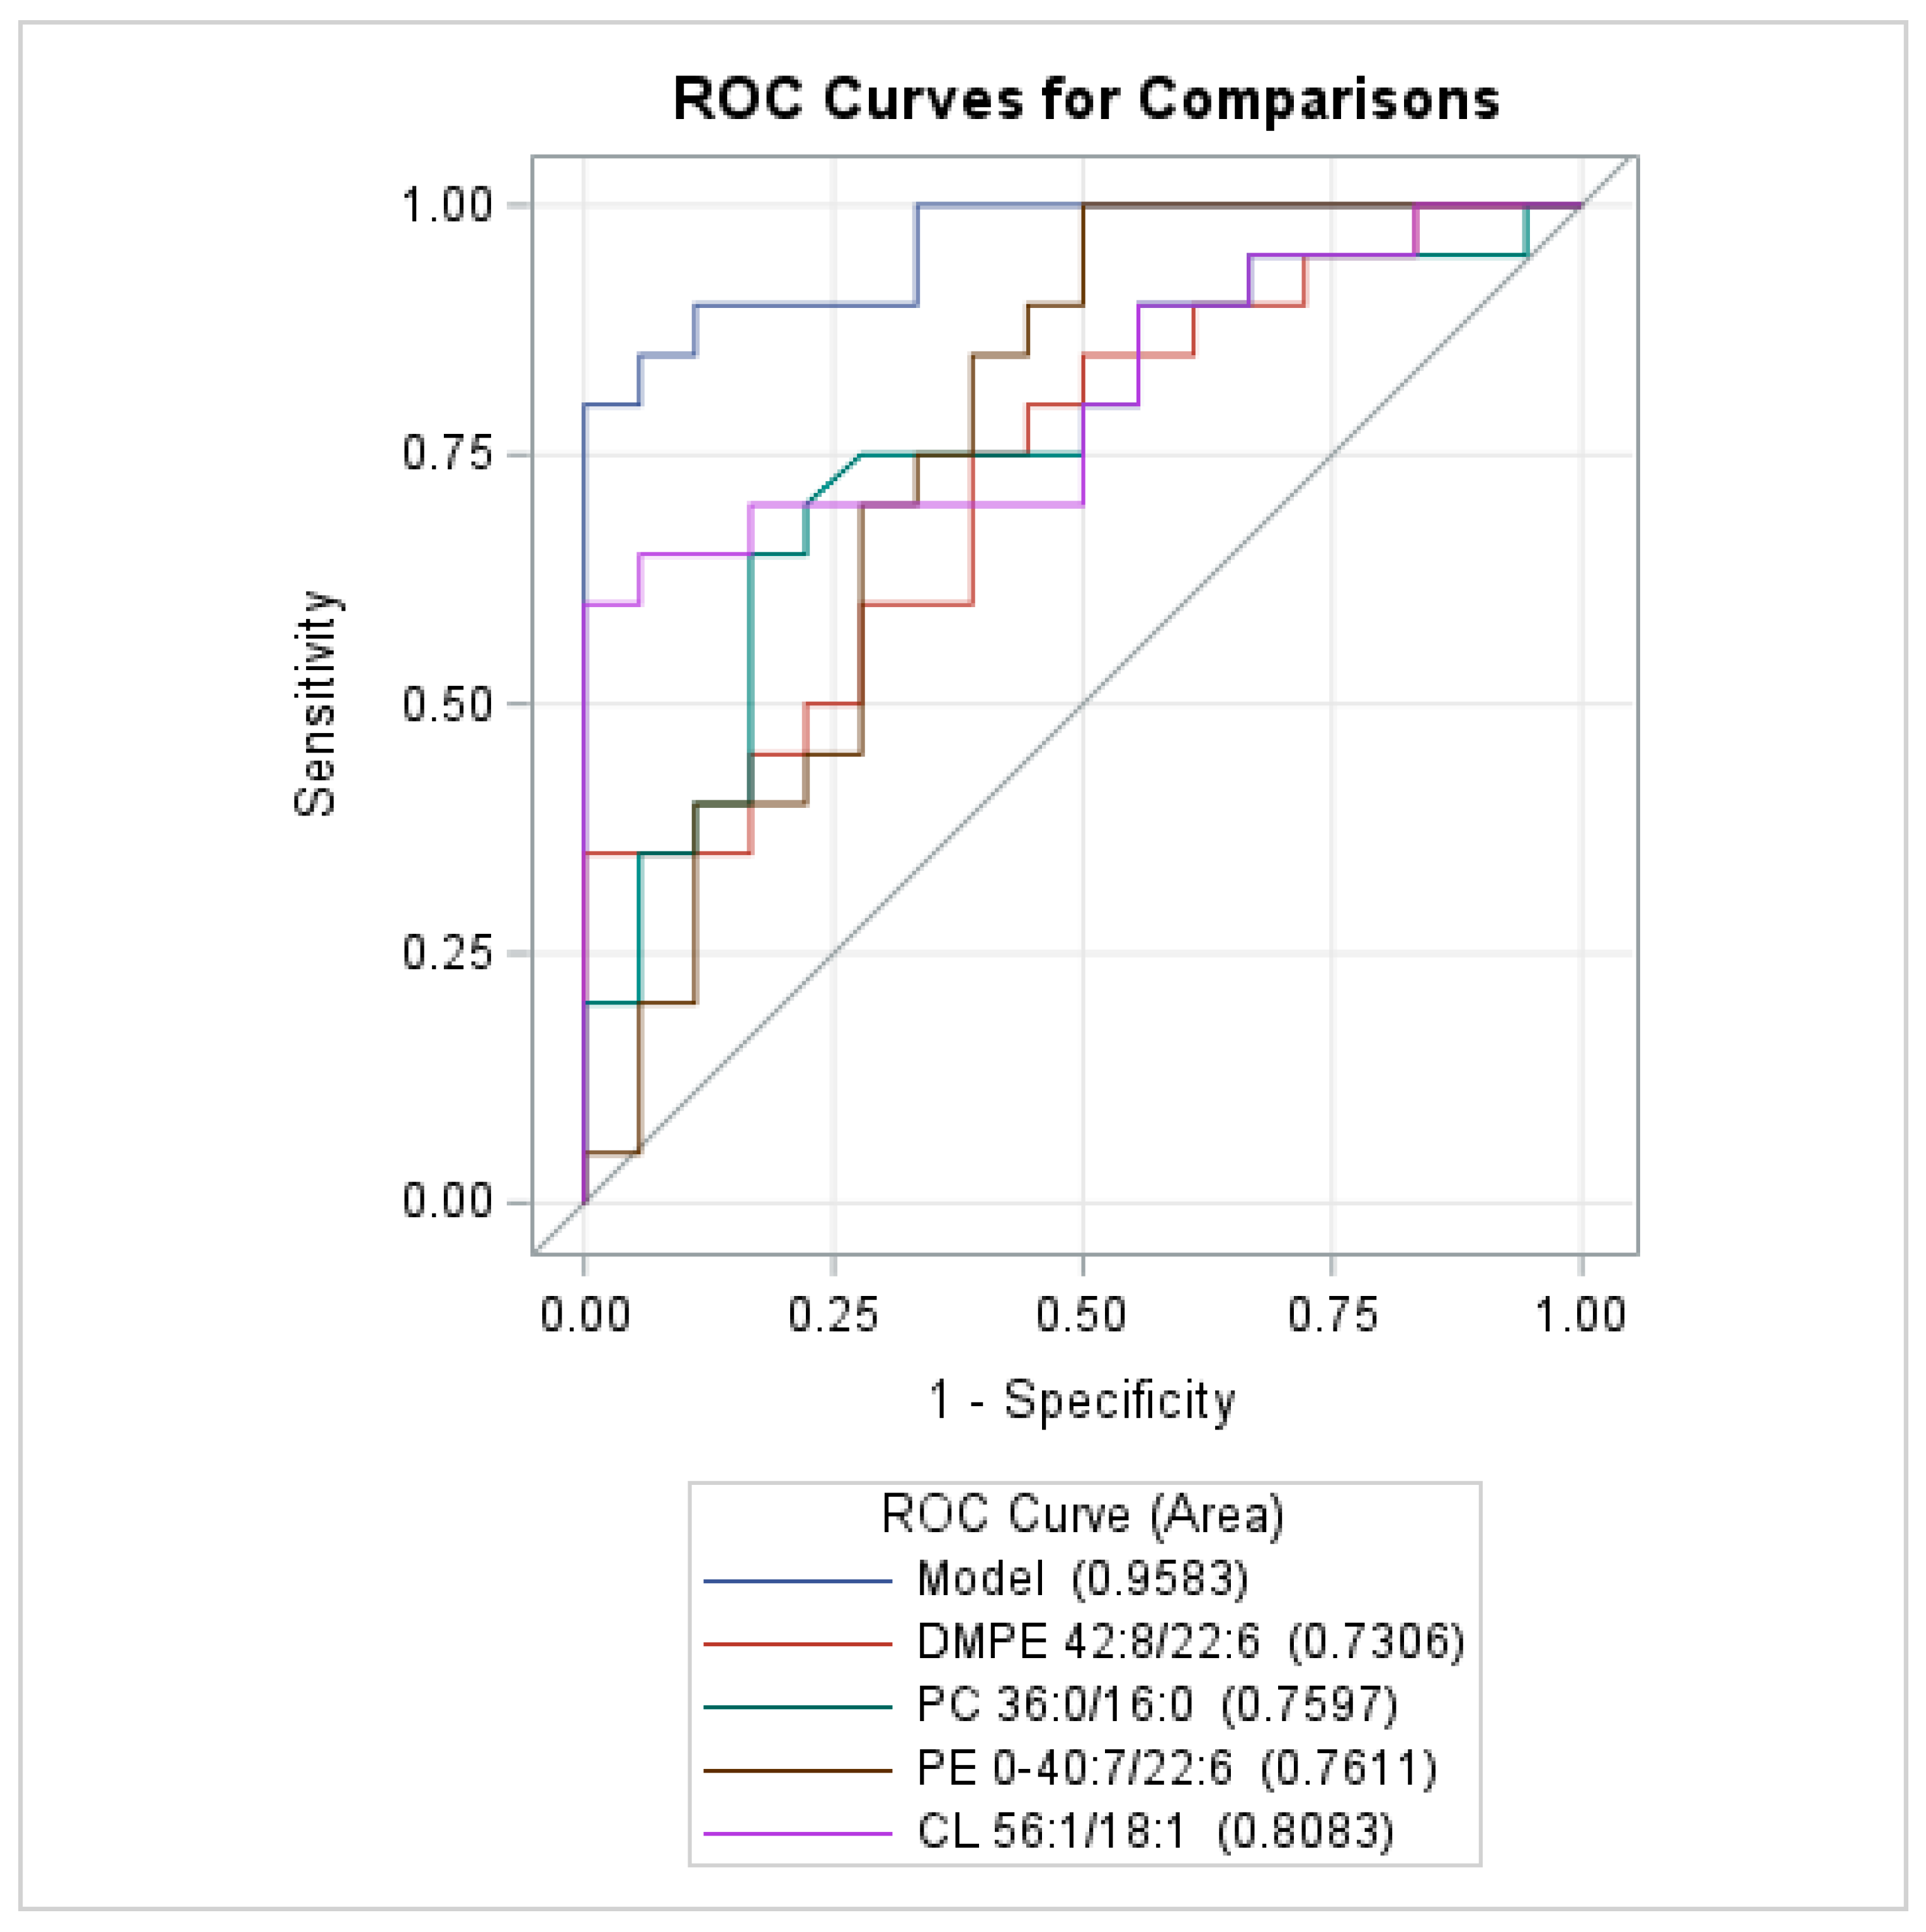
| Name of Compounds | Odds Ratio (95% CI) | p-Value | Odds Ratio (95% CI) | p-Value |
|---|---|---|---|---|
| Separate models for each class | General model for all classes * | |||
| Glycerophospholipids Sg-1. AUC (95% CI): 0.942 (0.876–0.999) | ||||
| PC 36:0/16:0 (unit 10) | 1.246 (1.042–1.490) | 0.0157 | 1.293 (1.027–1.627) | 0.0286 |
| PE O-40:7/22:6 (unit 10) | 1.119 (1.039–1.205) | 0.0028 | 1.083 (1.003–1.169) | 0.0429 |
| PG 40:8/20:4 (unit 10) | 1.053 (1.008–1.101) | 0.0219 | - | |
| Glycerophospholipids Sg-2. AUC (95% CI): 0.942 (0.865–0.999) | ||||
| DMPE 42:8/22:6 (unit 10) | 1.198 (1.020–1.406) | 0.0276 | 1.215 (1.003–1.473) | 0.0468 |
| CL 56:1/18:1 (unit 10) | 0.748 (0.567–0.988) | 0.0406 | 0.702 (0.503–0.978) | 0.0366 |
| CL 82:13/18:1 (unit 10) | 1.264 (1.017–1.572) | 0.0350 | - | |
| Sphingolipids AUC (95% CI): 0.712 (0.548–0.877) | ||||
| SM 38:2;O4 (unit 10) | 1.146 (1.016–1.291) | 0.0260 | - | |
Disclaimer/Publisher’s Note: The statements, opinions and data contained in all publications are solely those of the individual author(s) and contributor(s) and not of MDPI and/or the editor(s). MDPI and/or the editor(s) disclaim responsibility for any injury to people or property resulting from any ideas, methods, instructions or products referred to in the content. |
© 2025 by the authors. Licensee MDPI, Basel, Switzerland. This article is an open access article distributed under the terms and conditions of the Creative Commons Attribution (CC BY) license (https://creativecommons.org/licenses/by/4.0/).
Share and Cite
Waś, J.; Dobrowolski, P.; Prejbisz, A.; Niedolistek, M.; Kowalik, I.; Drohomirecka, A.; Sokołowska, D.; Krzysztoń-Russjan, J. Early Changes in the Plasma Lipidome of People at Very High Cardiovascular Risk: A New Approach to Assessing the Risk of Cardiovascular Changes. Biomedicines 2025, 13, 643. https://doi.org/10.3390/biomedicines13030643
Waś J, Dobrowolski P, Prejbisz A, Niedolistek M, Kowalik I, Drohomirecka A, Sokołowska D, Krzysztoń-Russjan J. Early Changes in the Plasma Lipidome of People at Very High Cardiovascular Risk: A New Approach to Assessing the Risk of Cardiovascular Changes. Biomedicines. 2025; 13(3):643. https://doi.org/10.3390/biomedicines13030643
Chicago/Turabian StyleWaś, Joanna, Piotr Dobrowolski, Aleksander Prejbisz, Magdalena Niedolistek, Ilona Kowalik, Anna Drohomirecka, Dorota Sokołowska, and Jolanta Krzysztoń-Russjan. 2025. "Early Changes in the Plasma Lipidome of People at Very High Cardiovascular Risk: A New Approach to Assessing the Risk of Cardiovascular Changes" Biomedicines 13, no. 3: 643. https://doi.org/10.3390/biomedicines13030643
APA StyleWaś, J., Dobrowolski, P., Prejbisz, A., Niedolistek, M., Kowalik, I., Drohomirecka, A., Sokołowska, D., & Krzysztoń-Russjan, J. (2025). Early Changes in the Plasma Lipidome of People at Very High Cardiovascular Risk: A New Approach to Assessing the Risk of Cardiovascular Changes. Biomedicines, 13(3), 643. https://doi.org/10.3390/biomedicines13030643