
Compensated Advanced Chronic Liver Disease and Steatosis in Patients with Type 2 Diabetes as Assessed through Shear Wave Measurements and Attenuation Measurements
 , ,
, ,  , , ,
, , , 
Abstract
1. Introduction
2. Materials and Methods
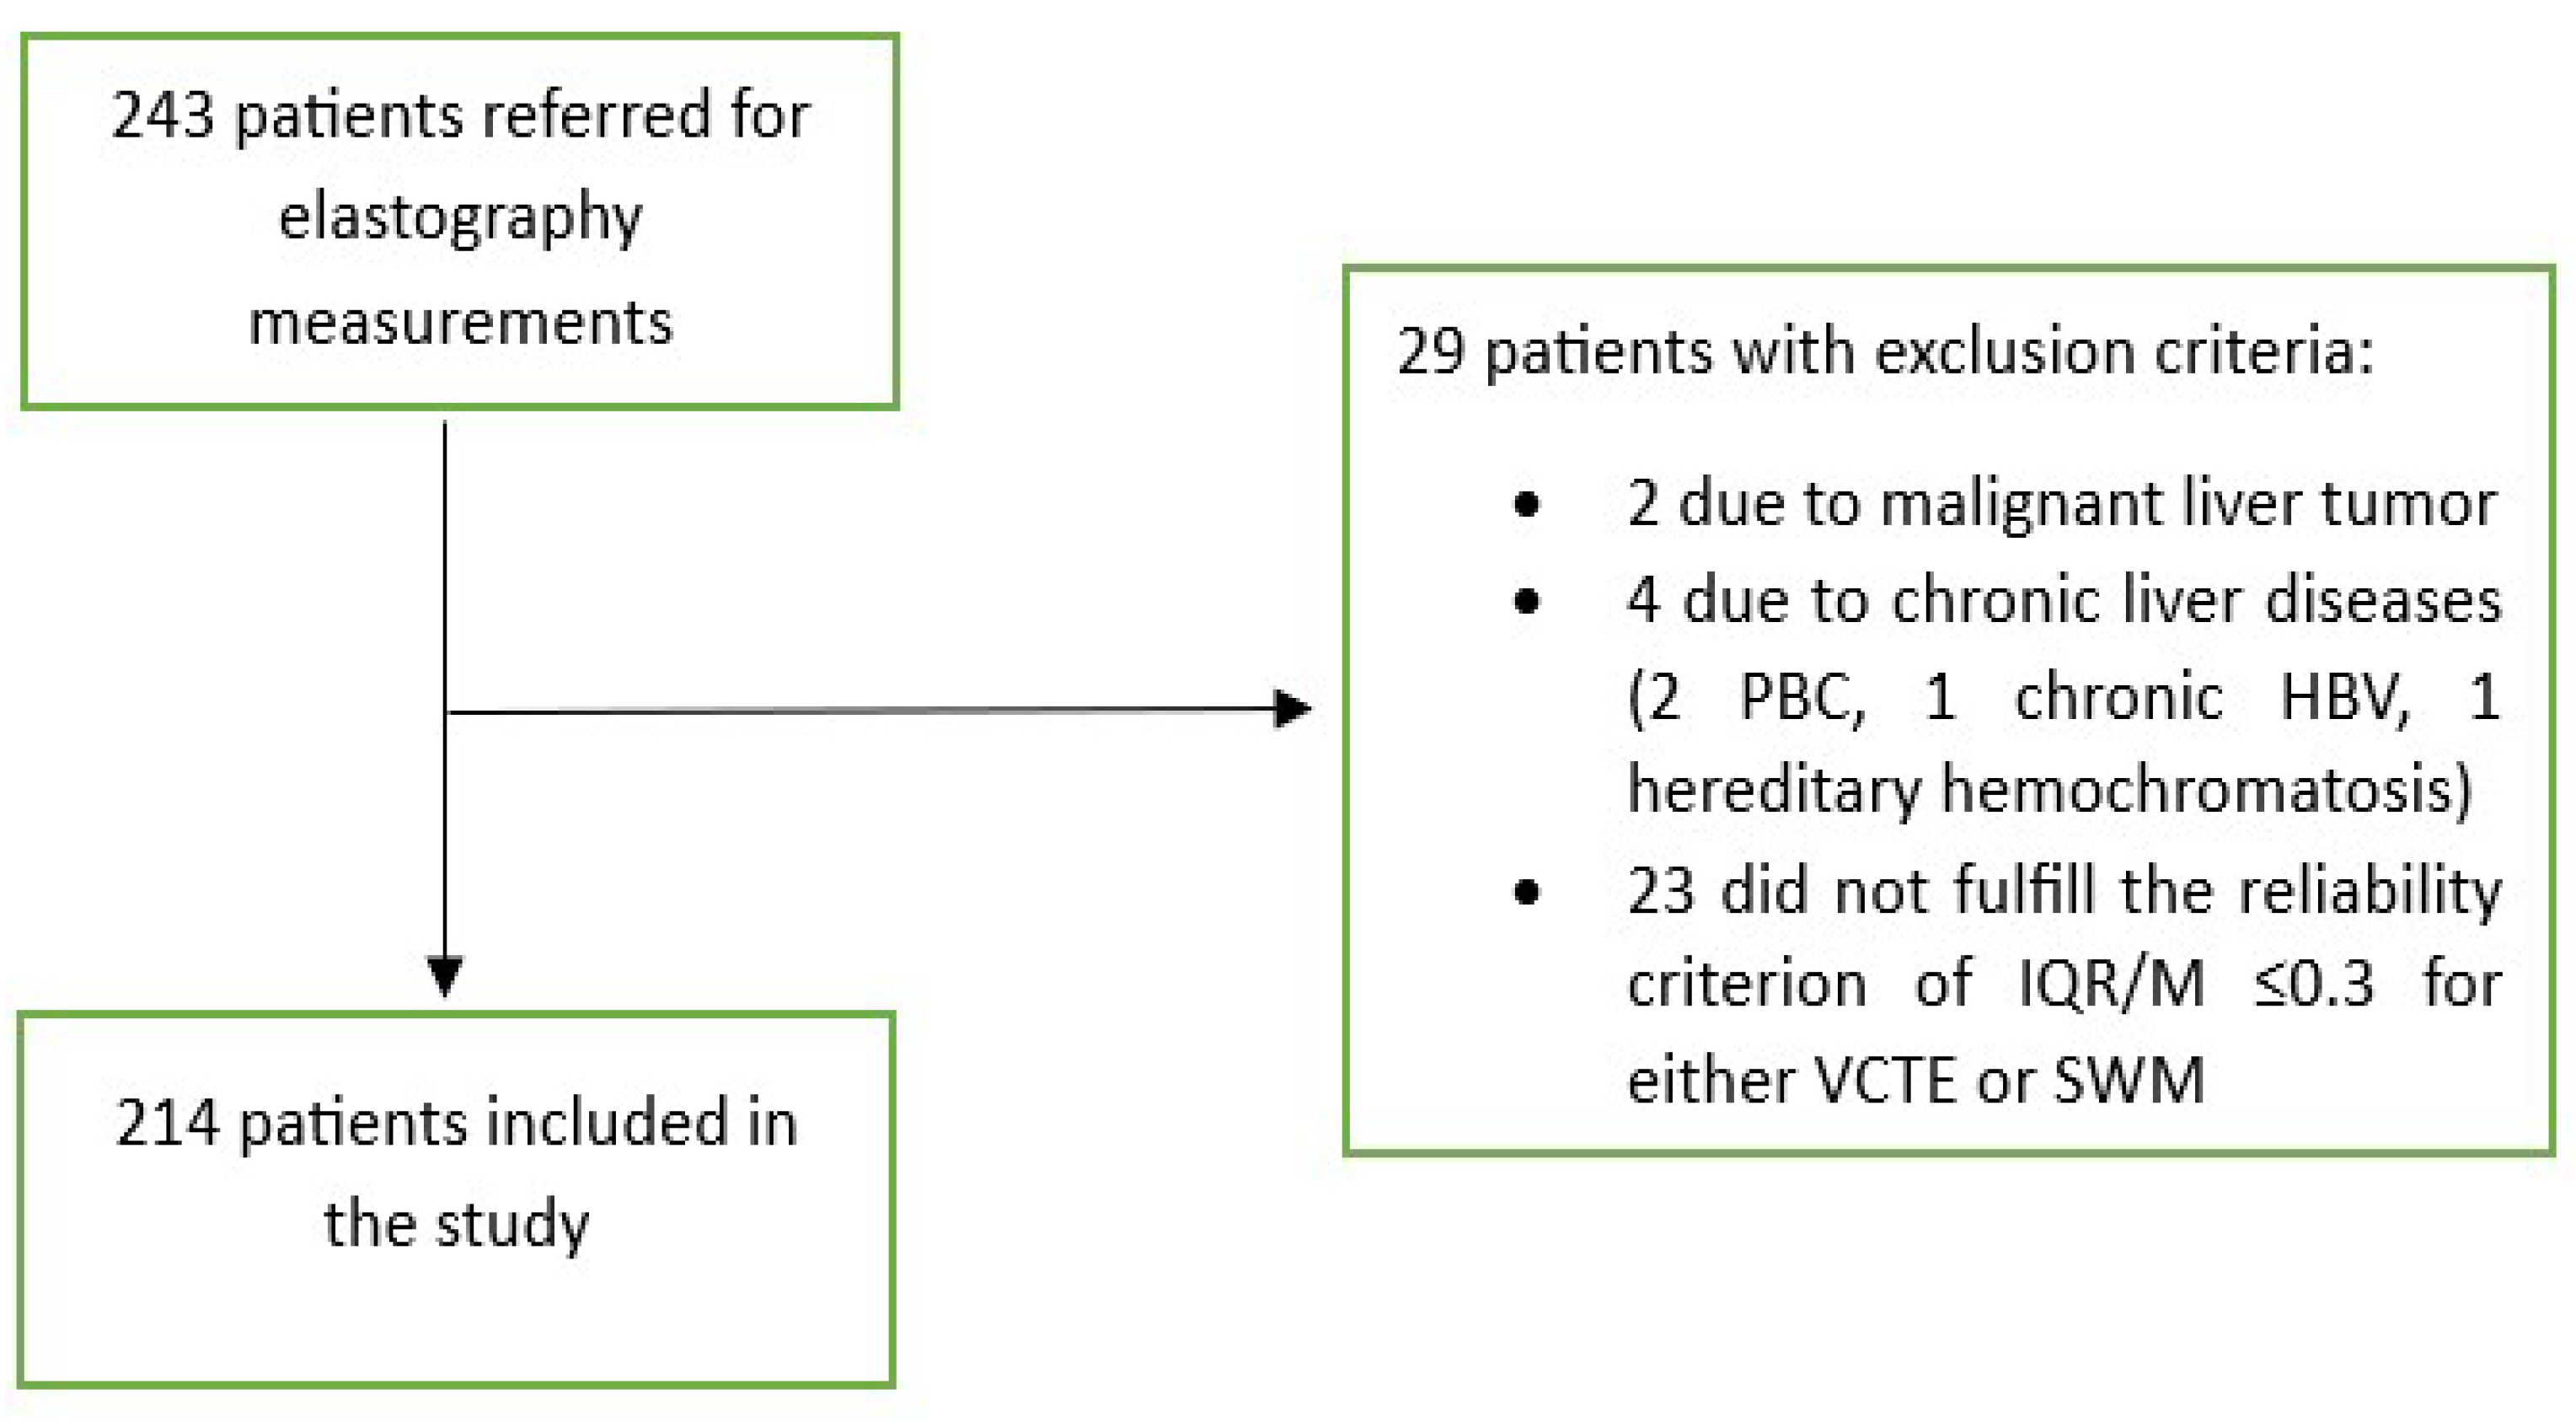
2.1. Patients
2.2. Methods
2.3. Statistical Analysis
2.4. Ethical Issues
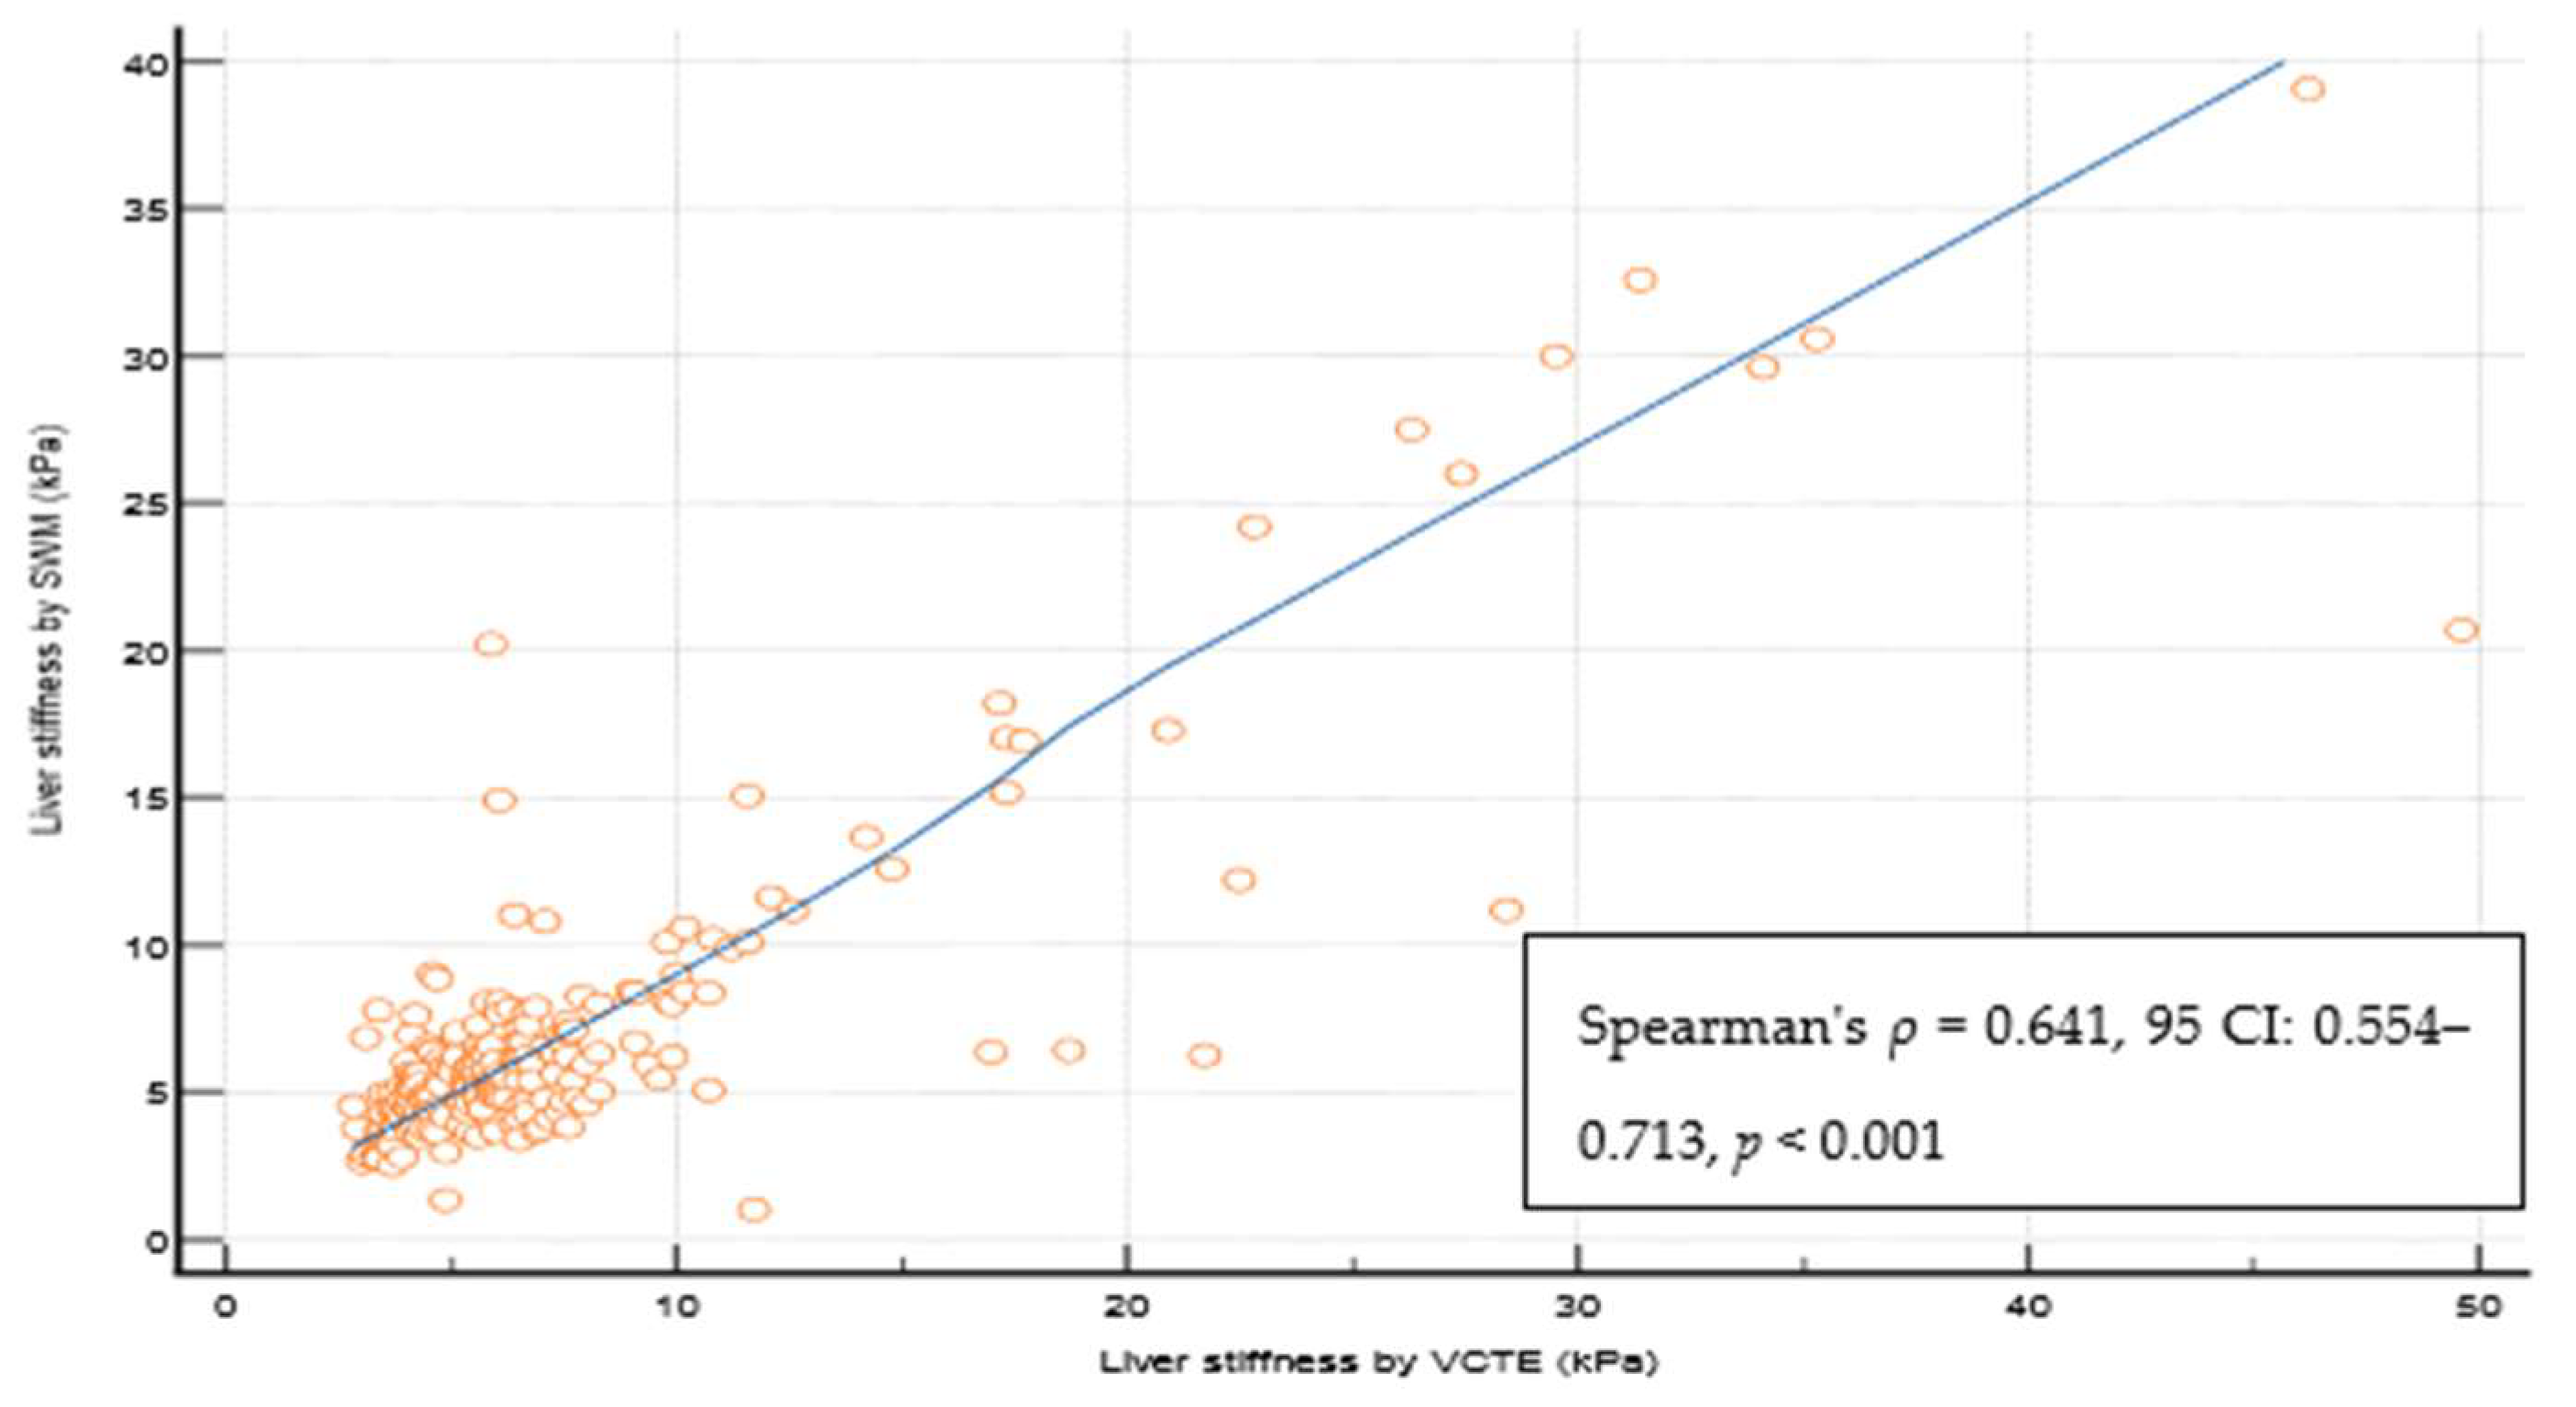
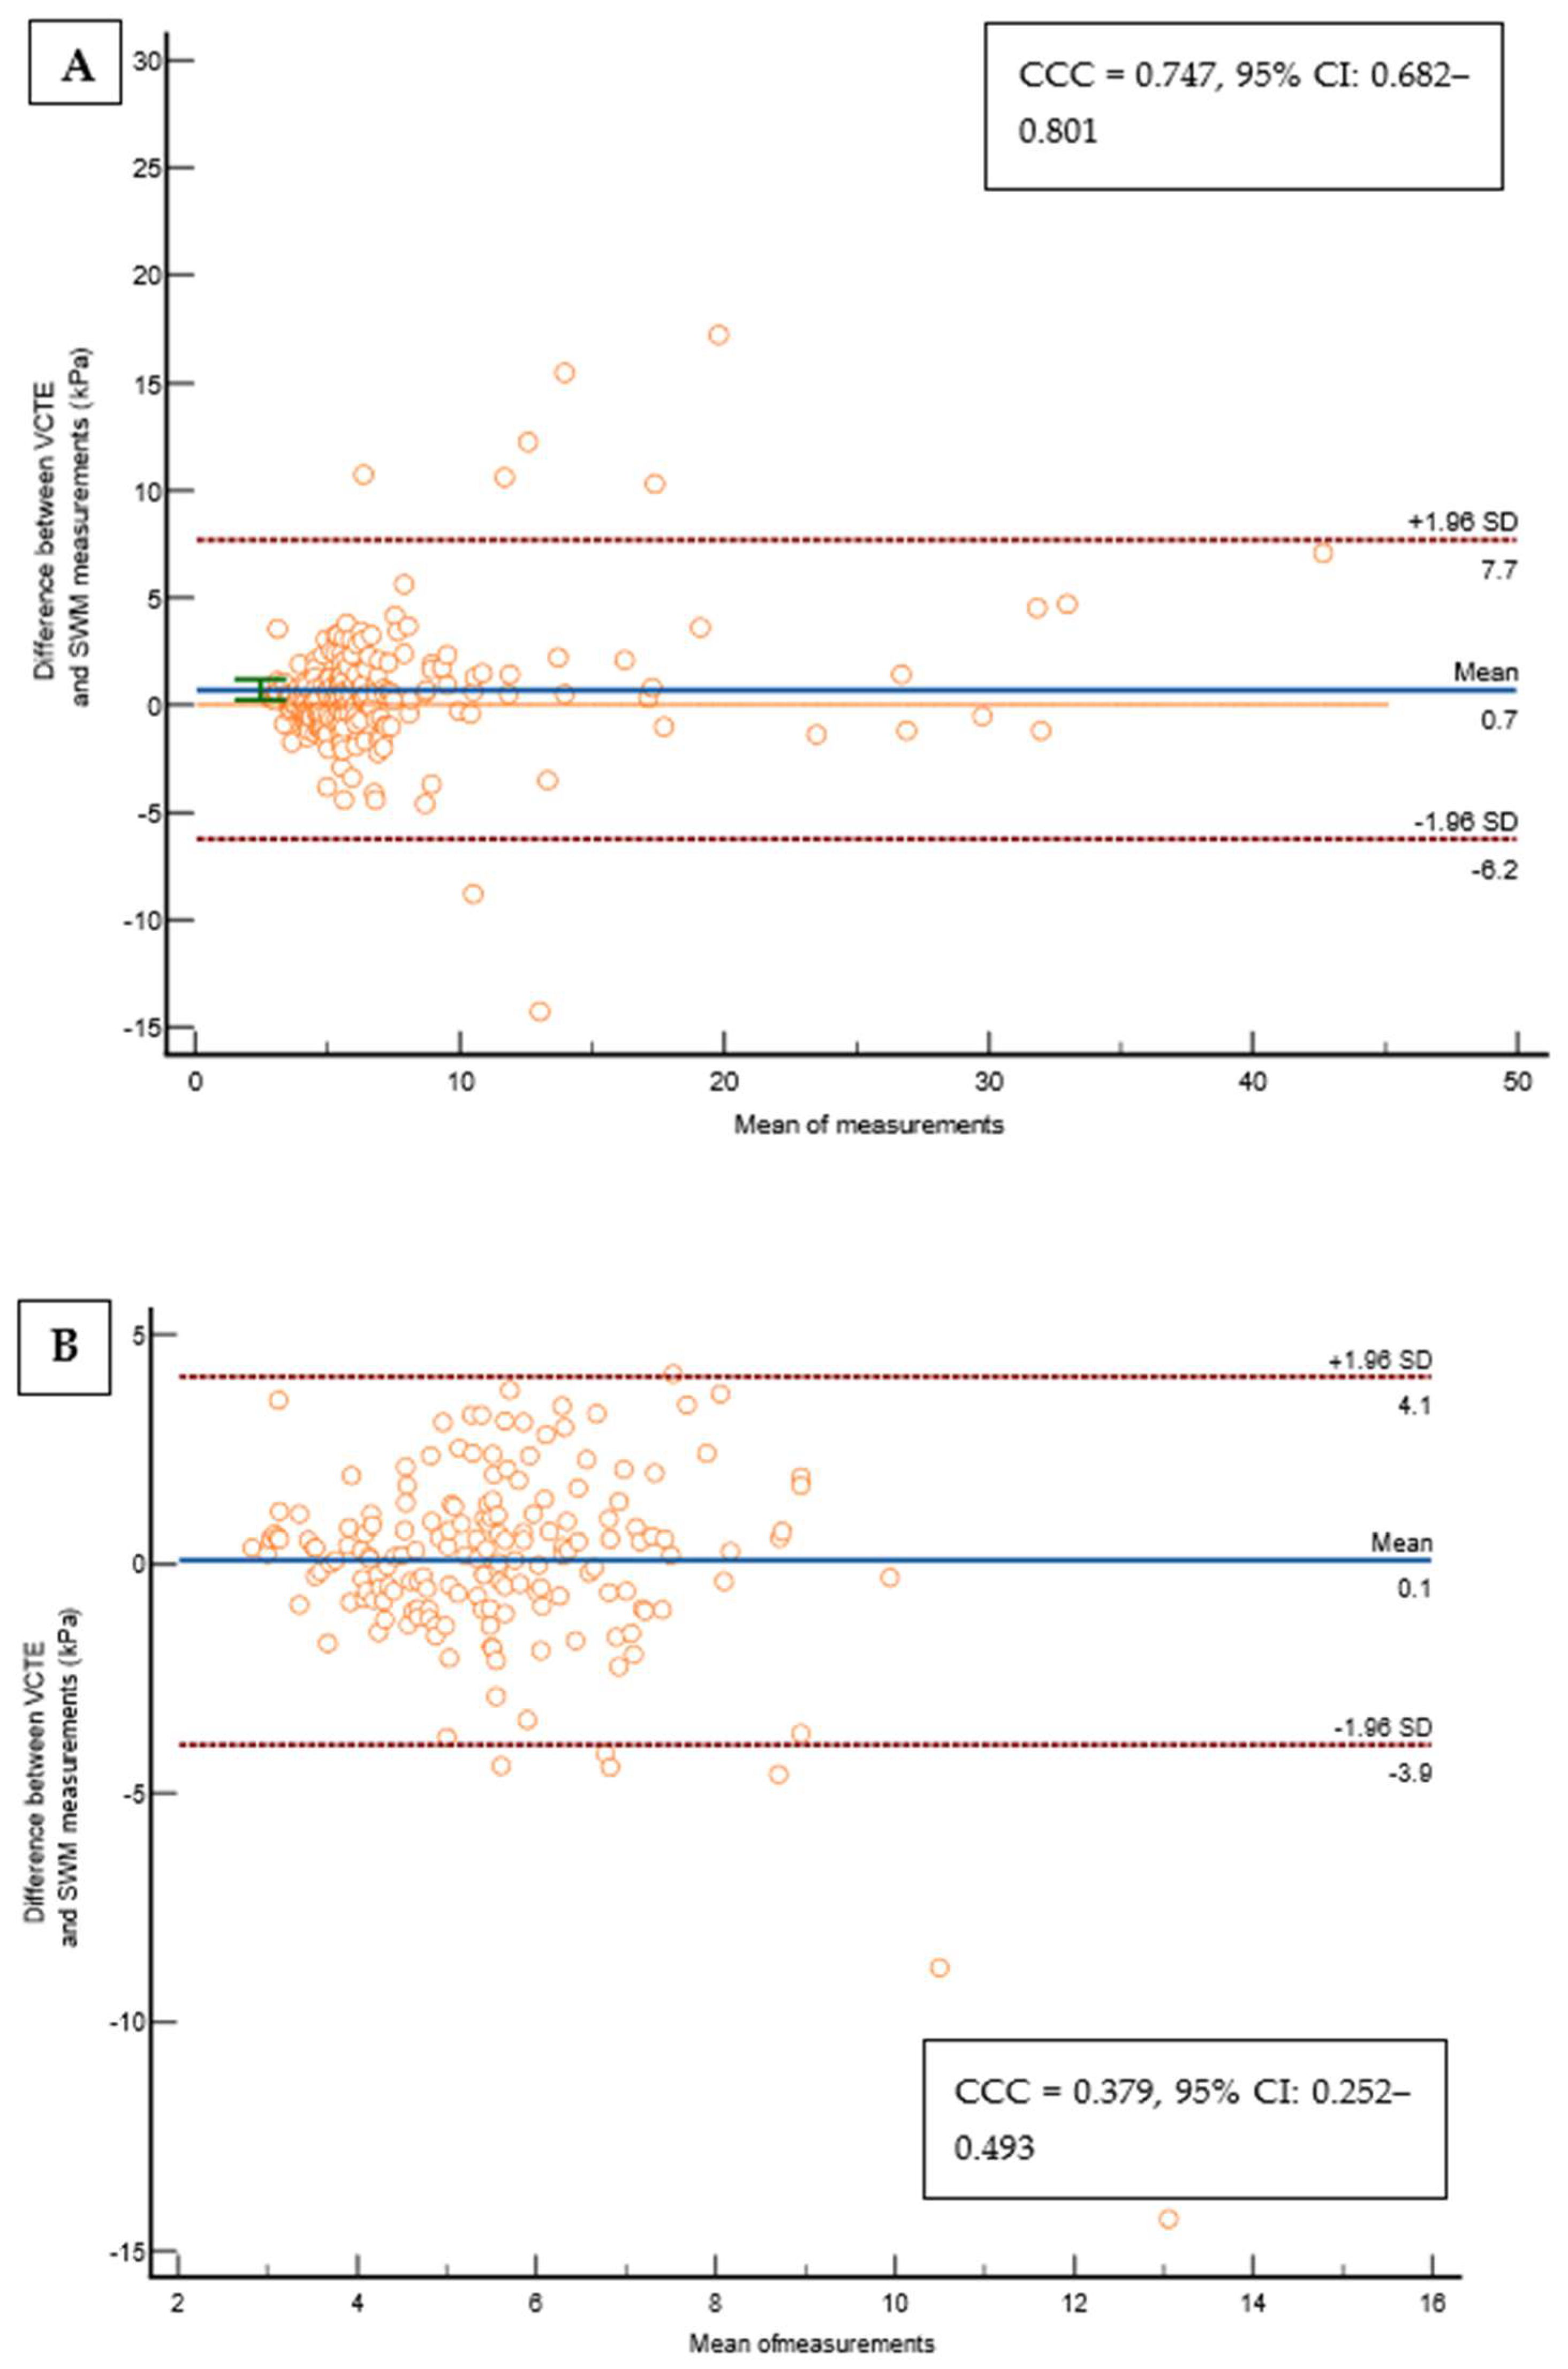
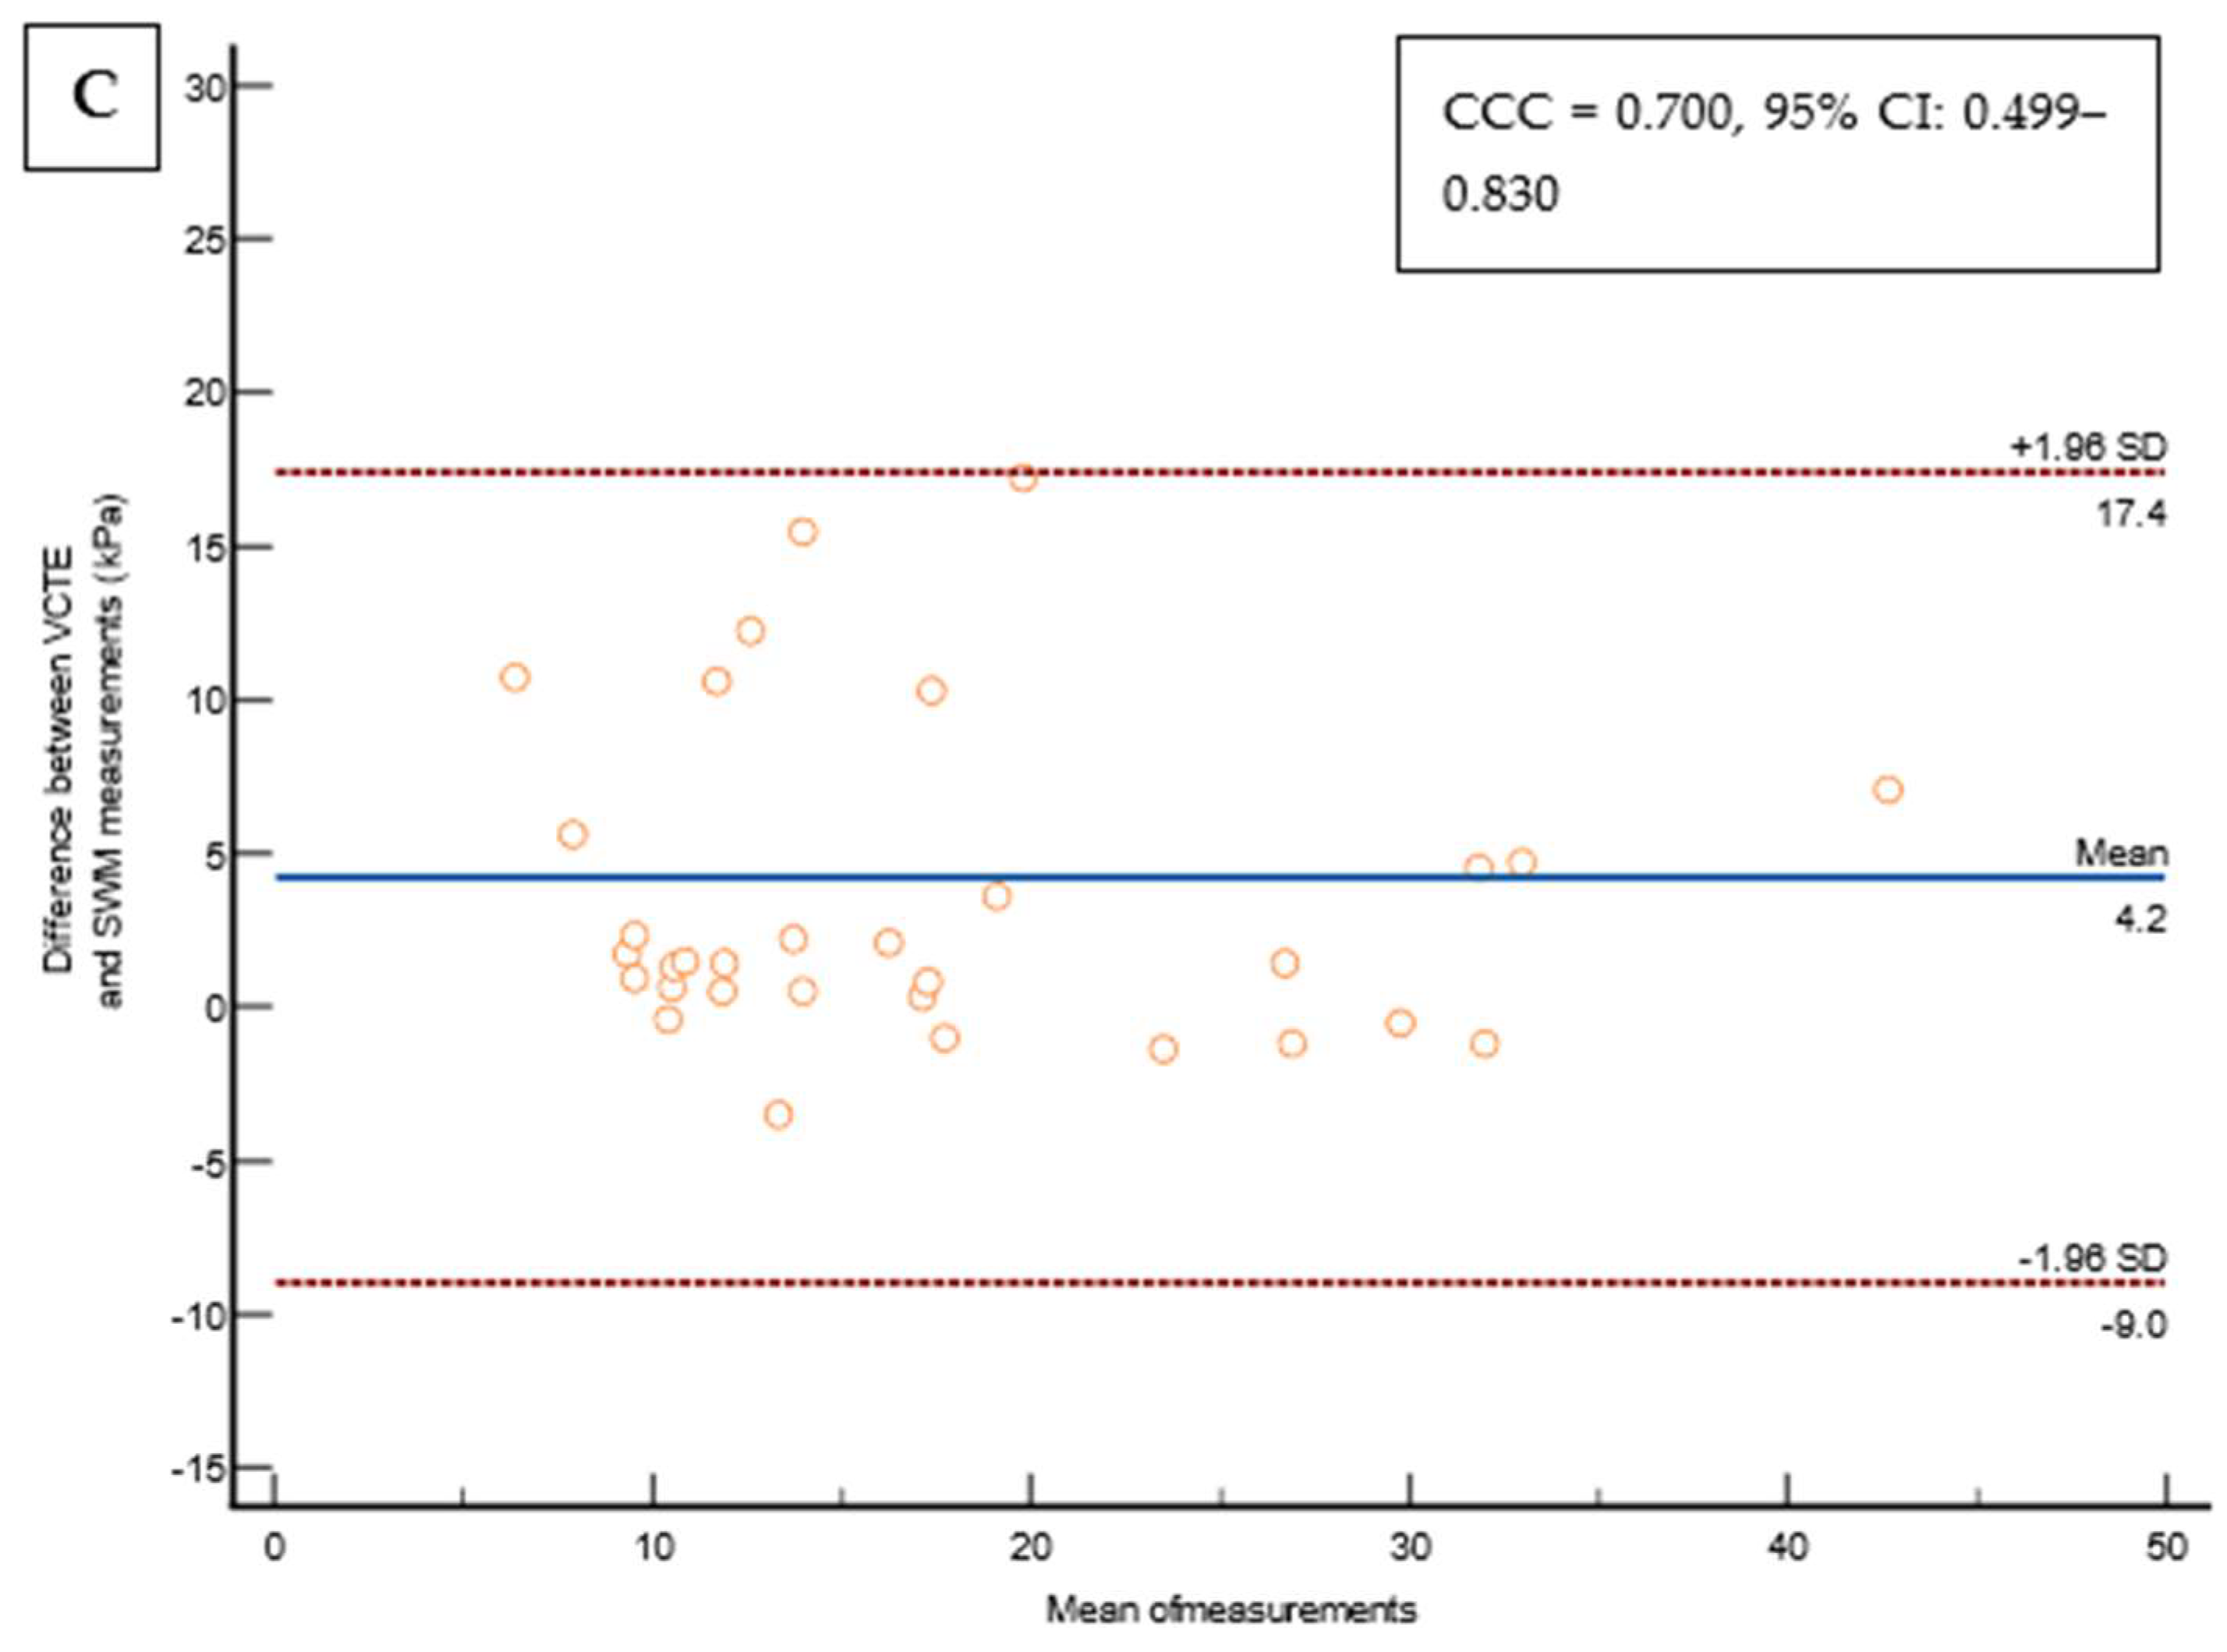
3. Results
4. Discussion
Supplementary Materials
Author Contributions
Funding
Institutional Review Board Statement
Informed Consent Statement
Data Availability Statement
Acknowledgments
Conflicts of Interest
References
- Zimmet, P.; Alberti, K.G.M.M.; Shaw, J. Global and Societal Implications of the Diabetes Epidemic. Nature 2001, 414, 782–787. [Google Scholar] [CrossRef]
- Fowler, M.J. Microvascular and Macrovascular Complications of Diabetes. Clin. Diabetes 2008, 26, 77–82. [Google Scholar] [CrossRef]
- Riazi, K.; Azhari, H.; Charette, J.H.; Underwood, F.E.; King, J.A.; Afshar, E.E.; Swain, M.G.; E Congly, S.; Kaplan, G.G.; Shaheen, A.-A. The Prevalence and Incidence of NAFLD Worldwide: A Systematic Review and Meta-Analysis. Lancet Gastroenterol. Hepatol. 2022, 7, 851–861. [Google Scholar] [CrossRef]
- Younossi, Z.M.; Koenig, A.B.; Abdelatif, D.; Fazel, Y.; Henry, L.; Wymer, M. Global Epidemiology of Nonalcoholic Fatty Liver Disease—Meta-analytic Assessment of Prevalence, Incidence, and Outcomes. Hepatology 2016, 64, 73–84. [Google Scholar] [CrossRef] [PubMed]
- Le, M.H.; Yeo, Y.H.; Zou, B.; Barnet, S.; Henry, L.; Cheung, R.; Nguyen, M.H. Forecasted 2040 Global Prevalence of Nonalcoholic Fatty Liver Disease Using Hierarchical Bayesian Approach. Clin. Mol. Hepatol. 2022, 28, 841–850. [Google Scholar] [CrossRef] [PubMed]
- Loomba, R.; Sanyal, A.J. The Global NAFLD Epidemic. Nat. Rev. Gastroenterol. Hepatol. 2013, 10, 686–690. [Google Scholar] [CrossRef] [PubMed]
- Younossi, Z.M.; Henry, L. Fatty Liver through the Ages: Nonalcoholic Steatohepatitis. Endocr. Pract. 2022, 28, 204–213. [Google Scholar] [CrossRef] [PubMed]
- Pimpin, L.; Cortez-Pinto, H.; Negro, F.; Corbould, E.; Lazarus, J.V.; Webber, L.; Sheron, N.; EASL HEPAHEALTH Steering Committee. Burden of Liver Disease in Europe: Epidemiology and Analysis of Risk Factors to Identify Prevention Policies. J. Hepatol. 2018, 69, 718–735. [Google Scholar] [CrossRef] [PubMed]
- Angulo, P.; Kleiner, D.E.; Dam-Larsen, S.; Adams, L.A.; Bjornsson, E.S.; Charatcharoenwitthaya, P.; Mills, P.R.; Keach, J.C.; Lafferty, H.D.; Stahler, A.; et al. Liver Fibrosis, but No Other Histologic Features, Is Associated with Long-Term Outcomes of Patients with Nonalcoholic Fatty Liver Disease. Gastroenterology 2015, 149, 389–397.e10. [Google Scholar] [CrossRef]
- Lee, H.W.; Wong, G.L.; Kwok, R.; Choi, K.C.; Chan, C.K.; Shu, S.S.; Leung, J.K.; Chim, A.M.; Luk, A.O.; Ma, R.C.; et al. Serial Transient Elastography Examinations to Monitor Patients with Type 2 Diabetes: A Prospective Cohort Study. Hepatology 2020, 72, 1230–1241. [Google Scholar] [CrossRef]
- Abeysekera, K.W.M.; Valenti, L.; Younossi, Z.; Dillon, J.F.; Allen, A.M.; Nourredin, M.; E Rinella, M.; Tacke, F.; Francque, S.; Ginès, P.; et al. Implementation of a Liver Health Check in People with Type 2 Diabetes. Lancet Gastroenterol. Hepatol. 2024, 9, 83–91. [Google Scholar] [CrossRef] [PubMed]
- Sumida, Y. Limitations of Liver Biopsy and Non-Invasive Diagnostic Tests for the Diagnosis of Nonalcoholic Fatty Liver Disease/Nonalcoholic Steatohepatitis. World J. Gastroenterol. 2014, 20, 475. [Google Scholar] [CrossRef] [PubMed]
- Ferraioli, G.; Wong, V.W.-S.; Castera, L.; Berzigotti, A.; Sporea, I.; Dietrich, C.F.; Choi, B.I.; Wilson, S.R.; Kudo, M.; Barr, R.G. Liver Ultrasound Elastography: An Update to the World Federation for Ultrasound in Medicine and Biology Guidelines and Recommendations. Ultrasound Med. Biol. 2018, 44, 2419–2440. [Google Scholar] [CrossRef] [PubMed]
- Myers, R.P.; Pomier-Layrargues, G.; Kirsch, R.; Pollett, A.; Duarte-Rojo, A.; Wong, D.; Beaton, M.; Levstik, M.; Crotty, P.; Elkashab, M. Feasibility and Diagnostic Performance of the FibroScan XL Probe for Liver Stiffness Measurement in Overweight and Obese Patients. Hepatology 2012, 55, 199–208. [Google Scholar] [CrossRef] [PubMed]
- Pu, K.; Wang, Y.; Bai, S.; Wei, H.; Zhou, Y.; Fan, J.; Qiao, L. Diagnostic Accuracy of Controlled Attenuation Parameter (CAP) as a Non-Invasive Test for Steatosis in Suspected Non-Alcoholic Fatty Liver Disease: A Systematic Review and Meta-Analysis. BMC Gastroenterol. 2019, 19, 51. [Google Scholar] [CrossRef] [PubMed]
- Barr, R.G.; Wilson, S.R.; Rubens, D.; Garcia-Tsao, G.; Ferraioli, G. Update to the Society of Radiologists in Ultrasound Liver Elastography Consensus Statement. Radiology 2020, 296, 263–274. [Google Scholar] [CrossRef] [PubMed]
- Bauer, D.J.; Matic, V.; Mare, R.; Maiocchi, L.; Chromy, D.; Müllner-Bucsics, T.; Mandorfer, M.; Mustapic, S.; Sporea, I.; Ferraioli, G.; et al. Point Shear Wave Elastography by ElastPQ for Fibrosis Screening in Patients with NAFLD: A Prospective, Multicenter Comparison to Vibration-Controlled Elastography. Ultraschall Der Med.-Eur. J. Ultrasound 2023, 44, 169–178. [Google Scholar] [CrossRef]
- Koizumi, Y.; Hirooka, M.; Tamaki, N.; Yada, N.; Nakashima, O.; Izumi, N.; Kudo, M.; Hiasa, Y. New Diagnostic Technique to Evaluate Hepatic Steatosis Using the Attenuation Coefficient on Ultrasound B Mode. PLoS ONE 2019, 14, e0221548. [Google Scholar] [CrossRef] [PubMed]
- Dietrich, C.; Bamber, J.; Berzigotti, A.; Bota, S.; Cantisani, V.; Castera, L.; Cosgrove, D.; Ferraioli, G.; Friedrich-Rust, M.; Gilja, O.H.; et al. EFSUMB Guidelines and Recommendations on the Clinical Use of Liver Ultrasound Elastography, Update 2017 (Long Version). Ultraschall Med.-Eur. J. Ultrasound 2017, 38, e48. [Google Scholar] [CrossRef]
- de Franchis, R.; Bosch, J.; Garcia-Tsao, G.; Reiberger, T.; Ripoll, C.; Abraldes, J.G.; Albillos, A.; Baiges, A.; Bajaj, J.; Bañares, R.; et al. Baveno VII—Renewing Consensus in Portal Hypertension. J. Hepatol. 2022, 76, 959–974. [Google Scholar] [CrossRef]
- Eddowes, P.J.; Sasso, M.; Allison, M.; Tsochatzis, E.; Anstee, Q.M.; Sheridan, D.; Guha, I.N.; Cobbold, J.F.; Deeks, J.J.; Paradis, V.; et al. Accuracy of FibroScan Controlled Attenuation Parameter and Liver Stiffness Measurement in Assessing Steatosis and Fibrosis in Patients with Nonalcoholic Fatty Liver Disease. Gastroenterology 2019, 156, 1717–1730. [Google Scholar] [CrossRef] [PubMed]
- Petroff, D.; Blank, V.; Newsome, P.N.; Shalimar; Voican, C.S.; Thiele, M.; de Lédinghen, V.; Baumeler, S.; Chan, W.K.; Perlemuter, G.; et al. Assessment of Hepatic Steatosis by Controlled Attenuation Parameter Using the M and XL Probes: An Individual Patient Data Meta-Analysis. Lancet Gastroenterol. Hepatol. 2021, 6, 185–198. [Google Scholar] [CrossRef] [PubMed]
- Rinella, M.E.; Lazarus, J.V.; Ratziu, V.; Francque, S.M.; Sanyal, A.J.; Kanwal, F.; Romero, D.; Abdelmalek, M.F.; Anstee, Q.M.; Arab, J.P.; et al. A Multisociety Delphi Consensus Statement on New Fatty Liver Disease Nomenclature. Hepatology 2023, 78, 1966–1986. [Google Scholar] [CrossRef]
- Sterling, R.K.; Lissen, E.; Clumeck, N.; Sola, R.; Correa, M.C.; Montaner, J.; Sulkowski, M.S.; Torriani, F.J.; Dieterich, D.T.; Thomas, D.L.; et al. Development of a Simple Noninvasive Index to Predict Significant Fibrosis in Patients with HIV/HCV Coinfection. Hepatology 2006, 43, 1317–1325. [Google Scholar] [CrossRef] [PubMed]
- Shah, A.G.; Lydecker, A.; Murray, K.; Tetri, B.N.; Contos, M.J.; Sanyal, A.J. Comparison of Noninvasive Markers of Fibrosis in Patients with Nonalcoholic Fatty Liver Disease. Clin. Gastroenterol. Hepatol. 2009, 7, 1104–1112. [Google Scholar] [CrossRef] [PubMed]
- Wai, C. A Simple Noninvasive Index Can Predict Both Significant Fibrosis and Cirrhosis in Patients with Chronic Hepatitis C. Hepatology 2003, 38, 518–526. [Google Scholar] [CrossRef] [PubMed]
- Youden, W.J. Index for Rating Diagnostic Tests. Cancer 1950, 3, 32–35. [Google Scholar] [CrossRef] [PubMed]
- McPherson, S.; Hardy, T.; Henderson, E.; Burt, A.D.; Day, C.P.; Anstee, Q.M. Evidence of NAFLD Progression from Steatosis to Fibrosing-Steatohepatitis Using Paired Biopsies: Implications for Prognosis and Clinical Management. J. Hepatol. 2015, 62, 1148–1155. [Google Scholar] [CrossRef]
- Armstrong, M.J.; Adams, L.A.; Canbay, A.; Syn, W.-K. Extrahepatic Complications of Nonalcoholic Fatty Liver Disease. Hepatology 2014, 59, 1174–1197. [Google Scholar] [CrossRef]
- Kashanian, S.; Fuchs, M. Non-Alcoholic Fatty Liver Disease in Patients with Diabetes Mellitus: A Clinician’s Perspective. Int. J. Dig. Dis. 2015, 1, 1–9. [Google Scholar] [CrossRef]
- Adams, L.A.; Harmsen, S.; St. Sauver, J.L.; Charatcharoenwitthaya, P.; Enders, F.B.; Therneau, T.; Angulo, P. Nonalcoholic Fatty Liver Disease Increases Risk of Death among Patients with Diabetes: A Community-Based Cohort Study. Am. J. Gastroenterol. 2010, 105, 1567–1573. [Google Scholar] [CrossRef] [PubMed]
- Ginès, P.; Castera, L.; Lammert, F.; Graupera, I.; Serra-Burriel, M.; Allen, A.M.; Wong, V.W.; Hartmann, P.; Thiele, M.; Caballeria, L.; et al. Population Screening for Liver Fibrosis: Toward Early Diagnosis and Intervention for Chronic Liver Diseases. Hepatology 2022, 75, 219–228. [Google Scholar] [CrossRef] [PubMed]
- Serra-Burriel, M.; Juanola, A.; Serra-Burriel, F.; Thiele, M.; Graupera, I.; Pose, E.; Pera, G.; Grgurevic, I.; Caballeria, L.; Piano, S.; et al. Development, Validation, and Prognostic Evaluation of a Risk Score for Long-Term Liver-Related Outcomes in the General Population: A Multicohort Study. Lancet 2023, 402, 988–996. [Google Scholar] [CrossRef]
- Kwok, R.; Choi, K.C.; Wong, G.L.-H.; Zhang, Y.; Chan, H.L.-Y.; Luk, A.O.-Y.; Shu, S.S.-T.; Chan, A.W.-H.; Yeung, M.-W.; Chan, J.C.-N.; et al. Screening Diabetic Patients for Non-Alcoholic Fatty Liver Disease with Controlled Attenuation Parameter and Liver Stiffness Measurements: A Prospective Cohort Study. Gut 2016, 65, 1359–1368. [Google Scholar] [CrossRef] [PubMed]
- Castéra, L.; Foucher, J.; Bernard, P.-H.; Carvalho, F.; Allaix, D.; Merrouche, W.; Couzigou, P.; de Lédinghen, V. Pitfalls of Liver Stiffness Measurement: A 5-Year Prospective Study of 13,369 Examinations. Hepatology 2010, 51, 828–835. [Google Scholar] [CrossRef]
- Degos, F.; Perez, P.; Roche, B.; Mahmoudi, A.; Asselineau, J.; Voitot, H.; Bedossa, P. Diagnostic Accuracy of FibroScan and Comparison to Liver Fibrosis Biomarkers in Chronic Viral Hepatitis: A Multicenter Prospective Study (the FIBROSTIC Study). J. Hepatol. 2010, 53, 1013–1021. [Google Scholar] [CrossRef]
- Ferraioli, G.; Maiocchi, L.; Lissandrin, R.; Tinelli, C.; De Silvestri, A.; Filice, C. Ruling-in and Ruling-out Significant Fibrosis and Cirrhosis in Patients with Chronic Hepatitis C Using a Shear Wave Measurement Method. J. Gastrointest. Liver Dis. 2017, 26, 139–143. [Google Scholar] [CrossRef]
- Tamaki, N.; Koizumi, Y.; Hirooka, M.; Yada, N.; Takada, H.; Nakashima, O.; Kudo, M.; Hiasa, Y.; Izumi, N. Novel Quantitative Assessment System of Liver Steatosis Using a Newly Developed Attenuation Measurement Method. Hepatol. Res. 2018, 48, 821–828. [Google Scholar] [CrossRef]
- Karagiannakis, D.S.; Markakis, G.; Lakiotaki, D.; Cholongitas, E.; Vlachogiannakos, J.; Papatheodoridis, G. Comparing 2D-Shear Wave to Transient Elastography for the Evaluation of Liver Fibrosis in Nonalcoholic Fatty Liver Disease. Eur. J. Gastroenterol. Hepatol. 2022, 34, 961–966. [Google Scholar] [CrossRef]
- Grgurevic, I.; Salkic, N.; Bozin, T.; Mustapic, S.; Matic, V.; Dumic-Cule, I.; Drinkovic, I.T.; Bokun, T. Magnitude Dependent Discordance in Liver Stiffness Measurements Using Elastography Point Quantification with Transient Elastography as the Reference Test. Eur. Radiol. 2019, 29, 2448–2456. [Google Scholar] [CrossRef] [PubMed]
- Tamaki, N.; Kurosaki, M.; Yasui, Y.; Tsuchiya, K.; Izumi, N. Attenuation Coefficient (ATT) Measurement for Liver Fat Quantification in Chronic Liver Disease. J. Med. Ultrason. 2021, 48, 481–487. [Google Scholar] [CrossRef] [PubMed]

| All Patients N = 214 (100%) | VCTE < 10 kPa N= 181 (84.6%) | VCTE 10–15 kPa N= 14 (6.5%) | VCTE > 15 kPa N= 19 (8.9%) | p Value | |
|---|---|---|---|---|---|
| Age, years, median [IQR] | 66 [56–71] | 66 [57.8–71] | 63 [57–66] | 67 [56–71.5] | 0.42 |
| Sex 1—male 2—female | 112 (52.3%) 102 (47.7%) | 91 (50.3%) 90 (49.7%) | 12 (85.7%) 2 (14.3%) | 9 (47.4%) 10 (52.6%) | 0.03 |
| BMI, kg/m 2, median [IQR] | 30.8 [27.8–35.4] | 30.6 [27.8–35.9] | 33.1 [28.7–34.9] | 29.9 [26.6–32] | 0.45 |
| Obesity (BMI > 30 kg/m 2) Yes No | 122 (57.5%) 90 (42.5%) | 103 (57.2%) 77 (42.8%) | 10 (71.4%) 4 (28.6%) | 9 (50%) 9 (50%) | 0.46 |
| Arterial hypertension Yes No | 165 (78.6%) 45 (21.4%) | 140 (79.1%) 37 (20.9%) | 8 (57.1%) 6 (42.9%) | 17 (89.5%) 2 (10.5%) | 0.07 |
| Hyperlipidemia Yes No | 159 (75.7%) 51 (24.3%) | 133 (75.1%) 44 (24.9%) | 12 (85.7%) 2 (14.3%) | 14 (73.7%) 5 (26.2%) | 0.66 |
| Probe used M XL | 146 (68.5%) 67 (31.5%) | 122 (67.8%) 58 (32.2%) | 9 (64.3% 5 (35.7%) | 15 (78.9%) 4 (21.1%) | 0.57 |
| Smoking Yes No | 49 (23%) 164 (77%) | 38 (21.1%) 142 (78.9%) | 5 (35.7%) 9 (64.3%) | 6 (31.6%) 13 (68.4%) | 0.29 |
| Hematocrit, median [IQR] | 0.426 [0.404–0.455] | 0.425 [0.404–0.452] | 0.464 [0.399–0.478] | 0.435 [0.402–0.442] | 0.29 |
| Red cell count, G/L, median [IQR] | 4.8 [4.5–5.1] | 4.8 [4.5–5.1] | 4.7 [4.6–5.2] | 4.6 [4.3–4.9] | 0.09 |
| Platelets, G/L, median [IQR] | 230 [196–276] | 237 [207–279] | 204 [180–229] | 167 [142–193] | <0.001 |
| PT (%), median [IQR] | 102 [87–109] | 103 [94–110] | 102 [86–111] | 87 [83–100] | 0.03 |
| Glucose, mmol/L, median [IQR] | 7.8 [6.8–9.5] | 7.8 [6.9–9.4] | 7 [6.1–8] | 8.3 [7.4–11.1] | 0.06 |
| HbA1c (%), median [IQR] | 6.9 [6.3–7.8] | 6.9 [6.3–7.9] | 6.1 [5.9–6.9] | 7.1 [6.6–7.8] | 0.04 |
| Creatinine, µmol/L, median [IQR] | 78 [66–89] | 79 [67–92] | 75 [65–85] | 72 [63–82] | 0.17 |
| AST, U/L, median [IQR] | 23 [19–31] | 22 [18–29] | 34 [23–44] | 49 [35–58] | <0.001 |
| ALT, U/L, median [IQR] | 25 [20–41] | 24 [20–36] | 31 [24–58] | 53 [33–82] | <0.001 |
| GGT, U/L, median [IQR] | 29 [19–65] | 28 [18–49] | 82 [31–132] | 65 [48–93] | <0.001 |
| ALP, U/L, median [IQR] | 69 [56–87] | 68 [56–83] | 78 [60–90] | 83 [59–96] | 0.27 |
| Total cholesterol, mmol/L, median [IQR] | 4.4 [3.7–5.4] | 4.4 [3.7–5.4] | 5 [3.9–5.3] | 5 [3.8–5.7] | 0.27 |
| Triglycerides, mmol/L, median [IQR] | 1.7 [1.2–2.4] | 1.7 [1.2–2.5] | 1.3 [1.1–1.6] | 1.5 [1.1–1.9] | 0.04 |
| HDL, mmol/L, median [IQR] | 1.2 [1–1.5] | 1.2 [1–1.4] | 1.3 [1.1–1.5] | 1.5 [1.3–1.7] | 0.02 |
| LDL, mmol/L, median [IQR] | 2.3 [1.8–3.1] | 2.2 [1.8–2.9] | 2.4 [2–3.6] | 2.7 [1.8–3.7] | 0.3 |
| Albumins, g/L, median [IQR] | 43 [41–46] | 43 [41–46] | 41 [38–43] | 44 [42–46] | 0.15 |
| CRP, mg/L, mmol/L, median [IQR] | 2.4 [1.3–4.5] | 2.2 [1.1–4.6] | 3.5 [2.7–4.4] | 3.2 [1.9–4.3] | 0.22 |
| NAFLD fibrosis score, points, median [IQR] | −0.214 [−0.258–0.029] | −0.175 [−0.258–0.03] | −0.219 [−0.246–0.03] | −0.238 [−0.263–0.02] | 0.53 |
| FIB-4, points, median [IQR] | 1.26 [0.91–1.65] | 1.14 [0.87–1.55] | 1.58 [1.37–2.21] | 2.69 [1.61–3.74] | <0.001 |
| APRI, points, median [IQR] | 0.25 [0.191–0.396] | 0.221 [0.183–0.32] | 0.409 [0.323–0.603] | 0.723 [0.55–0.861] | <0.001 |
| VCTE, kPa, median [IQR] | 5.9 [4.5–7.6] | 5.6 [4.3–6.5] | 11.4 [10.7–12.1] | 22.8 [17.9–30.9] | <0.001 |
| VCTE IQR/median, %, median [IQR] | 15 [10–20] | 14 [10–20] | 18 [10–24] | 17 [10–19] | 0.80 |
| SCD, cm, median [IQR] | 1.9 [1.7–2.4] | 1.9 [1.6–2.4] | 2.3 [1.8–2.6] | 1.9 [1.7–2.2] | 0.26 |
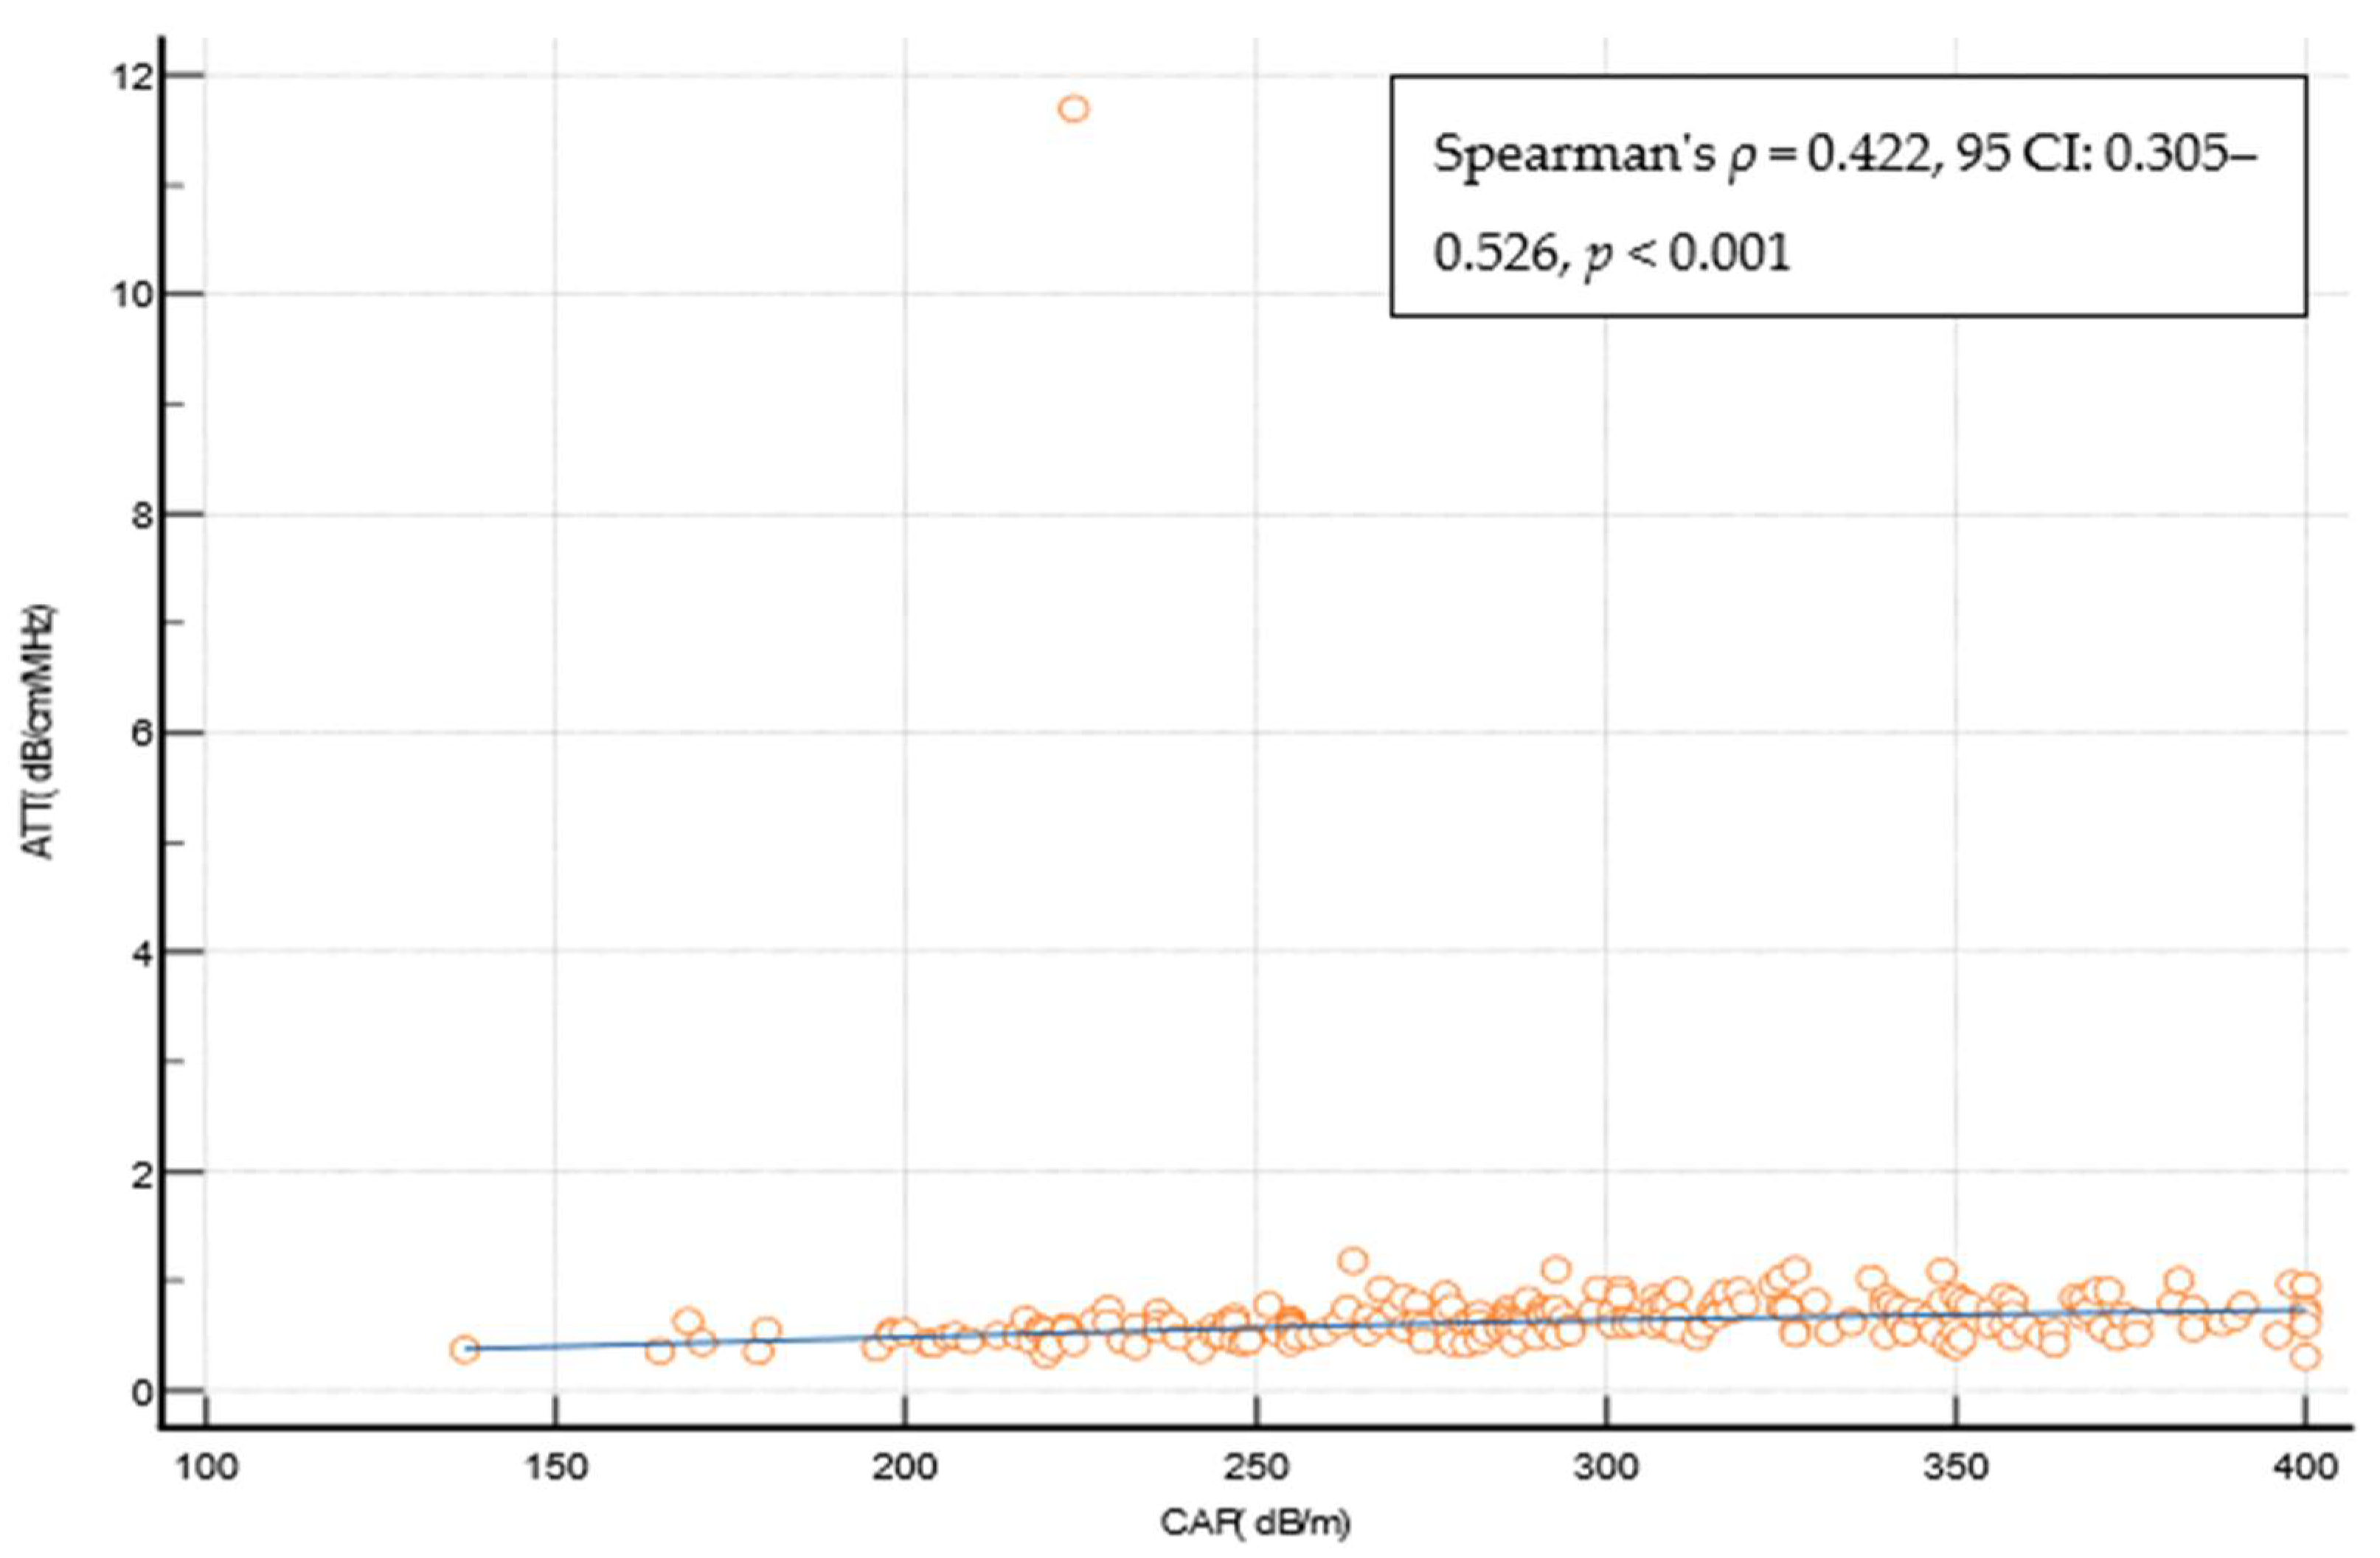
| CAP, dB/m, median [IQR] | 291 [253–341] | 291 [255–342] | 295 [274–340] | 278 [230–340] | 0.84 |
| SWM, kPa, median [IQR] | 5.5 [4.5–7.1] | 5.2 [4.4–6.3] | 10.1 [8.4–11.6] | 18.2 [12.9–29.1] | <0.001 |
| SWM-Vs, m/s, median [IQR] | 1.34 [1.21–1.5] | 1.32 [1.2–1.44] | 1.67 [1.51–1.8] | 1.59 [1.21–2.53] | <0.001 |
| ATT, dB/cm/MHz, median [IQR] | 0.61 [0.53–0.74] | 0.60 [0.52–0.72] | 0.73 [0.6–0.85] | 0.74 [0.45–0.81] | 0.03 |
| Stage | Cut-Off | AUROC | SWM Cut-Off, Stiffness (kPa) | Sensitivity, % | Specificity, % | +LR | −LR | PPV,% | NPV, % | Missed Cases |
|---|---|---|---|---|---|---|---|---|---|---|
| VCTE 5–9 kPa (cACLD excluded) | Youden | 0.798 (95%CI: 0.738–0.850) | >5.3 | 72.3 | 75.3 | 2.93 | 0.37 | 85 | 58.4 | 42/141 (29.7%) |
| Rule in | ≥6.4 | 44 | 90.4 | 4.59 | 0.62 | 89.9 | 45.5 | 79/141 (56%) | ||
| Rule out | ≤4.4 | 90.1 | 43.8 | 1.6 | 0.23 | 75.6 | 69.6 | 14/141 (9.9%) | ||
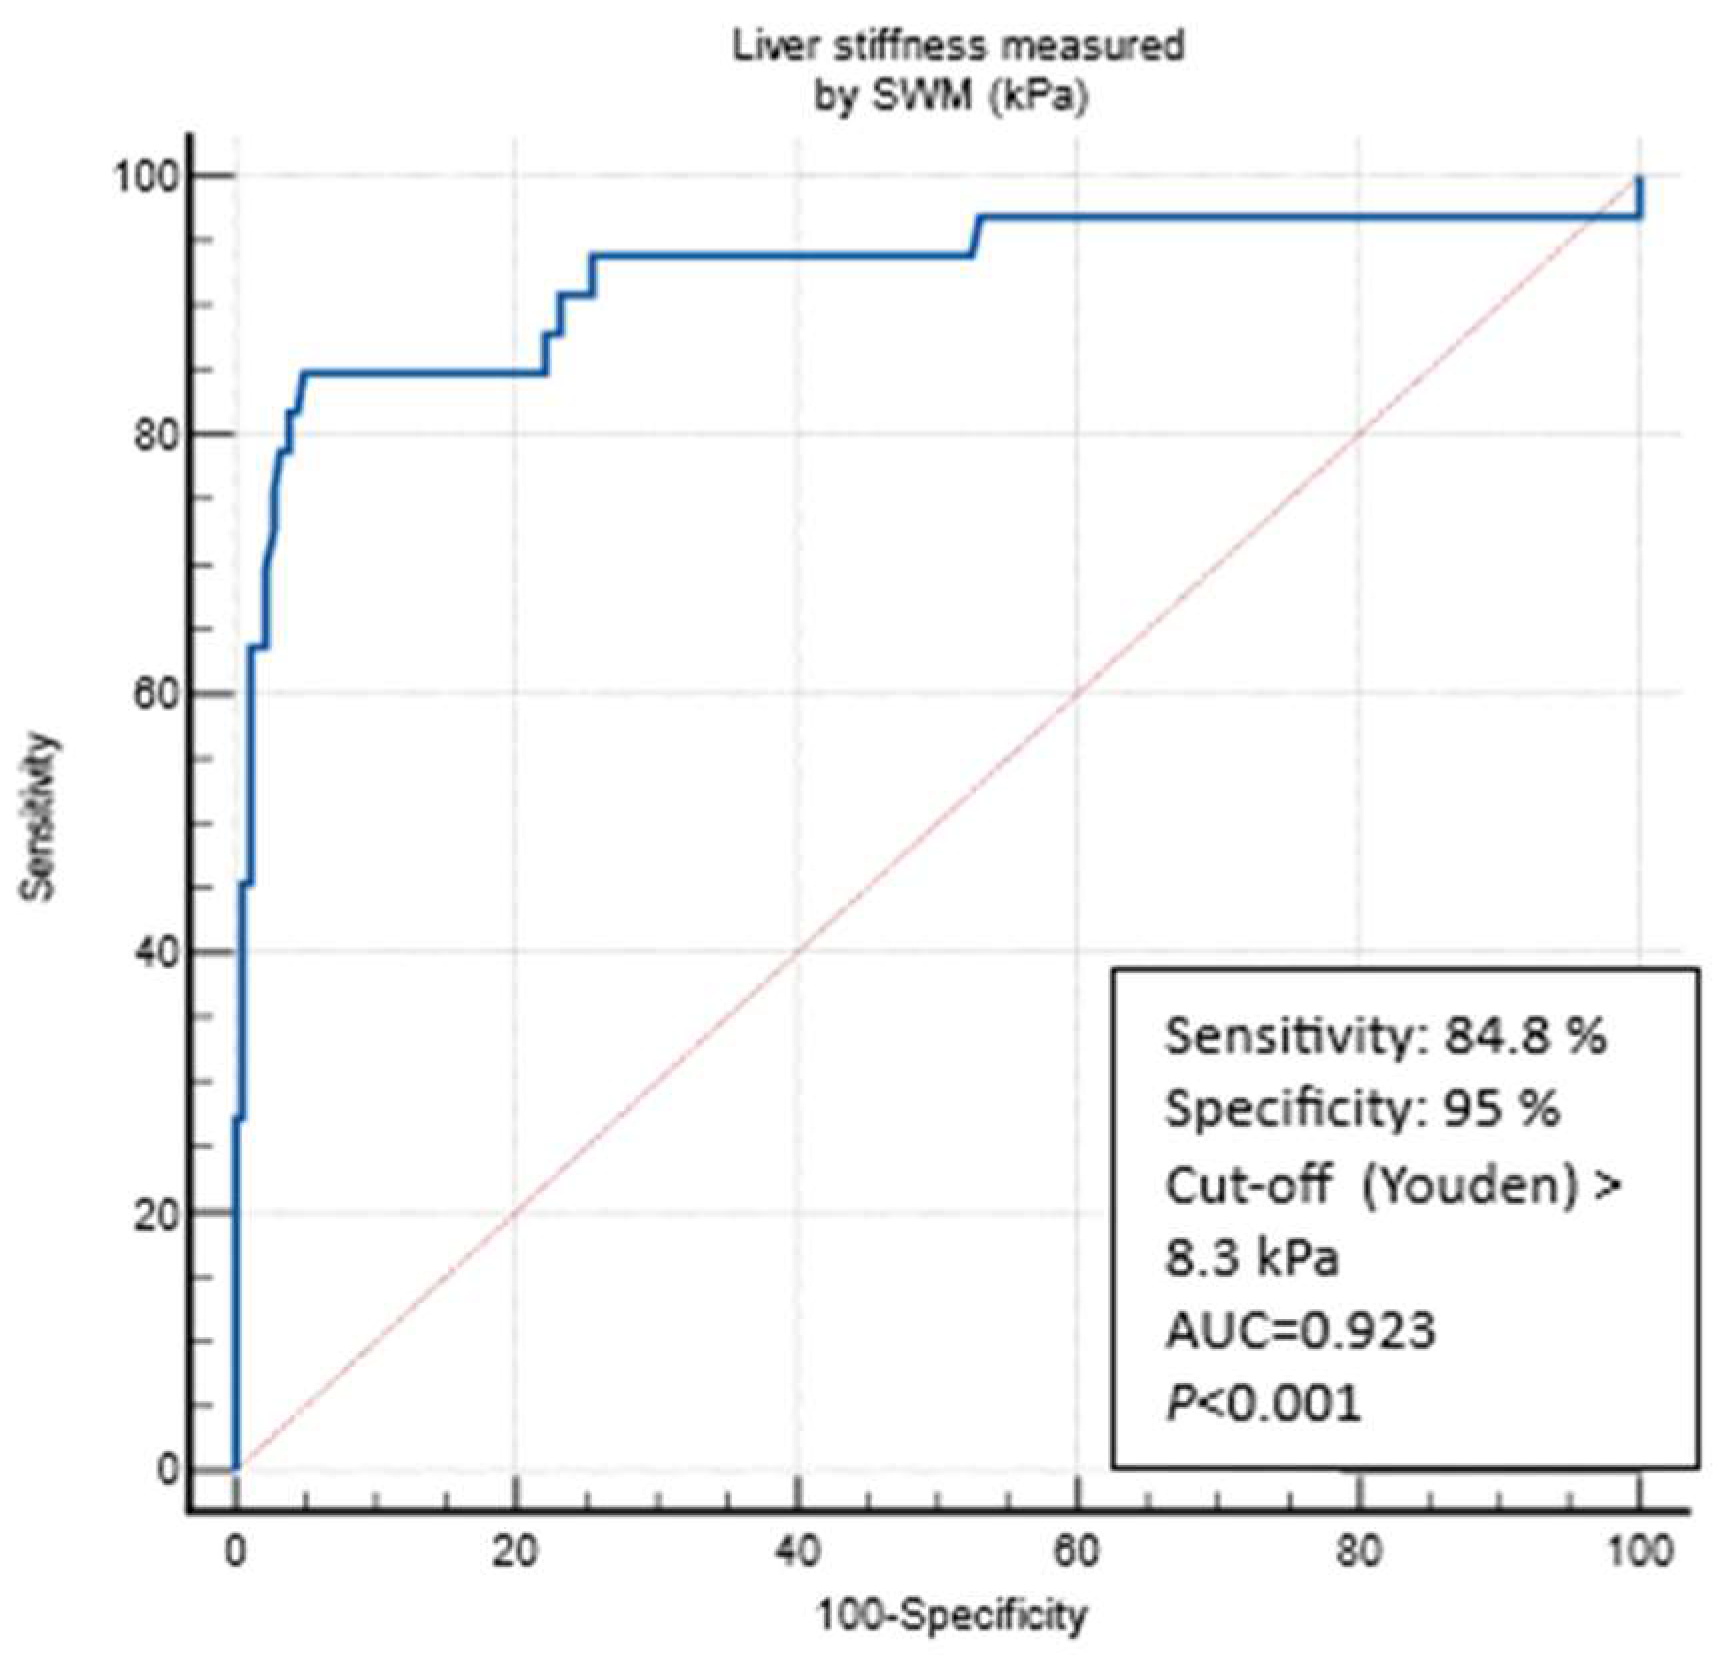
| VCTE 10–15 kPa (suggestive of cACLD) | Youden | 0.923 (95%CI: 0.879–0.955) | >8.3 | 84.8 | 95 | 17.06 | 0.16 | 75.5 | 97.2 | 5/33 (15.2%) |
| Rule in | ≥9.9 | 72.7 | 97.2 | 26.33 | 0.28 | 82.5 | 95.1 | 9/33 (27.3%) | ||
| Rule out | ≤6.3 | 90.9 | 76.8 | 3.92 | 0.12 | 41.6 | 97.9 | 3/33 (9.1%) | ||
| VCTE > 15 kPa (highly suggestive of cACLD | Youden | 0.951 (95%CI: 0.913–0.976) | >11.0 | 84.2 | 96.4 | 23.46 | 0.16 | 69.5 | 98.4 | 3/19 (15.8%) |
| Rule in | ≥15.1 | 73.7 | 99.5 | 143.6 | 0.26 | 93.5 | 97.5 | 5/19 (26.3%) | ||
| Rule out | ≤6.4 | 94.7 | 70.3 | 3.42 | 0.07 | 22.8 | 99.3 | 1/19 (5.3%) |
| Stage | Cut-Off | AUROC | SWM Cut-Off, Stiffness (kPa) | Sensitivity, % | Specificity, % | +LR | −LR | PPV,% | NPV, % | Missed Cases |
|---|---|---|---|---|---|---|---|---|---|---|
| VCTE 5–9 kPa (cACLD excluded) | Youden | 0.706 (95%CI: 0.641–0.767) | >4.6 | 90.1 | 44.2 | 1.62 | 0.22 | 59.1 | 83.3 | 10/101 (9.9%) |
| Rule in | ≥9 | 21.8 | 92.9 | 3.08 | 0.84 | 73.3 | 57.1 | 79/101 (78.2%) | ||
| Rule out | ≤4.5 | 91.1 | 42.5 | 1.58 | 0.21 | 58.6 | 84.2 | 9/101 (8.9%) | ||
| VCTE 10–15 kPa (suggestive of cACLD) | Youden | 0.908 (95%CI: 0.861–0.943) | >8.3 | 85.7 | 90.2 | 8.71 | 0.16 | 48.7 | 98.3 | 3/21 (14.3%) |
| Rule in | ≥10.1 | 71.4 | 93.8 | 11.49 | 0.3 | 55.6 | 96.8 | 6/21 (28.6%) | ||
| Rule out | ≤6.4 | 90.5 | 74.1 | 3.49 | 0.13 | 27.5 | 98.6 | 2/21 (9.5%) | ||
| VCTE > 15 kPa (highly suggestive of cACLD | Youden | 0.913 (95%CI: 0.866–0.947) | >11.0 | 80 | 92.6 | 10.88 | 0.22 | 34.8 | 98.9 | 2/10 (20%) |
| Rule in | ≥16.9 | 60 | 96.6 | 17.49 | 0.41 | 46.5 | 98 | 4/10 (40%) | ||
| Rule out | ≤ 6.4 | 90 | 70.6 | 3.06 | 0.14 | 13.1 | 99.3 | 1/10 (10%) |
| Stage of Steatosis | Cut-Off | AUROC | ATT Cut-Off, (dB/cm/MHz) | Sens, % | Spec., % | +LR | −LR | PPV, % | NPV, % | Missed Cases |
|---|---|---|---|---|---|---|---|---|---|---|
| ≥S1 (CAP > 274 dB/m) | Youden | 0.744 (95% CI 0.680–0.801) | > 0.63 | 59 | 81.2 | 3.14 | 0.51 | 84 | 54.2 | 42/141 (29.7%) |
| Rule in | ≥ 0.74 | 34.3 | 91.2 | 3.92 | 0.72 | 86.7 | 45.3 | 79/141 (56%) | ||
| Rule out | ≤ 0.49 | 90.3 | 31.2 | 1.31 | 0.31 | 68.7 | 65.8 | 14/141 (9.9%) |
Disclaimer/Publisher’s Note: The statements, opinions and data contained in all publications are solely those of the individual author(s) and contributor(s) and not of MDPI and/or the editor(s). MDPI and/or the editor(s) disclaim responsibility for any injury to people or property resulting from any ideas, methods, instructions or products referred to in the content. |
© 2024 by the authors. Licensee MDPI, Basel, Switzerland. This article is an open access article distributed under the terms and conditions of the Creative Commons Attribution (CC BY) license (https://creativecommons.org/licenses/by/4.0/).
Share and Cite
Barisic-Jaman, M.; Milosevic, M.; Skurla, V.; Dohoczky, D.; Stojic, J.; Dinjar Kujundzic, P.; Cigrovski Berkovic, M.; Majic-Tengg, A.; Matijaca, A.; Lucijanic, T.; et al. Compensated Advanced Chronic Liver Disease and Steatosis in Patients with Type 2 Diabetes as Assessed through Shear Wave Measurements and Attenuation Measurements. Biomedicines 2024, 12, 323. https://doi.org/10.3390/biomedicines12020323
Barisic-Jaman M, Milosevic M, Skurla V, Dohoczky D, Stojic J, Dinjar Kujundzic P, Cigrovski Berkovic M, Majic-Tengg A, Matijaca A, Lucijanic T, et al. Compensated Advanced Chronic Liver Disease and Steatosis in Patients with Type 2 Diabetes as Assessed through Shear Wave Measurements and Attenuation Measurements. Biomedicines. 2024; 12(2):323. https://doi.org/10.3390/biomedicines12020323
Chicago/Turabian StyleBarisic-Jaman, Mislav, Marko Milosevic, Viktoria Skurla, David Dohoczky, Josip Stojic, Petra Dinjar Kujundzic, Maja Cigrovski Berkovic, Ana Majic-Tengg, Ana Matijaca, Tomo Lucijanic, and et al. 2024. "Compensated Advanced Chronic Liver Disease and Steatosis in Patients with Type 2 Diabetes as Assessed through Shear Wave Measurements and Attenuation Measurements" Biomedicines 12, no. 2: 323. https://doi.org/10.3390/biomedicines12020323
APA StyleBarisic-Jaman, M., Milosevic, M., Skurla, V., Dohoczky, D., Stojic, J., Dinjar Kujundzic, P., Cigrovski Berkovic, M., Majic-Tengg, A., Matijaca, A., Lucijanic, T., Kardum-Pejic, M., Pandzic Jaksic, V., Marusic, S., & Grgurevic, I. (2024). Compensated Advanced Chronic Liver Disease and Steatosis in Patients with Type 2 Diabetes as Assessed through Shear Wave Measurements and Attenuation Measurements. Biomedicines, 12(2), 323. https://doi.org/10.3390/biomedicines12020323