
Early Cardiac Ischemia–Reperfusion Injury: Interactions of Autophagy with Galectin-3 and Oxidative Stress

 , and
, and 
Abstract
1. Introduction
2. Materials and Methods
2.1. Mouse Model of Myocardial Ischemia–Reperfusion
2.2. Mice Strains
2.3. Troponin-I Assay
2.4. Immunohistochemistry and Immunofluorescence Labeling
2.5. Morphometric Analysis
2.6. Protein Extraction
2.7. Enzyme-Linked Immunosorbent Assay
2.8. Oxidative Stress Markers and Antioxidant Enzyme Status Measurements
2.9. Statistical Analysis
3. Results
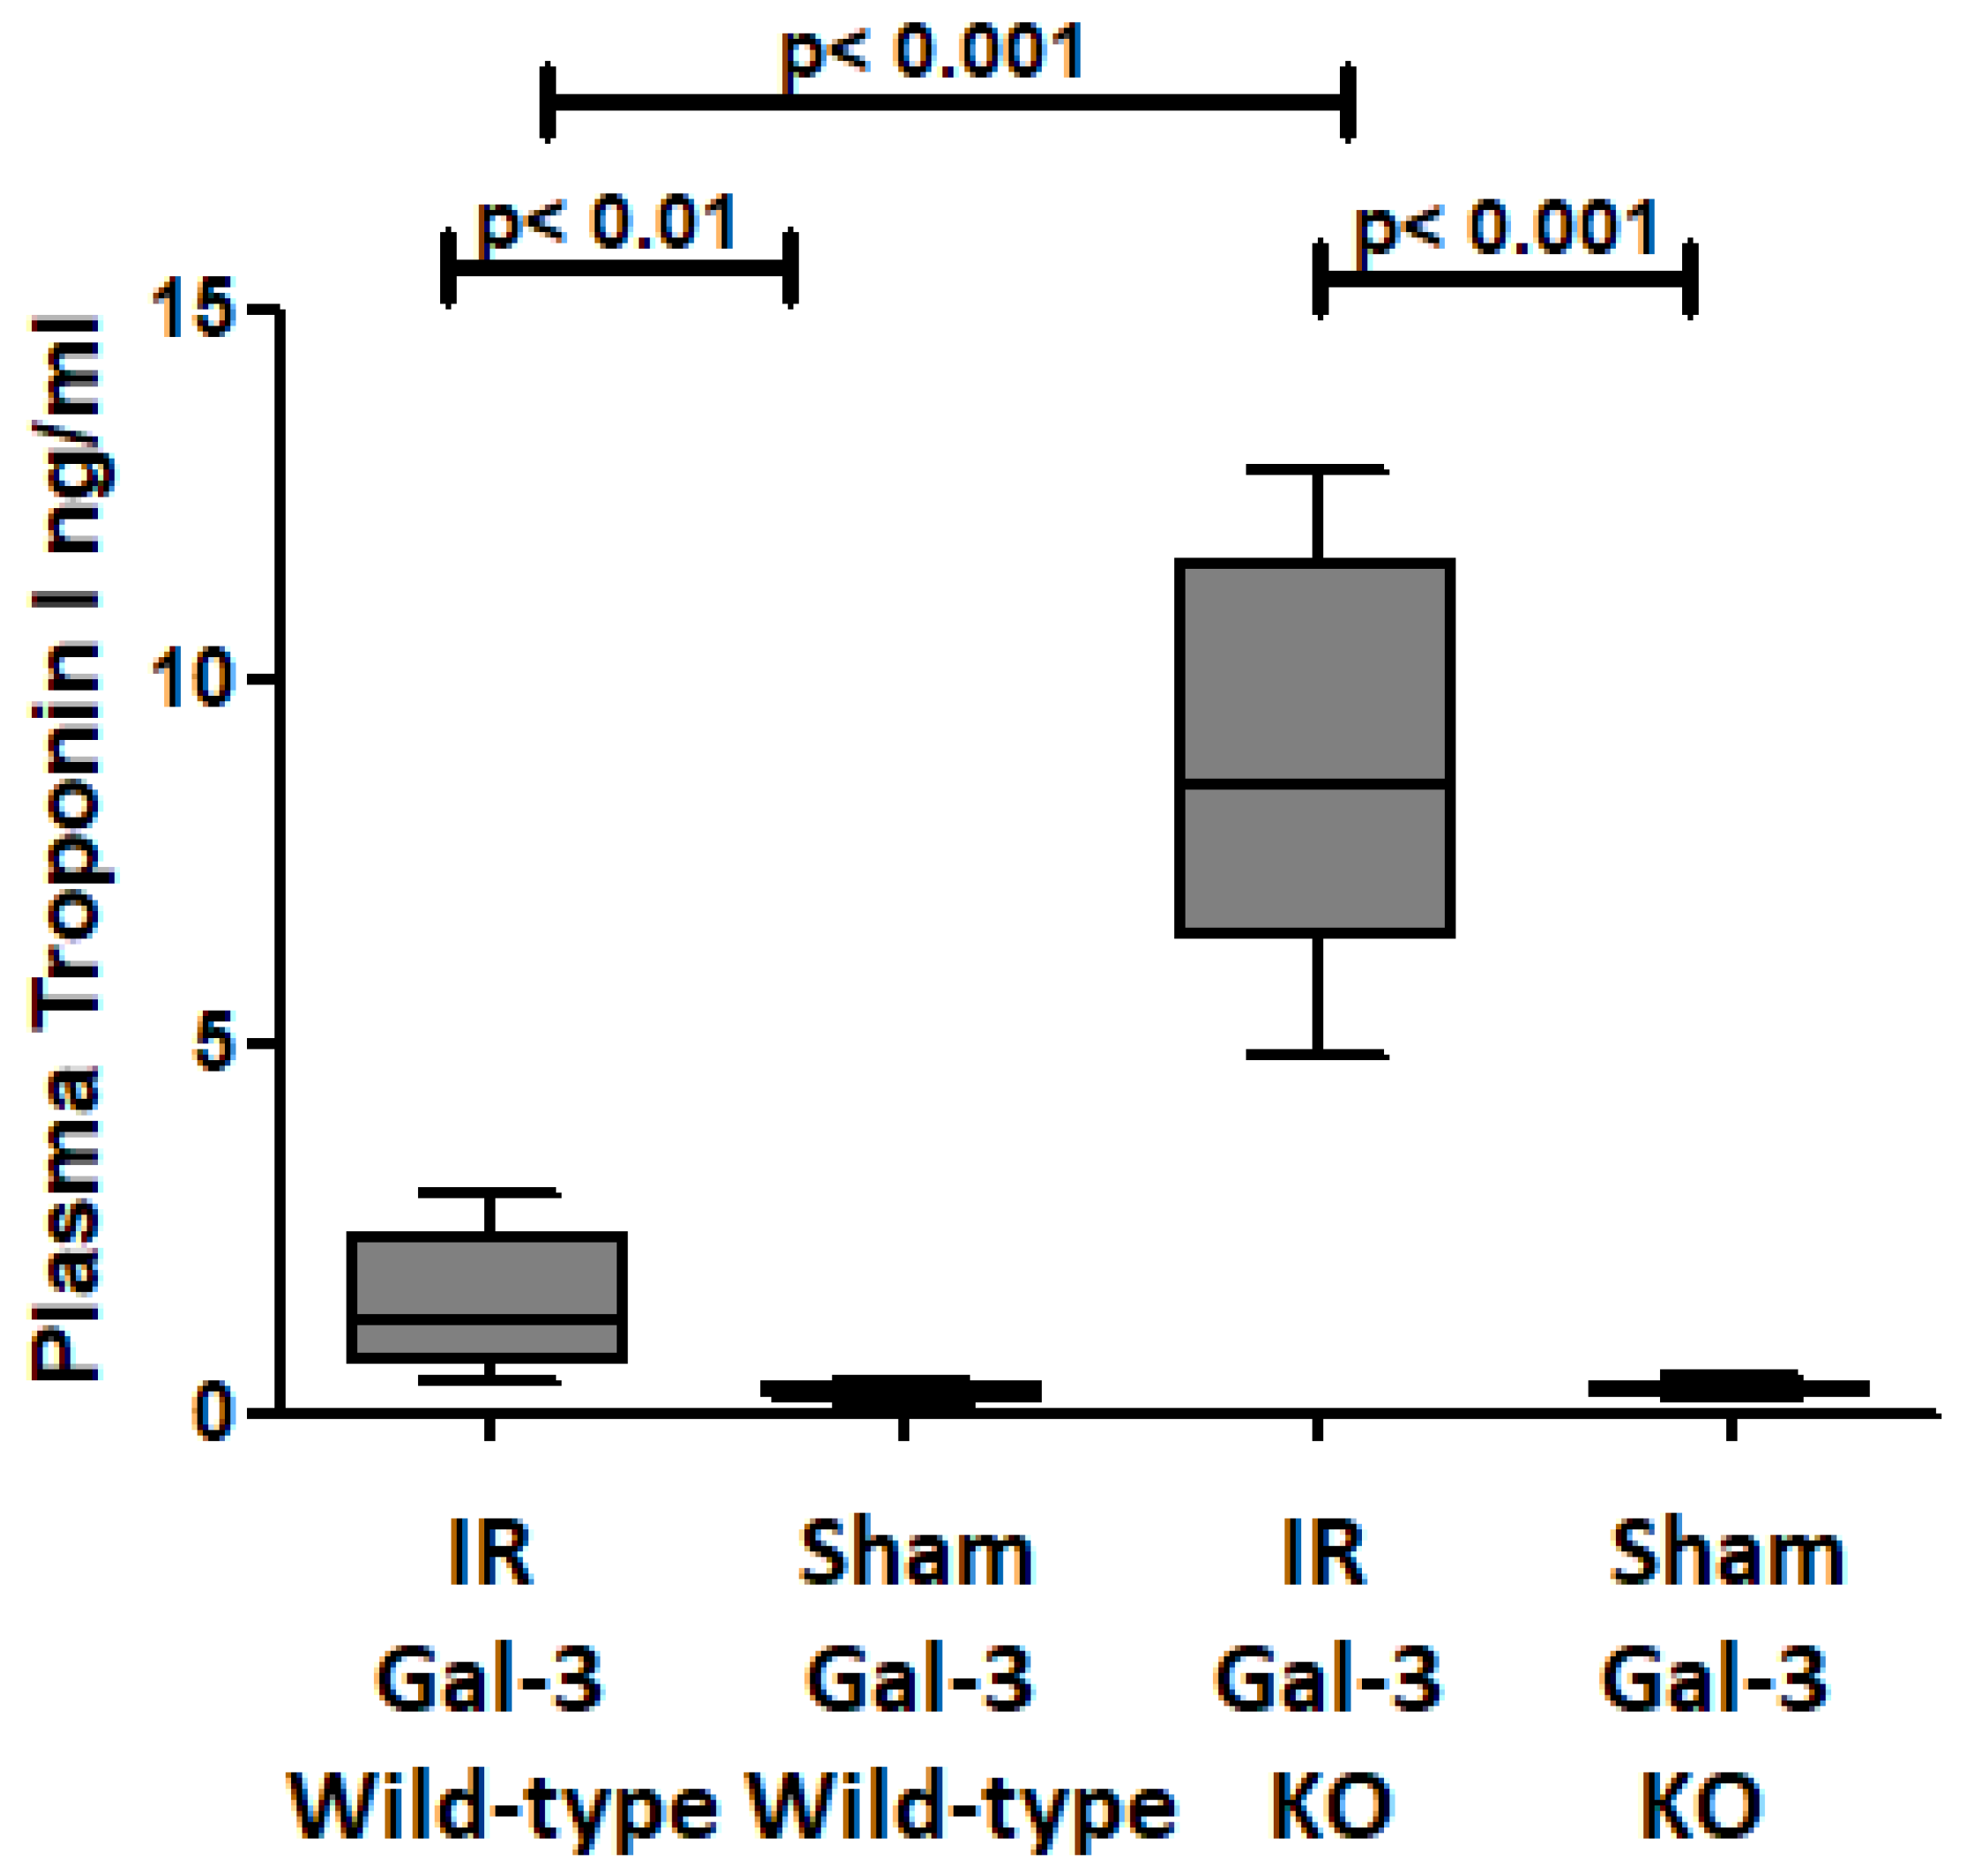
3.1. Troponin I Is Increased at 24 h Following IR Injury
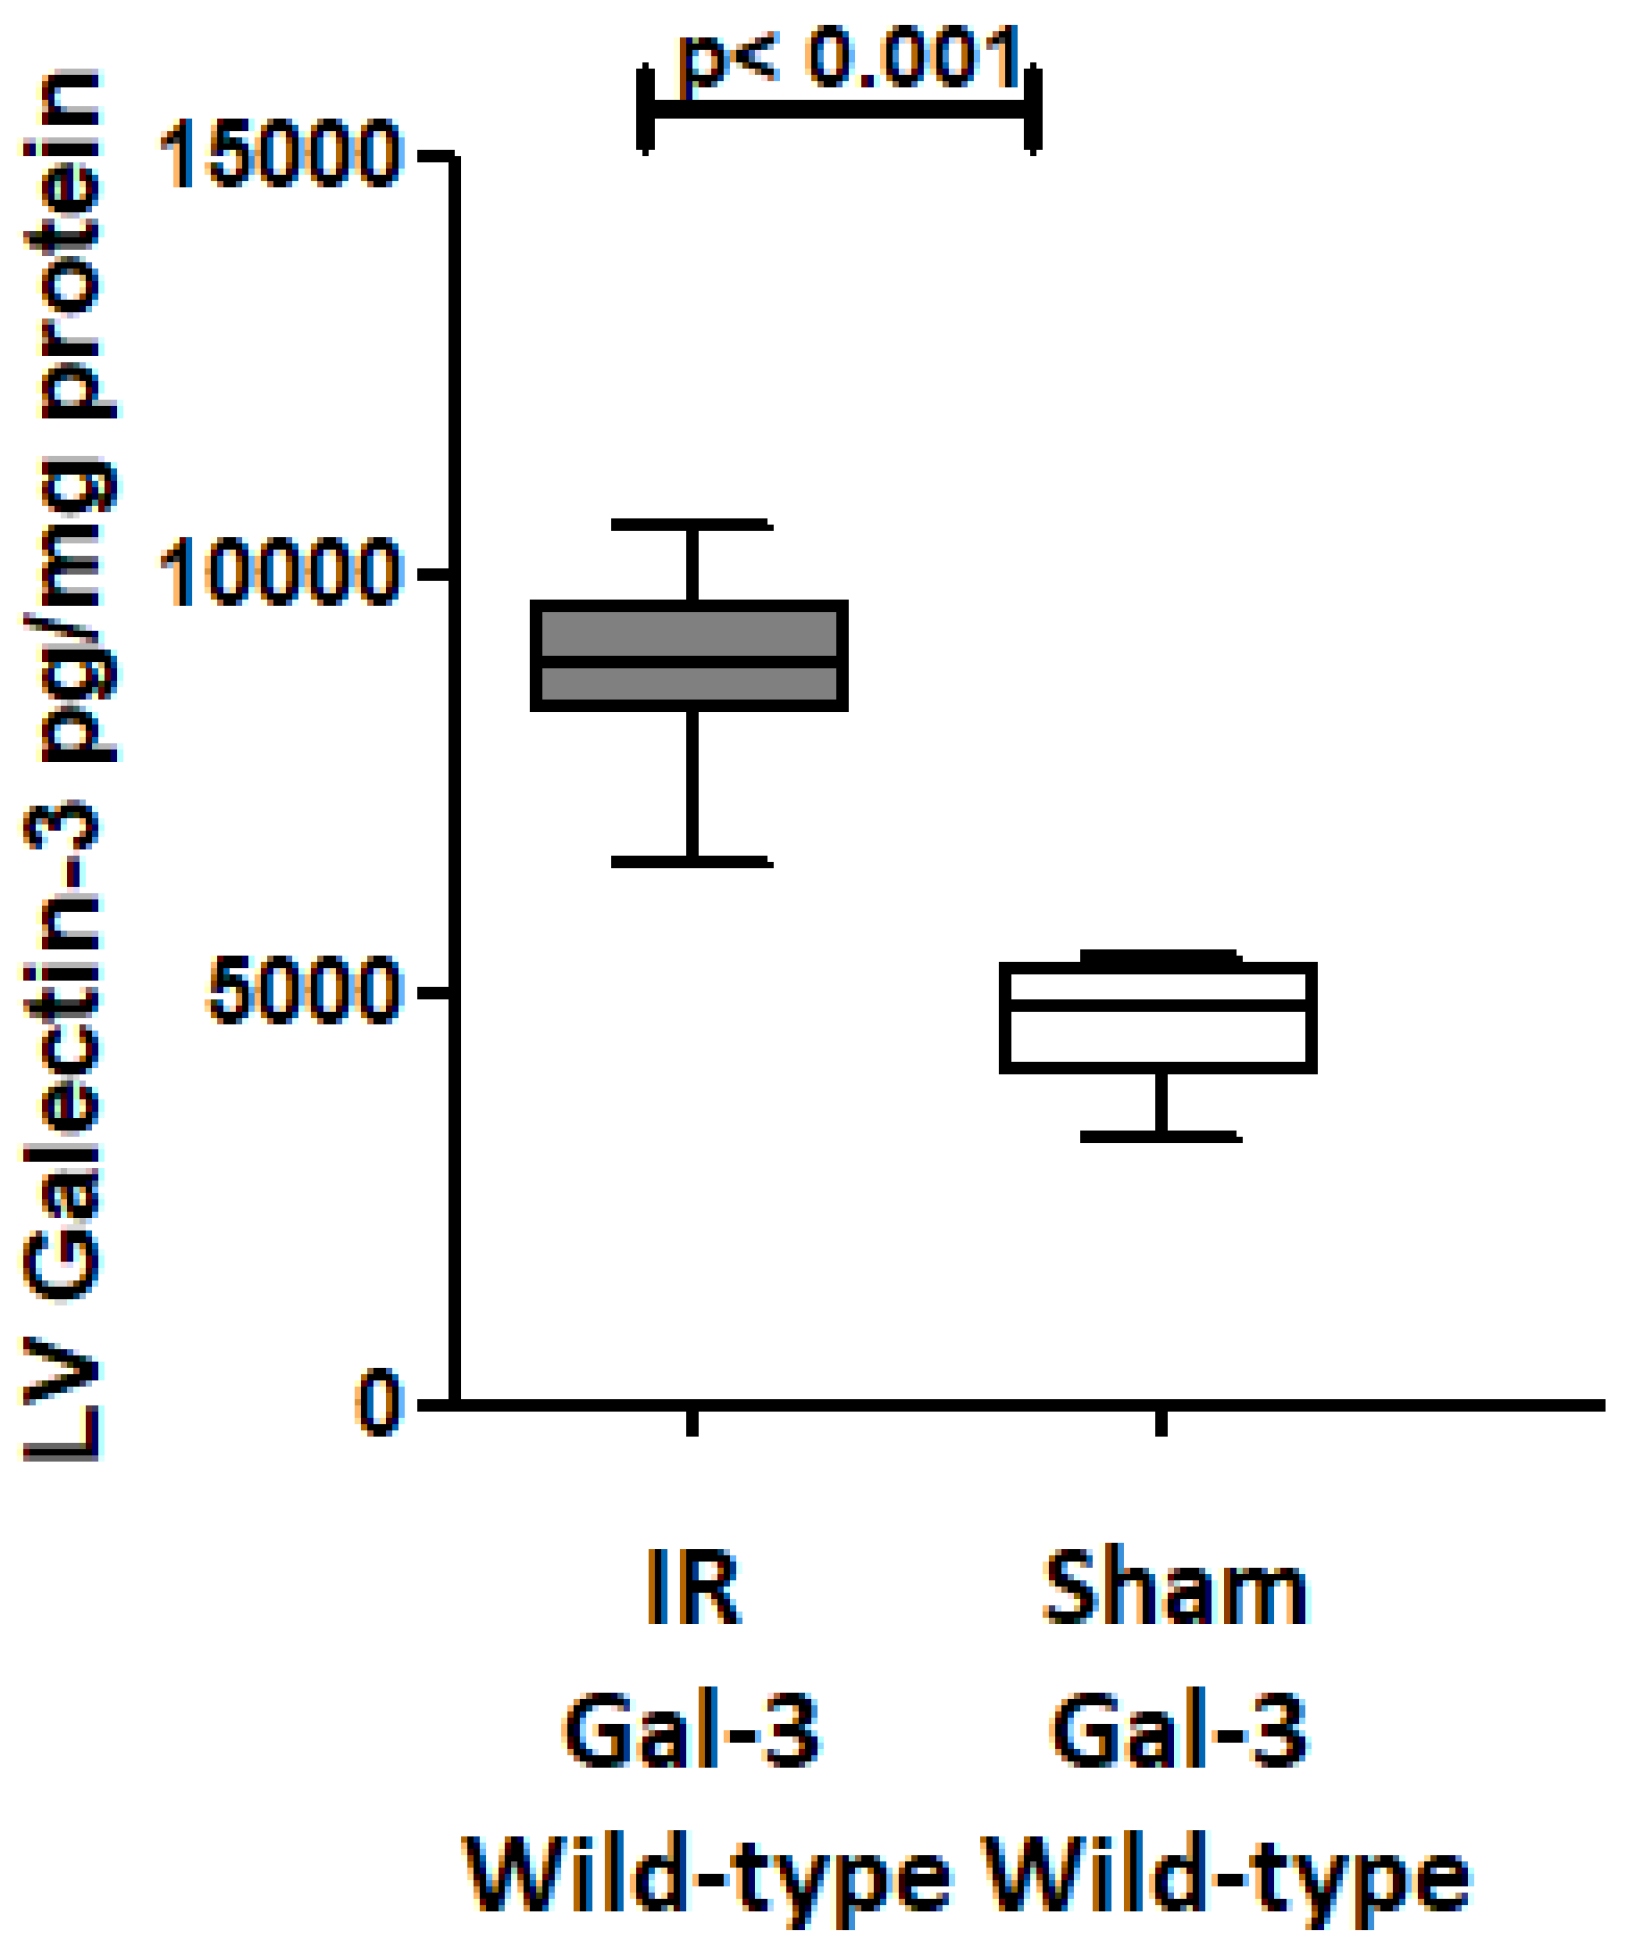
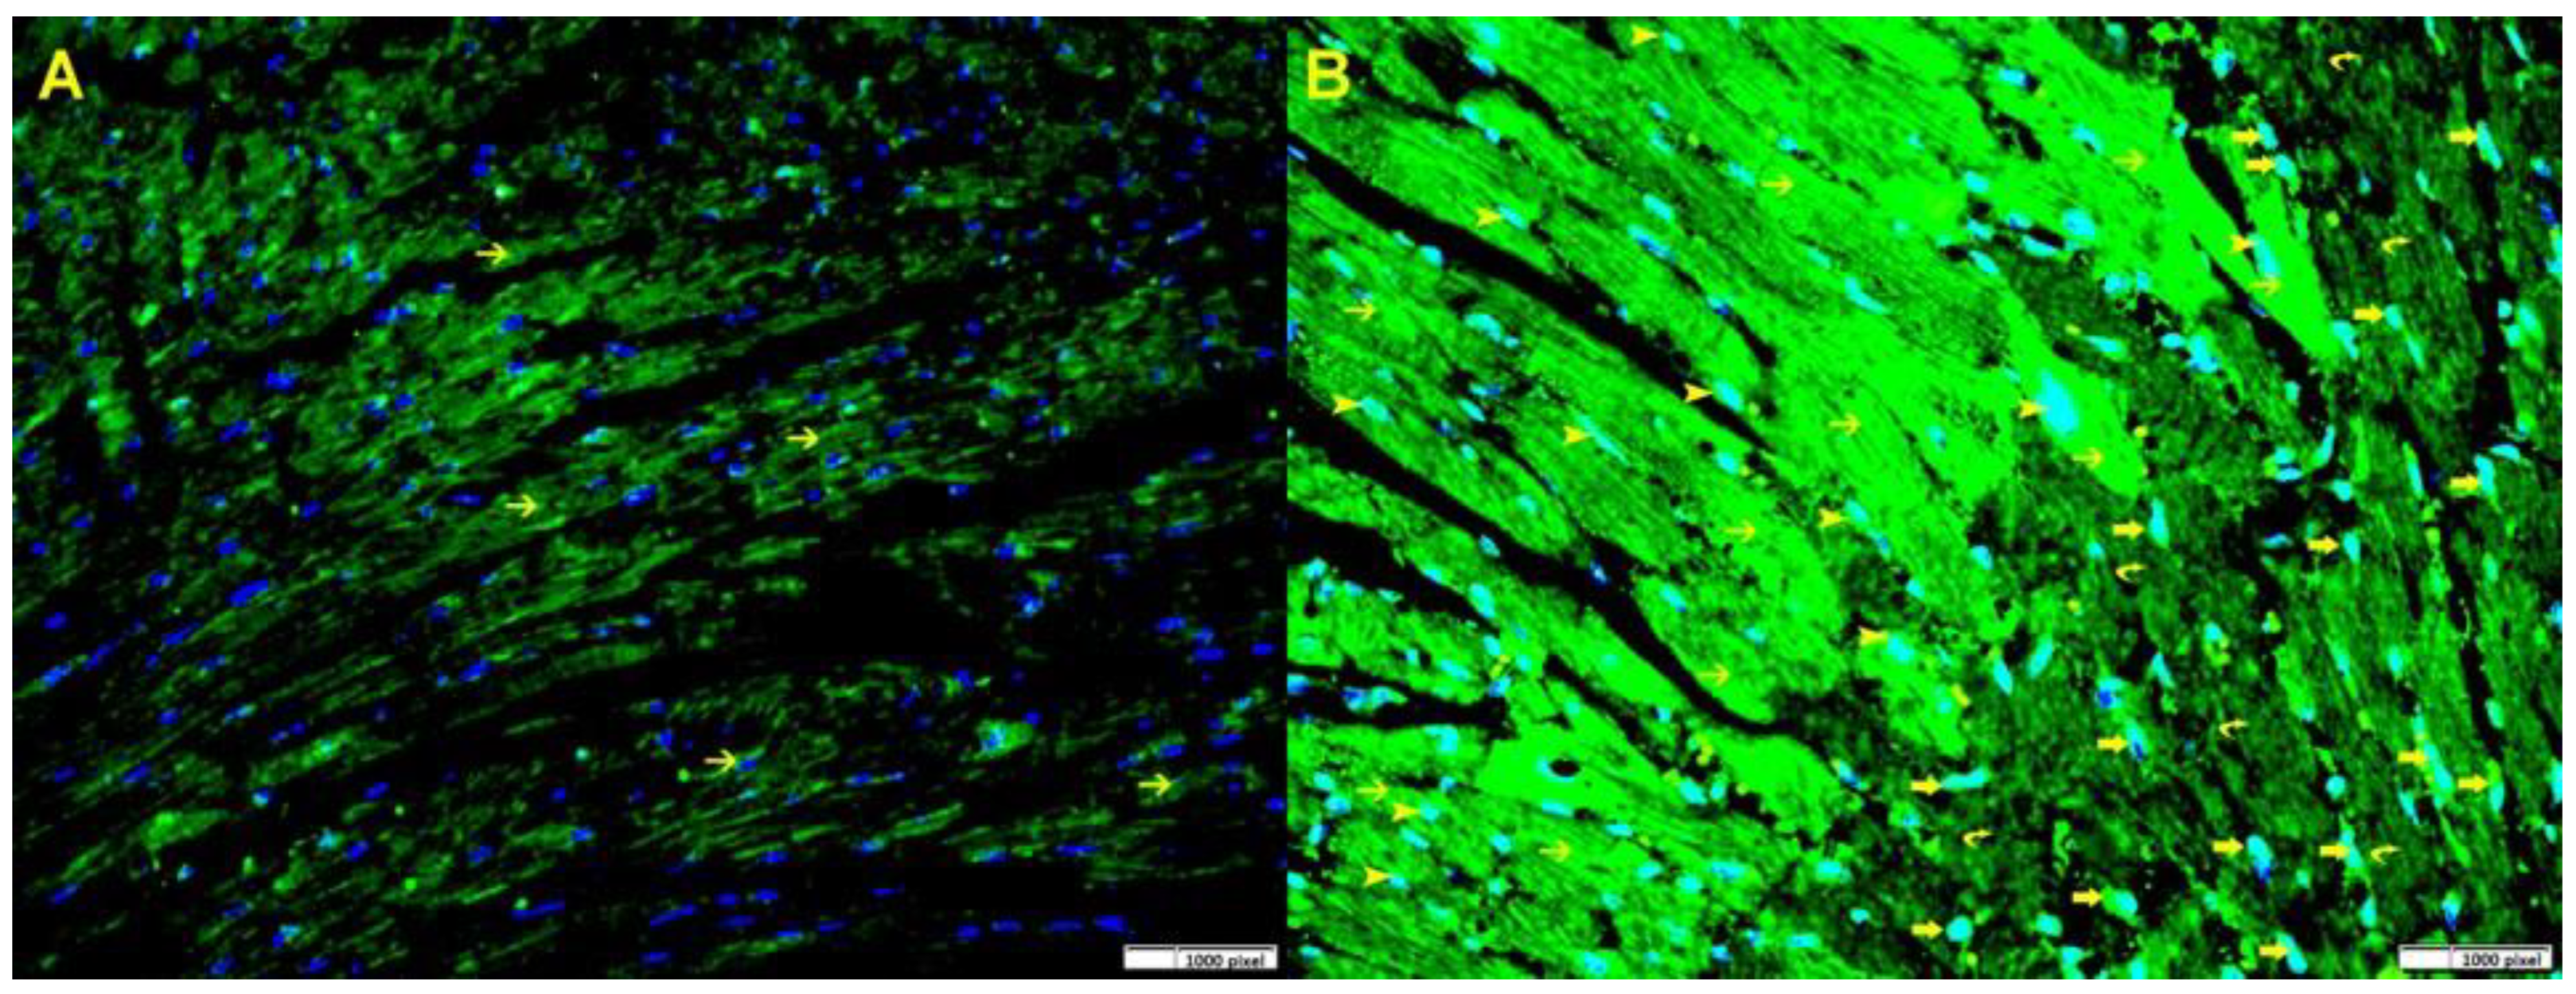
3.2. Gal-3 Is Increased After Ischemia–Reperfusion Injury in the Left Ventricle
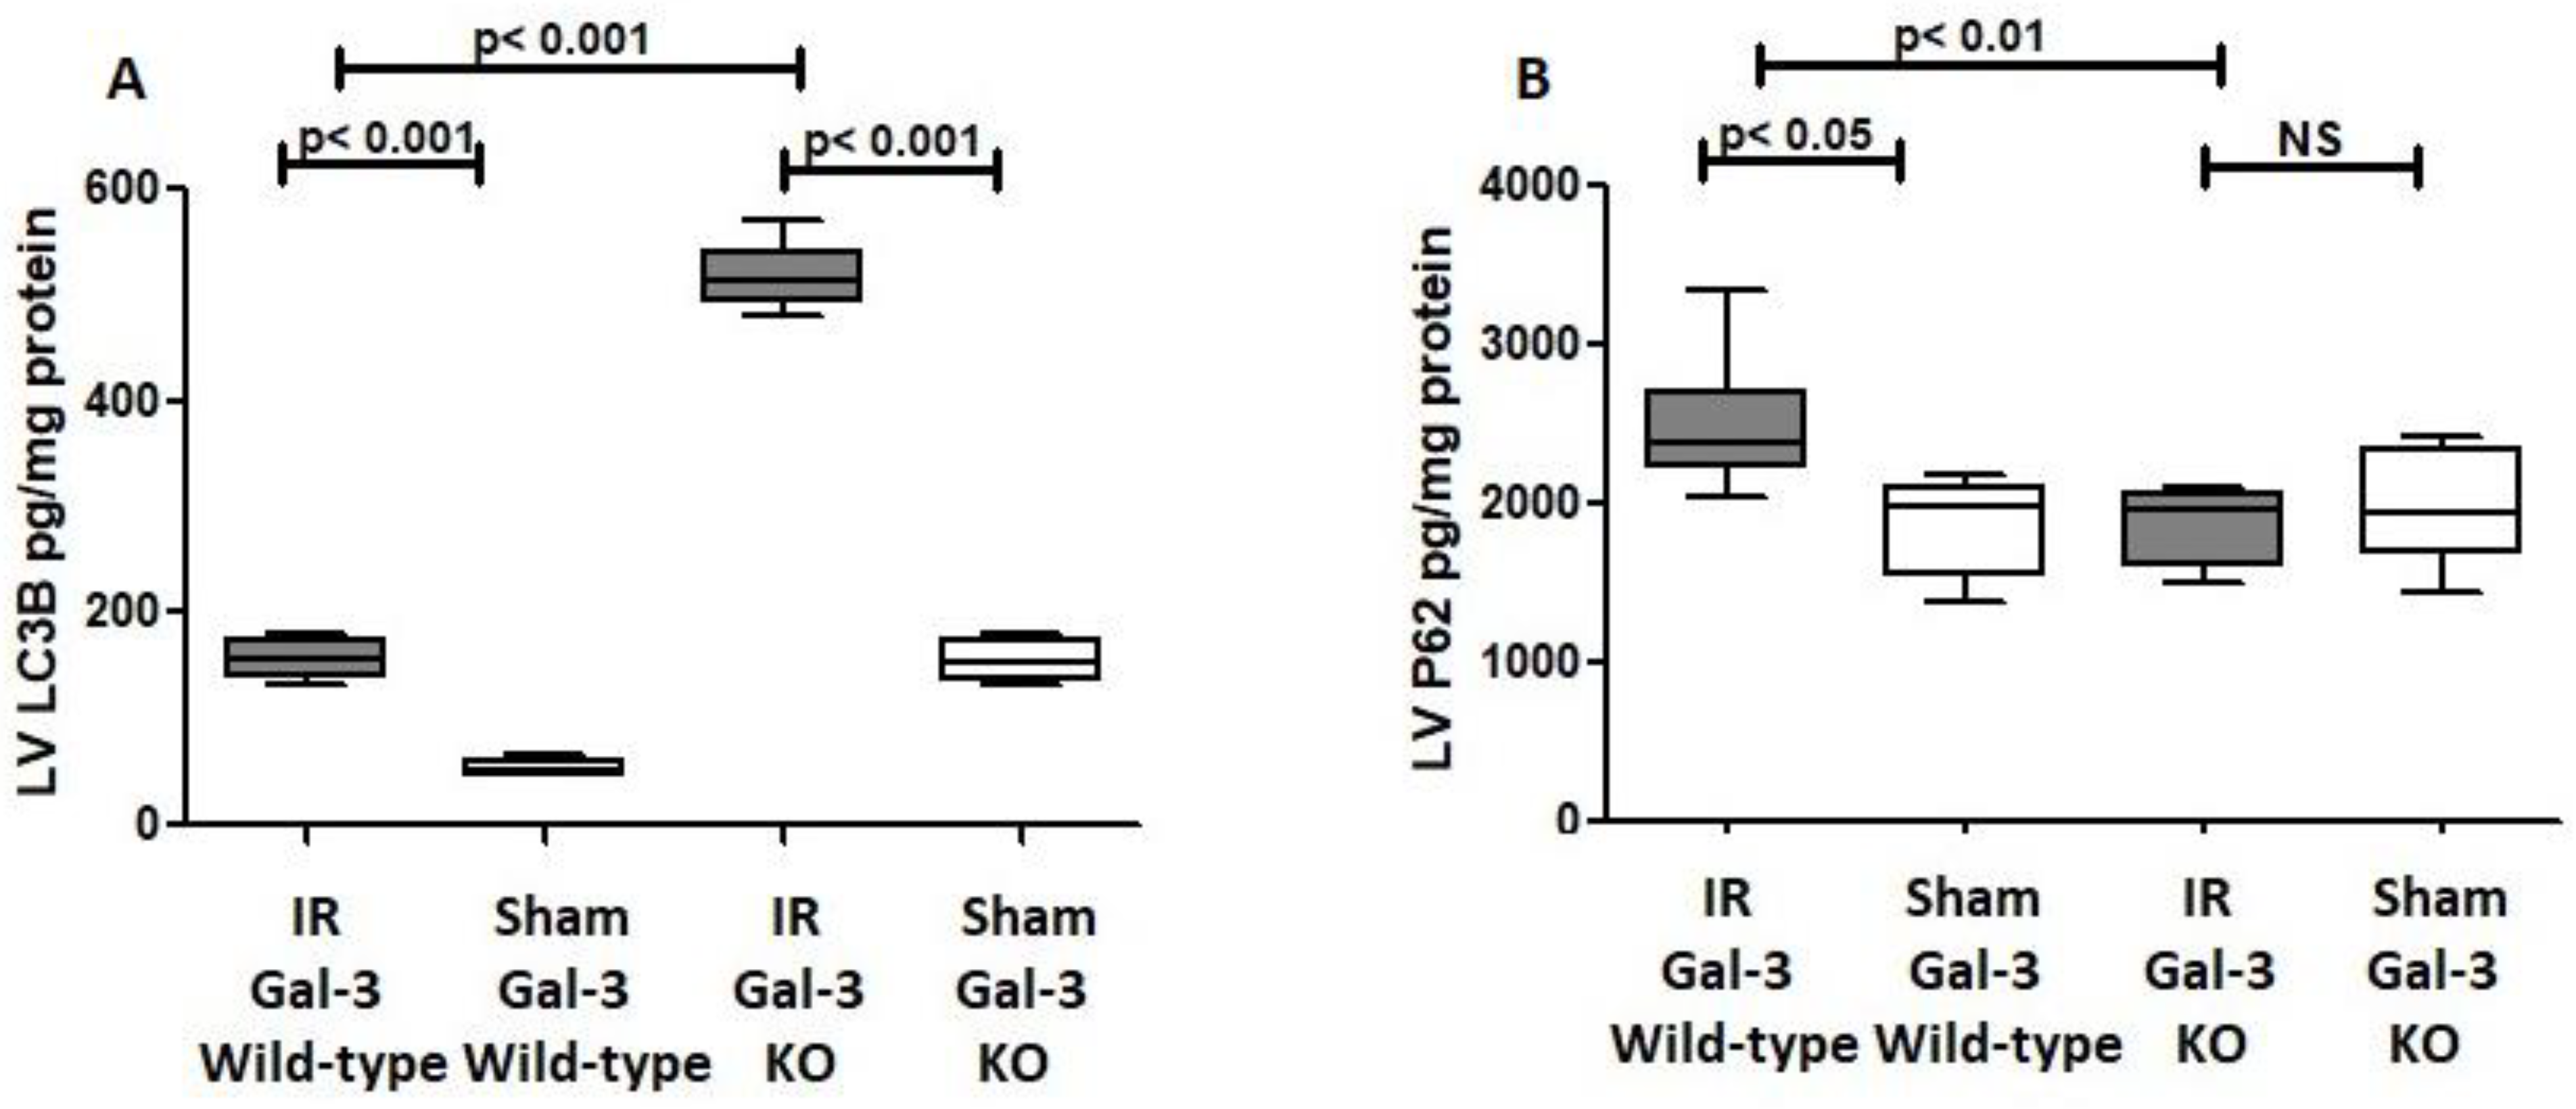
3.3. Gal-3 Interacts with Autophagy Proteins
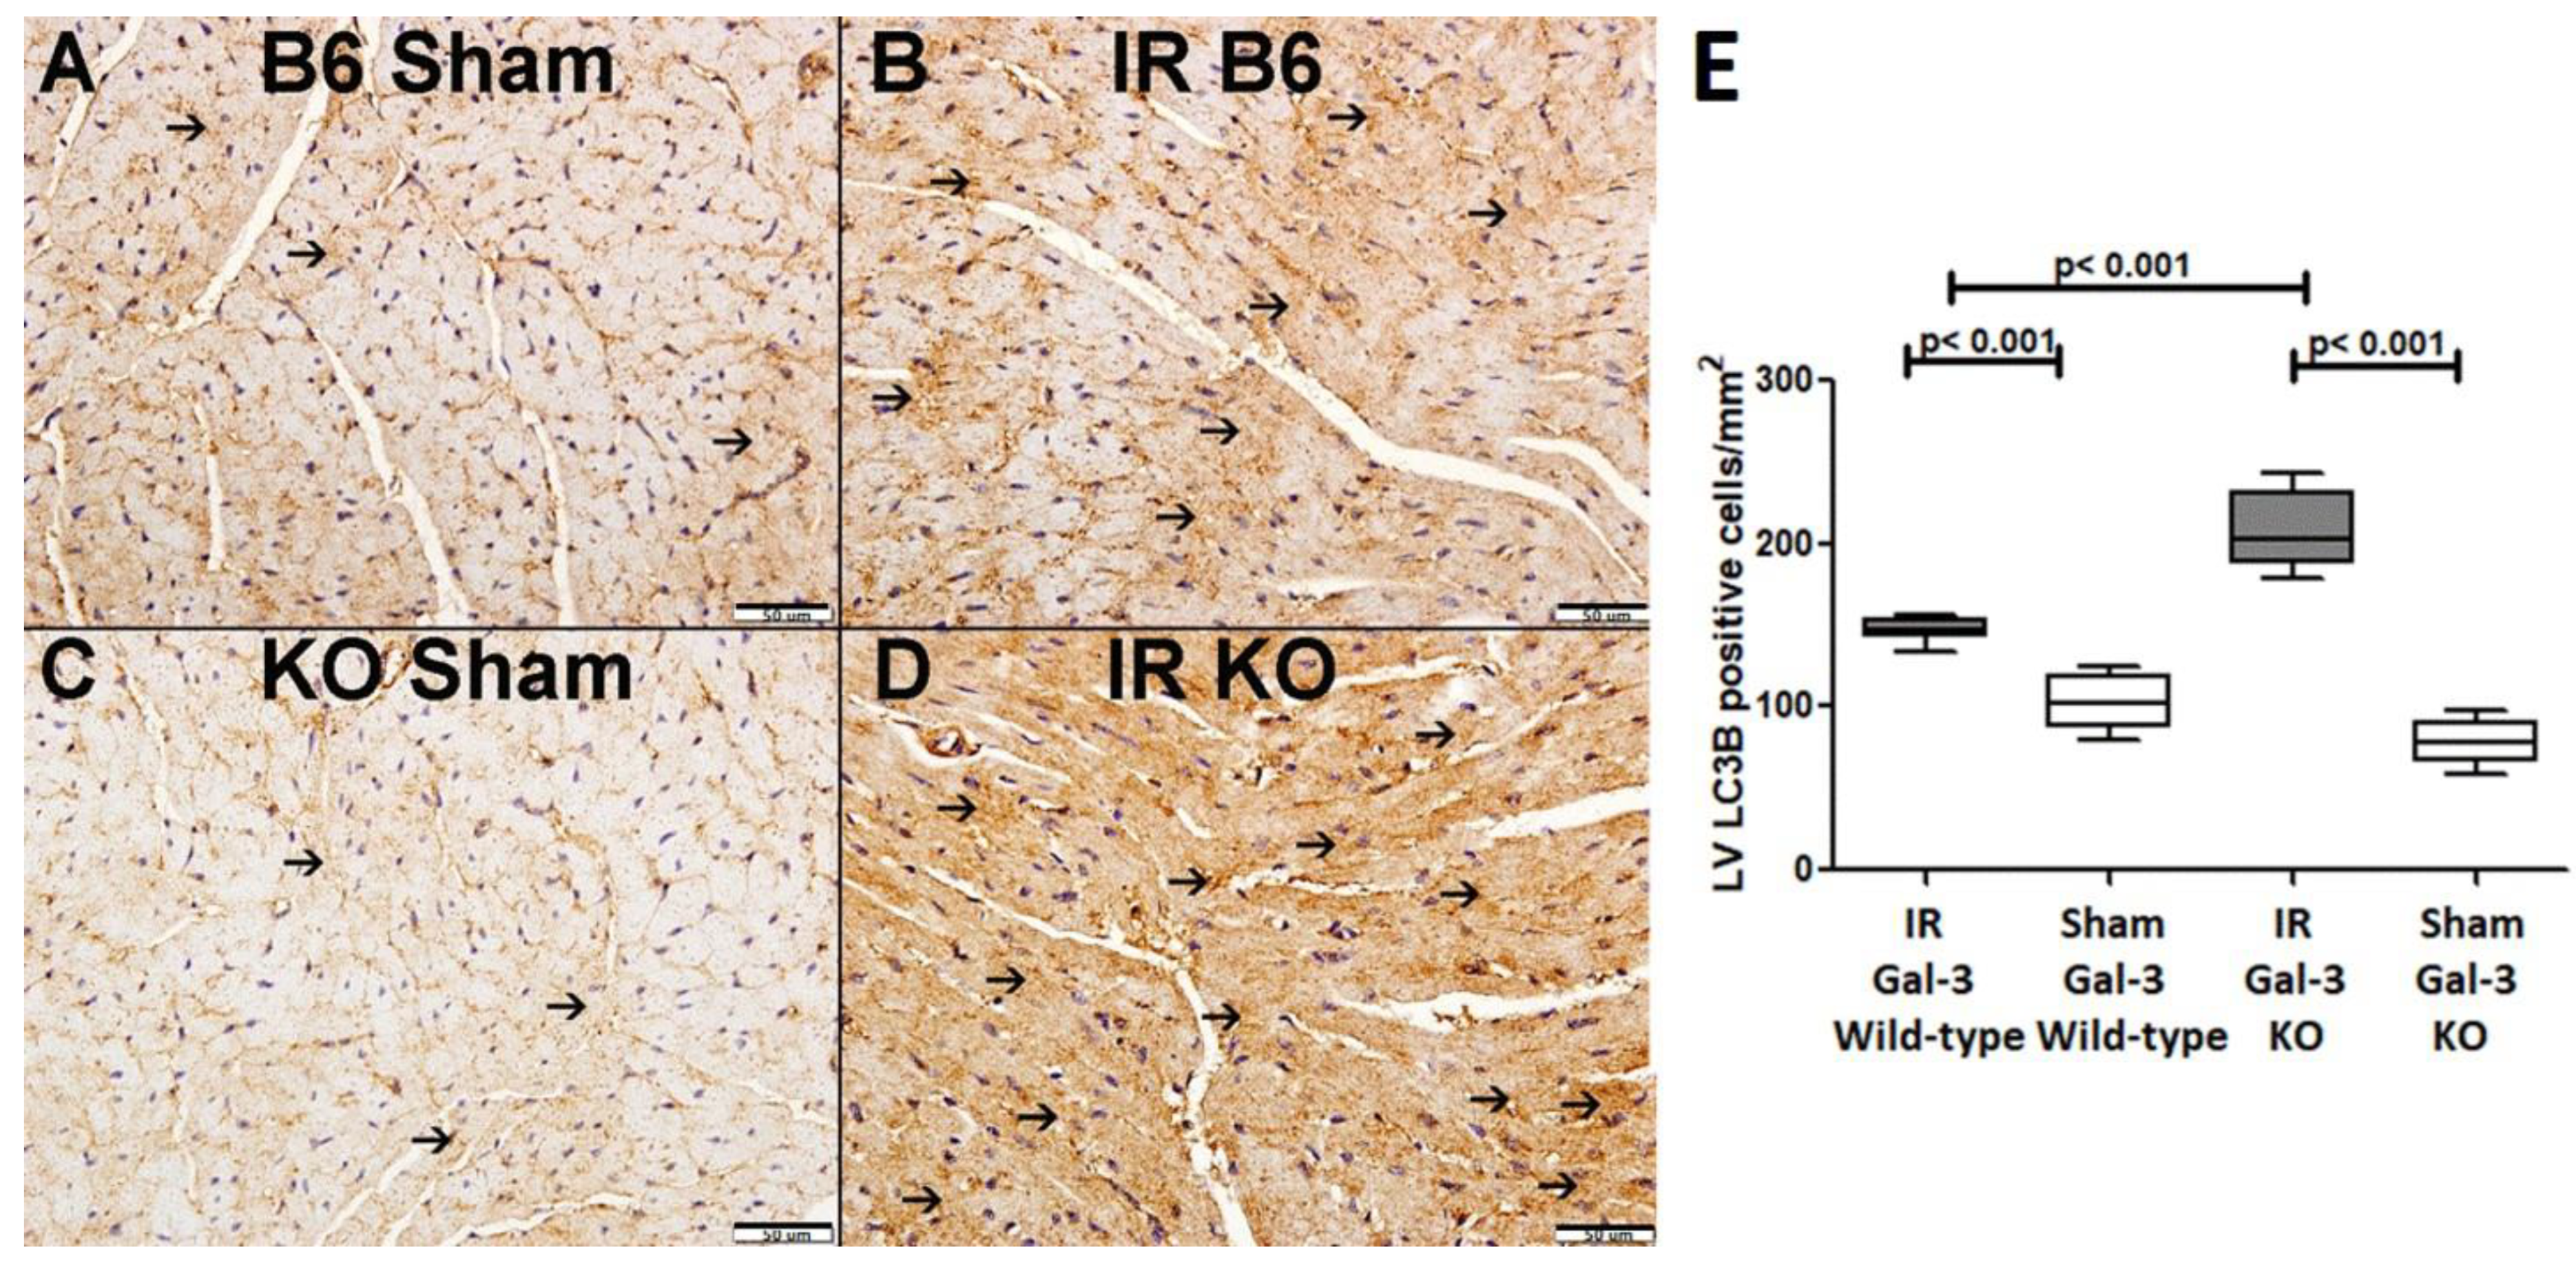
3.3.1. Autophagy Flux
LC3B
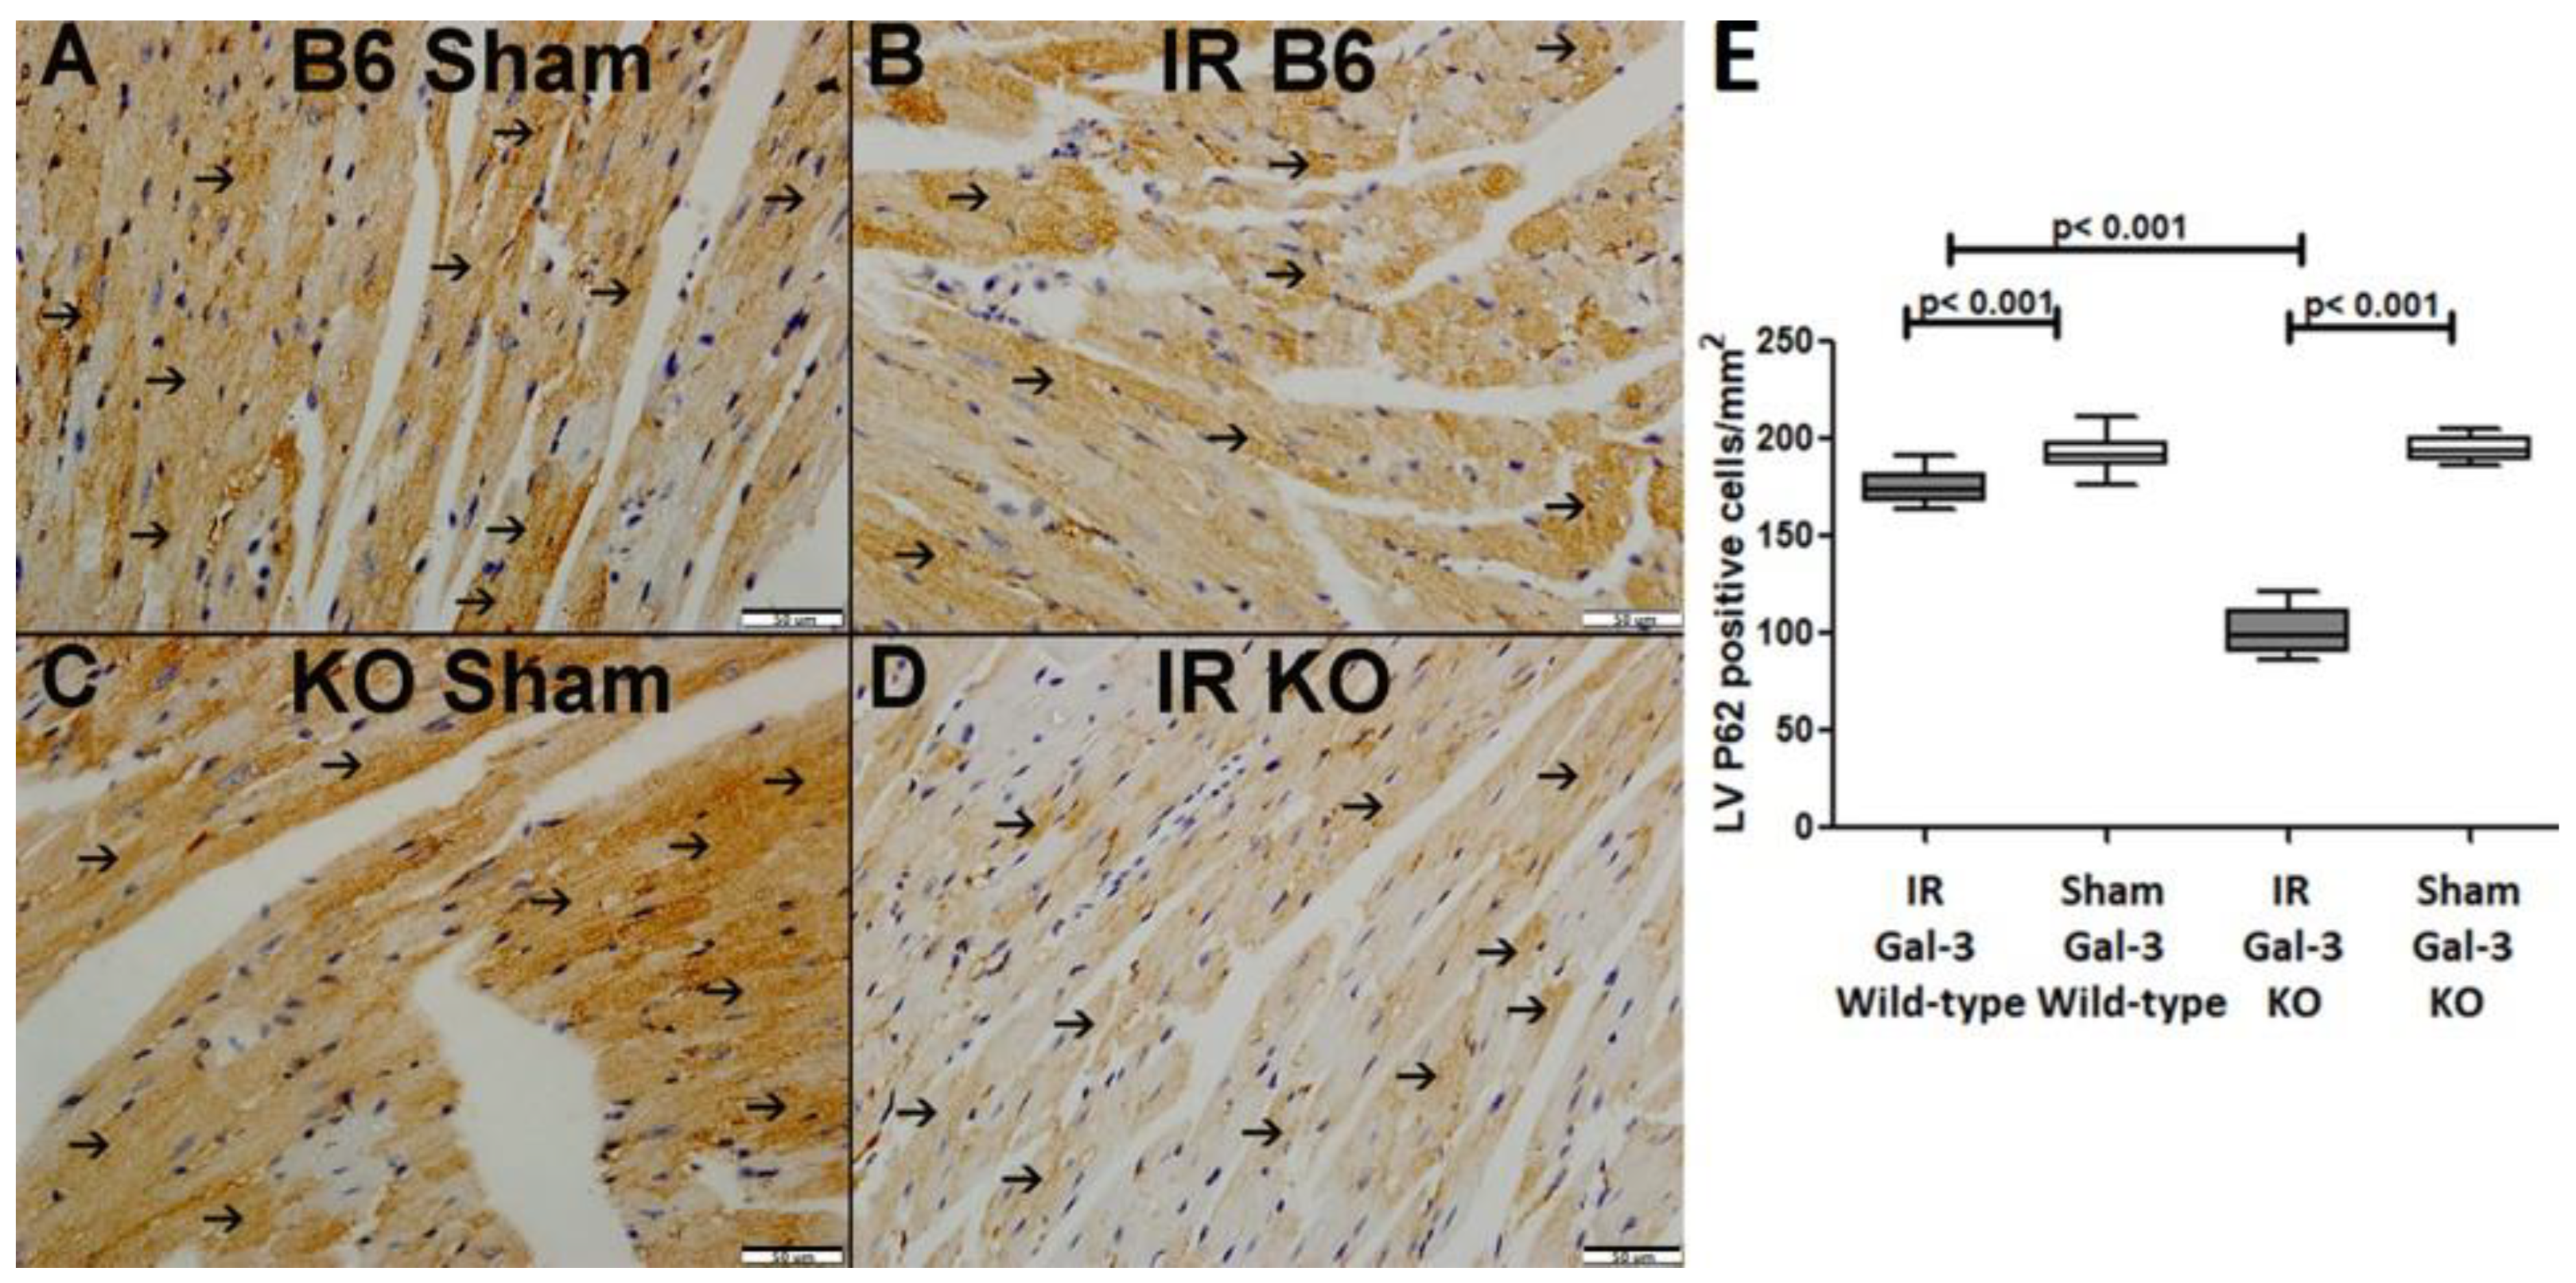
P62
Autophagy FLUX
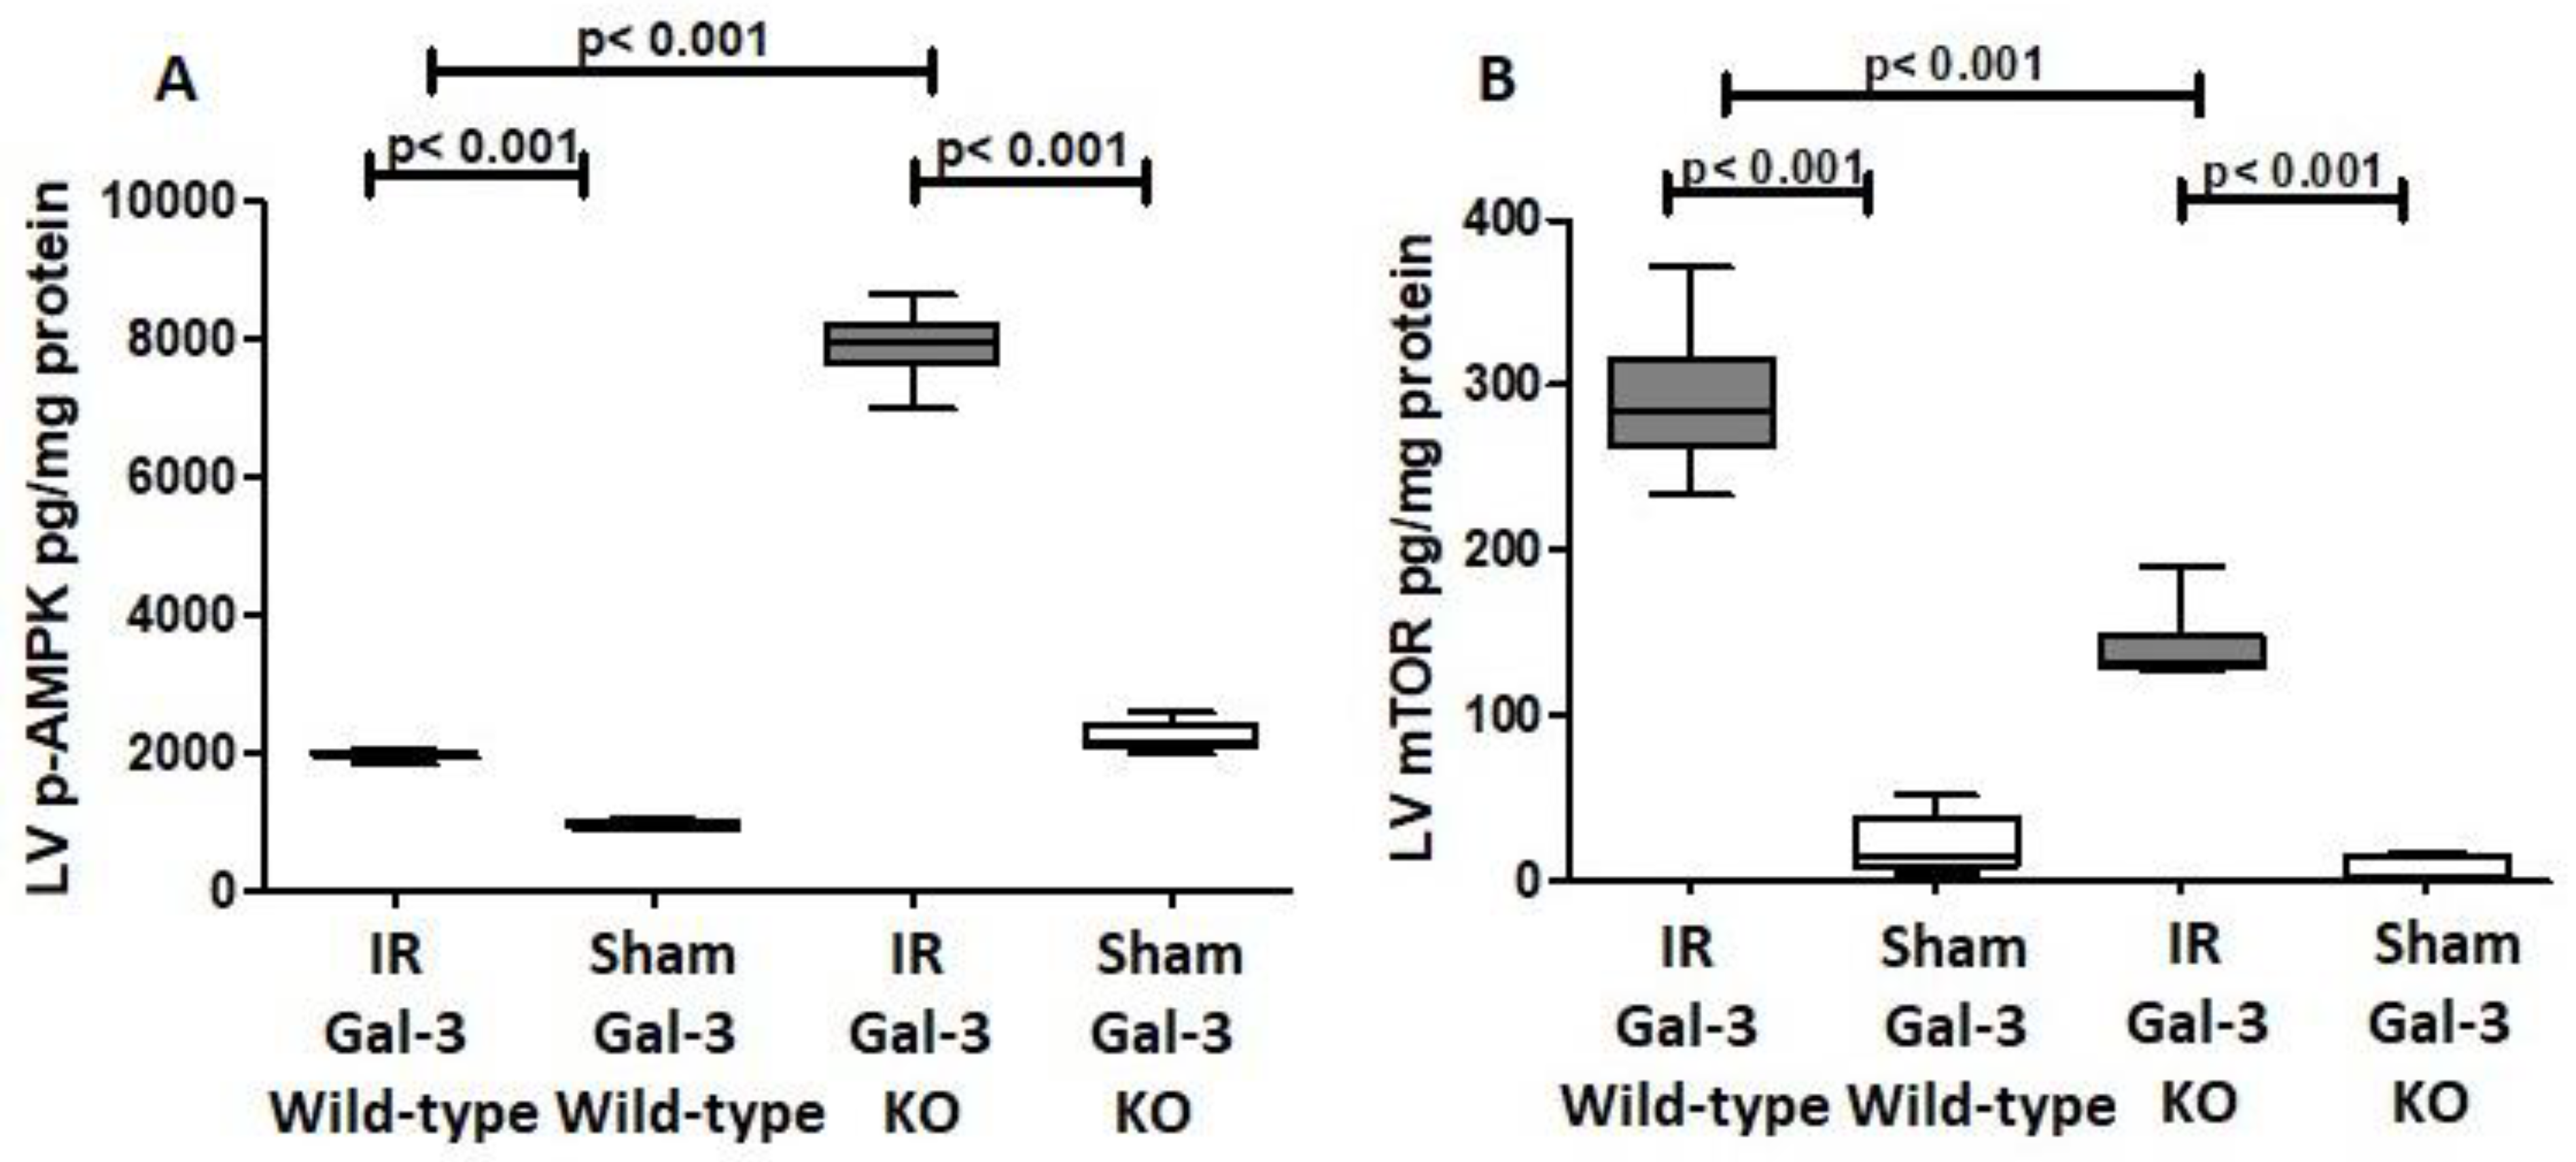
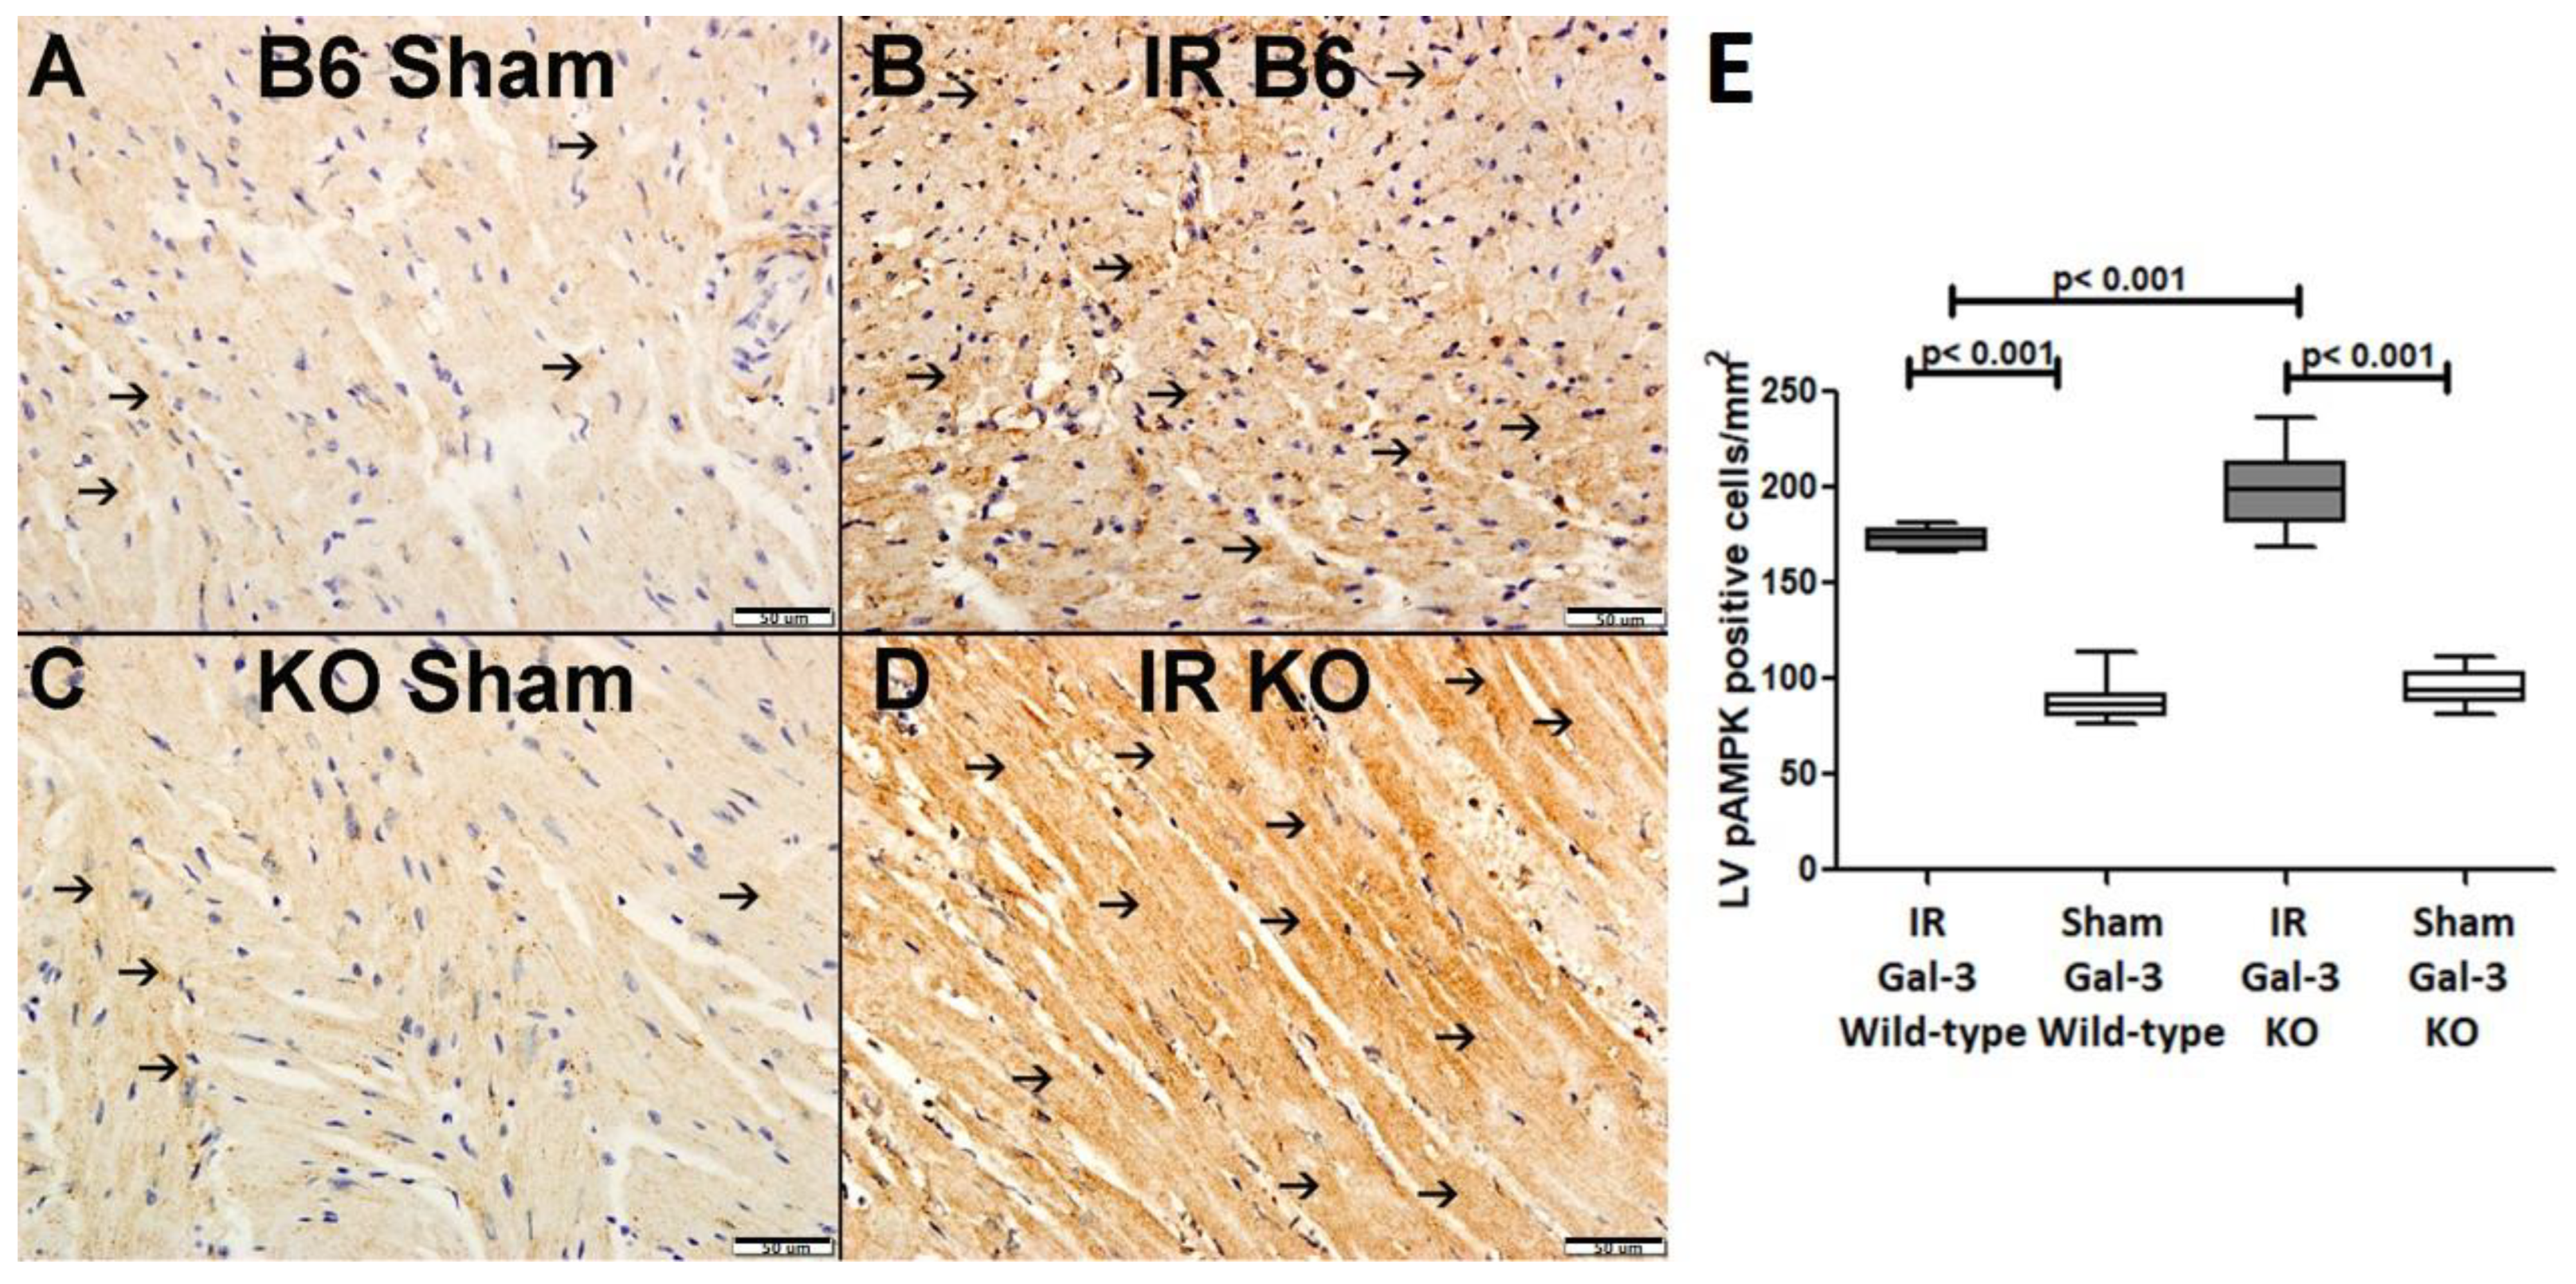
3.3.2. p-AMPK
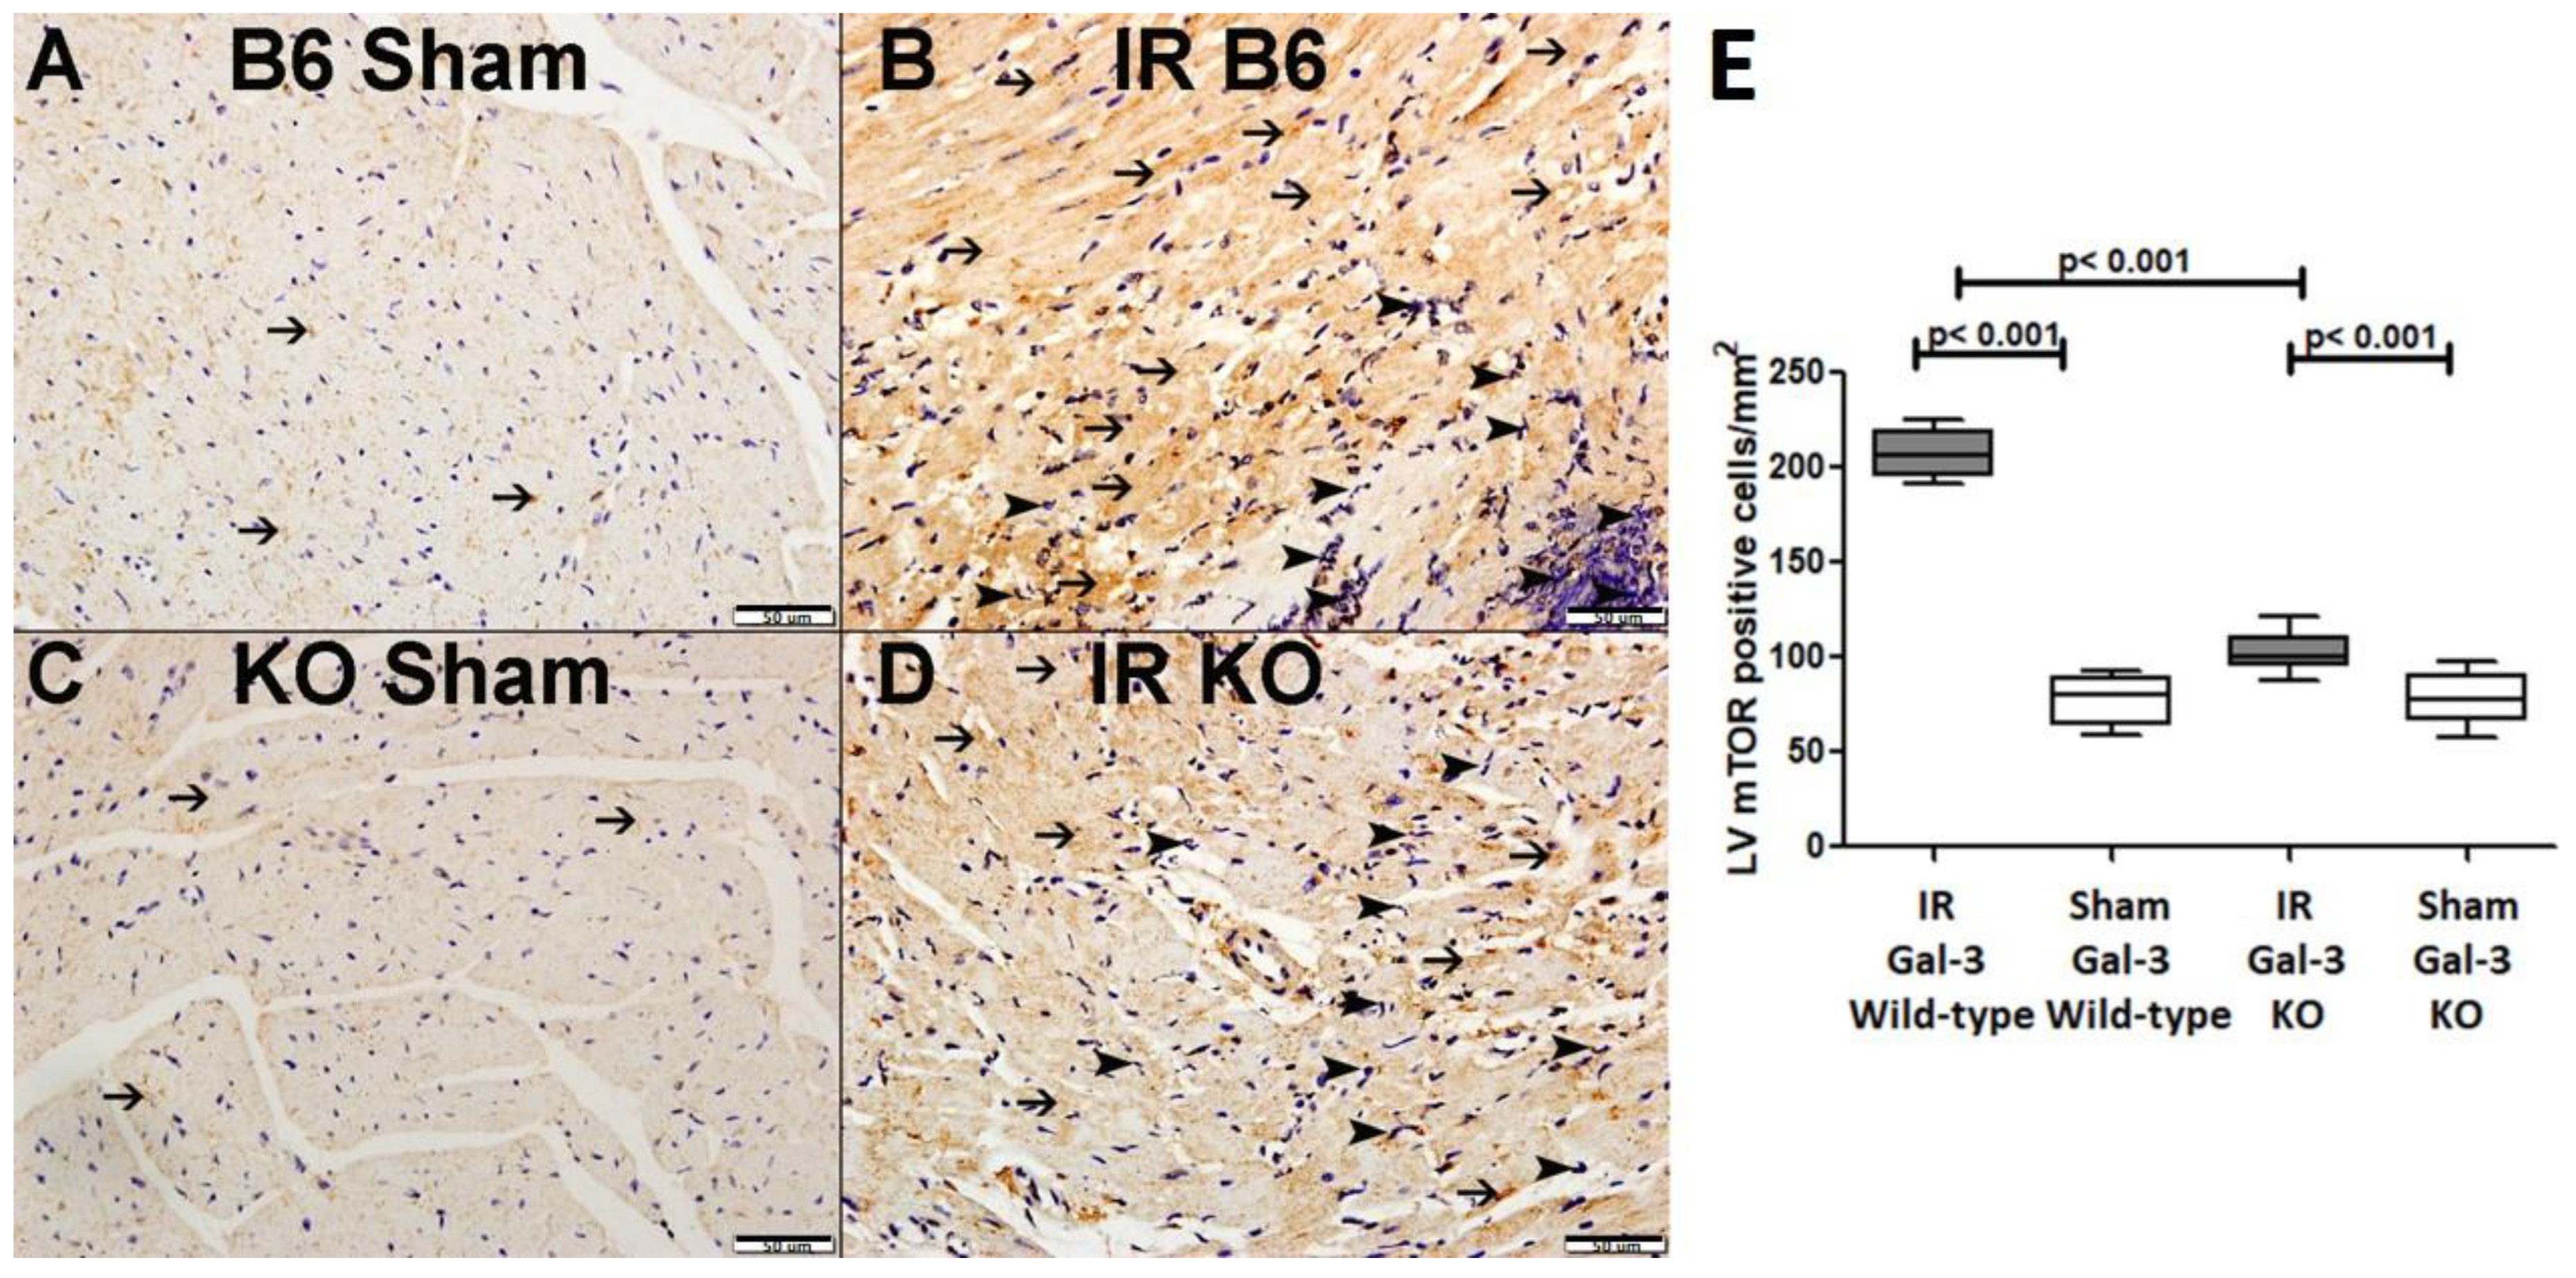
3.3.3. p-mTOR
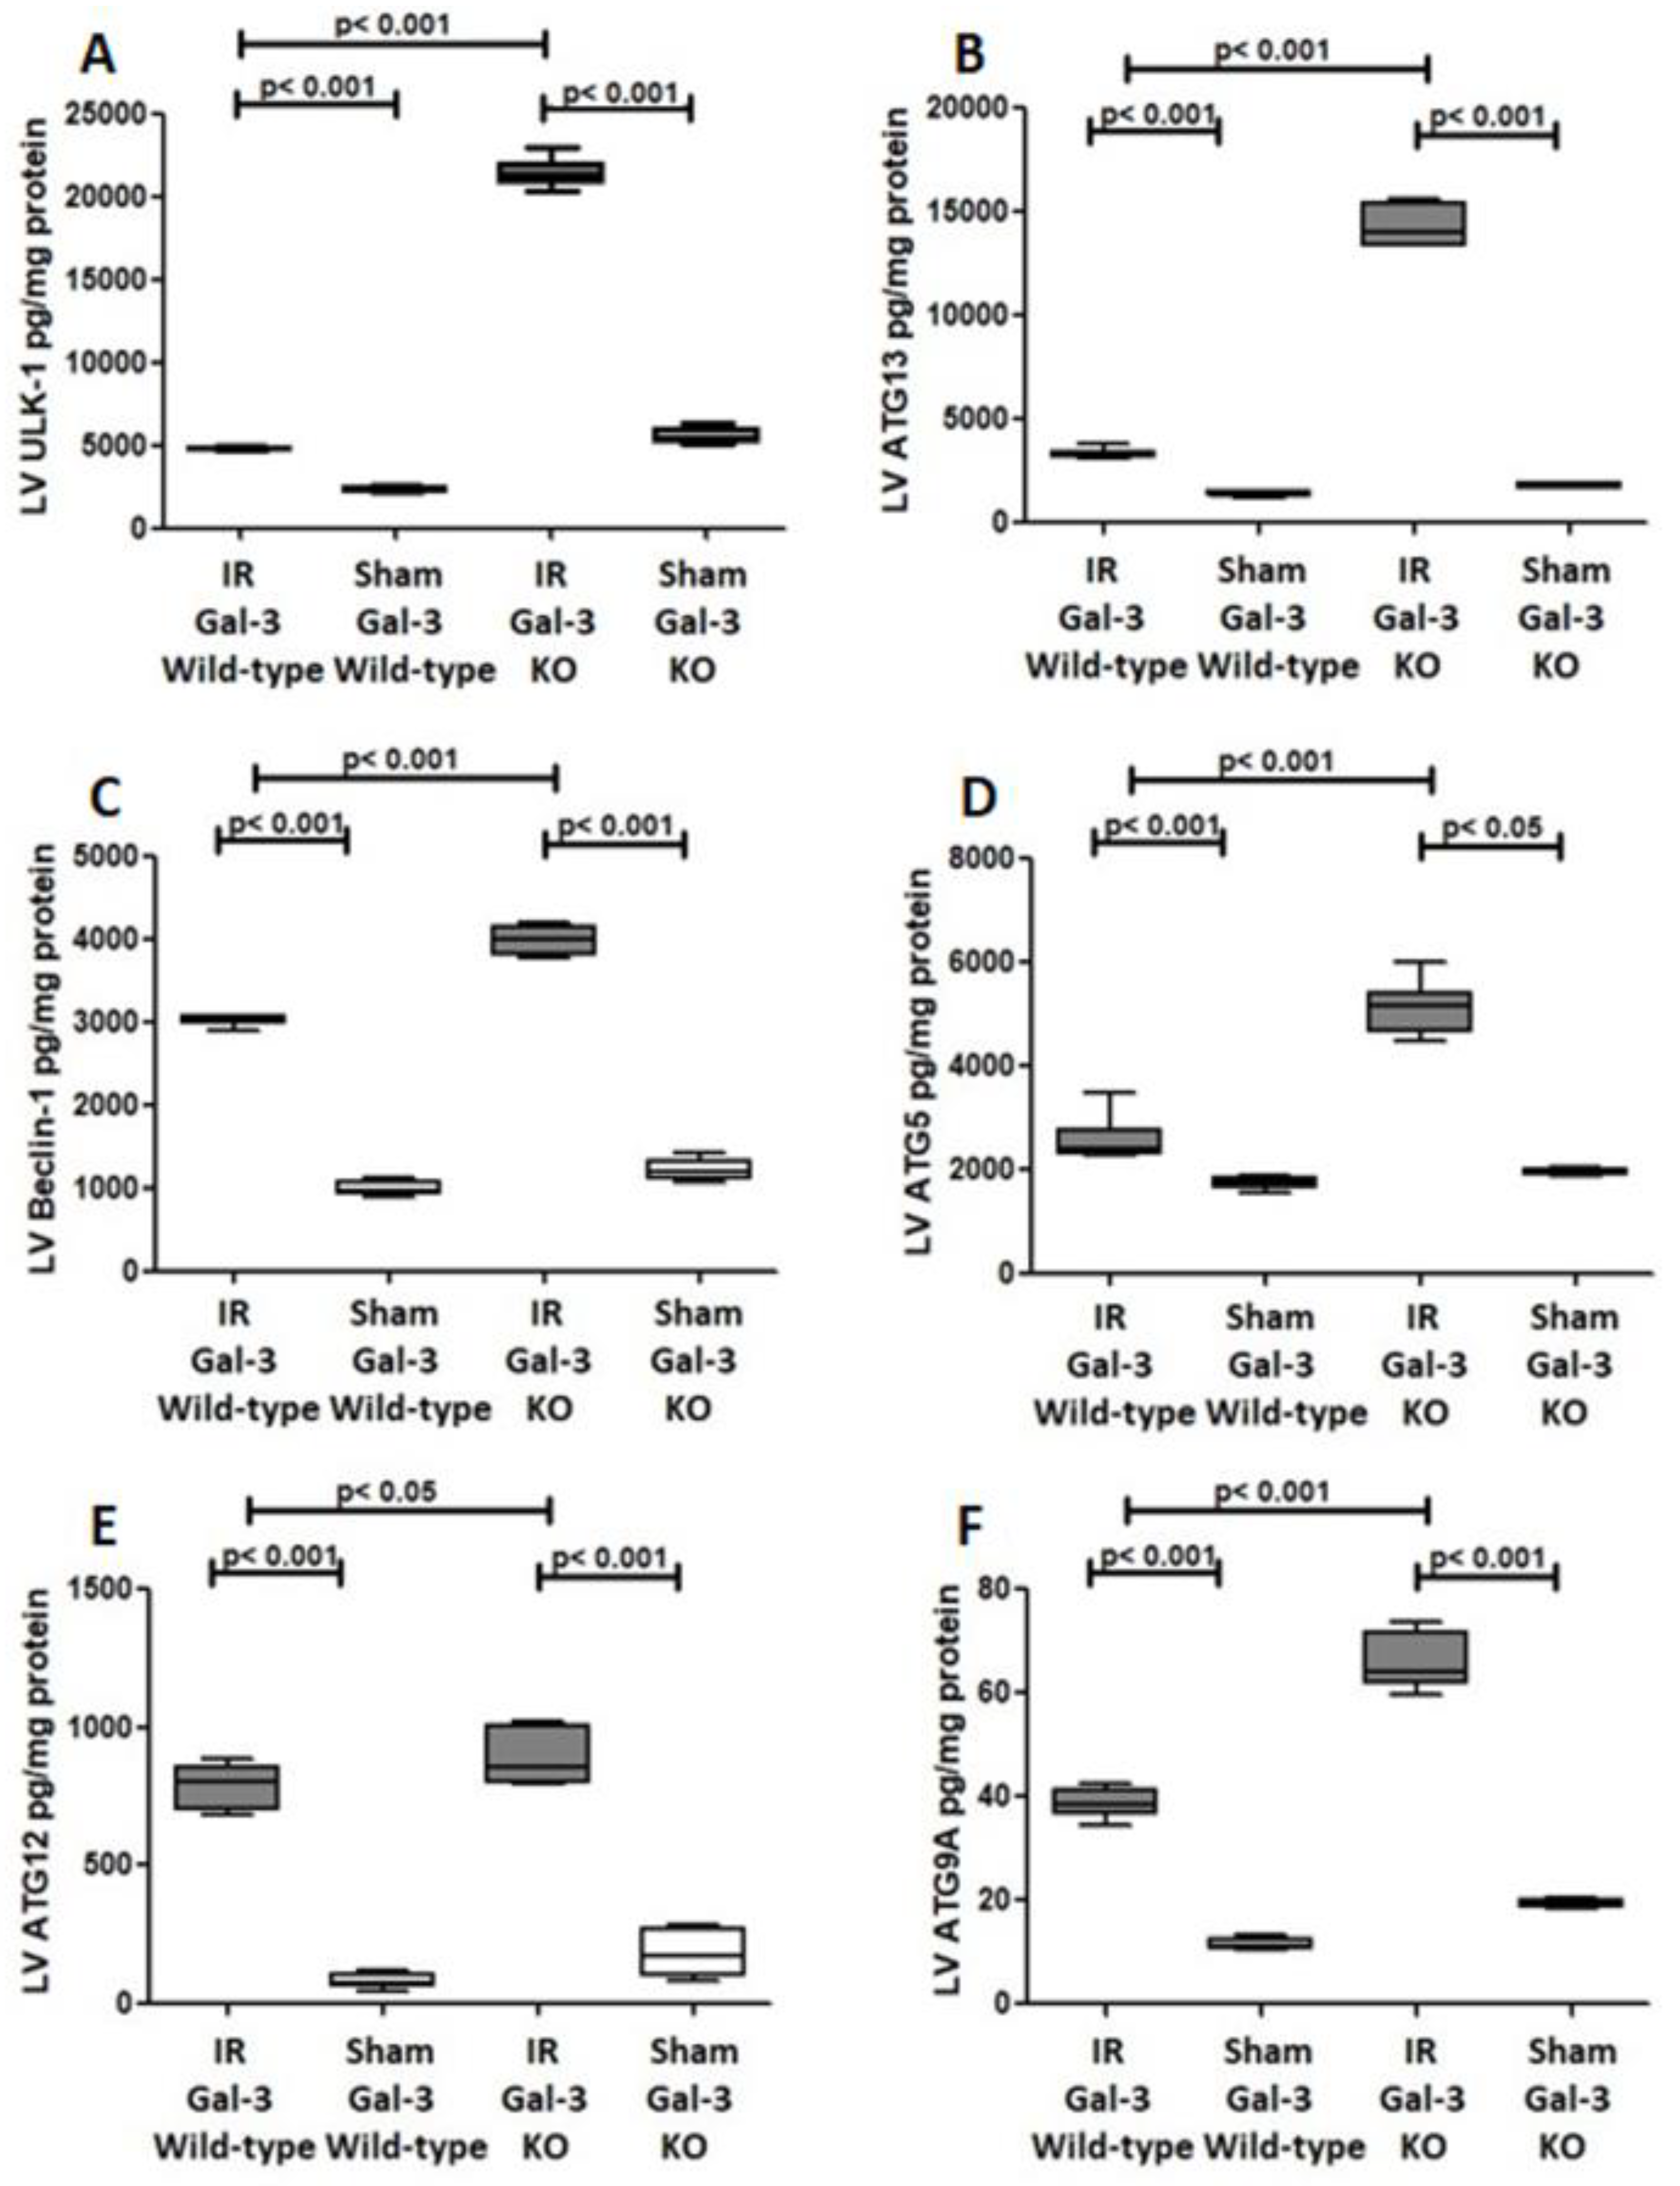
3.3.4. ULK-1
3.3.5. ATG13
3.3.6. Beclin1
3.3.7. ATG5
3.3.8. ATG 12
3.3.9. ATG9A
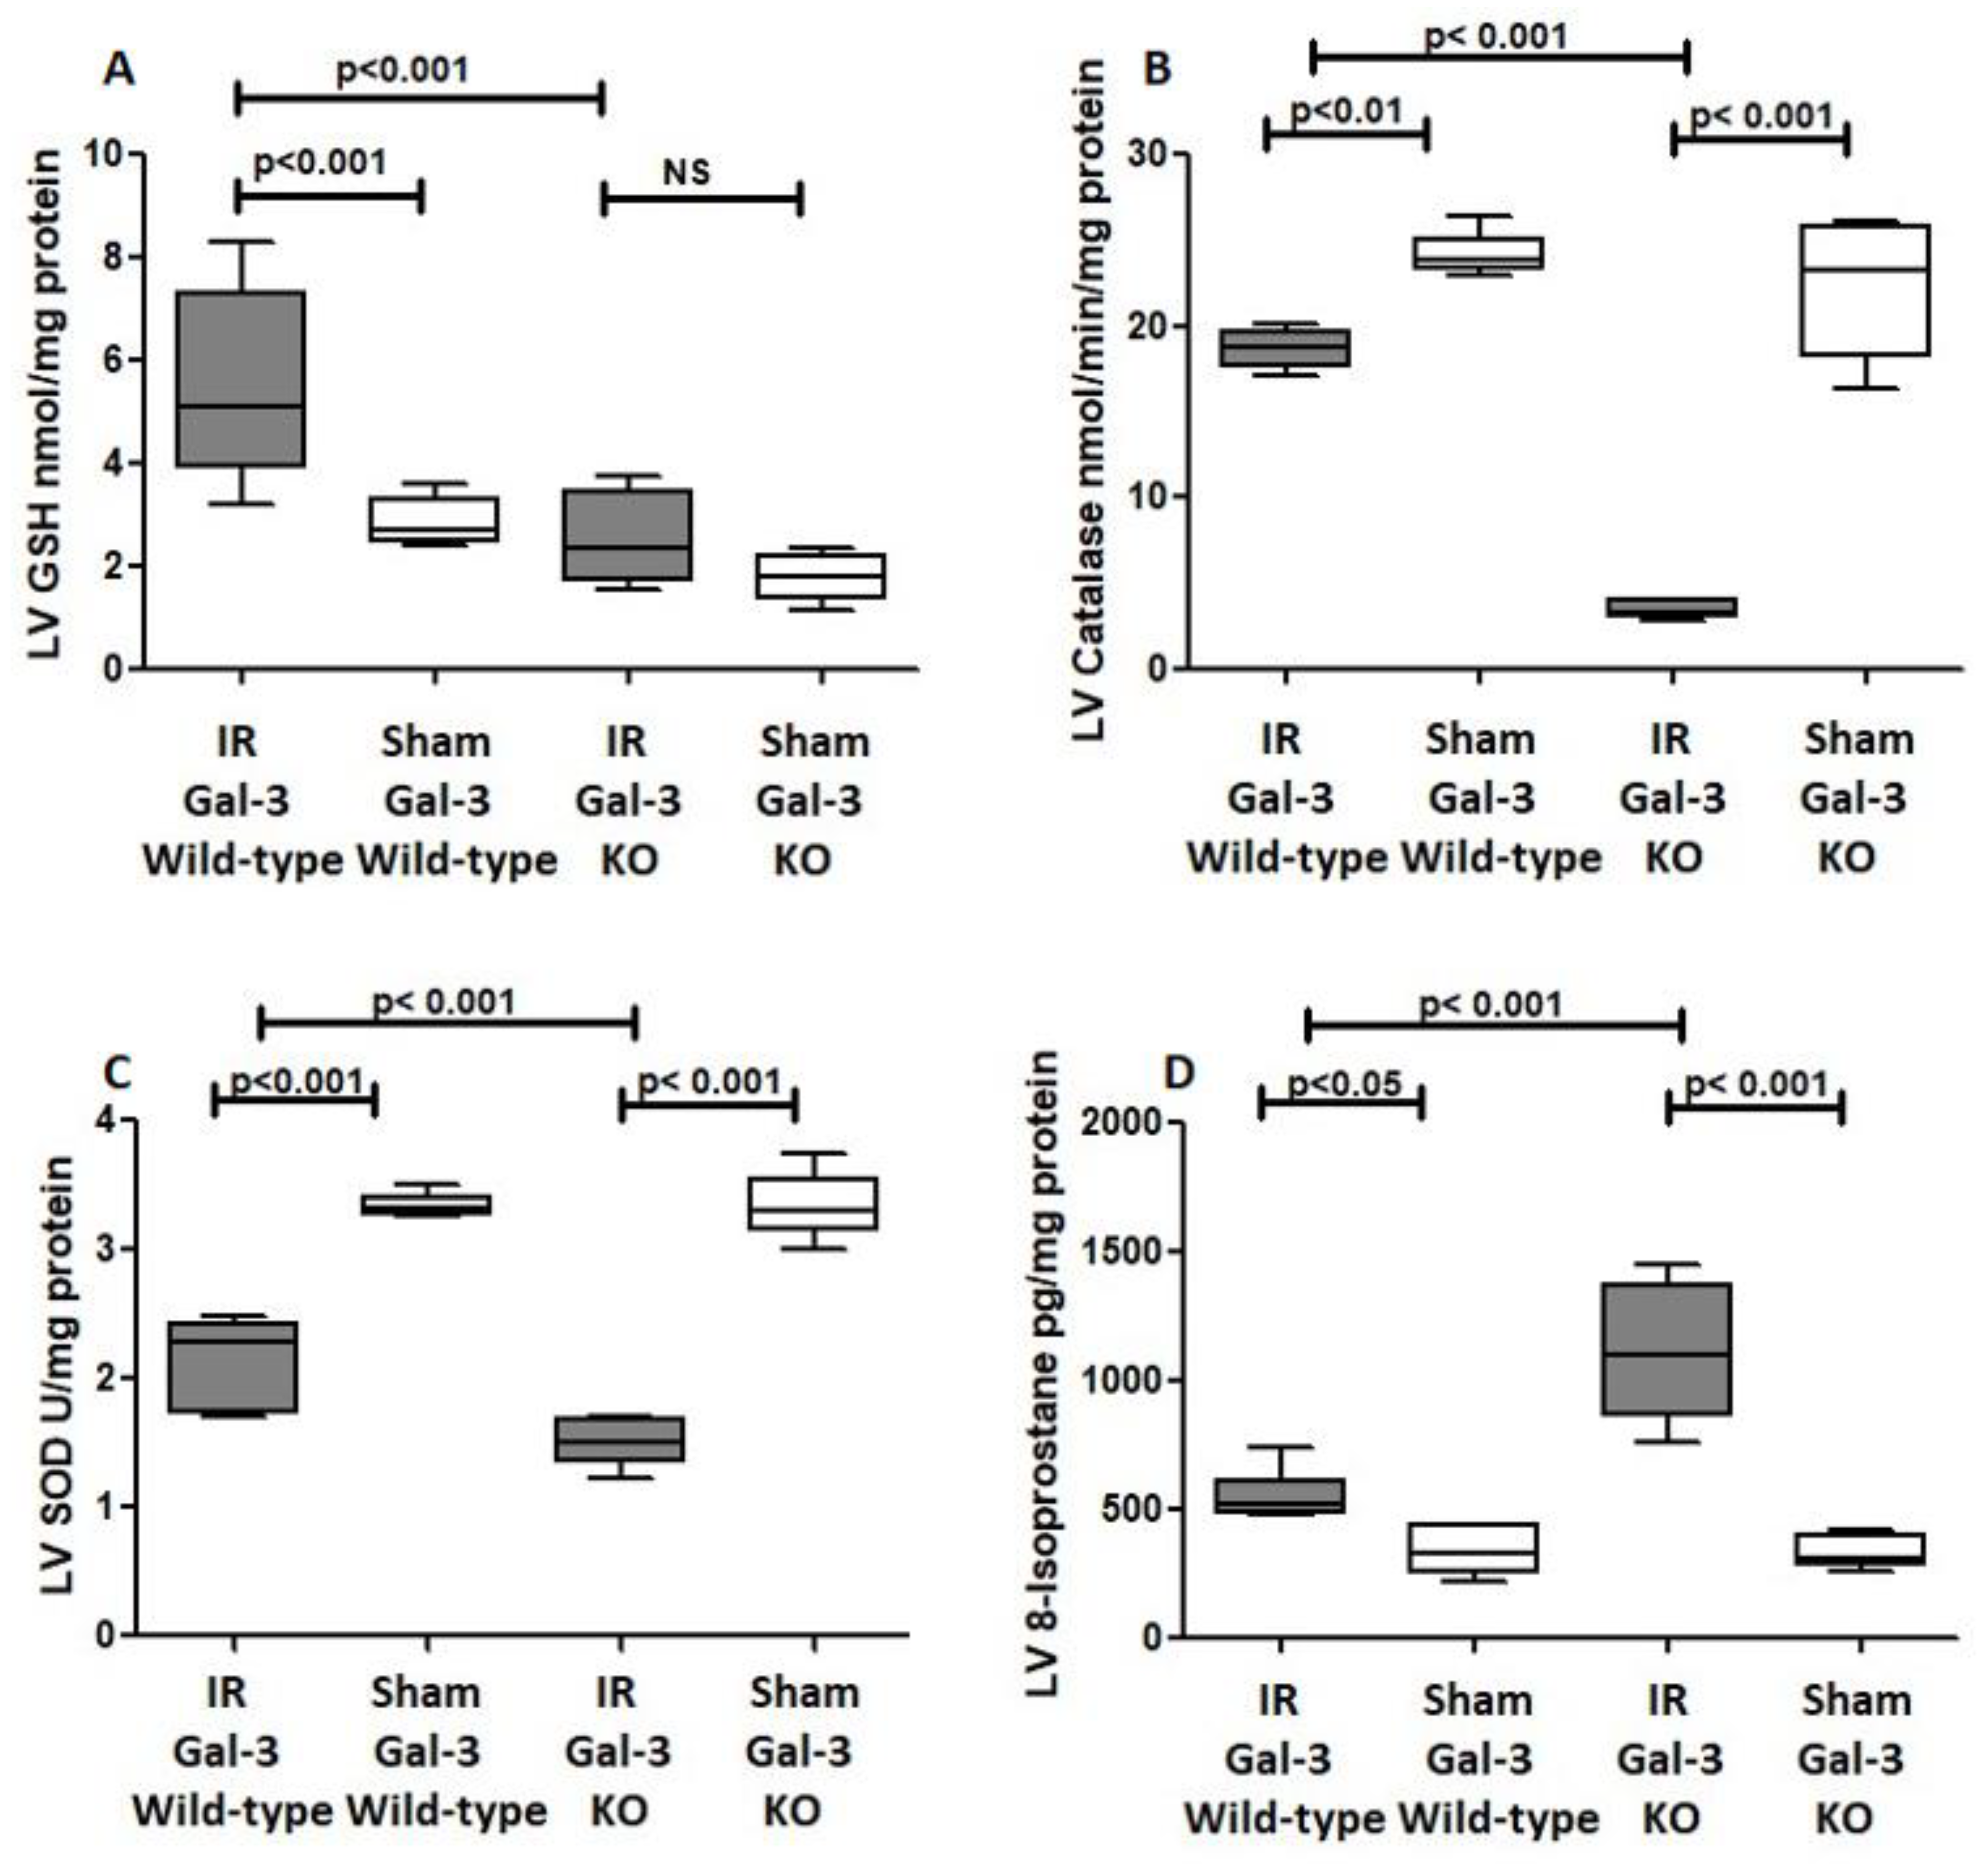
3.4. GAL-3 Has an Antioxidant Effect in IR Injury
3.4.1. GSH
3.4.2. Catalase
3.4.3. SOD
3.4.4. 8-Isoproatane
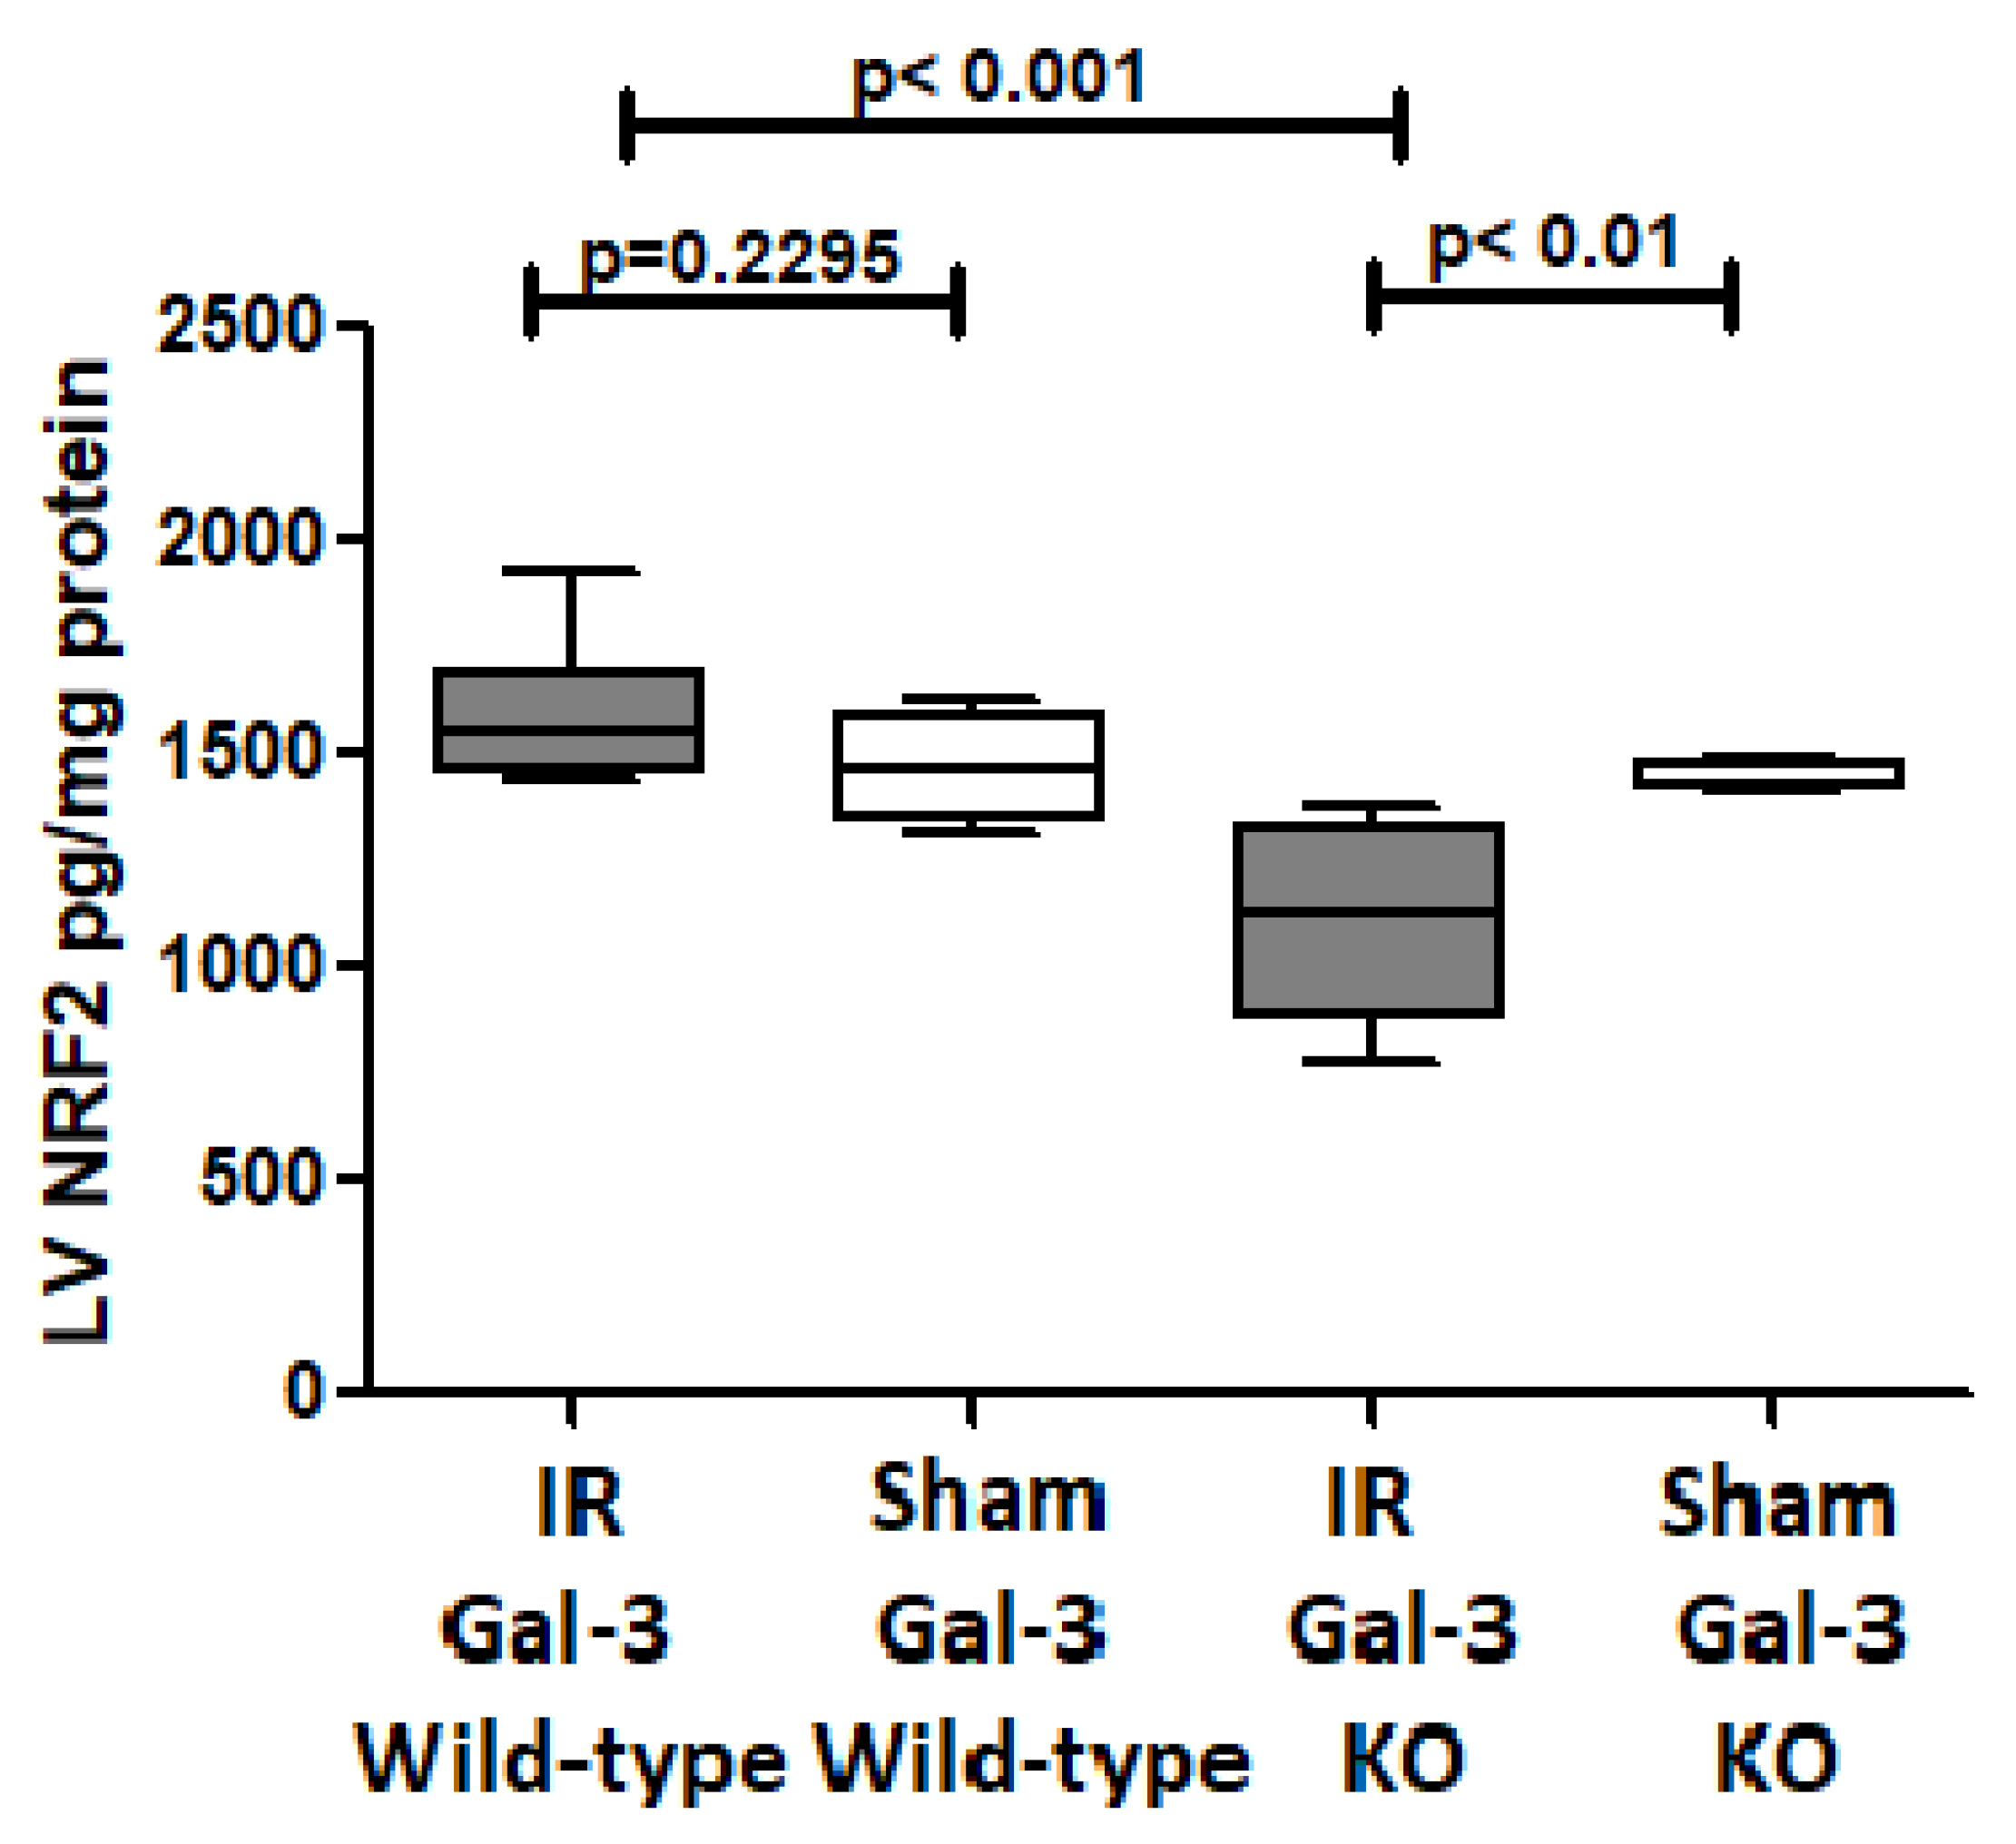
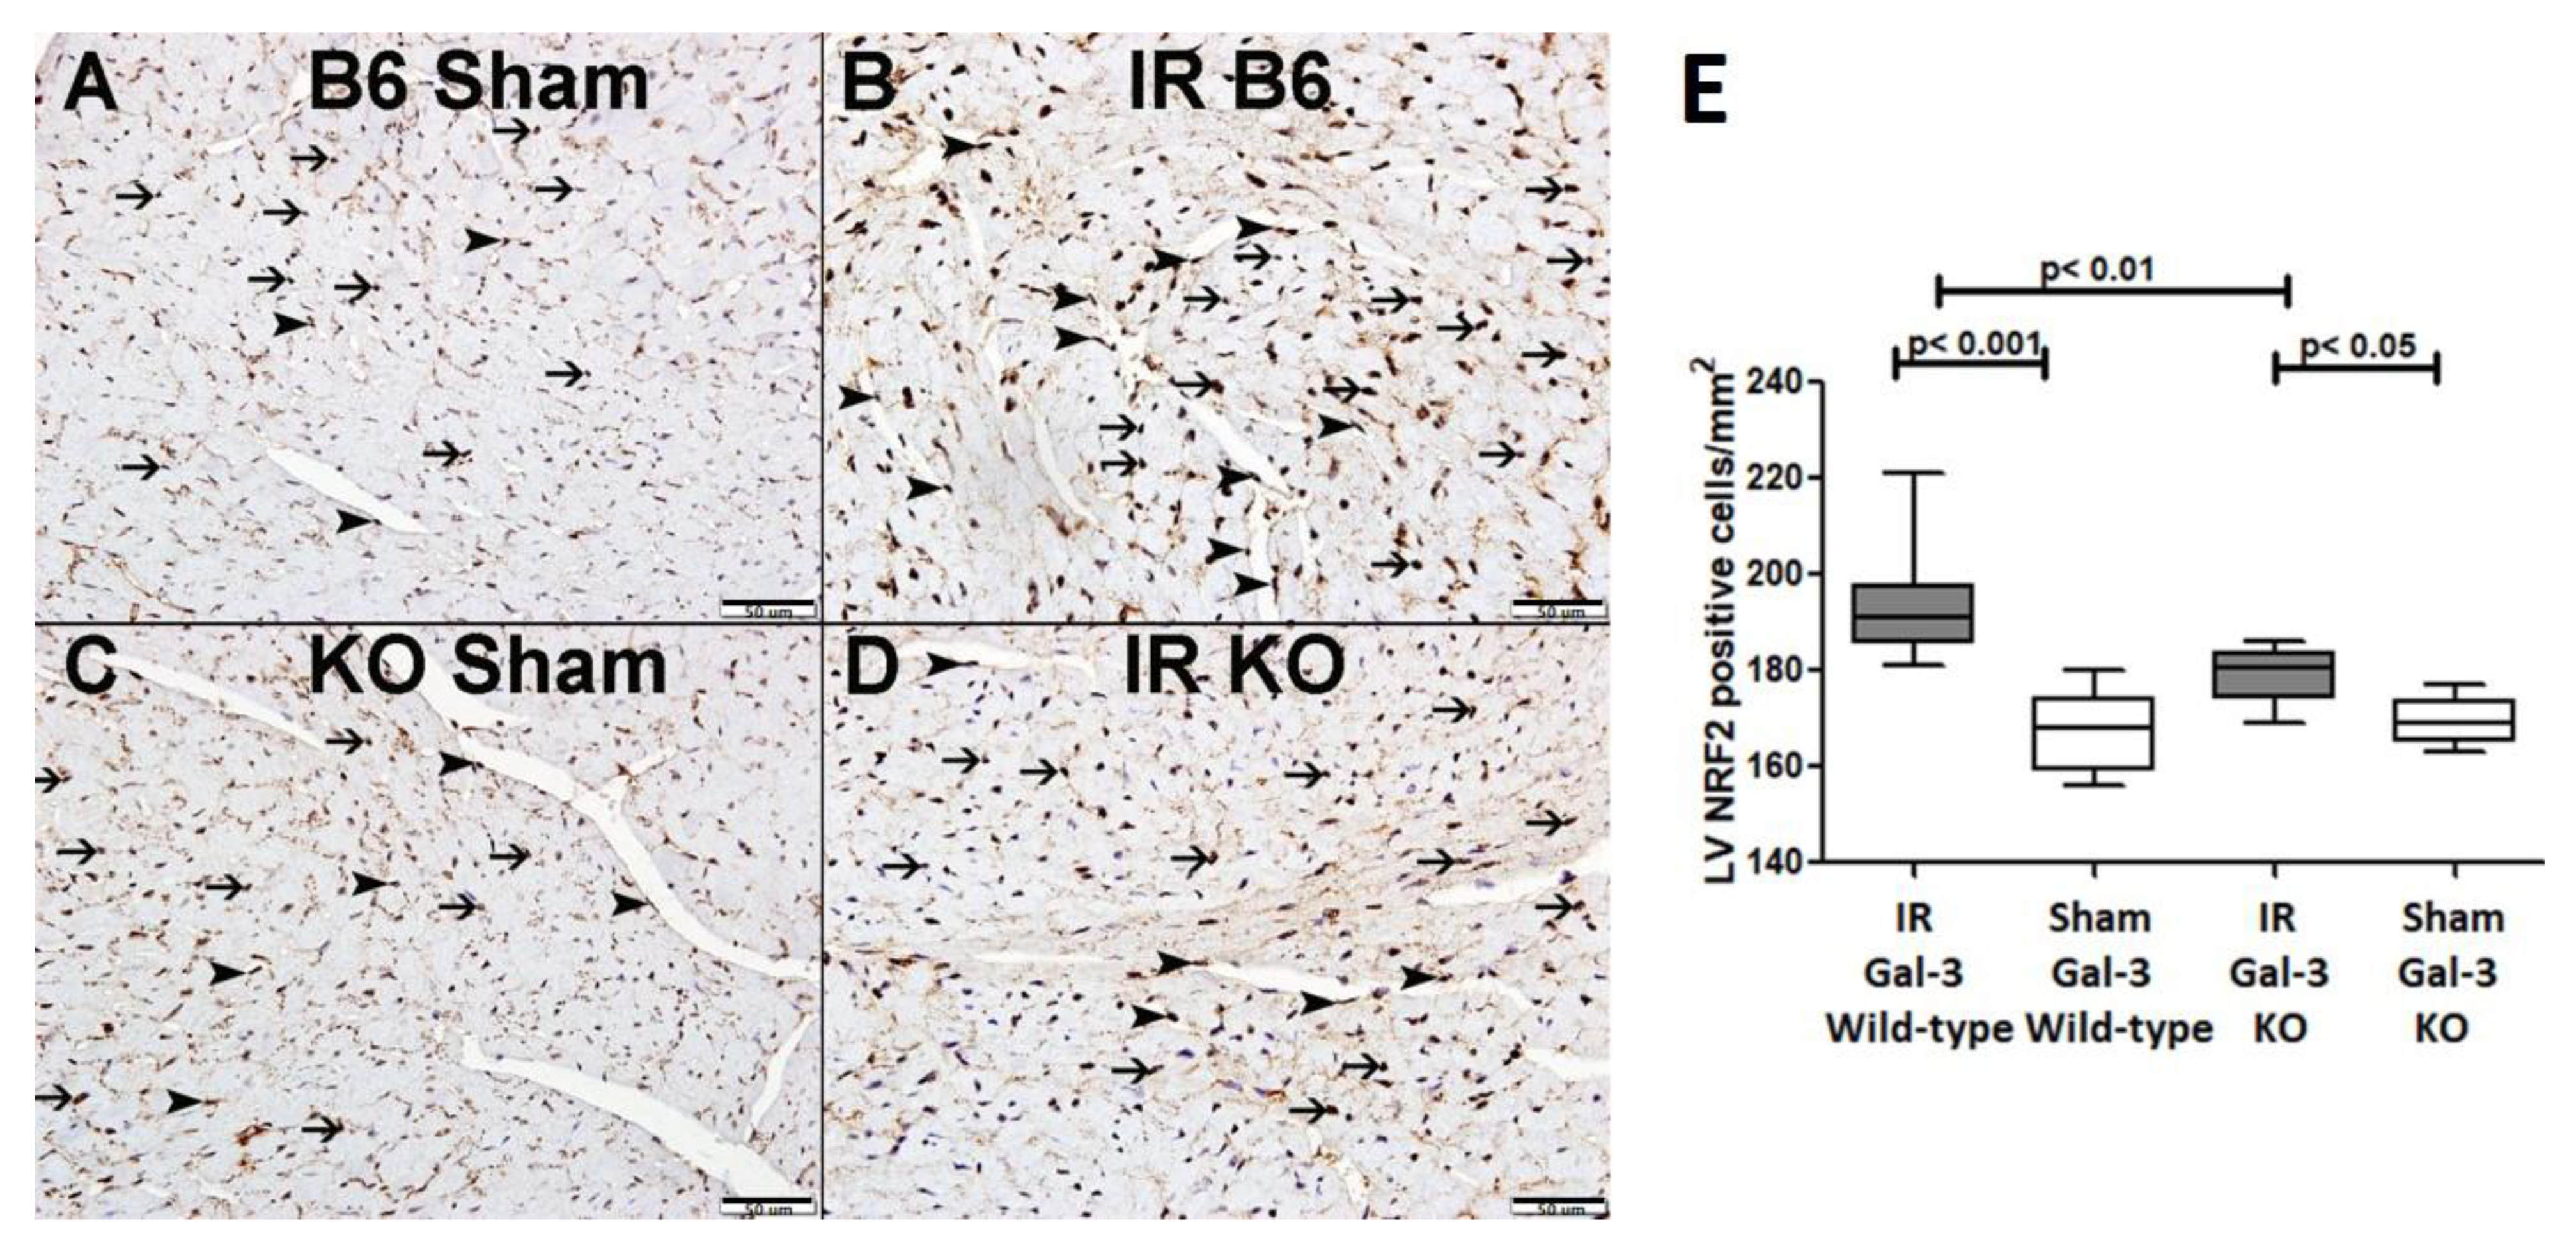
3.4.5. NRF2
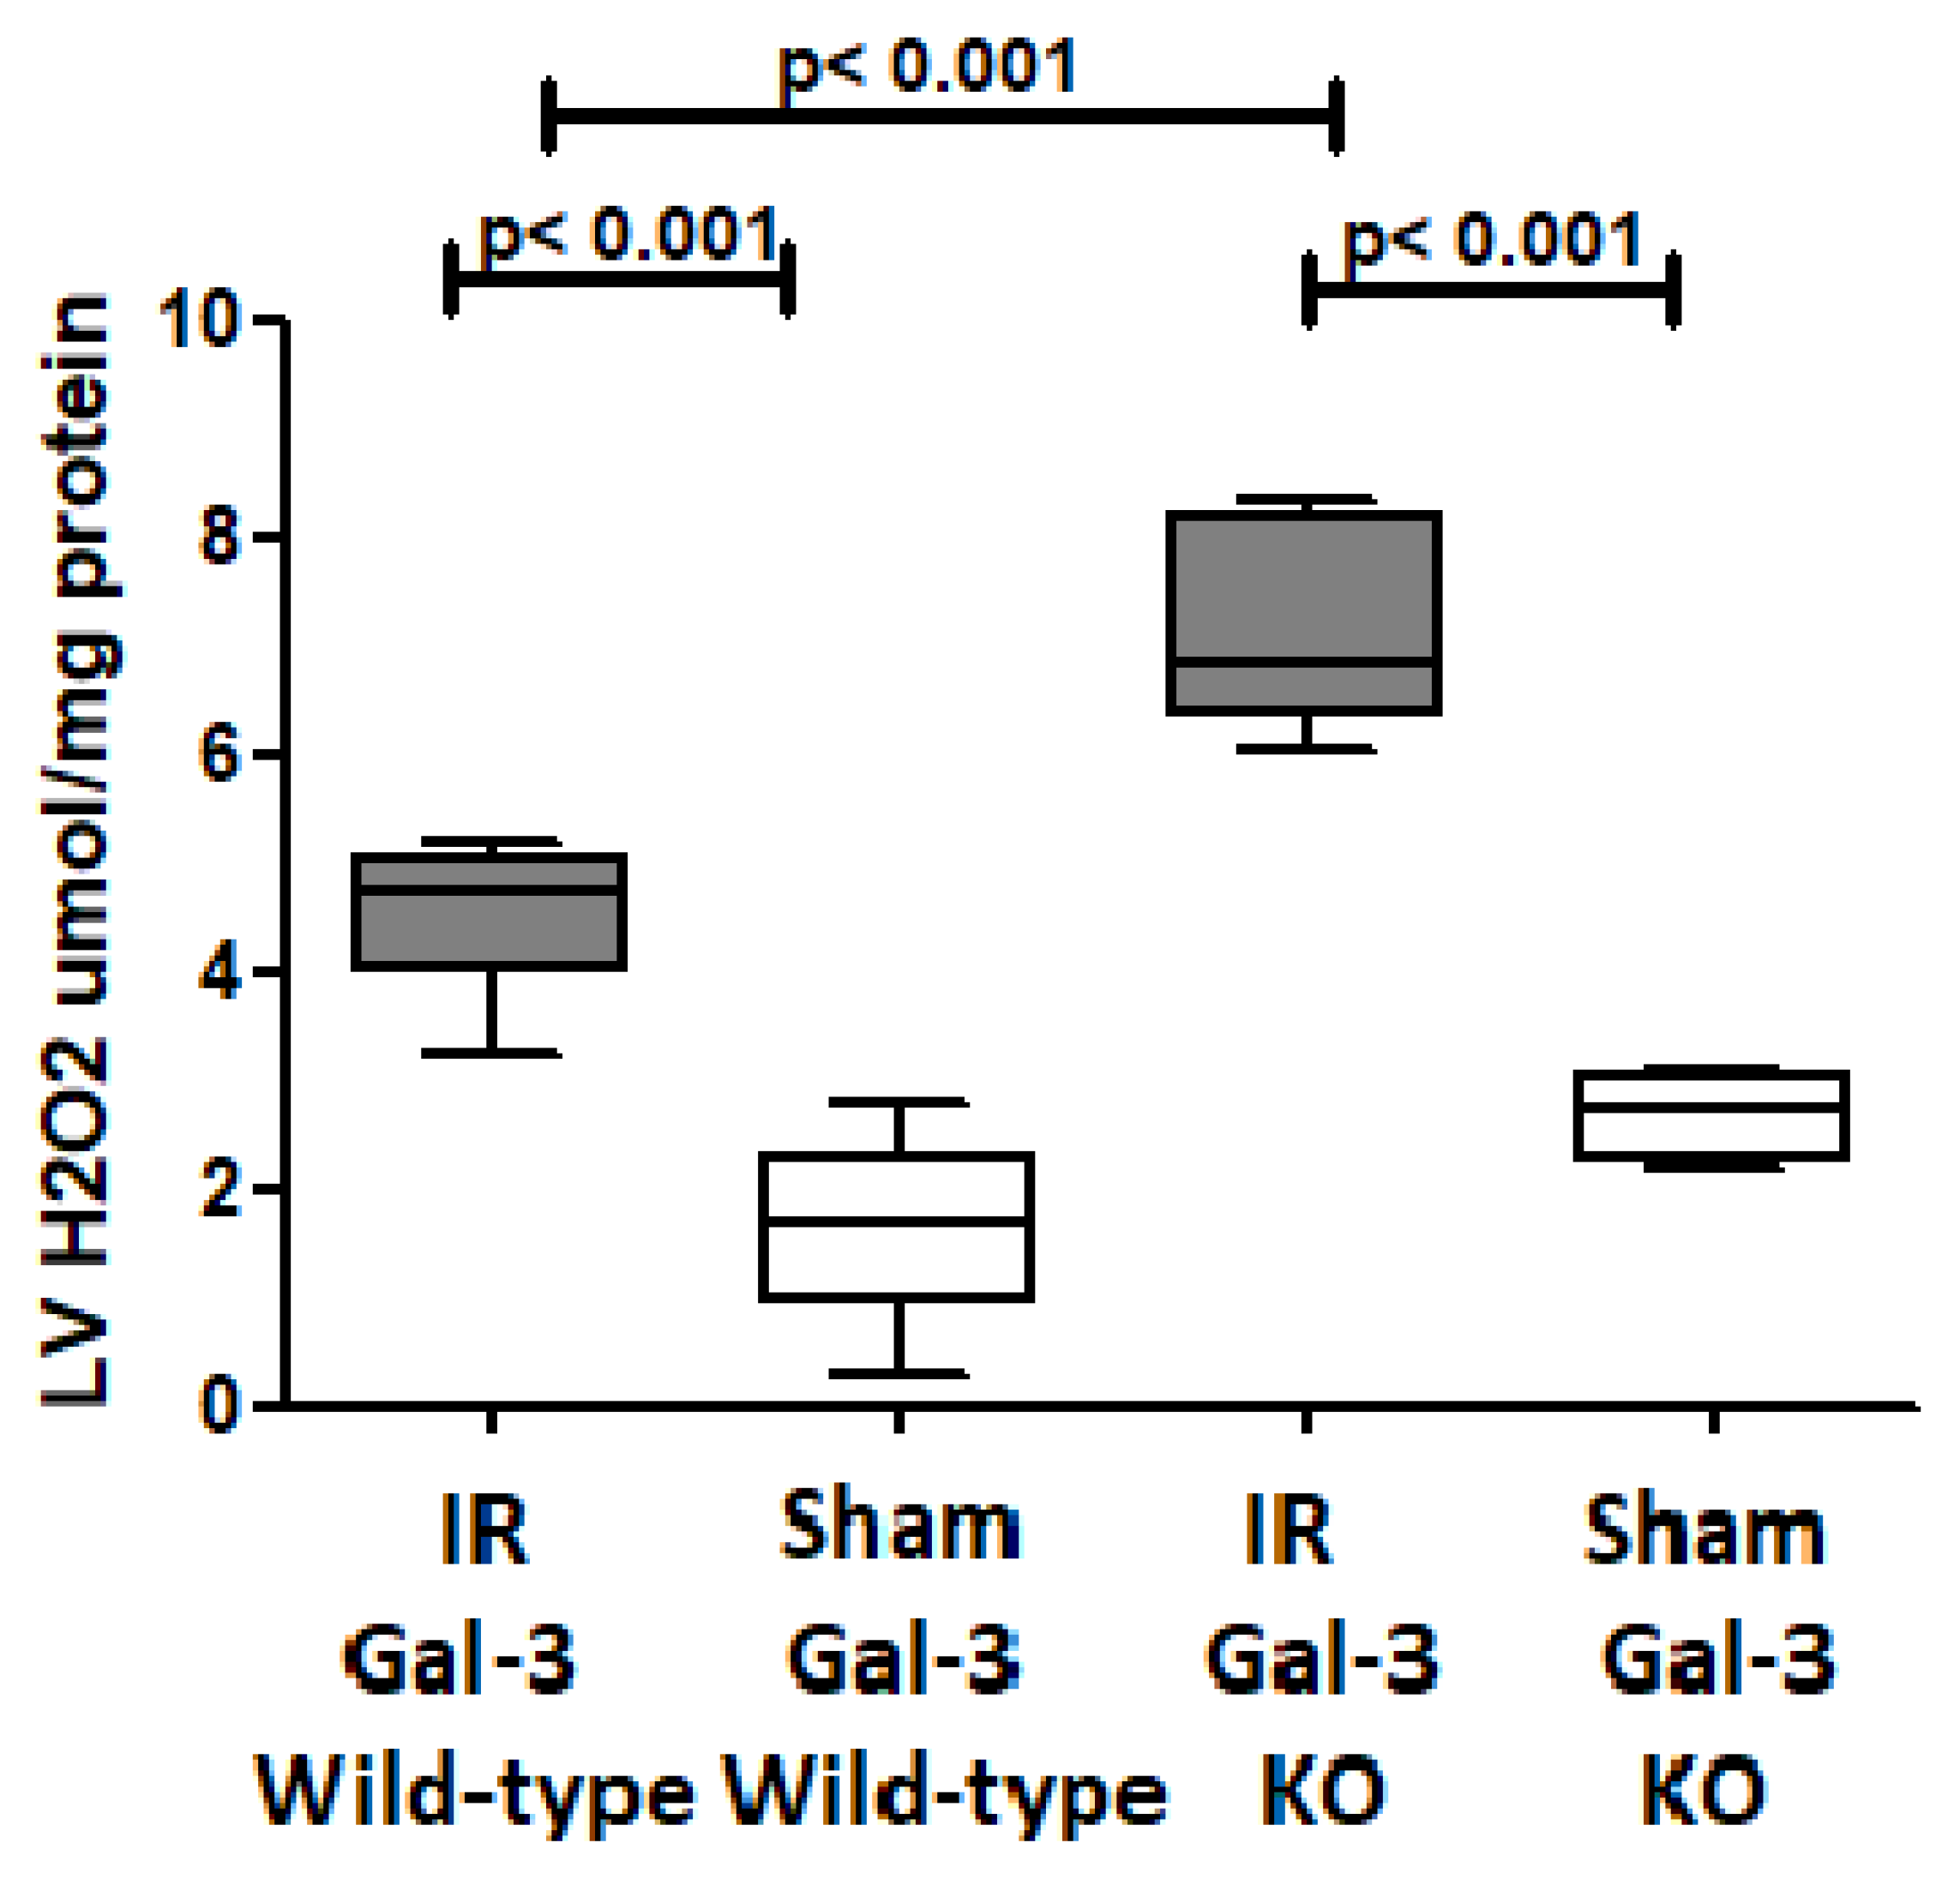
3.4.6. H2O2
4. Discussion
5. Conclusions
Author Contributions
Funding
Institutional Review Board Statement
Informed Consent Statement
Data Availability Statement
Acknowledgments
Conflicts of Interest
References
- Piper, H.M.; García-Dorado, D.; Ovize, M. A fresh look at reperfusion injury. Cardiovasc. Res. 1998, 38, 291–300. [Google Scholar] [CrossRef] [PubMed]
- Mizushima, N.; Levine, B.; Cuervo, A.M.; Klionsky, D.J. Autophagy fights disease through cellular self-digestion. Nature 2008, 451, 1069–1075. [Google Scholar] [CrossRef] [PubMed]
- Ma, S.; Wang, Y.; Chen, Y.; Cao, F. The role of the autophagy in myocardial ischemia/reperfusion injury. Biochim. Biophys. Acta 2015, 1852, 271–276. [Google Scholar] [CrossRef] [PubMed]
- Xie, M.; Morales, C.R.; Lavandero, S.; Hill, J.A. Tuning flux: Autophagy as a target of heart disease therapy. Curr. Opin. Cardiol. 2011, 26, 216–222. [Google Scholar] [CrossRef] [PubMed]
- Ma, X.; Liu, H.; Foyil, S.R.; Godar, R.J.; Weinheimer, C.J.; Diwan, A. Autophagy is impaired in cardiac ischemia-reperfusion injury. Autophagy 2012, 8, 1394–1396. [Google Scholar] [CrossRef]
- Gustafsson, A.B.; Gottlieb, R.A. Autophagy in ischemic heart disease. Circ. Res. 2009, 104, 150–158. [Google Scholar] [CrossRef]
- Egan, D.; Kim, J.; Shaw, R.J.; Guan, K.L. The autophagy initiating kinase ULK1 is regulated via opposing phosphorylation by AMPK and mTOR. Autophagy 2011, 7, 643–644. [Google Scholar] [CrossRef]
- Brady, N.R.; Hamacher-Brady, A.; Yuan, H.; Gottlieb, R.A. The autophagic response to nutrient deprivation in the hl-1 cardiac myocyte is modulated by Bcl-2 and sarco/endoplasmic reticulum calcium stores. FEBS J. 2007, 274, 3184–3197. [Google Scholar] [CrossRef]
- Hariharan, N.; Zhai, P.; Sadoshima, J. Oxidative stress stimulates autophagic flux during ischemia/reperfusion. Antioxid. Redox. Signal 2011, 14, 2179–2190. [Google Scholar] [CrossRef]
- Scherz-Shouval, R.; Elazar, Z. ROS, mitochondria and the regulation of autophagy. Trends. Cell Biol. 2007, 17, 422–427. [Google Scholar] [CrossRef]
- Decker, R.S.; Wildenthal, K. Lysosomal alterations in hypoxic and reoxygenated hearts. I. Ultrastructural and cytochemical changes. Am. J. Pathol. 1980, 98, 425–444. [Google Scholar] [PubMed]
- Sciarretta, S.; Hariharan, N.; Monden, Y.; Zablocki, D.; Sadoshima, J. Is autophagy in response to ischemia and reperfusion protective or detrimental for the heart? Pediatr. Cardiol. 2011, 32, 275–281. [Google Scholar] [CrossRef] [PubMed]
- Houzelstein, D.; Gonçalves, I.R.; Fadden, A.J.; Sidhu, S.S.; Cooper, D.N.; Drickamer, K.; Leffler, H.; Poirier, F. Phylogenetic analysis of the vertebrate galectin family. Mol. Biol. Evol. 2004, 21, 1177–1187. [Google Scholar] [CrossRef] [PubMed]
- Moutsatsos, I.K.; Wade, M.; Schindler, M.; Wang, J.L. Endogenous lectins from cultured cells: Nuclear localization of carbohydrate-binding protein 35 in proliferating 3T3 fibroblasts. Proc. Natl. Acad. Sci. USA 1987, 84, 6452–6456. [Google Scholar] [CrossRef] [PubMed]
- Kim, S.J.; Chun, K.H. Non-classical role of Galectin-3 in cancer progression: Translocation to nucleus by carbohydrate-recognition independent manner. BMB Rep. 2020, 53, 173–180. [Google Scholar] [CrossRef]
- Hamann, K.K.; Cowles, E.A.; Wang, J.L.; Anderson, R.L. Expression of carbohydrate binding protein 35 in human fibroblasts: Variations in the levels of mRNA, protein, and isoelectric species as a function of replicative competence. Exp. Cell Res. 1991, 196, 82–91. [Google Scholar] [CrossRef]
- Hubert, M.; Wang, S.Y.; Wang, J.L.; Sève, A.P.; Hubert, J. Intranuclear distribution of galectin-3 in mouse 3T3 fibroblasts: Comparative analyses by immunofluorescence and immunoelectron microscopy. Exp. Cell Res. 1995, 220, 397–406. [Google Scholar] [CrossRef]
- Openo, K.P.; Kadrofske, M.M.; Patterson, R.J.; Wang, J.L. Galectin-3 expression and subcellular localization in senescent human fibroblasts. Exp. Cell Res. 2000, 255, 278–290. [Google Scholar] [CrossRef]
- Dumić, J.; Lauc, G.; Hadzija, M.; Flögel, M. Transfer to in vitro conditions influences expression and intracellular distribution of galectin-3 in murine peritoneal macrophages. Z. Naturforsch. C J. BioSci. 2000, 55, 261–266. [Google Scholar] [CrossRef]
- Lotz, M.M.; Andrews, C.W., Jr.; Korzelius, C.A.; Lee, E.C.; Steele, G.D., Jr.; Clarke, A.; Mercurio, A.M. Decreased expression of Mac-2 (carbohydrate binding protein 35) and loss of its nuclear localization are associated with the neoplastic progression of colon carcinoma. Proc. Natl. Acad. Sci. USA 1993, 90, 3466–3470. [Google Scholar] [CrossRef]
- Sanjuán, X.; Fernández, P.L.; Castells, A.; Castronovo, V.; van den Brule, F.; Liu, F.T.; Cardesa, A.; Campo, E. Differential expression of galectin 3 and galectin 1 in colorectal cancer progression. Gastroenterology 1997, 113, 1906–1915. [Google Scholar] [CrossRef] [PubMed]
- Honjo, Y.; Inohara, H.; Akahani, S.; Yoshii, T.; Takenaka, Y.; Yoshida, J.; Hattori, K.; Tomiyama, Y.; Raz, A.; Kubo, T. Expression of cytoplasmic galectin-3 as a prognostic marker in tongue carcinoma. Clin. Cancer Res. 2000, 6, 4635–4640. [Google Scholar] [PubMed]
- van den Brûle, F.A.; Waltregny, D.; Liu, F.T.; Castronovo, V. Alteration of the cytoplasmic/nuclear expression pattern of galectin-3 correlates with prostate carcinoma progression. Int. J. Cancer 2000, 89, 361–367. [Google Scholar] [CrossRef] [PubMed]
- Puglisi, F.; Minisini, A.M.; Barbone, F.; Intersimone, D.; Aprile, G.; Puppin, C.; Damante, G.; Paron, I.; Tell, G.; Piga, A.; et al. Galectin-3 expression in non-small cell lung carcinoma. Cancer Lett. 2004, 212, 233–239. [Google Scholar] [CrossRef] [PubMed]
- Paron, I.; Scaloni, A.; Pines, A.; Bachi, A.; Liu, F.T.; Puppin, C.; Pandolfi, M.; Ledda, L.; Di Loreto, C.; Damante, G.; et al. Nuclear localization of Galectin-3 in transformed thyroid cells: A role in transcriptional regulation. Biochem. Biophys. Res. Commun. 2003, 302, 545–553. [Google Scholar] [CrossRef]
- Bao, Q.; Hughes, R.C. Galectin-3 expression and effects on cyst enlargement and tubulogenesis in kidney epithelial MDCK cells cultured in three-dimensional matrices in vitro. J. Cell Sci. 1995, 108, 2791–2800. [Google Scholar] [CrossRef]
- Winyard, P.J.; Bao, Q.; Hughes, R.C.; Woolf, A.S. Epithelial galectin-3 during human nephrogenesis and childhood cystic diseases. J. Am. Soc. Nephrol. 1997, 8, 1647–1657. [Google Scholar] [CrossRef]
- Oka, N.; Nakahara, S.; Takenaka, Y.; Fukumori, T.; Hogan, V.; Kanayama, H.O.; Yanagawa, T.; Raz, A. Galectin-3 inhibits tumor necrosis factor-related apoptosis-inducing ligand-induced apoptosis by activating Akt in human bladder carcinoma cells. Cancer Res. 2005, 165, 7546–7553. [Google Scholar] [CrossRef]
- Xue, J.; Gao, X.; Fu, C.; Cong, Z.; Jiang, H.; Wang, W.; Chen, T.; Wei, Q.; Qin, C. Regulation of galectin-3-induced apoptosis of Jurkat cells by both O-glycans and N-glycans on CD45. FEBS Lett. 2013, 587, 3986–3994. [Google Scholar] [CrossRef]
- Bustos, S.O.; da Silva Pereira, G.J.; de Freitas Saito, R.; Gil, C.D.; Zanatta, D.B.; Smaili, S.S.; Chammas, R. Galectin-3 sensitized melanoma cell lines to vemurafenib (PLX4032) induced cell death through prevention of autophagy. Oncotarget 2018, 9, 14567–14579. [Google Scholar] [CrossRef]
- Pei, C.; Wang, X.; Lin, Y.; Fang, L.; Meng, S. Inhibition of Galectin-3 Alleviates Cigarette Smoke Extract-Induced Autophagy and Dysfunction in Endothelial Progenitor Cells. Oxid. Med. Cell Longev. 2019, 2019, 7252943. [Google Scholar] [CrossRef] [PubMed]
- Weng, I.C.; Chen, H.L.; Lo, T.H.; Lin, W.H.; Chen, H.Y.; Hsu, D.K.; Liu, F.T. Cytosolic galectin-3 and-8 regulate antibacterial autophagy through differential recognition of host glycans on damaged phagosomes. Glycobiology 2018, 28, 392–405. [Google Scholar] [CrossRef] [PubMed]
- Jena, K.K.; Kolapalli, S.P.; Mehto, S.; Nath, P.; Das, B.; Sahoo, P.K.; Ahad, A.; Syed, G.H.; Raghav, S.K.; Senapati, S.; et al. TRIM16 controls assembly and degradation of protein aggregates by modulating the p62-NRF2 axis and autophagy. EMBO J. 2018, 37, e98358. [Google Scholar] [CrossRef] [PubMed]
- Chen, W.T.; Zhang, F.; Zhao, X.Q.; Yu, B.; Wang, B.W. Galectin-3 and TRIM16 coregulate osteogenic differentiation of human bone marrow-derived mesenchymal stem cells at least partly via enhancing autophagy. Bone 2020, 131, 115059. [Google Scholar] [CrossRef] [PubMed]
- Liu, Y.; Li, L.; Wang, Z.; Zhang, J.; Zhou, Z. Myocardial ischemia-reperfusion injury; Molecular mechanisms and prevention. Microvasc. Res. 2023, 149, 104565. [Google Scholar] [CrossRef]
- Al-Salam, S.; Hashmi, S. Myocardial Ischemia Reperfusion Injury: Apoptotic, Inflammatory and Oxidative Stress Role of Galectin-3. Cell Physiol. Biochem. 2018, 50, 1123–1139. [Google Scholar] [CrossRef]
- Al-Salam, S.; Hashmi, S.; Jagadeesh, G.S.; Tariq, S. Galectin-3: A Cardiomyocyte Antiapoptotic Mediator at 24-Hour Post Myocardial Infarction. Cell Physiol. Biochem. 2020, 54, 287–302. [Google Scholar]
- Hashmi, S.; Al-Salam, S. Galectin-3 is expressed in the myocardium very early post-myocardial infarction. Cardiovasc. Pathol. 2015, 24, 213–223. [Google Scholar] [CrossRef]
- Xie, M.; Cho, G.W.; Kong, Y.; Li, D.L.; Altamirano, F.; Luo, X.; Morales, C.R.; Jiang, N.; Schiattarella, G.G.; May, H.I.; et al. Activation of Autophagic Flux Blunts Cardiac Ischemia/Reperfusion Injury. Circ. Res. 2021, 129, 435–450. [Google Scholar] [CrossRef]
- Debnath, J.; Gammoh, N.; Ryan, K.M. Autophagy and autophagy-related pathways in cancer. Nat. Rev. Mol. Cell Biol. 2023, 24, 560–575. [Google Scholar] [CrossRef]
- Lee, Y.K.; Lee, J.A. Role of the mammalian ATG8/LC3 family in autophagy: Differential and compensatory roles in the spatiotemporal regulation of autophagy. BMB. Rep. 2016, 49, 424–430. [Google Scholar] [CrossRef] [PubMed]
- Al-Salam, S.; Jagadeesh, G.S.; Sudhadevi, M.; Yasin, J. Galectin-3 and Autophagy in Renal Acute Tubular Necrosis. Int. J. Mol. Sci. 2024, 25, 3604. [Google Scholar] [CrossRef] [PubMed]
- Wang, S.; Li, H.; Yuan, M.; Fan, H.; Cai, Z. Role of AMPK in autophagy. Front. Physiol. 2022, 13, 1015500. [Google Scholar] [CrossRef] [PubMed]
- Saxton, R.A.; Sabatini, D.M. mTOR Signaling in Growth, Metabolism, and Disease. Cell 2017, 169, 361–371. [Google Scholar] [CrossRef] [PubMed]
- Mizushima, N.; Komatsu, M. Autophagy: Renovation of Cells and Tissues. Cell 2011, 147, 728–741. [Google Scholar] [CrossRef]
- Zhang, X.; Zhang, H.; Gao, Y.; Hao, Z.; Liu, J.; Zhou, G.; Liu, F.; Li, X.; Tong, C.; Wang, X. Forsythoside A regulates autophagy and apoptosis through the AMPK/mTOR/ULK1 pathway and alleviates inflammatory damage in MAC-T cells. Int. Immunopharmacol. 2023, 118, 110053. [Google Scholar] [CrossRef]
- Chen, X.; Yu, C.; Liu, X.; Liu, B.; Wu, X.; Wu, J.; Yan, D.; Han, L.; Tang, Z.; Yuan, X.; et al. Intracellular galectin-3 is a lipopolysaccharide sensor that promotes glycolysis through mTORC1 activation. Nat. Commun. 2022, 13, 7578. [Google Scholar] [CrossRef]
- Xiang, M.; Lu, Y.; Xin, L.; Gao, J.; Shang, C.; Jiang, Z.; Lin, H.; Fang, X.; Qu, Y.; Wang, Y.; et al. Role of Oxidative Stress in Reperfusion following Myocardial Ischemia and Its Treatments. Oxid. Med. Cell Longev. 2021, 2021, 6614009. [Google Scholar] [CrossRef]
- Ornatowski, W.; Lu, Q.; Yegambaram, M.; Garcia, A.E.; Zemskov, E.A.; Maltepe, E.; Fineman, J.R.; Wang, T.; Black, S.M. Complex interplay between autophagy and oxidative stress in the development of pulmonary disease. Redox Biol. 2020, 36, 101679. [Google Scholar] [CrossRef]
- Yun, H.R.; Jo, Y.H.; Kim, J.; Shin, Y.; Kim, S.S.; Choi, T.G. Roles of Autophagy in Oxidative Stress. Int. J. Mol. Sci. 2020, 21, 3289. [Google Scholar] [CrossRef]
- Scherz-Shouval, R.; Elazar, Z. Regulation of autophagy by ROS: Physiology and pathology. Trends Biochem. Sci. 2011, 36, 30–38. [Google Scholar] [CrossRef] [PubMed]
- Sies, H. Hydrogen peroxide as a central redox signaling molecule in physiological oxidative stress: Oxidative eustress. Redox Biol. 2017, 11, 613–619. [Google Scholar] [CrossRef] [PubMed]
- Scherz-Shouval, R.; Shvets, E.; Fass, E.; Shorer, H.; Gil, L.; Elazar, Z. Reactive oxygen species are essential for autophagy and specifically regulate the activity of Atg4. EMBO J. 2007, 26, 1749–1760. [Google Scholar] [CrossRef] [PubMed]
- Zhang, H.; Kong, X.; Kang, J.; Su, J.; Li, Y.; Zhong, J.; Sun, L. Oxidative stress induces parallel autophagy and mitochondria dysfunction in human glioma U251 cells. Toxicol. Sci. 2009, 110, 376–388. [Google Scholar] [CrossRef] [PubMed]
- Zmijewski, J.W.; Banerjee, S.; Bae, H.; Friggeri, A.; Lazarowski, E.R.; Abraham, E. Exposure to hydrogen peroxide induces oxidation and activation of AMP-activated protein kinase. J. Biol. Chem. 2010, 285, 33154–33164. [Google Scholar] [CrossRef]
- Alexander, A.; Cai, S.L.; Kim, J.; Nanez, A.; Sahin, M.; MacLean, K.H.; Inoki, K.; Guan, K.L.; Shen, J.; Person, M.D.; et al. ATM signals to TSC2 in the cytoplasm to regulate mTORC1 in response to ROS. Proc. Natl. Acad. Sci. USA 2010, 107, 4153–4158. [Google Scholar] [CrossRef]
- Matarrese, P.; Tinari, N.; Semeraro, M.L.; Natoli, C.; Iacobelli, S.; Malorni, W. Galectin-3 overexpression protects from cell damage and death by influencing mitochondrial homeostasis. FEBS Lett. 2000, 473, 311–315. [Google Scholar] [CrossRef]
- Mungai, P.T.; Waypa, G.B.; Jairaman, A.; Prakriya, M.; Dokic, D.; Ball, M.K.; Schumacker, P.T. Hypoxia triggers AMPK activation through reactive oxygen species-mediated activation of calcium release-activated calcium channels. Mol. Cell Biol. 2011, 31, 3531–3545. [Google Scholar] [CrossRef]
- Zhang, X.; Cheng, X.; Yu, L.; Yang, J.; Calvo, R.; Patnaik, S.; Hu, X.; Gao, Q.; Yang, M.; Lawas, M.; et al. MCOLN1 is a ROS sensor in lysosomes that regulates autophagy. Nat. Commun. 2016, 7, 12109. [Google Scholar] [CrossRef]
- Tonelli, C.; Chio, I.I.C.; Tuveson, D.A. Transcriptional Regulation by Nrf2. Antioxid. Redox Signal 2018, 29, 1727–1745. [Google Scholar] [CrossRef]
- Jiang, T.; Harder, B.; Rojo de la Vega, M.; Wong, P.K.; Chapman, E.; Zhang, D.D. p62 links autophagy and Nrf2 signaling. Free Radic. Biol. Med. 2015, 88, 199–204. [Google Scholar] [CrossRef]
- Lau, A.; Wang, X.J.; Zhao, F.; Villeneuve, N.F.; Wu, T.; Jiang, T.; Sun, Z.; White, E.; Zhang, D.D. A noncanonical mechanism of Nrf2 activation by autophagy deficiency:Direct interaction between Keap1 and p62. Mol. Cell Biol. 2010, 30, 3275–3285. [Google Scholar] [CrossRef] [PubMed]
- Tseng, P.C.; Chen, C.L.; Shan, Y.S.; Lin, C.F. An increase in galectin-3 causes cellular unresponsiveness to IFN-γ-induced signal transduction and growth inhibition in gastric cancer cells. Oncotarget 2016, 7, 15150–15160. [Google Scholar] [CrossRef] [PubMed]
- Fang, X.; Yu, S.X.; Lu, Y.; Bast, R.C., Jr.; Woodgett, J.R.; Mills, G.B. Phosphorylation and inactivation of glycogen synthase kinase 3 by protein kinase A. Proc. Natl. Acad. Sci. USA 2000, 97, 11960–11965. [Google Scholar] [CrossRef] [PubMed]
- Armagan, G.; Sevgili, E.; Gürkan, F.T.; Köse, F.A.; Bilgiç, T.; Dagcı, T.; Saso, L. Regulation of the Nrf2 Pathway by Glycogen Synthase Kinase-3β in MPP⁺-Induced Cell Damage. Molecules 2019, 24, 1377. [Google Scholar] [CrossRef]
- Liu, D.; Zhu, H.; Li, C. Galectins and galectin-mediated autophagy regulation: New insights into targeted cancer therapy. Biomark. Res. 2023, 11, 22. [Google Scholar] [CrossRef]
- Trimarchi, G.; Teresi, L.; Licordari, R.; Pingitore, A.; Pizzino, F.; Grimaldi, P.; Calabrò, D.; Liotta, P.; Micari, A.; de Gregorio, C.; et al. Transent Left Ventricular Dysfunction from Cardiomyopathies to Myocardial Viability: When and Why Cardiac Function Recovers. Biomedicines 2024, 12, 1051. [Google Scholar] [CrossRef]
- Mokhtari, B.; Abdoli-Shadbad, M.; Alihemmati, A.; Javadi, A.; Badalzadeh, R. Alpha-lipoic acid preconditioning plus ischemic postconditioning provides additional protection against myocardial reperfusion injury of diabetic rats: Modulation of autophagy and mitochondrial function. Mol. Biol. Rep. 2022, 49, 1773–1782. [Google Scholar] [CrossRef]

Disclaimer/Publisher’s Note: The statements, opinions and data contained in all publications are solely those of the individual author(s) and contributor(s) and not of MDPI and/or the editor(s). MDPI and/or the editor(s) disclaim responsibility for any injury to people or property resulting from any ideas, methods, instructions or products referred to in the content. |
© 2024 by the authors. Licensee MDPI, Basel, Switzerland. This article is an open access article distributed under the terms and conditions of the Creative Commons Attribution (CC BY) license (https://creativecommons.org/licenses/by/4.0/).
Share and Cite
Al-Salam, S.; Hashmi, S.; Jagadeesh, G.S.; Sudhadevi, M.; Awwad, A.; Nemmar, A. Early Cardiac Ischemia–Reperfusion Injury: Interactions of Autophagy with Galectin-3 and Oxidative Stress. Biomedicines 2024, 12, 2474. https://doi.org/10.3390/biomedicines12112474
Al-Salam S, Hashmi S, Jagadeesh GS, Sudhadevi M, Awwad A, Nemmar A. Early Cardiac Ischemia–Reperfusion Injury: Interactions of Autophagy with Galectin-3 and Oxidative Stress. Biomedicines. 2024; 12(11):2474. https://doi.org/10.3390/biomedicines12112474
Chicago/Turabian StyleAl-Salam, Suhail, Satwat Hashmi, Govindan S. Jagadeesh, Manjusha Sudhadevi, Aktham Awwad, and Abderrahim Nemmar. 2024. "Early Cardiac Ischemia–Reperfusion Injury: Interactions of Autophagy with Galectin-3 and Oxidative Stress" Biomedicines 12, no. 11: 2474. https://doi.org/10.3390/biomedicines12112474
APA StyleAl-Salam, S., Hashmi, S., Jagadeesh, G. S., Sudhadevi, M., Awwad, A., & Nemmar, A. (2024). Early Cardiac Ischemia–Reperfusion Injury: Interactions of Autophagy with Galectin-3 and Oxidative Stress. Biomedicines, 12(11), 2474. https://doi.org/10.3390/biomedicines12112474