
The Impact of Metabolic Syndrome on Bone Mass in Men: Systematic Review and Meta-Analysis

 , ,
, ,  , and
, and
Abstract
1. Introduction
2. Materials and Methods
2.1. Search Strategy and Inclusion Criteria
- Adult age and male sex;
- Meta-analyzable data on BMD evaluated in at least 2 sites using dual-energy X-ray absorptiometry (DXA) in original studies.
- Review articles, commentaries, editorials, and letters to editors;
- Case reports, case series (<10 patients);
- Non-English articles.
2.2. Data Abstraction
2.3. Outcomes
2.4. Data Synthesis and Statistical Analysis
3. Results
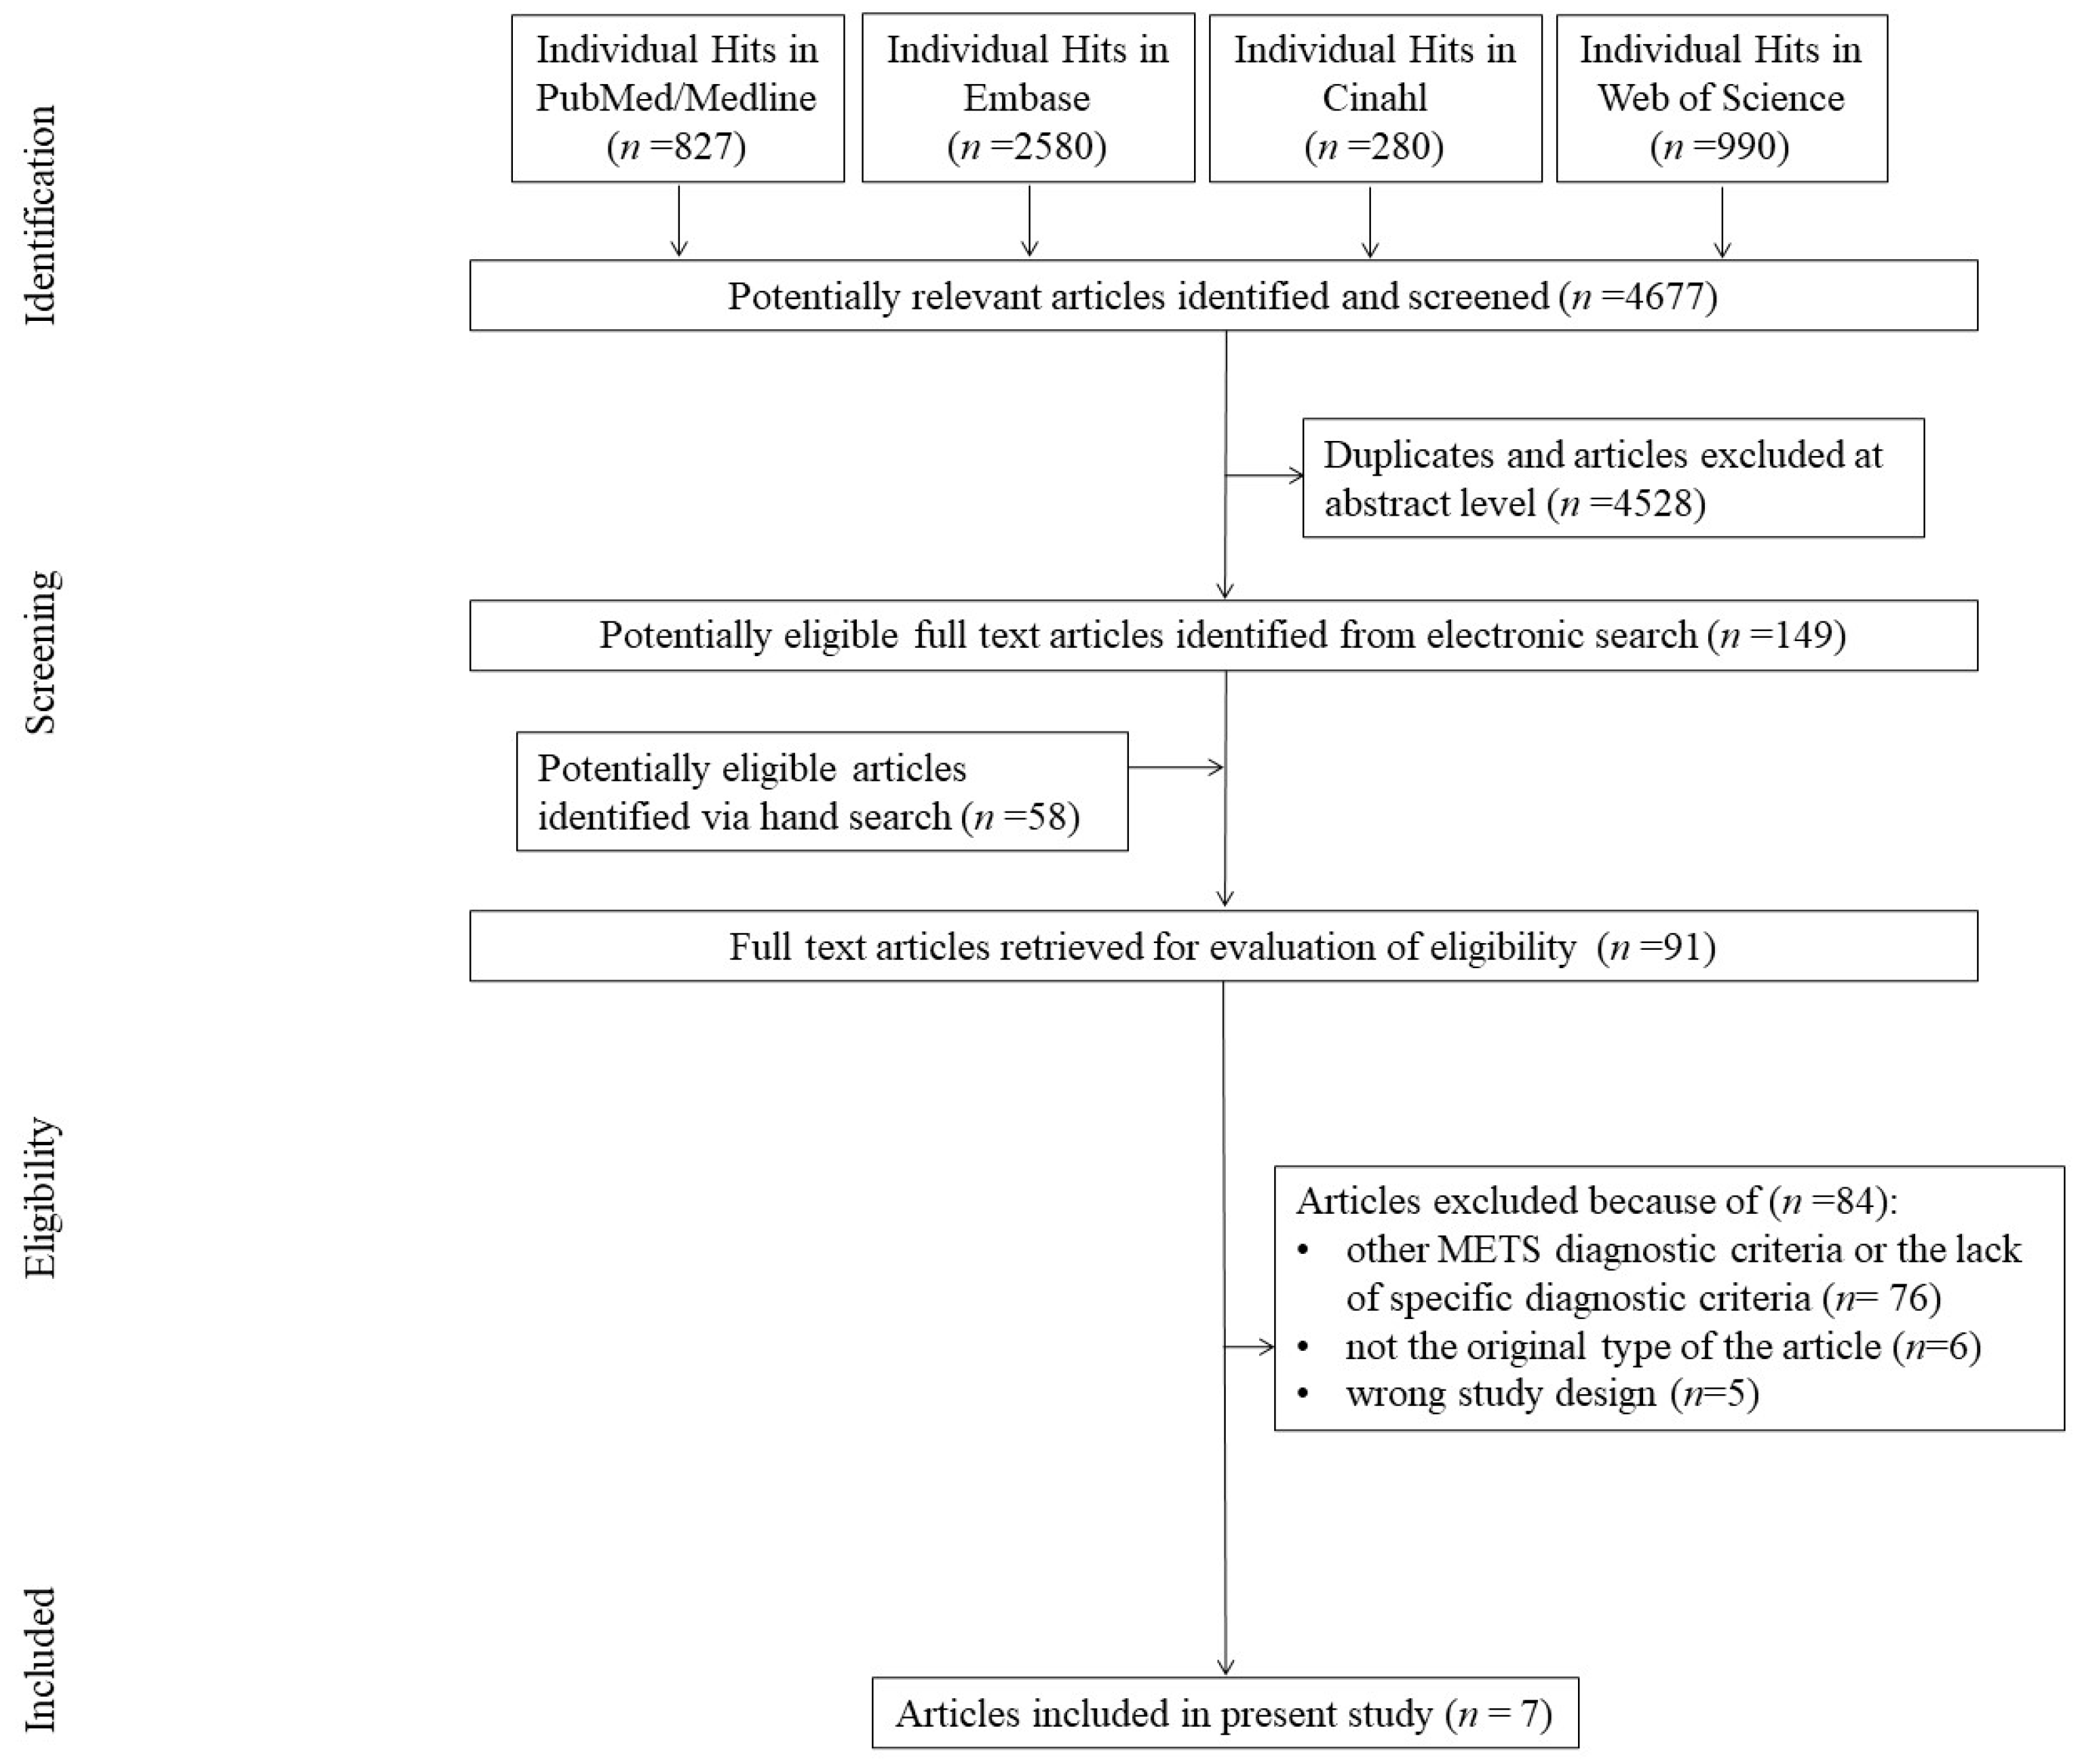
3.1. Search Results
3.2. Study, Patient, and Regimen Characteristics
3.3. Risk of Bias
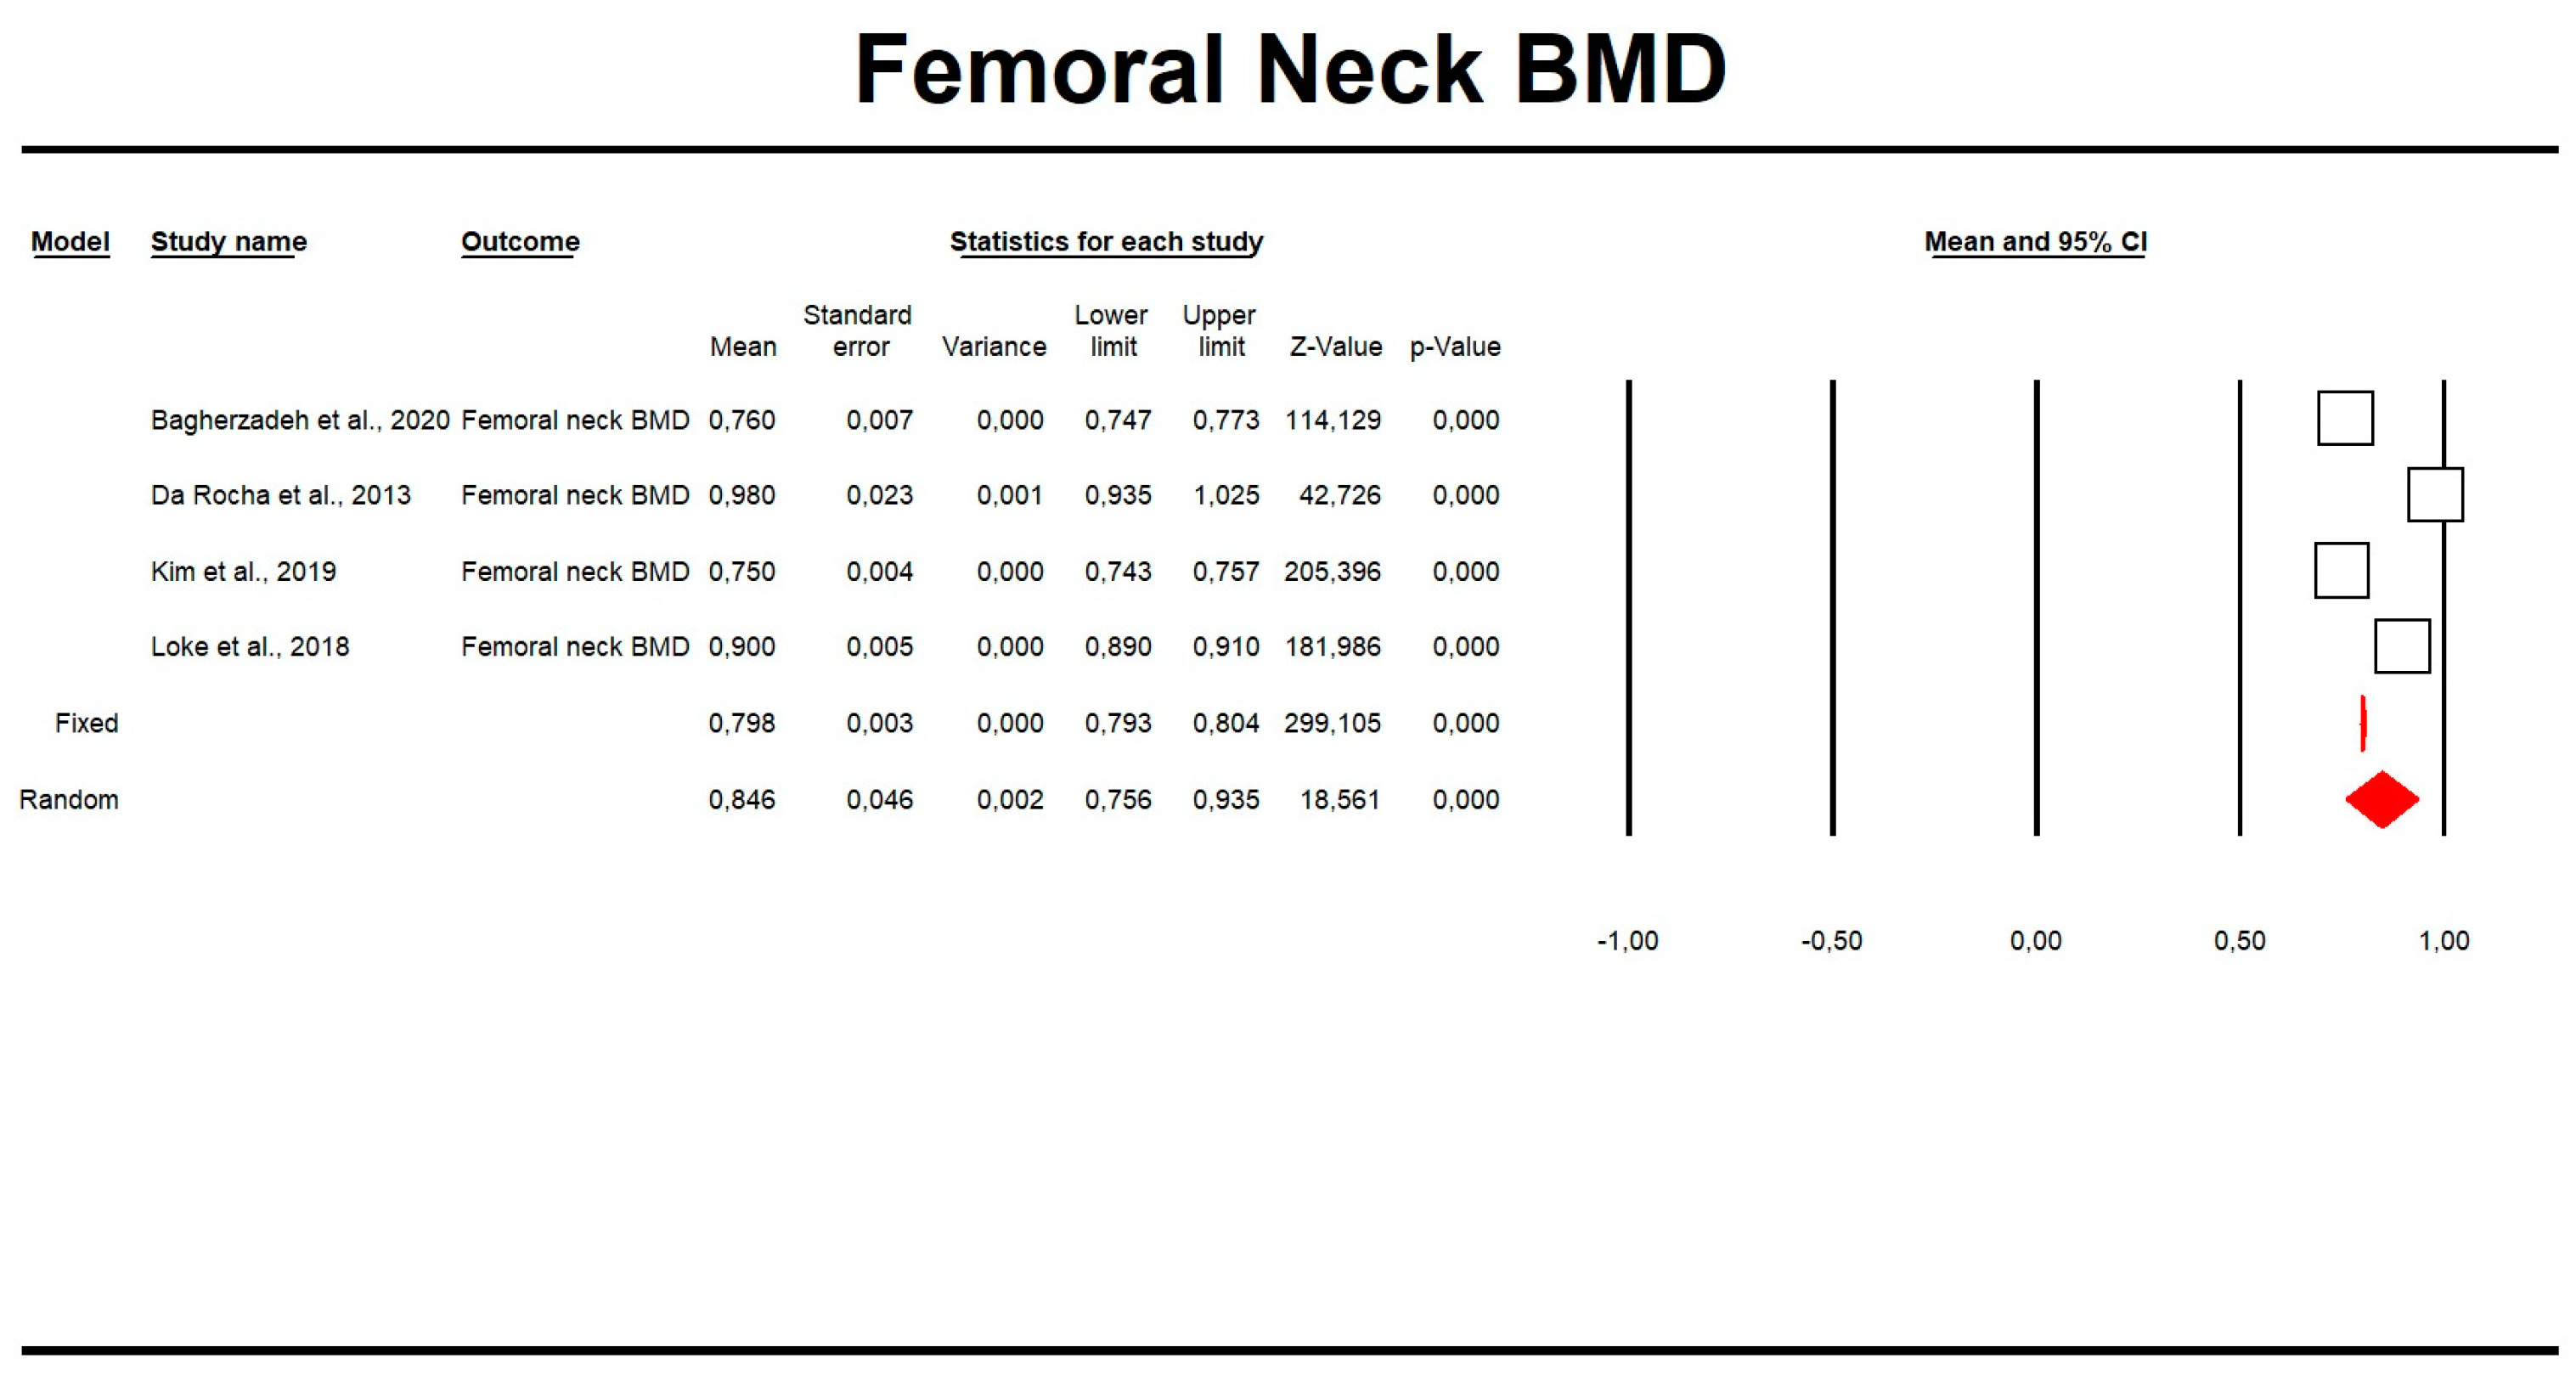
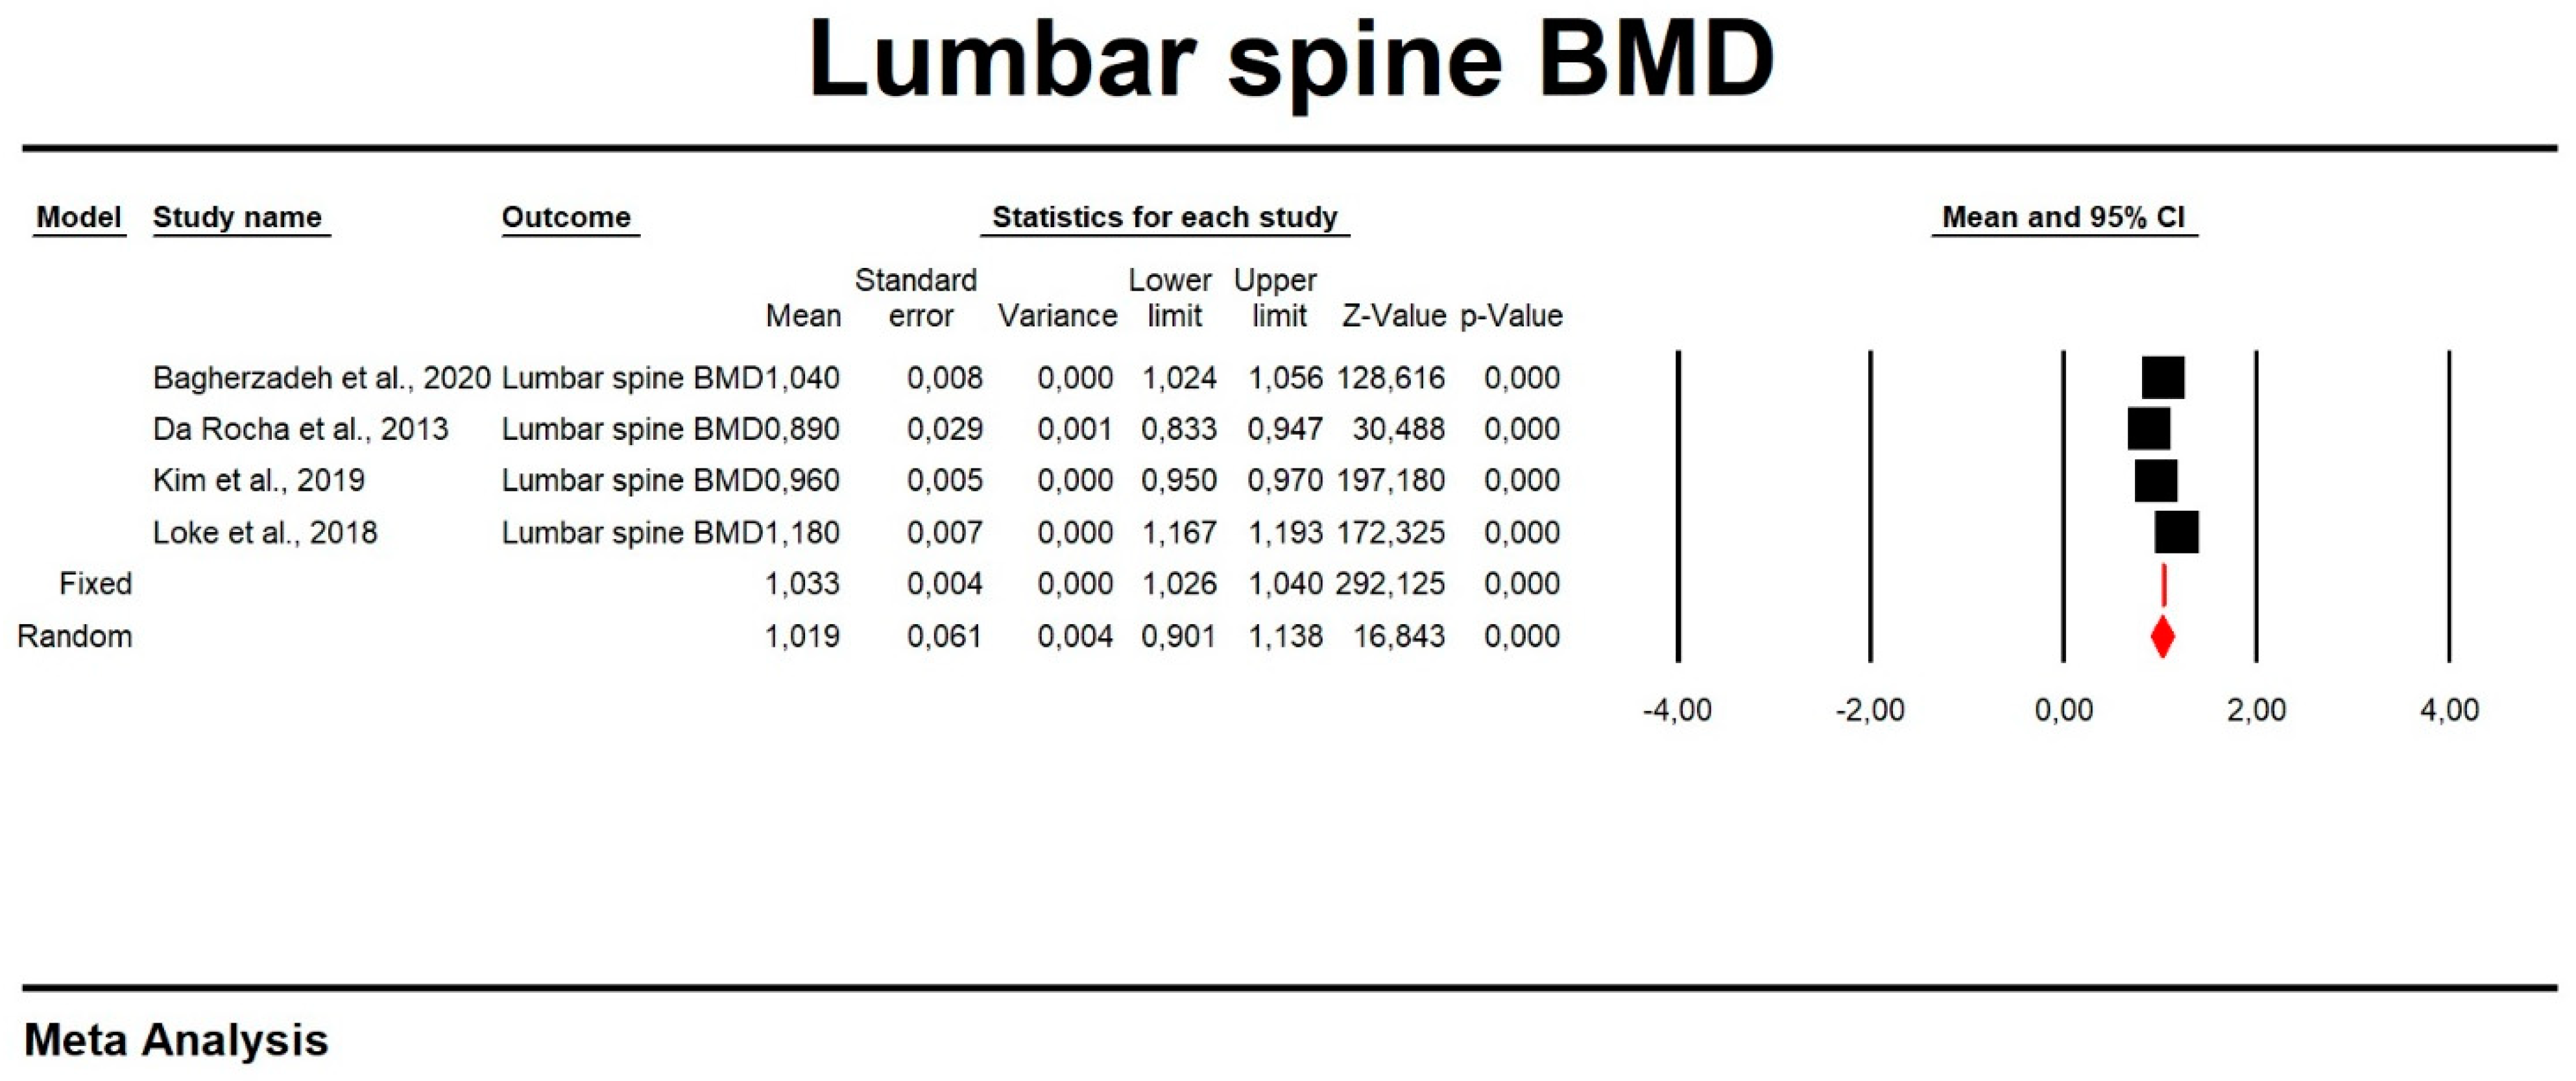
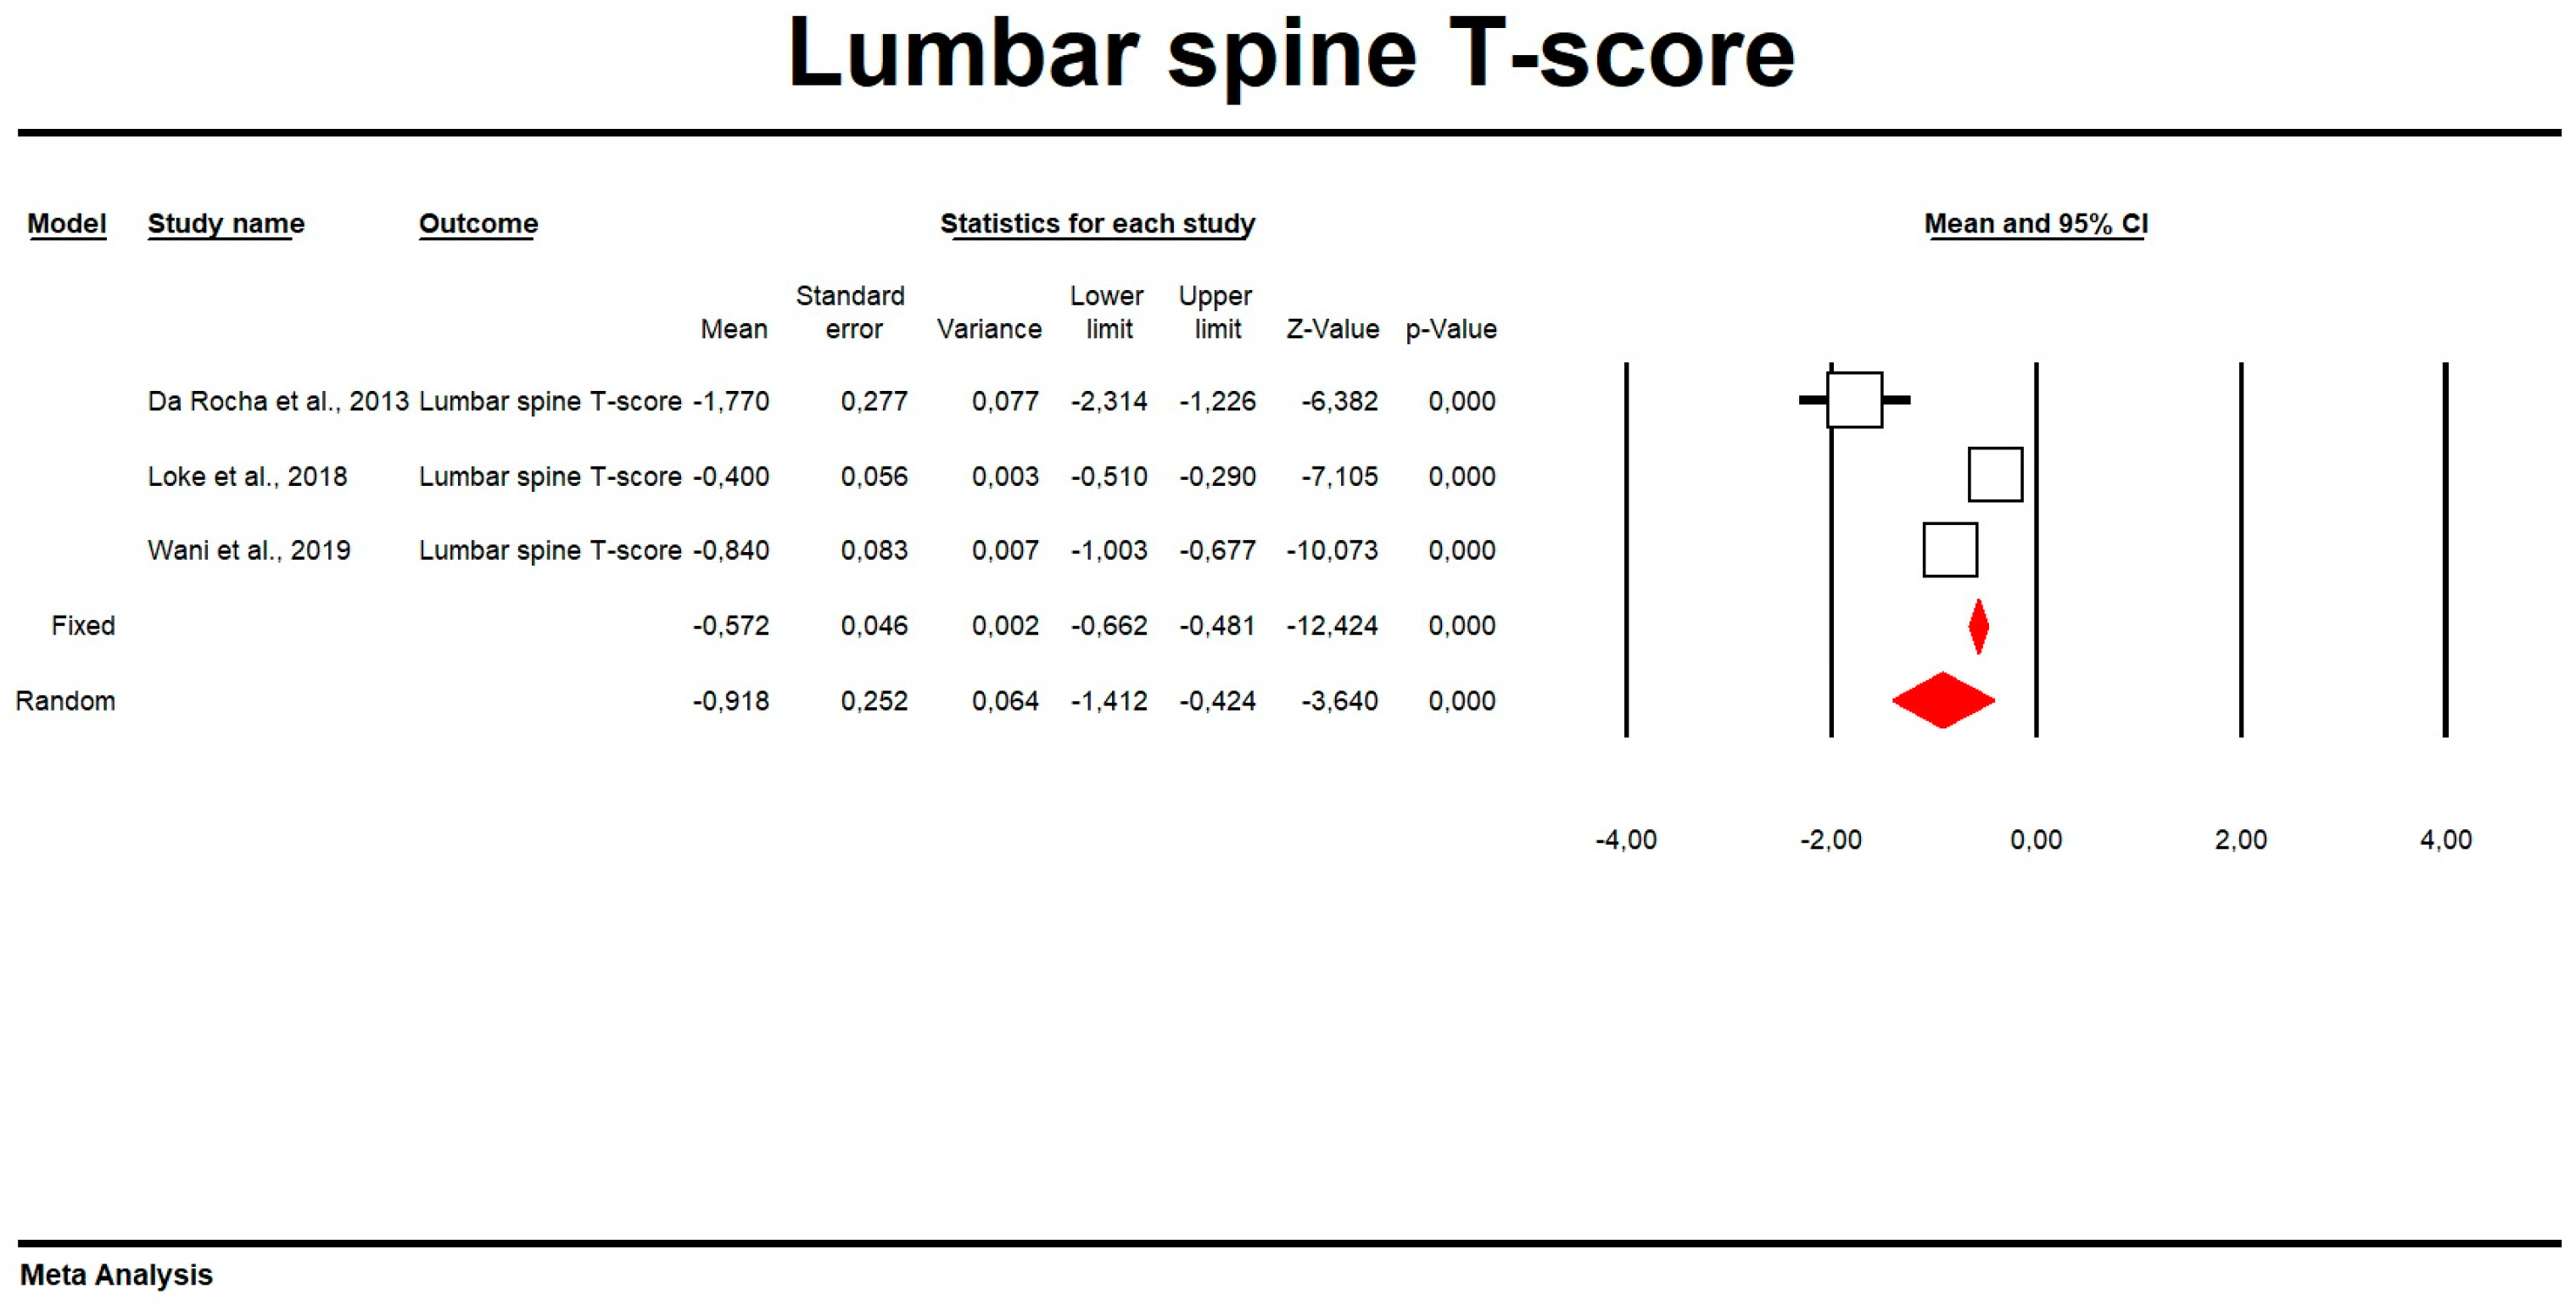
3.4. Mean BMD in Patients with MetS
4. Discussion
5. Conclusions
Supplementary Materials
Author Contributions
Funding
Institutional Review Board Statement
Informed Consent Statement
Data Availability Statement
Conflicts of Interest
References
- Bovolini, A.; Garcia, J.; Andrade, M.A.; Duarte, J.A. Metabolic Syndrome Pathophysiology and Predisposing Factors. Int. J. Sports Med. 2021, 42, 199–214. [Google Scholar] [CrossRef] [PubMed]
- Zhao, X.; Feng, X.; Zhao, X.; Jiang, Y.; Li, X.; Niu, J.; Meng, X.; Wu, J.; Xu, G.; Hou, L.; et al. How to Screen and Prevent Metabolic Syndrome in Patients of PCOS Early: Implications From Metabolomics. Front. Endocrinol. 2021, 12, 659268. [Google Scholar] [CrossRef] [PubMed]
- Madersbacher, S.; Sampson, N.; Culig, Z. Pathophysiology of Benign Prostatic Hyperplasia and Benign Prostatic Enlargement: A Mini-Review. Gerontology 2019, 65, 458–464. [Google Scholar] [CrossRef] [PubMed]
- Sood, R.; Sharma, D.; Goel, H.; Khattar, N.; Kulshreshtha, B.; Singh, K.K. The correlation between erectile dysfunction and metabolic syndrome in an Indian population: A cross-sectional observational study. Arab. J. Urol. 2019, 17, 221. [Google Scholar] [CrossRef] [PubMed]
- Haile, K.; Haile, A.; Timerga, A. Predictors of Lipid Profile Abnormalities Among Patients with Metabolic Syndrome in Southwest Ethiopia: A Cross-Sectional Study. Vasc. Health Risk Manag. 2021, 17, 461. [Google Scholar] [CrossRef]
- Muzurović, E.; Mikhailidis, D.P.; Mantzoros, C. Non-alcoholic fatty liver disease, insulin resistance, metabolic syndrome and their association with vascular risk. Metabolism 2021, 119, 154770. [Google Scholar] [CrossRef]
- Ali, N.; Miah, R.; Hasan, M.; Barman, Z.; Mou, A.D.; Hafsa, J.M.; Das Trisha, A.; Hasan, A.; Islam, F. Association between serum uric acid and metabolic syndrome: A cross-sectional study in Bangladeshi adults. Sci. Rep. 2020, 10, 1–7. [Google Scholar] [CrossRef]
- Uzunlulu, M.; Telci Caklili, O.; Oguz, A. Association between Metabolic Syndrome and Cancer. Ann. Nutr. Metab. 2016, 68, 173–179. [Google Scholar] [CrossRef]
- Qiao, D.; Li, Y.; Liu, X.; Zhang, X.; Qian, X.; Zhang, H.; Zhang, G.; Wang, C. Association of obesity with bone mineral density and osteoporosis in adults: A systematic review and meta-analysis. Public. Health 2020, 180, 22–28. [Google Scholar] [CrossRef]
- Turcotte, A.F.; O’Connor, S.; Morin, S.N.; Gibbs, J.C.; Willie, B.M.; Jean, S.; Gagnon, C. Association between obesity and risk of fracture, bone mineral density and bone quality in adults: A systematic review and meta-analysis. PLoS ONE 2021, 16, e0252487. [Google Scholar] [CrossRef]
- Ferrer, F.S.; Castell, E.C.; Marco, F.C.; Ruiz, M.J.; Rico, J.A.Q.; Roca, A.P.N. Influence of weight status on bone mineral content measured by DXA in children. BMC Pediatr. 2021, 21, 185. [Google Scholar] [CrossRef] [PubMed]
- Li, Y. Association between obesity and bone mineral density in middle-aged adults. J. Orthop. Surg. Res. 2022, 17, 268. [Google Scholar] [CrossRef] [PubMed]
- Kim, K.C.; Shin, D.H.; Lee, S.Y.; Im, J.A.; Lee, D.C. Relation between obesity and bone mineral density and vertebral fractures in Korean postmenopausal women. Yonsei Med. J. 2010, 51, 857–863. [Google Scholar] [CrossRef] [PubMed]
- Jain, R.K.; Vokes, T. Fat Mass Has Negative Effects on Bone, Especially in Men: A Cross-sectional Analysis of NHANES 2011–2018. J. Clin. Endocrinol. Metab. 2022, 107, E2545–E2552. [Google Scholar] [CrossRef]
- Dimic, A.; Popovic, M.R.; Tasic, I.; Djordjevic, D.; Stojanovic, S.; Stamenkovic, B.; Popovic, D.; Milenkovic, S.; Dimic, M.; Nedovic, J. Relation between bone density and certain parameters of lipid status in postmenopausal women. Open Med. 2012, 7, 642–649. [Google Scholar] [CrossRef]
- Niu, P.; Li, H.; Liu, D.; Zhang, Y.F.; Liu, Y.X.; Liang, C. Association Between HDL-C and Bone Mineral Density: An Cross-Sectional Analysis. Int. J. Gen. Med. 2021, 14, 8863–8872. [Google Scholar] [CrossRef]
- Tang, Y.; Wang, S.; Yi, Q.; Xia, Y.; Geng, B. High-density Lipoprotein Cholesterol Is Negatively Correlated with Bone Mineral Density and Has Potential Predictive Value for Bone Loss. Lipids Health Dis. 2021, 20, 75. [Google Scholar] [CrossRef]
- Dennison, E.M.; Syddall, H.E.; Aihie Sayer, A.; Martin, H.J.; Cooper, C. Lipid profile, obesity and bone mineral density: The Hertfordshire Cohort Study. QJM 2007, 100, 297. [Google Scholar] [CrossRef]
- Ghadiri-Anari, A.; Mortezaii-Shoroki, Z.; Modarresi, M.; Dehghan, A. Association of lipid profile with bone mineral density in postmenopausal women in Yazd province. Int. J. Reprod. Biomed. 2016, 14, 597. [Google Scholar] [CrossRef]
- Bandeira, L.; Silva, C.S.; Bilezikian, J.P. Male osteoporosis. Arch. Endocrinol. Metab. 2022, 66, 739–747. [Google Scholar] [CrossRef]
- Borges, C.N.; de Almeida, J.M.; Lima, D.; Cabral, M.; Bandeira, F. Prevalence of morphometric vertebral fractures in old men and the agreement between different methods in the city of Recife, Brazil. Rheumatol. Int. 2014, 34, 1387–1394. [Google Scholar] [CrossRef] [PubMed]
- Mitchell, A.; Larsson, S.C.; Fall, T.; Melhus, H.; Michaëlsson, K.; Byberg, L. Fasting glucose, bone area and bone mineral density: A Mendelian randomisation study. Diabetologia 2021, 64, 1348–1357. [Google Scholar] [CrossRef] [PubMed]
- Yao, X.; Xu, X.; Jin, F.; Zhu, Z. The Correlation of Type 2 Diabetes Status with Bone Mineral Density in Middle-Aged Adults. Diabetes Metab. Syndr. Obes. 2020, 13, 3269–3276. [Google Scholar] [CrossRef] [PubMed]
- Lin, H.H.; Hsu, H.Y.; Tsai, M.C.; Hsu, L.Y.; Chien, K.L.; Yeh, T.L. Association between type 2 diabetes and osteoporosis risk: A representative cohort study in Taiwan. PLoS ONE 2021, 16, e0254451. [Google Scholar] [CrossRef]
- Cakmak, H.A.; Cakmak, B.D.; Yumru, A.E.; Aslan, S.; Enhos, A.; Kalkan, A.K.; Enhos, A. The relationships between blood pressure, blood glucose, and bone mineral density in postmenopausal Turkish women. Ther. Clin. Risk Manag. 2015, 11, 1641. [Google Scholar] [CrossRef]
- Chin, K.Y.; Chan, C.Y.; Subramaniam, S.; Muhammad, N.; Fairus, A.; Ng, P.Y.; Jamil, N.A.; Aziz, N.A.; Ima-Nirwana, S.; Mohamed, N. Positive association between metabolic syndrome and bone mineral density among Malaysians. Int. J. Med. Sci. 2020, 17, 2585–2593. [Google Scholar] [CrossRef]
- Kinjo, M.; Setoguchi, S.; Solomon, D.H. Bone mineral density in adults with the metabolic syndrome: Analysis in a population-based U.S. sample. J. Clin. Endocrinol. Metab. 2007, 92, 4161–4164. [Google Scholar] [CrossRef]
- Rendina, D.; D’Elia, L.; Evangelista, M.; De Filippo, G.; Giaquinto, A.; Abate, V.; Barone, B.; Piccinocchi, G.; Prezioso, D.; Strazzullo, P. Metabolic syndrome is associated to an increased risk of low bone mineral density in free-living women with suspected osteoporosis. J. Endocrinol. Investig. 2021, 44, 1321–1326. [Google Scholar] [CrossRef]
- Loke, S.S.; Chang, H.W.; Li, W.C. Association between metabolic syndrome and bone mineral density in a Taiwanese elderly population. J. Bone Miner. Metab. 2018, 36, 200–208. [Google Scholar] [CrossRef]
- Eckstein, N.; Buchmann, N.; Demuth, I.; Steinhagen-Thiessen, E.; Nikolov, J.; Spira, D.; Eckardt, R.; Norman, K. Association between Metabolic Syndrome and Bone Mineral Density—Data from the Berlin Aging Study II (BASE-II). Gerontology 2016, 62, 337–344. [Google Scholar] [CrossRef]
- Expert Panel on Detection, Evaluation, and Treatment of High Blood Cholesterol in Adults. Executive Summary of The Third Report of The National Cholesterol Education Program (NCEP) Expert Panel on Detection, Evaluation, And Treatment of High Blood Cholesterol In Adults (Adult Treatment Panel III). JAMA 2001, 285, 2486–2497. [Google Scholar] [CrossRef]
- Grundy, S.M.; Brewer, H.B., Jr.; Cleeman, J.I.; Smith, S.C., Jr.; Lenfant, C. American Heart Association; National Heart, Lung, and Blood Institute. Definition of metabolic syndrome: Report of the National Heart, Lung, and Blood Institute/American Heart Association conference on scientific issues related to definition. Circulation 2004, 109, 433–438. [Google Scholar]
- Higgins, J.P.T.; Altman, D.G.; Gøtzsche, P.C.; Jüni, P.; Moher, D.; Oxman, A.D.; Savović, J.; Schulz, K.F.; Weeks, L.; Sterne, J.A.C.; et al. The Cochrane Collaboration’s tool for assessing risk of bias in randomised trials. BMJ 2011, 343, d5928. [Google Scholar] [CrossRef]
- DerSimonian, R.; Laird, N. Meta-analysis in clinical trials. Control Clin. Trials 1987, 7, 177–188. [Google Scholar] [CrossRef]
- Egger, M.; Smith, G.D.; Schneider, M.; Minder, C. Bias in meta-analysis detected by a simple, graphical test. BMJ 1997, 315, 629–634. [Google Scholar]
- Duval, S.; Tweedie, R. A Nonparametric “Trim and Fill” Method of Accounting for Publication Bias in Meta-Analysis. J. Am. Stat. Assoc. 2000, 95, 89. [Google Scholar]
- Wani, K.; Yakout, S.M.; Ansari, M.G.A.; Sabico, S.; Hussain, S.D.; Alokail, M.S.; Sheshah, E.; Aljohani, N.J.; Al-Saleh, Y.; Reginster, J.-Y.; et al. Metabolic Syndrome in Arab Adults with Low Bone Mineral Density. Nutrients 2019, 11, 1405. [Google Scholar] [CrossRef] [PubMed]
- Yakout, S.M.; Alkahtani, S.A.; Al-Disi, D.; Aljaloud, K.S.; Khattak, M.N.K.; Alokail, M.S.; Reginster, J.-Y.; Sabico, S.; Al-Daghri, N.M. Coexistence of Pre-sarcopenia and Metabolic Syndrome in Arab Men. Calcif. Tissue Int. 2019, 104, 130–136. [Google Scholar] [CrossRef] [PubMed]
- Bagherzadeh, M.; Sajjadi-Jazi, S.M.; Sharifi, F.; Ebrahimpur, M.; Amininezhad, F.; Ostovar, A.; Shafiee, G.; Heshmat, R.; Mehrdad, N.; Razi, F.; et al. Effects of metabolic syndrome on bone health in older adults: The Bushehr Elderly Health (BEH) program. Osteoporos. Int. 2020, 31, 1975–1984. [Google Scholar] [CrossRef] [PubMed]
- Da Rocha, A.K.S.; Bós, Â.J.G.; Carnenaz, G.; Machado, D.C. Bone mineral density, metabolic syndrome, and vitamin D in indigenous from south of Brazil. Arch. Osteoporos. 2013, 8, 134. [Google Scholar] [CrossRef] [PubMed]
- Kim, Y.M.; Kim, S.; Won, Y.J.; Kim, S.H. Clinical Manifestations and Factors Associated with Osteosarcopenic Obesity Syndrome: A Cross-Sectional Study in Koreans with Obesity. Calcif. Tissue Int. 2019, 105, 77–88. [Google Scholar] [CrossRef]
- Laurent, M.R.; Cook, M.J.; Gielen, E.; Ward, K.A.; Antonio, L.; Adams, J.E.; Decallonne, B.; Bartfai, G.; Casanueva, F.F.; Forti, G.; et al. Lower bone turnover and relative bone deficits in men with metabolic syndrome: A matter of insulin sensitivity? The European Male Ageing Study. Osteoporos. Int. 2016, 27, 3227–3237. [Google Scholar] [CrossRef] [PubMed]
- Zhou, J.; Zhang, Q.; Yuan, X.; Wang, J.; Li, C.; Sheng, H.; Qu, S.; Li, H. Association between metabolic syndrome and osteoporosis: A meta-analysis. Bone 2013, 57, 30–35. [Google Scholar] [CrossRef] [PubMed]
- Evans, A.L.; Paggiosi, M.A.; Eastell, R.; Walsh, J.S. Bone density, microstructure and strength in obese and normal weight men and women in younger and older adulthood. J. Bone Miner. Res. 2015, 30, 920–928. [Google Scholar] [CrossRef] [PubMed]
- Walsh, J.S.; Vilaca, T. Obesity, Type 2 Diabetes and Bone in Adults. Calcif. Tissue Int. 2017, 100, 528. [Google Scholar] [CrossRef]
- De Laet, C.; Kanis, J.A.; Odén, A.; Johanson, H.; Johnell, O.; Delmas, P.; Eisman, J.A.; Kroger, H.; Fujiwara, S.; Garnero, P.; et al. Body mass index as a predictor of fracture risk: A meta-analysis. Osteoporos. Int. 2005, 16, 1330–1338. [Google Scholar] [CrossRef]
- Jankowska, E.A.; Rogucka, E.; Mȩdraś, M. Are general obesity and visceral adiposity in men linked to reduced bone mineral content resulting from normal ageing? A population-based study. Andrologia 2001, 33, 384–389. [Google Scholar] [CrossRef]
- Wang, Y.; Chen, F.; Wang, H.; Yu, C.; Shao, S.; Zhao, M.; Zhang, H.; Zhang, X.; Guan, Q.; Xu, J. Association Between Forearm Bone Mineral Density and Metabolic Obesity in a Northern Chinese Population. Metab. Syndr. Relat. Disord. 2020, 18, 251–259. [Google Scholar] [CrossRef]
- Wung, C.H.; Chung, C.Y.; Wu, P.Y.; Huang, J.C.; Tsai, Y.C.; Chen, S.C.; Chiu, Y.W.; Chang, J.M. Associations between Metabolic Syndrome and Obesity-Related Indices and Bone Mineral Density T-Score in Hemodialysis Patients. J. Pers. Med. 2021, 11, 775. [Google Scholar] [CrossRef]
- Starup-Linde, J.; Ornstrup, M.J.; Kjær, T.N.; Lykkeboe, S.; Handberg, A.; Gregersen, S.; Harsløf, T.; Pedersen, S.B.; Vestergaard, P.; Langdahl, B.L. Bone Density and Structure in Overweight Men With and Without Diabetes. Front. Endocrinol. 2022, 13, 837084. [Google Scholar] [CrossRef]
- Du, D.; Jing, Z.; Zhang, G.; Dang, X.; Liu, R.; Song, J. The relationship between central obesity and bone mineral density: A Mendelian randomization study. Diabetol. Metab. Syndr. 2022, 14, 63. [Google Scholar] [CrossRef] [PubMed]
- Nóbrega da Silva, V.; Goldberg, T.B.L.; Silva, C.C.; Kurokawa, C.S.; Fiorelli, L.N.M.; Rizzo, A.D.C.B.; Corrente, J.E. Impact of metabolic syndrome and its components on bone remodeling in adolescents. PLoS ONE 2021, 16, e0253892. [Google Scholar] [CrossRef] [PubMed]
- Rendina, D.; D’Elia, L.; De Filippo, G.; Abate, V.; Evangelista, M.; Giaquinto, A.; Barone, B.; Piccinocchi, G.; Prezioso, D.; Strazzullo, P. Metabolic syndrome is not associated to an increased risk of low bone mineral density in men at risk for osteoporosis. J. Endocrinol. Investig. 2022, 45, 309–315. [Google Scholar] [CrossRef] [PubMed]
- Rhee, S.Y.; Yon, D.K.; Kwon, M.J.; Kim, J.H.; Kim, J.H.; Bang, W.J.; Lee, J.W.; Kwon, B.C.; Choi, H.G.; Min, C. Association between metabolic syndrome and osteoporosis among adults aged 50 years and older: Using the National Health Information Database in South Korea. Arch. Osteoporos. 2022, 17, 124. [Google Scholar] [CrossRef]
- Babagoli, M.; Soleimani, M.; Baghdadi, S.; Vatan, M.S.; Shafiei, S.H. Does metabolic syndrome increase the risk of fracture? A systematic review and meta-analysis. Arch. Osteoporos. 2022, 17, 118. [Google Scholar] [CrossRef]
- Ağbaht, K.; Gürlek, A.; Karakaya, J.; Bayraktar, M. Circulating adiponectin represents a biomarker of the association between adiposity and bone mineral density. Endocrine 2009, 35, 371–379. [Google Scholar] [CrossRef]
- Basurto-Acevedo, L.; Saucedo-García, R.; Vázquez-Martínez, A.; Cruz-García, M.; Valle-Hernández, M.M.; Rosales-Cruz, E.; Sánchez-Arenas, R. Relationship between bone remodeling and metabolism in the elderly. Rev. Med. Inst. Mex. Seguro Soc. 2018, 56, S6–S11. [Google Scholar]
- Shin, D.; Kim, S.; Kim, K.H.; Lee, K.; Park, S.M. Association between insulin resistance and bone mass in men. J. Clin. Endocrinol. Metab. 2014, 99, 988–995. [Google Scholar] [CrossRef]
- Wang, X.; Jiang, L.; Shao, X. Association Analysis of Insulin Resistance and Osteoporosis Risk in Chinese Patients with T2DM. Ther. Clin. Risk Manag. 2021, 17, 909–916. [Google Scholar] [CrossRef]
- Adami, S.; Braga, V.; Zamboni, M.; Gatti, D.; Rossini, M.; Bakri, J.; Battaglia, E. Relationship between lipids and bone mass in 2 cohorts of healthy women and men. Calcif. Tissue Int. 2004, 74, 136–142. [Google Scholar] [CrossRef]
- Murray, M.K.; Bode, K.; Whittaker, P. Gender-specific associations between coronary heart disease and other chronic diseases: Cross-sectional evaluation of national survey data from adult residents of Germany. J. Geriatr. Cardiol. 2019, 16, 663–670. [Google Scholar]
- Laroche, M.; Pecourneau, V.; Blain, H.; Breuil, V.; Chapurlat, R.; Cortet, B.; Sutter, B.; Degboe, Y. Osteoporosis and ischemic cardiovascular disease. Joint Bone Spine 2017, 84, 427–432. [Google Scholar] [CrossRef] [PubMed]
- Kan, B.; Zhao, Q.; Wang, L.; Xue, S.; Cai, H.; Yang, S. Association between lipid biomarkers and osteoporosis: A cross-sectional study. BMC Musculoskelet. Disord. 2021, 22, 759. [Google Scholar] [CrossRef]
- Schacter, G.I.; Leslie, W.D. Diabetes and Osteoporosis: Part I, Epidemiology and Pathophysiology. Endocrinol. Metab. Clin. N. Am. 2021, 50, 275–285. [Google Scholar] [CrossRef] [PubMed]
- Looker, A.C.; Eberhardt, M.S.; Saydah, S.H. Diabetes and fracture risk in older U.S. adults. Bone 2016, 82, 9–15. [Google Scholar] [CrossRef] [PubMed]
- Chai, H.; Ge, J.; Li, L.; Li, J.; Ye, Y. Hypertension is associated with osteoporosis: A case-control study in Chinese postmenopausal women. BMC Musculoskelet. Disord. 2021, 22, 253. [Google Scholar] [CrossRef]


| Database | Search Strings with Medical Subject Headings |
|---|---|
| PubMed | (male OR male OR man OR men OR males OR metabolic syndrome x OR insulin resistance syndrome OR metabolic syndrome OR metabolic syndrome x OR syndrome x, metabolic OR met) AND (bone density OR bone density OR bone mineral density OR density, bone OR osseous density OR osteoporosis OR decalcification, pathological OR endocrine osteoporosis OR osteoporosis OR osteoporotic decalcification) AND (observational study OR non experimental studies OR non experimental study OR nonexperimental studies OR nonexperimental study OR observation studies OR observation study OR observational studies OR observational studies as topic OR observational study OR observational study as topic) |
| Cinahl | (male OR male OR man OR men OR males OR metabolic syndrome x OR insulin resistance syndrome OR metabolic syndrome OR metabolic syndrome x OR syndrome x, metabolic OR met) AND (bone density OR bone density OR bone mineral density OR density, bone OR osseous density OR osteoporosis OR decalcification, pathological OR endocrine osteoporosis OR osteoporosis OR osteoporotic decalcification) AND (observational study OR non experimental studies OR non experimental study OR nonexperimental studies OR nonexperimental study OR observation studies OR observation study OR observational studies OR observational studies as topic OR observational study OR observational study as topic) |
| Embase | (‘male’/exp OR ‘male’ OR ‘man’ OR ‘men’ OR ‘males’ OR ‘metabolic syndrome x’/exp OR ‘insulin resistance syndrome’ OR ‘metabolic syndrome’ OR ‘metabolic syndrome x’ OR ‘syndrome x, metabolic’ OR ‘met’/exp) AND (‘bone density’/exp OR ‘bone density’ OR ‘bone mineral density’ OR ‘density, bone’ OR ‘osseous density’ OR ‘osteoporosis’/exp OR ‘decalcification, pathological’ OR ‘endocrine osteoporosis’ OR ‘osteoporosis’ OR ‘osteoporotic decalcification’) AND (‘observational study’/exp OR ‘non experimental studies’ OR ‘non experimental study’ OR ‘nonexperimental studies’ OR ‘nonexperimental study’ OR ‘observation studies’ OR ‘observation study’ OR ‘observational studies’ OR ‘observational studies as topic’ OR ‘observational study’ OR ‘observational study as topic’) |
| Web of Science | (male OR man OR men OR males OR metabolic syndrome x OR insulin resistance syndrome OR metabolic syndrome OR metabolic syndrome x OR syndrome x, metabolic OR met) AND (bone density OR bone density OR bone mineral density OR density, bone OR osseous density OR osteoporosis OR decalcification, pathological OR endocrine osteoporosis OR osteoporosis OR osteoporotic decalcification) AND observational study) |
| No | Study Description | Number of Patients | Age (Years; Mean ± SD) | Weight (kg; Mean ± SD) | BMI (kg/m2; Mean ± SD) | TC (mg/dL; Mean ± SD) | TC (mg/dL; Mean ± SD) | HDL-C (mg/dL; Mean ± SD) | LDL-C (mg/dL; Mean ± SD) | FPG (mg/dL) Unit | WC (cm; Mean ± SD) | SBP (mmHg; Mean ± SD) | DBP (mmHg; Mean ± SD) | |
|---|---|---|---|---|---|---|---|---|---|---|---|---|---|---|
| Reference | Country | |||||||||||||
| 1 | Bagherzadeh et al., 2020 [39] | Iran | 442 | 69.08 ± 6.2 | ND | 28.19 ± 3.72 | 174.3 ± 43.98 | 174.78 ± 78.18 | 37.37 ± 8.5 | 102.44 ± 37.6 | 122.33 ± | 103 ± 9.74 | 144.3 ± 18.3 | 83.72 ± 48.54 |
| 2 | Da Rocha et al., 2013 [40] | Brazil | 23 | 58.9 ± 13.96 | 80.71 ± 13.57 | 31.23 ± 5.35 | ND | ND | ND | ND | ND | ND | ND | ND |
| 3 | Kim et al., 2019 [41] | South Korea | 1080 | 64.6 ± 9.1 | 70.9 ± 9.1 | 25.5 ± 2.6 | 189.8 ± 37 | 176.1 ± 125.3 | 45.8 ± 11.2 | 112.4 ± 35.9 | 107.5 ± 24.4 | ND | 129.9 ± 16.9 | 80.4 ± 10.2 |
| 4 | Laurent et al., 2016 [42] | Belgium | 975 | 60.7 (ME*) ± (52–70.4) (IQR*) | 91.7 (ME*) ± 82.9–101.1 (IQR*) | 30.4 (ME*) ± 28.1–32.8 (IQR*) | ND | 177.0 (ME*) ± (124–239) (IQR*) | 46 (ME*) ± (39–54) (IQR*) | ND | 106 (ME*) ± (99–121) (IQR*) | 106.5 (ME*) ± (102.2–113.0) (IQR*) | 150.0 (ME*) ± (139.0–164.0) (IQR*) | 90.0 (ME*) ± (82.0–98.0) (IQR*) |
| 5 | Loke et al., 2018 [29] | Taiwan | 691 | 60.1 ± 7.5 | 71.1 ± 10.4 | 25.1 ± 3.3 | 191.9 ± 36.8 | 137.9 ± 87.5 | 52.1 ± 13.5 | ND | 106.3 ± 29.4 | 88.2 ± 9.4 | 134.5 ± 19.8 | 88.1 ± 11 |
| 6 | Wani et al., 2019 [37] | Saudi Arabia | 243 | 58.1 ± 9.4 | ND | 29.9 ± 5.2 | 189 ± 50 | 168 (ME*) ± (124-248) (IQR*) | 43 ± 12 | ND | 166 (ME*) ± (117–254) (IQR*) | 103.7 ± 14.2 | 131.1 ± 13.1 | 79.5 ± 8.2 |
| 7 | Yakout et al., 2019 [38] | Saudi Arabia | 79 | 39.1 ± 13.2 | ND | 32.7 ± 4.4 | ND | 159 (ME*) ± (124-248) (IQR*) | 37 ± 8 | ND | 105 (ME*) ± (92–121) (IQR*) | 108.2 ± 11.9 | 125.3 ± 14.2 | 84.1 ± 10.6 |
| Time Point | Number of Studies | Point Estimate | SE | Variance | Lower Limit | Upper Limit | Test Z (z Value) | Test Z (p Value) | Q Value | df (Q) | p Value | Heterogeneity (I2) |
|---|---|---|---|---|---|---|---|---|---|---|---|---|
| Femoral neck BMD | ||||||||||||
| Fixed | 4 | 0.798424287 | 2.67 × 10−03 | 7.13 × 10−06 | 0.793192401 | 0.803656173 | 299.1049353 | 0 | 693.6957044 | 3 | 0 | 99.56753372 |
| Random | 4 | 0.845577473 | 4.56 × 10−02 | 2.08 × 10−03 | 0.756288363 | 0.934866583 | 18.56106968 | 0 | ||||
| Lumbar spine BMD | ||||||||||||
| Fixed | 4 | 1.032933208 | 3.54 × 10−03 | 1.25 × 10−05 | 1.026002919 | 1.039863496 | 292.1252127 | 0 | 710.4211291 | 3 | 0 | 99.57771526 |
| Random | 4 | 1.019173789 | 6.05 × 10−02 | 3.66 × 10−03 | 0.900574634 | 1.137772945 | 16.8428174 | 0 | ||||
| Lumbar spine T-score | ||||||||||||
| Fixed | 3 | −0.571685371 | 4.60 × 10−02 | 2.12 × 10−03 | −0.661875484 | −0.481495258 | −12.42356506 | 0 | 38.32124064 | 2 | 4.77 × 10−09 | 94.78096229 |
| Random | 3 | −0.918075893 | 0.252230741 | 6.36 × 10−02 | −1.412439061 | −0.423712725 | −3.63982554 | 2.73 × 10−04 | ||||
Disclaimer/Publisher’s Note: The statements, opinions and data contained in all publications are solely those of the individual author(s) and contributor(s) and not of MDPI and/or the editor(s). MDPI and/or the editor(s) disclaim responsibility for any injury to people or property resulting from any ideas, methods, instructions or products referred to in the content. |
© 2023 by the authors. Licensee MDPI, Basel, Switzerland. This article is an open access article distributed under the terms and conditions of the Creative Commons Attribution (CC BY) license (https://creativecommons.org/licenses/by/4.0/).
Share and Cite
Rył, A.; Szylińska, A.; Skonieczna-Żydecka, K.; Miazgowski, T.; Rotter, I. The Impact of Metabolic Syndrome on Bone Mass in Men: Systematic Review and Meta-Analysis. Biomedicines 2023, 11, 1915. https://doi.org/10.3390/biomedicines11071915
Rył A, Szylińska A, Skonieczna-Żydecka K, Miazgowski T, Rotter I. The Impact of Metabolic Syndrome on Bone Mass in Men: Systematic Review and Meta-Analysis. Biomedicines. 2023; 11(7):1915. https://doi.org/10.3390/biomedicines11071915
Chicago/Turabian StyleRył, Aleksandra, Aleksandra Szylińska, Karolina Skonieczna-Żydecka, Tomasz Miazgowski, and Iwona Rotter. 2023. "The Impact of Metabolic Syndrome on Bone Mass in Men: Systematic Review and Meta-Analysis" Biomedicines 11, no. 7: 1915. https://doi.org/10.3390/biomedicines11071915
APA StyleRył, A., Szylińska, A., Skonieczna-Żydecka, K., Miazgowski, T., & Rotter, I. (2023). The Impact of Metabolic Syndrome on Bone Mass in Men: Systematic Review and Meta-Analysis. Biomedicines, 11(7), 1915. https://doi.org/10.3390/biomedicines11071915