

ERK Signaling Pathway Is Constitutively Active in NT2D1 Non-Seminoma Cells and Its Inhibition Impairs Basal and HGF-Activated Cell Proliferation
 ,
,  ,
,  ,
,  , ,
, ,  ,
, 
 and
and 
Abstract
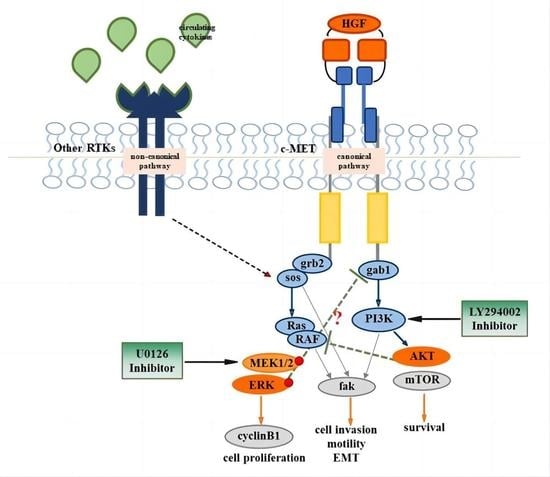
1. Introduction
2. Materials and Methods
2.1. Cell Culture
2.2. Cell Proliferation Assay
2.3. Cell Cycle Fluorescence Activated Cell Sorter (FACS) Analysis
2.4. Cell Death Assay
2.5. Chemotaxis Assay
2.6. Wound-Healing Assay (Collective Migration Assay)
2.7. Immunofluorescence Analyses
2.8. Western Blot Analyses
2.9. Scanning Electron Microscopy (SEM)
2.10. Statistical Analyses
3. Results
3.1. ERK Is Constitutively Active in NT2D1 Cells, but HGF Administration Increases ERK Phosphorylation
3.2. Pharmacological Approach to Block ERK Pathway
3.3. UO126 Inhibits Both Constitutive and HGF-Dependent ERK1/2 Phosphorylation
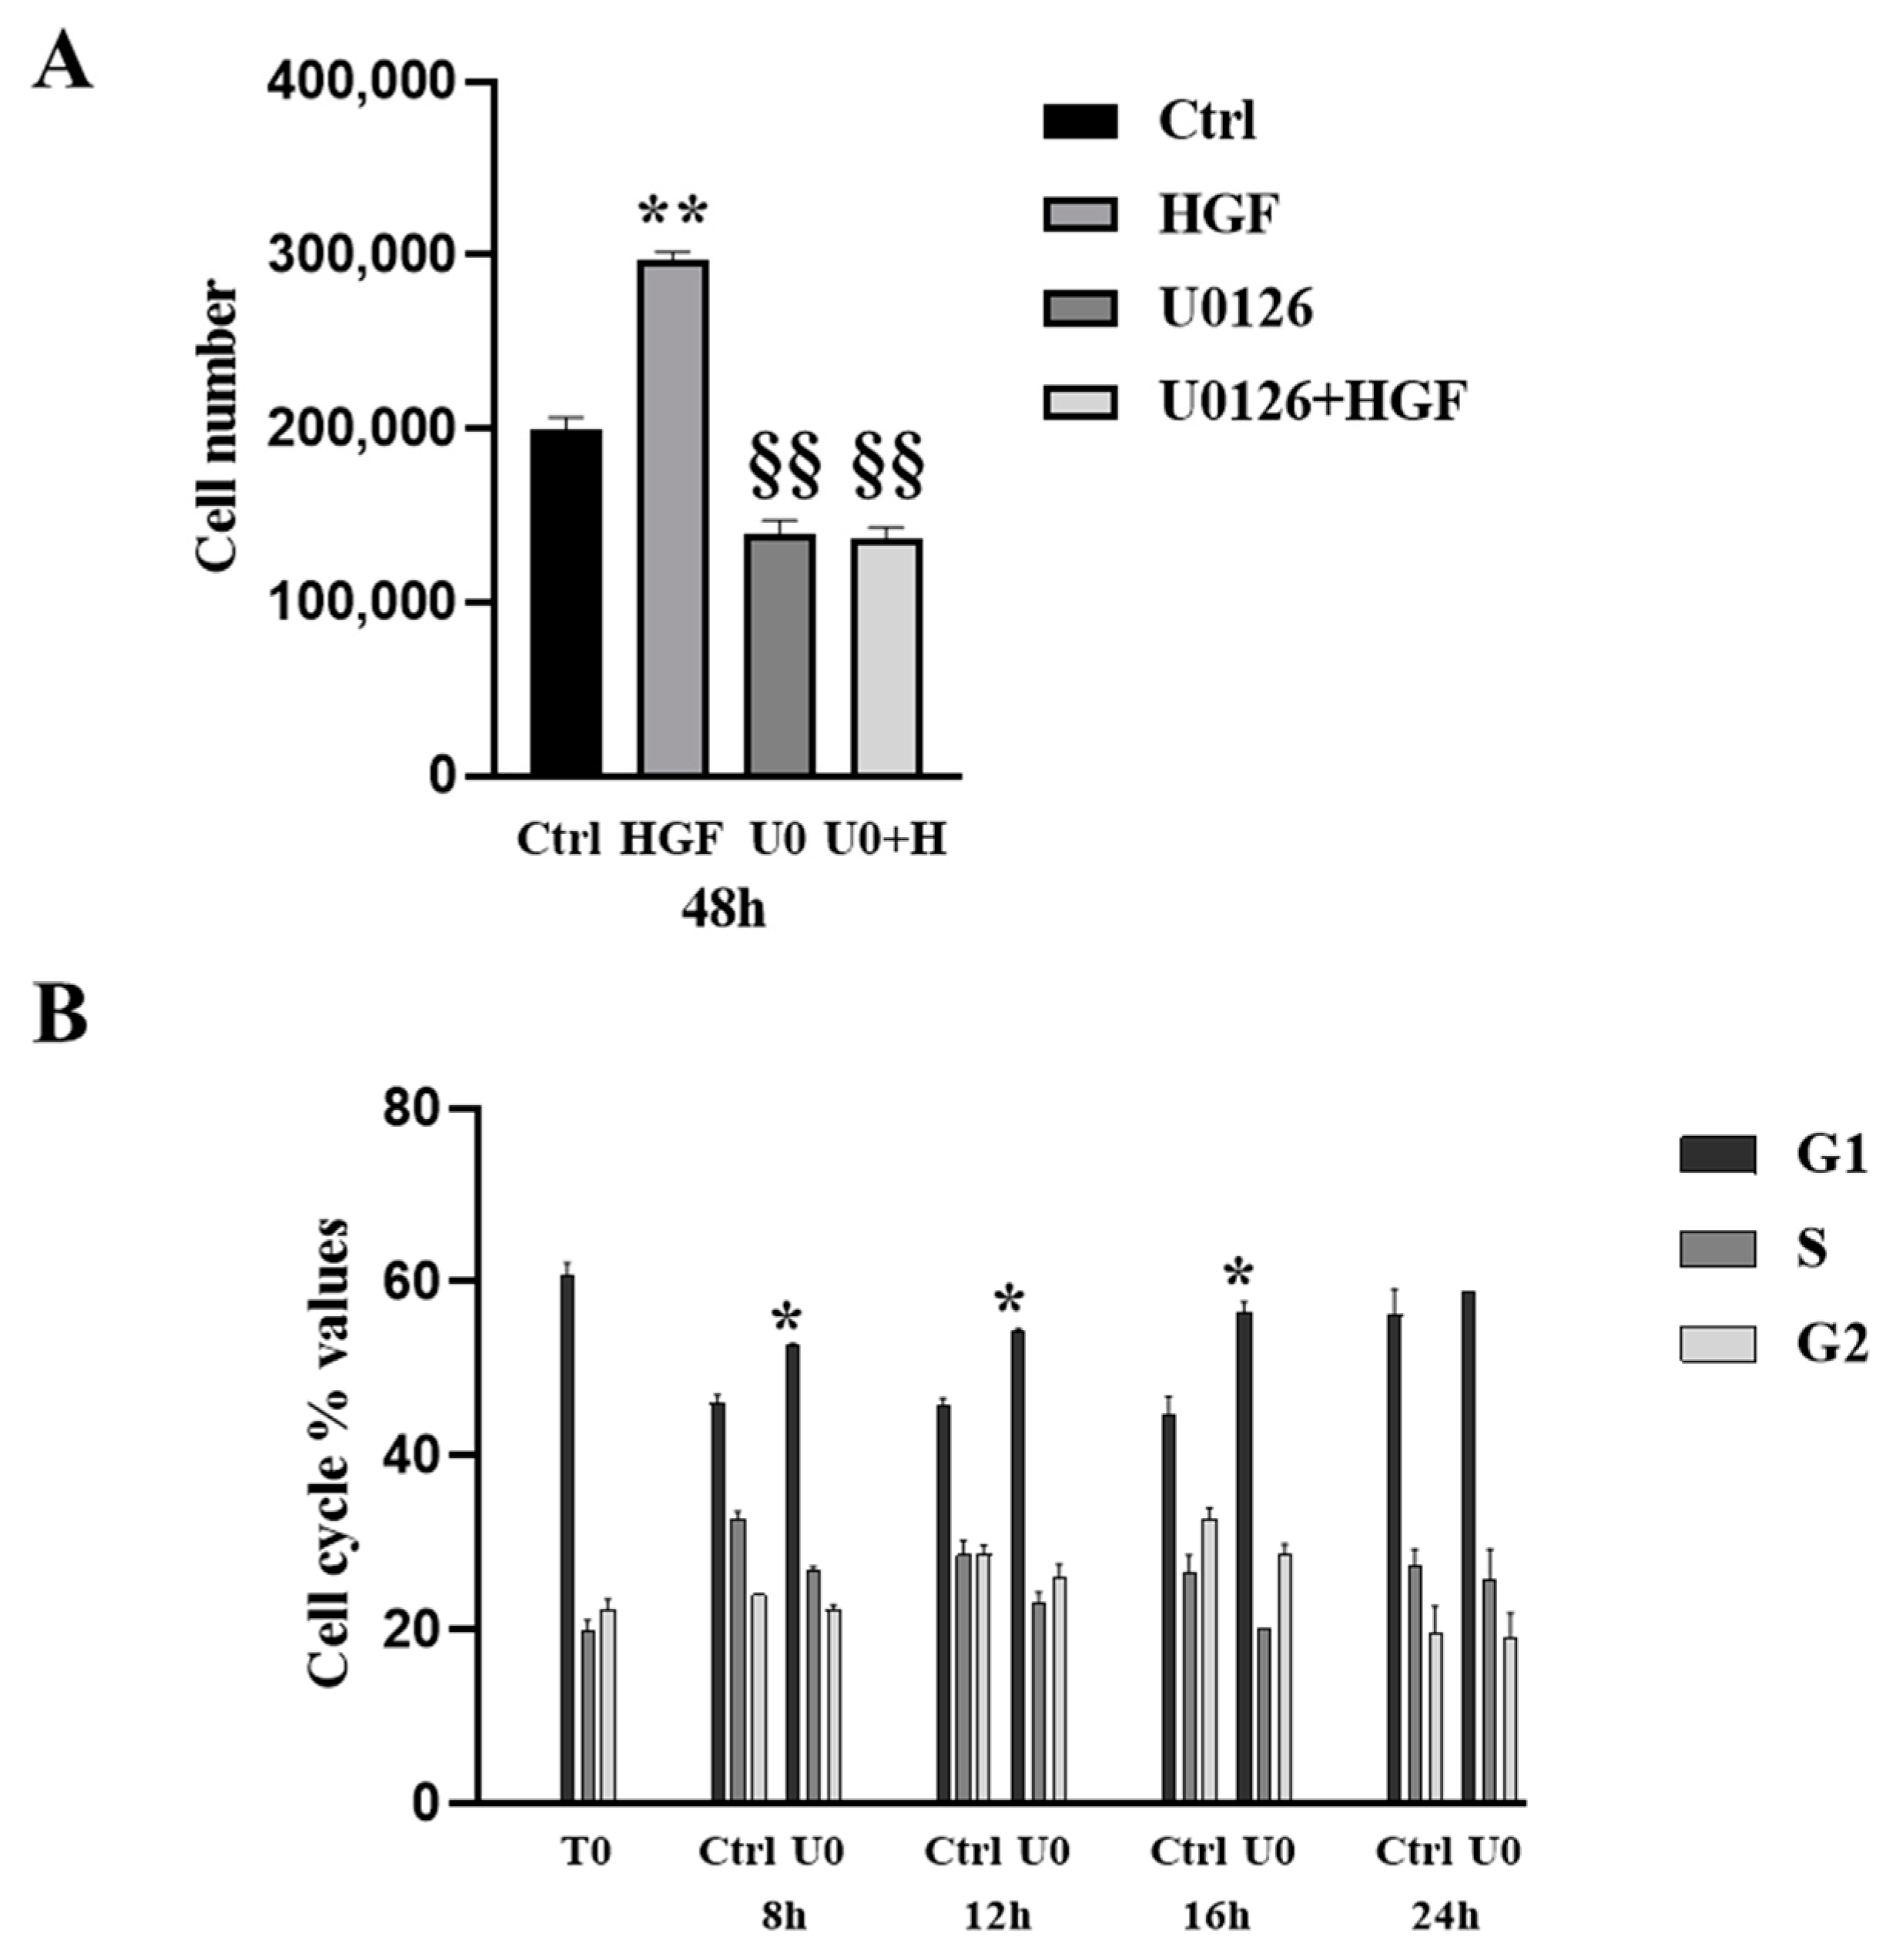
3.4. HGF-Induced NT2D1 Cell Proliferation, Is Mediated by MAPK/ERK Pathway
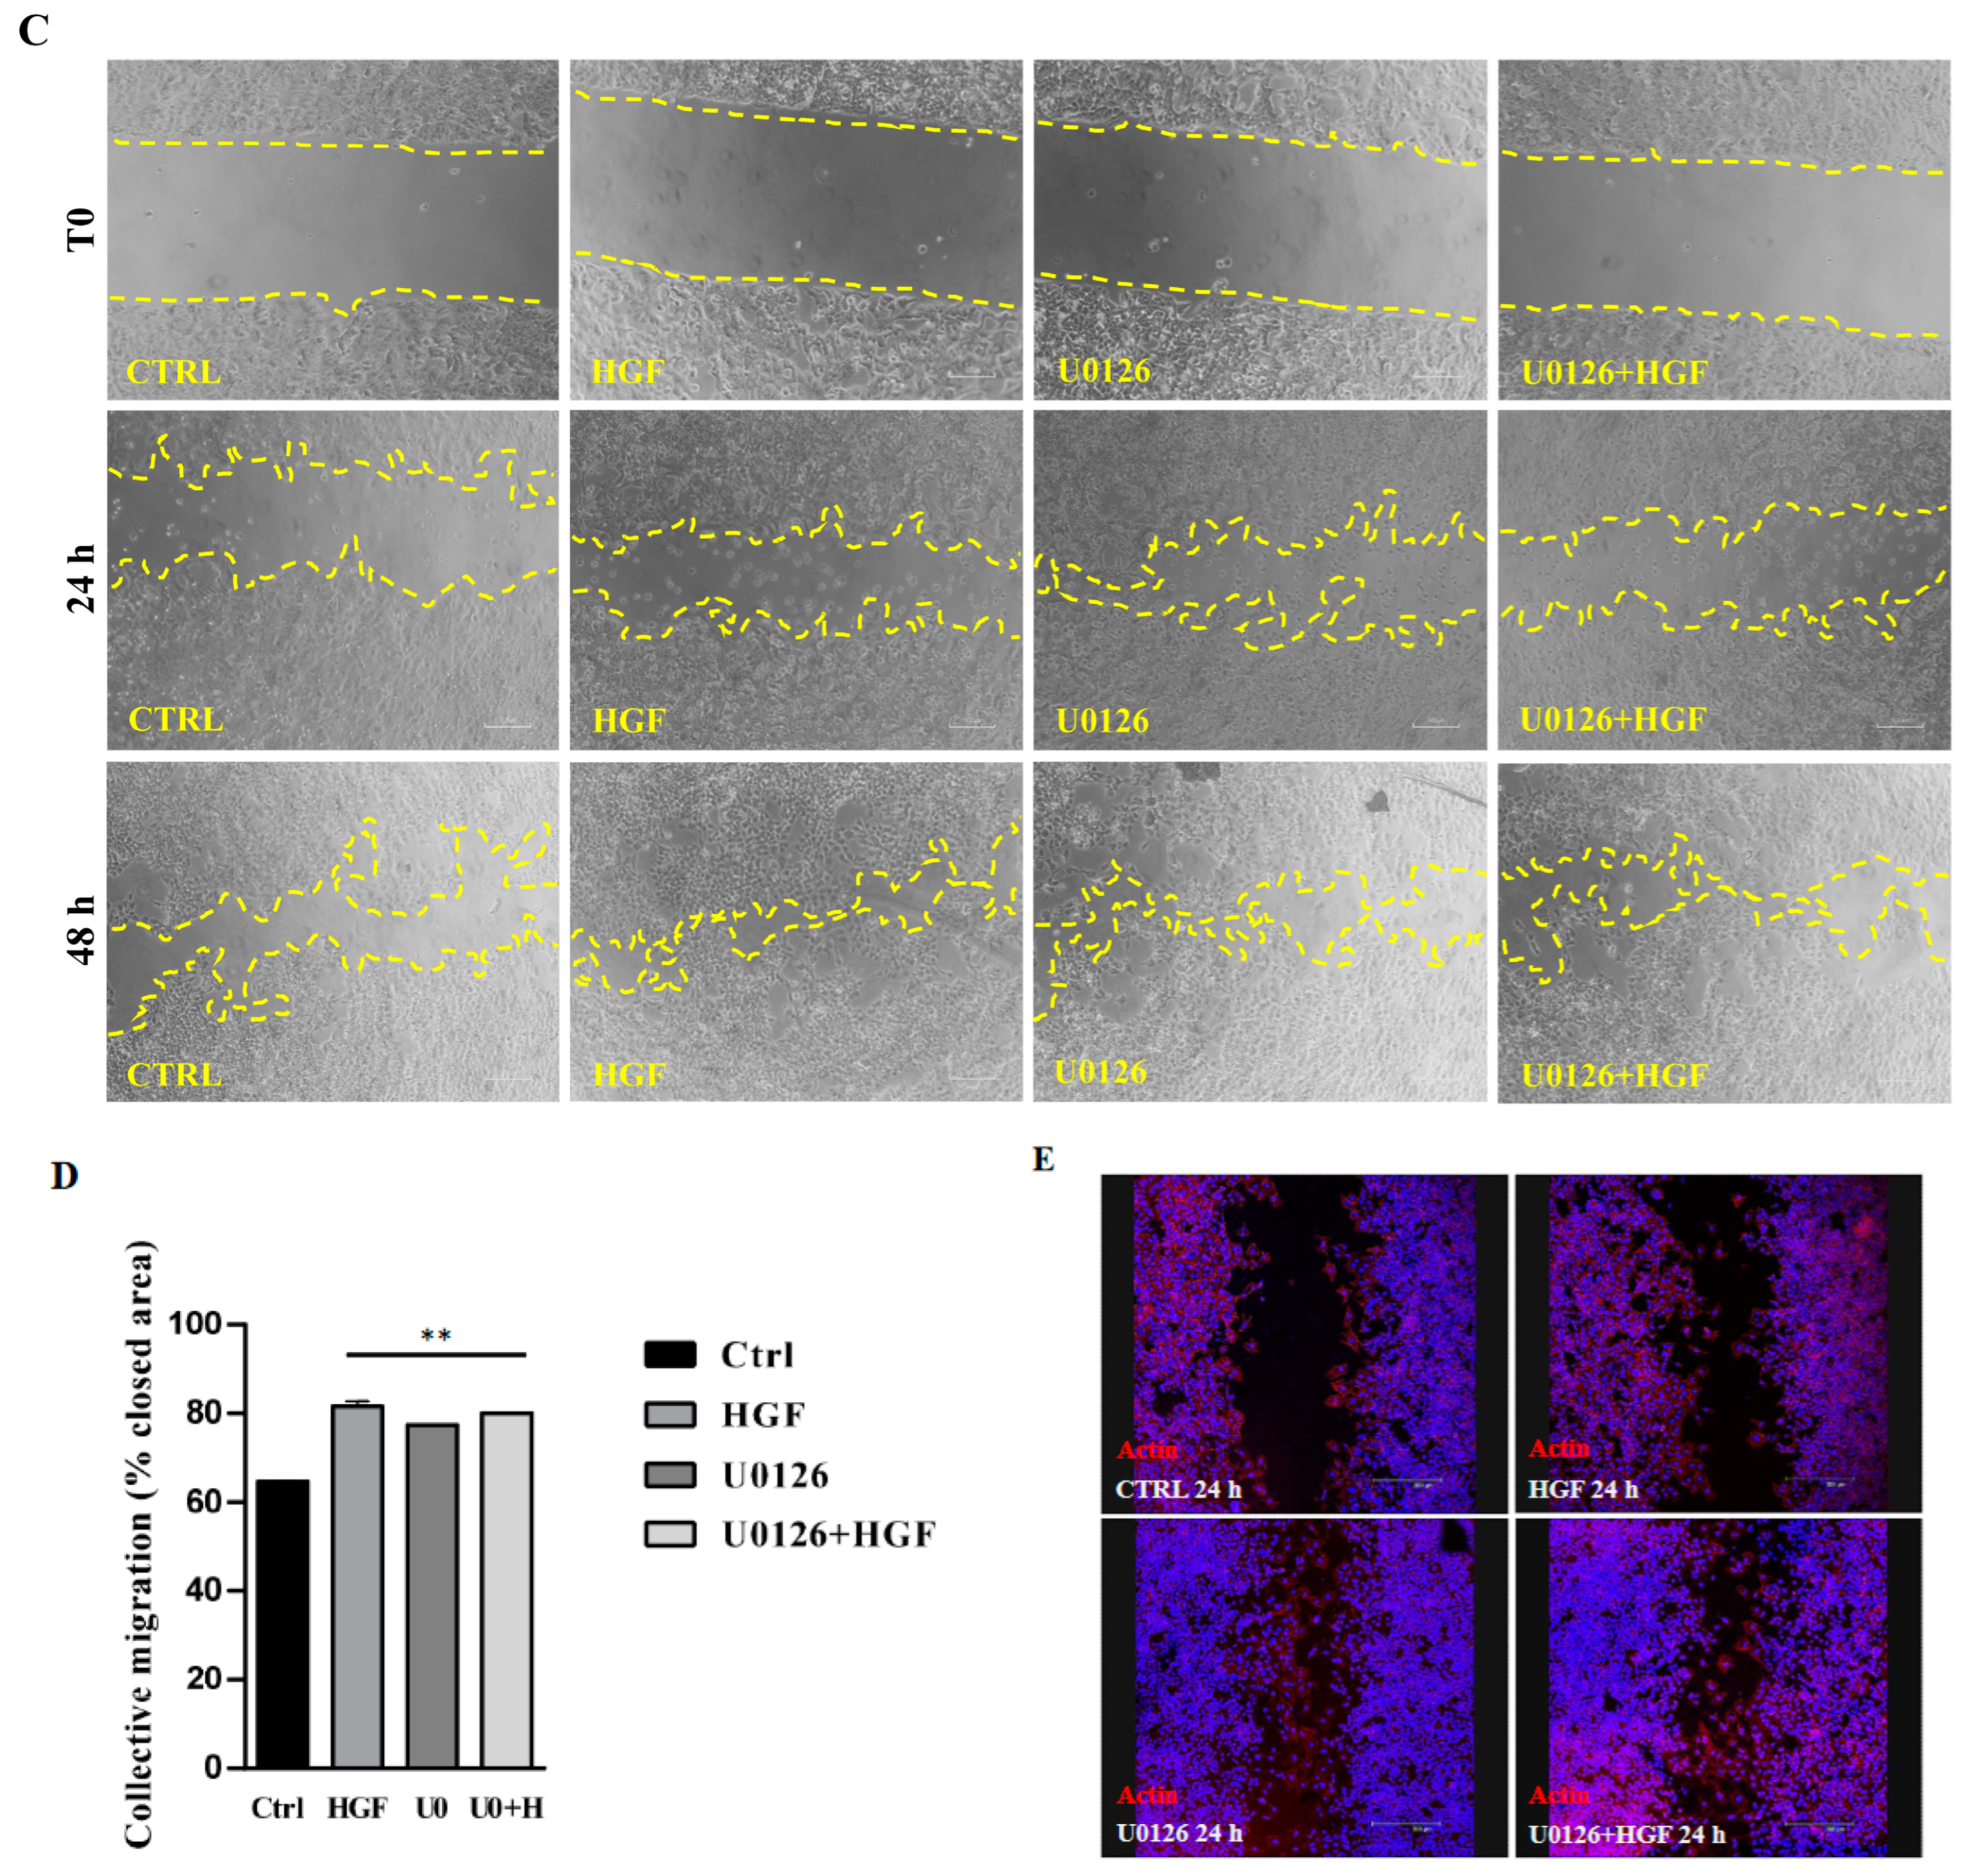
3.5. Inhibition of the ERK Pathway Does Not Result in Inhibition of Cell Motility
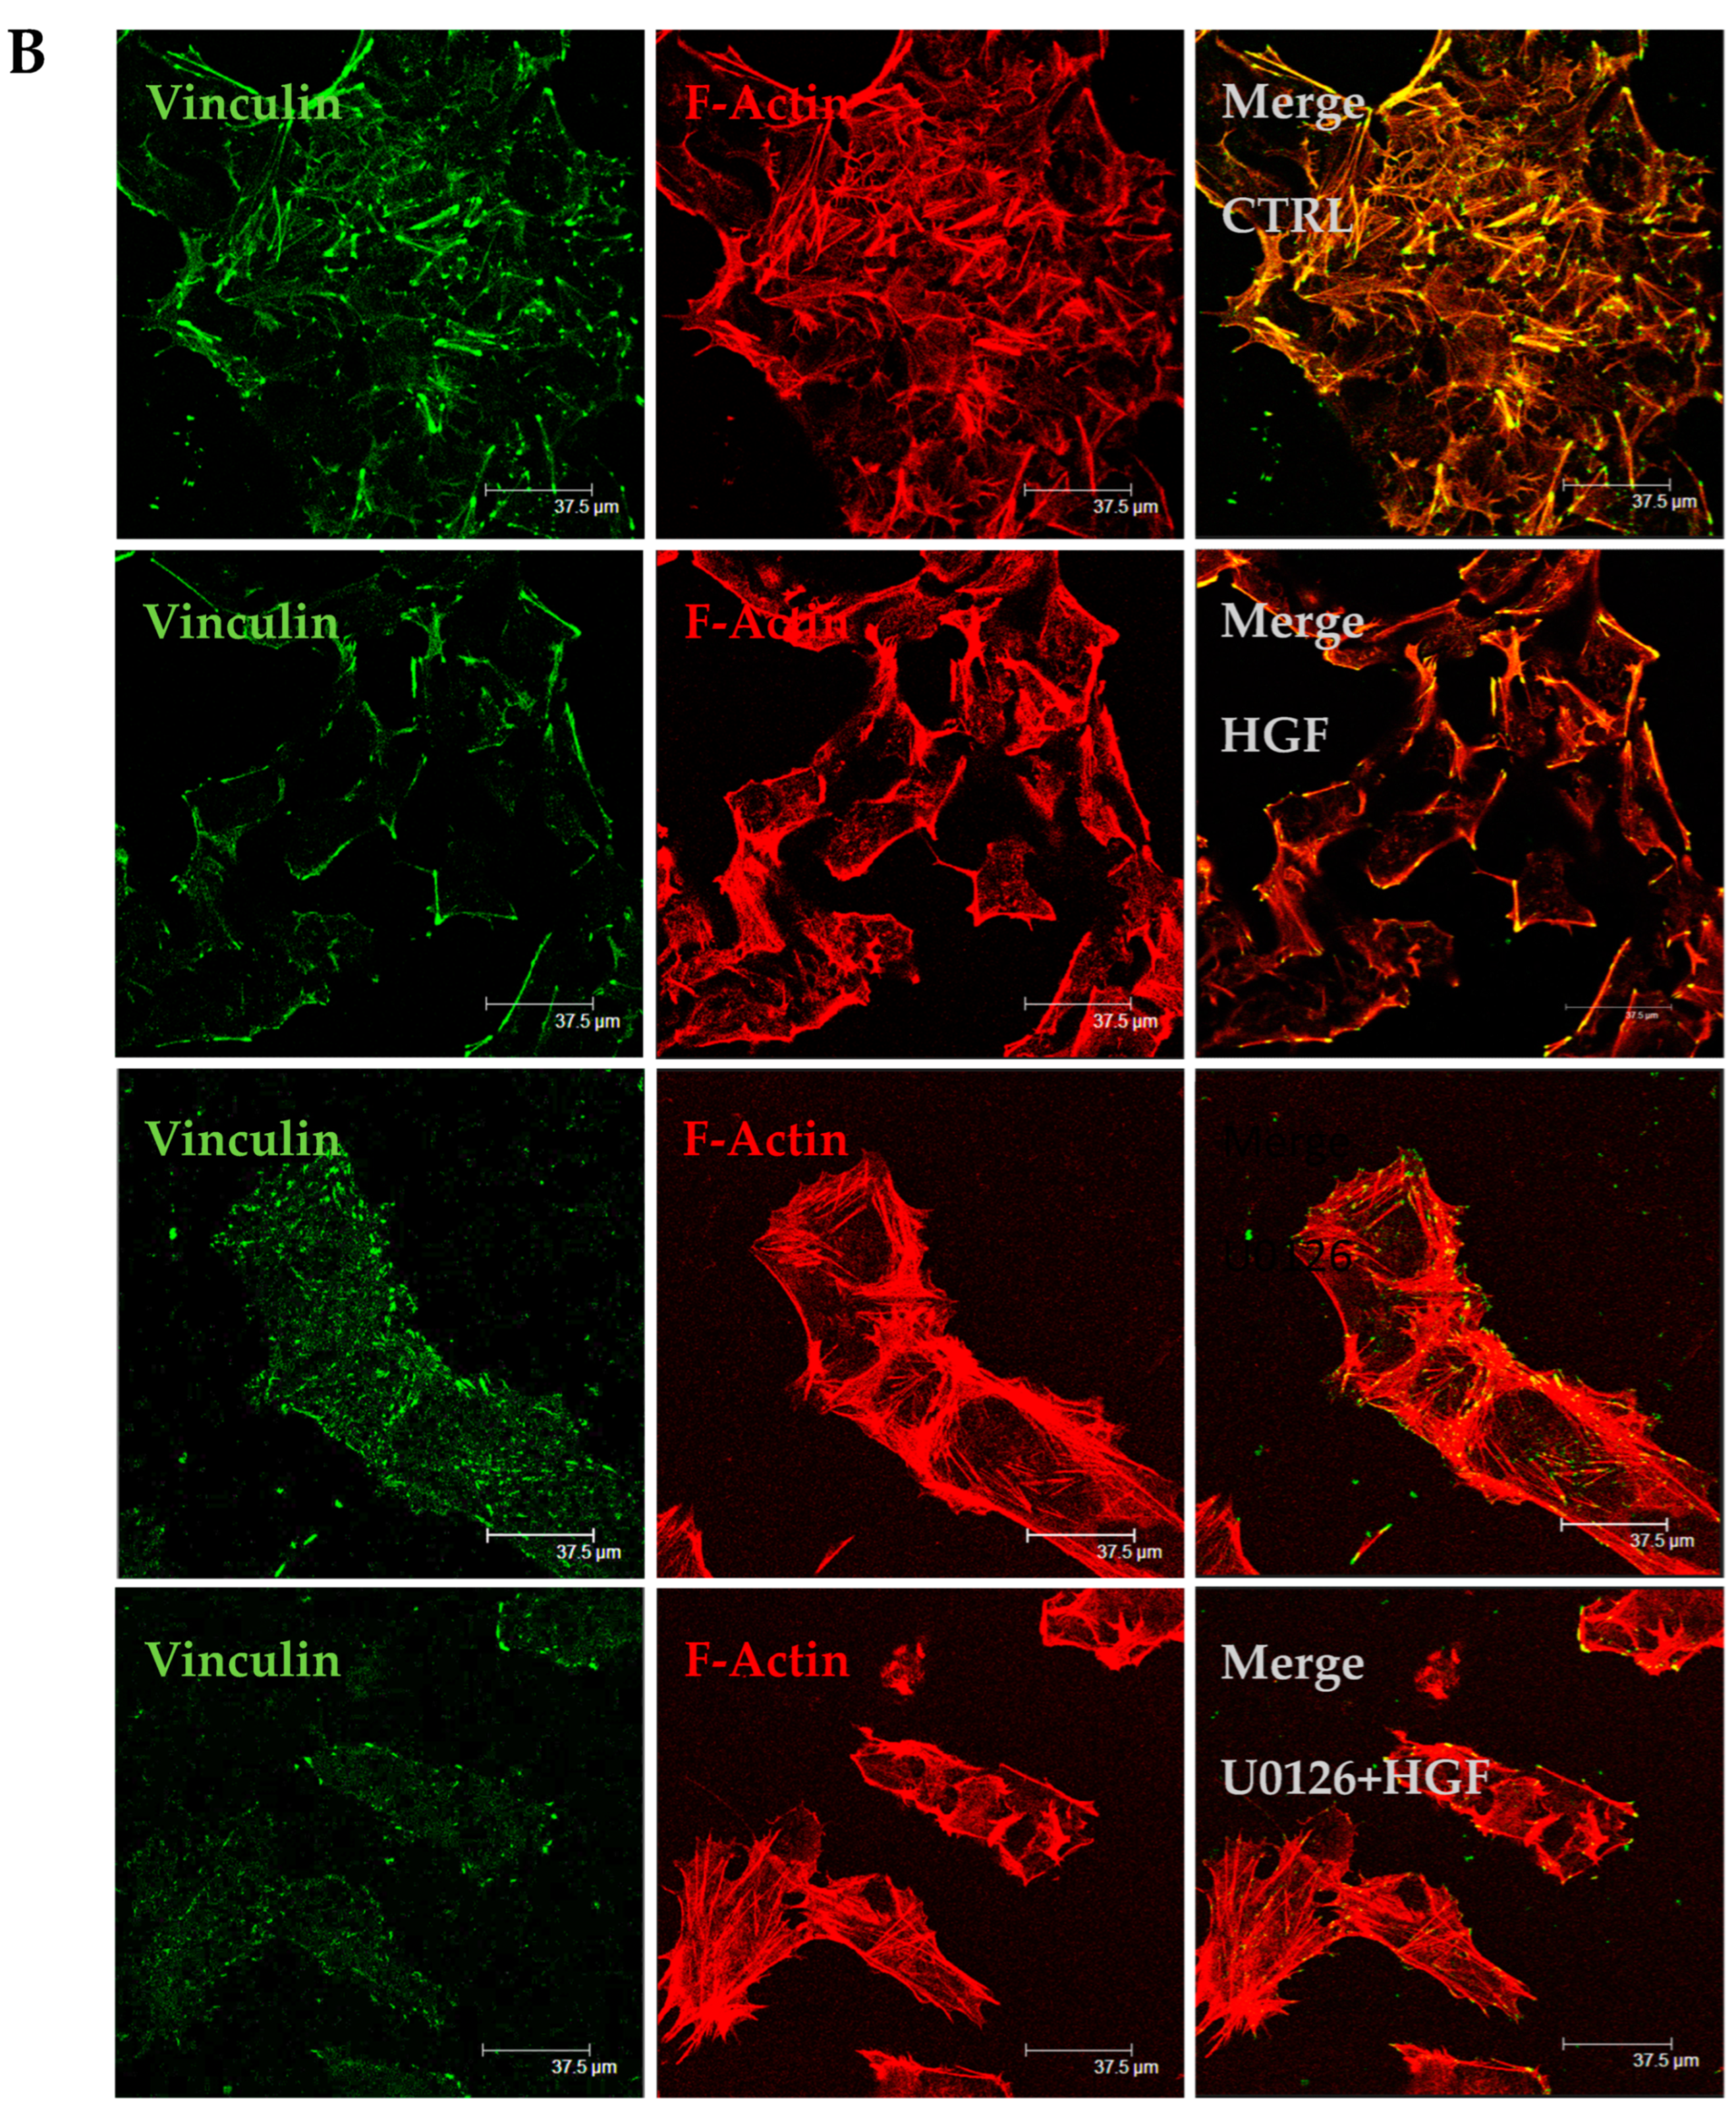
3.6. HGF and U0126 Treated Cells Show Different Cell Morphology
3.7. U0126 Treatment Increases p-AKT Level in NT2D1 Cell Line
3.8. HGF and U0126 Treated Cells Show Different Modulation of EMT Markers
4. Discussion
5. Conclusions
Supplementary Materials
Author Contributions
Funding
Institutional Review Board Statement
Informed Consent Statement
Data Availability Statement
Conflicts of Interest
References
- Yang, X.; Liao, H.-Y.; Zhang, H.-H. Roles of MET in human cancer. Clin. Chim. Acta 2022, 525, 69–83. [Google Scholar] [CrossRef] [PubMed]
- Huang, X.; Chen, Z.; Zhang, N.; Zhu, C.; Lin, X.; Yu, J.; Chen, Z.; Lan, P.; Wan, Y. Increase in CD4+FOXP3+ regulatory T cell number and upregulation of the HGF/c-Met signaling pathway during the liver metastasis of colorectal cancer. Oncol. Lett. 2020, 20, 2113–2118. [Google Scholar] [CrossRef] [PubMed]
- Faiella, A.; Riccardi, F.; Cartenì, G.; Chiurazzi, M.; Onofrio, L. The Emerging Role of c-Met in Carcinogenesis and Clinical Implications as a Possible Therapeutic Target. J. Oncol. 2022, 2022, 5179182. [Google Scholar] [CrossRef] [PubMed]
- Scheri, K.C.; Leonetti, E.; Laino, L.; Gigantino, V.; Gesualdi, L.; Grammatico, P.; Bizzarri, M.; Franco, R.; Oosterhuis, J.W.; Stoop, H.; et al. c-MET receptor as potential biomarker and target molecule for malignant testicular germ cell tumors. Oncotarget 2018, 9, 31842–31860. [Google Scholar] [CrossRef] [PubMed]
- Gesualdi, L.; Leonetti, E.; Cucina, A.; Scicchitano, B.M.; Sorrentino, S.; Tarsitano, M.G.; Isidori, A.; Bizzarri, M.; Filippini, A.; Riccioli, A.; et al. The PI3K/AKT Pathway Is Activated by HGF in NT2D1 Non-Seminoma Cells and Has a Role in the Modulation of Their Malignant Behavior. Int. J. Mol. Sci. 2020, 21, 8669. [Google Scholar] [CrossRef]
- Selfe, J.; Goddard, N.C.; McIntyre, A.; Taylor, K.R.; Renshaw, J.; Popov, S.D.; Thway, K.; Summersgill, B.; Huddart, R.A.; Gilbert, D.C.; et al. IGF1R signalling in testicular germ cell tumour cells impacts on cell survival and acquired cisplatin resistance. J. Pathol. 2018, 244, 242–253. [Google Scholar] [CrossRef]
- Selfe, J.; Shipley, J.M. IGFsignalling in germ cells and testicular germ cell tumours: Roles and therapeutic approaches. Andrology 2019, 7, 536–544. [Google Scholar] [CrossRef]
- Leonetti, E.; Gesualdi, L.; Scheri, K.C.; Dinicola, S.; Fattore, L.; Masiello, M.G.; Cucina, A.; Mancini, R.; Bizzarri, M.; Ricci, G.; et al. c-Src Recruitment is Involved in c-MET-Mediated Malignant Behaviour of NT2D1 Non-Seminoma Cells. Int. J. Mol. Sci. 2019, 20, 320. [Google Scholar] [CrossRef]
- Zhang, Y.; Xia, M.; Jin, K.; Wang, S.; Wei, H.; Fan, C.; Wu, Y.; Li, X.; Li, X.; Li, G.; et al. Function of the c-Met receptor tyrosine kinase in carcinogenesis and associated therapeutic opportunities. Mol. Cancer 2018, 17, 145. [Google Scholar] [CrossRef]
- Britten, C.D. PI3K and MEK inhibitor combinations: Examining the evidence in selected tumor types. Cancer Chemother. Pharmacol. 2013, 71, 1395–1409. [Google Scholar] [CrossRef]
- Guo, Y.J.; Pan, W.W.; Liu, S.B.; Shen, Z.F.; Xu, Y.; Hu, L.L. ERK/MAPK signalling pathway and tumorigenesis. Exp. Ther. Med. 2020, 19, 1997–2007. [Google Scholar] [CrossRef]
- Wu, P.-K.; Park, J.-I. MEK1/2 Inhibitors: Molecular Activity and Resistance Mechanisms. Semin. Oncol. 2015, 42, 849–862. [Google Scholar] [CrossRef]
- Schreck, K.C.; Allen, A.N.; Wang, J.; Pratilas, C.A. Combination MEK and mTOR inhibitor therapy is active in models of glioblastoma. Neuro-Oncol. Adv. 2020, 2, vdaa138. [Google Scholar] [CrossRef]
- Choi, C.; Helfman, D.M. The Ras-ERK pathway modulates cytoskeleton organization, cell motility and lung metastasis signature genes in MDA-MB-231 LM2. Oncogene 2014, 33, 3668–3676. [Google Scholar] [CrossRef] [PubMed]
- Dinicola, S.; Masiello, M.G.; Proietti, S.; Coluccia, P.; Fabrizi, G.; Catizone, A.; Ricci, G.; de Toma, G.; Bizzarri, M.; Cucina, A. Nicotine increases colon cancer cell migration and invasion through epithelial to mesenchymal transition (EMT): COX-2 involvement. J. Cell. Physiol. 2018, 233, 4935–4948. [Google Scholar] [CrossRef]
- Rubtsova, S.N.; Zhitnyak, I.Y.; Gloushankova, N.A. Phenotypic Plasticity of Cancer Cells Based on Remodeling of the Actin Cytoskeleton and Adhesive Structures. Int. J. Mol. Sci. 2021, 22, 1821. [Google Scholar] [CrossRef]
- Chen, T.; You, Y.; Jiang, H.; Wang, Z.Z. Epithelial-mesenchymal transition (EMT): A biological process in the development, stem cell differentiation, and tumorigenesis. J. Cell. Physiol. 2017, 232, 3261–3272. [Google Scholar] [CrossRef] [PubMed]
- Elliott, B.E.; Hung, W.L.; Boag, A.H.; Tuck, A.B. The role of hepatocyte growth factor (scatter factor) in epithelial–mesenchymal transition and breast cancer. Can. J. Physiol. Pharmacol. 2002, 80, 91–102. [Google Scholar] [CrossRef] [PubMed]
- Raj, S.; Kesari, K.K.; Kumar, A.; Rathi, B.; Sharma, A.; Gupta, P.K.; Jha, S.K.; Jha, N.K.; Slama, P.; Roychoudhury, S.; et al. Molecular mechanism(s) of regulation(s) of c-MET/HGF signaling in head and neck cancer. Mol. Cancer 2022, 21, 31. [Google Scholar] [CrossRef] [PubMed]
- To, K.K.W.; Cho, W.C.S. Mesenchymal Epithelial Transition (MET): A Key Player in Chemotherapy Resistance and an Emerging Target for Potentiating Cancer Immunotherapy. Curr. Cancer Drug Targets 2022, 22, 269–285. [Google Scholar] [CrossRef] [PubMed]
- Lobo, J.; Jerónimo, C.; Henrique, R. Cisplatin Resistance in Testicular Germ Cell Tumors: Current Challenges from Various Perspectives. Cancers 2020, 12, 1601. [Google Scholar] [CrossRef] [PubMed]
- Nason, G.J.; Chung, P.; Warde, P.; Huddart, R.; Albers, P.; Kollmannsberger, C.; Booth, C.M.; Hansen, A.R.; Bedard, P.L.; Einhorn, L.; et al. Controversies in the management of clinical stage 1 testis cancer. Can. Urol. Assoc. J. 2020, 14, E537–E542. [Google Scholar] [CrossRef] [PubMed]
- LutkeHolzik, M.F.; Sijmons, R.H.; Hoekstra-Weebers, J.E.; Sleijfer, D.T.; Hoekstra, H.J. Clinical and genetic aspects of testicular germ cell tumours. Hered. Cancer Clin. Pract. 2008, 6, 3–14. [Google Scholar] [CrossRef]
- Inoue, Y.; Nakamura, T.; Nakanishi, H.; Oishi, M.; Hongo, F.; Okihara, K.; Mizutani, S.; Kuroda, J.; Ukimura, O. Therapy-related acute myeloid leukemia and myelodysplastic syndrome among refractory germ cell tumor patients. Int. J. Urol. 2018, 25, 678–683. [Google Scholar] [CrossRef] [PubMed]
- Pichler, R.; Leonhartsberger, N.; Stöhr, B.; Horninger, W.; Steiner, H. Two cycles of cisplatin-based chemotherapy for low-volume stage II seminoma: Results of a retrospective, single-center case series. Chemotherapy 2012, 58, 405–410. [Google Scholar] [CrossRef]
- de Vries, G.; Rosas-Plaza, X.; van Vugt, M.; Gietema, J.A.; de Jong, S. Testicular cancer: Determinants of cisplatin sensitivity and novel therapeutic opportunities. Cancer Treat. Rev. 2020, 88, 102054. [Google Scholar] [CrossRef]
- Looijenga, L.H.; Zafarana, G.; Grygalewicz, B.; Summersgill, B.; Debiec-Rychter, M.; Veltman, J.; Schoenmakers, E.F.; Rodriguez, S.; Jafer, O.; Clark, J.; et al. Role of gain of 12p in germ cell tumour development. APMIS 2003, 111, 161–171. [Google Scholar] [CrossRef] [PubMed]
- Singh, R.; Fazal, Z.; Freemantle, S.J.; Spinella, M.J. Between a Rock and a Hard Place: An Epigenetic-Centric View of Testicular Germ Cell Tumors. Cancers 2021, 13, 1506. [Google Scholar] [CrossRef]
- Oosterhuis, J.W.; Looijenga, L.H.J. Human germ cell tumours from a developmental perspective. Nat. Rev. Cancer 2019, 19, 522–537. [Google Scholar] [CrossRef]
- Stoop, H.; Honecker, F.; van de Geijn, G.J.; Gillis, A.J.; Cools, M.C.; de Boer, M.; Bokemeyer, C.; Wolffenbuttel, K.P.; Drop, S.L.; de Krijger, R.R.; et al. Stem cell factor as a novel diagnostic marker for early malignant germ cells. J. Pathol. 2008, 216, 43–54. [Google Scholar] [CrossRef]
- Huang, X.; Li, E.; Shen, H.; Wang, X.; Tang, T.; Zhang, X.; Xu, J.; Tang, Z.; Guo, C.; Bai, X.; et al. Targeting the HGF/MET Axis in Cancer Therapy: Challenges in Resistance and Opportunities for Improvement. Front. Cell Dev. Biol. 2020, 8, 152. [Google Scholar] [CrossRef] [PubMed]
- Jin, Y.; Cai, W.; Zhao, C.; Yang, F.; Yang, C.; Zhang, X.; Zhou, Q.; Zhao, W.; Zhang, C.; Zhang, F.; et al. EMT status of circulating breast cancer cells and impact of fluidic shear stress. Exp. Cell Res. 2022, 421, 113385. [Google Scholar] [CrossRef] [PubMed]
- Aggarwal, V.; Montoya, C.A.; Donnenberg, V.S.; Sant, S. Interplay between tumor microenvironment and partial EMT as the driver of tumor progression. iScience 2021, 24, 102113. [Google Scholar] [CrossRef]
- Pearlman, R.L.; Montes de Oca, M.K.; Pal, H.C.; Afaq, F. Potential therapeutic targets of epithelial–mesenchymal transition in melanoma. Cancer Lett. 2017, 391, 125–140. [Google Scholar] [CrossRef] [PubMed]


Disclaimer/Publisher’s Note: The statements, opinions and data contained in all publications are solely those of the individual author(s) and contributor(s) and not of MDPI and/or the editor(s). MDPI and/or the editor(s) disclaim responsibility for any injury to people or property resulting from any ideas, methods, instructions or products referred to in the content. |
© 2023 by the authors. Licensee MDPI, Basel, Switzerland. This article is an open access article distributed under the terms and conditions of the Creative Commons Attribution (CC BY) license (https://creativecommons.org/licenses/by/4.0/).
Share and Cite
Gesualdi, L.; Berardini, M.; Scicchitano, B.M.; Castaldo, C.; Bizzarri, M.; Filippini, A.; Riccioli, A.; Schiraldi, C.; Ferranti, F.; Liguoro, D.; et al. ERK Signaling Pathway Is Constitutively Active in NT2D1 Non-Seminoma Cells and Its Inhibition Impairs Basal and HGF-Activated Cell Proliferation. Biomedicines 2023, 11, 1894. https://doi.org/10.3390/biomedicines11071894
Gesualdi L, Berardini M, Scicchitano BM, Castaldo C, Bizzarri M, Filippini A, Riccioli A, Schiraldi C, Ferranti F, Liguoro D, et al. ERK Signaling Pathway Is Constitutively Active in NT2D1 Non-Seminoma Cells and Its Inhibition Impairs Basal and HGF-Activated Cell Proliferation. Biomedicines. 2023; 11(7):1894. https://doi.org/10.3390/biomedicines11071894
Chicago/Turabian StyleGesualdi, Luisa, Marika Berardini, Bianca Maria Scicchitano, Clotilde Castaldo, Mariano Bizzarri, Antonio Filippini, Anna Riccioli, Chiara Schiraldi, Francesca Ferranti, Domenico Liguoro, and et al. 2023. "ERK Signaling Pathway Is Constitutively Active in NT2D1 Non-Seminoma Cells and Its Inhibition Impairs Basal and HGF-Activated Cell Proliferation" Biomedicines 11, no. 7: 1894. https://doi.org/10.3390/biomedicines11071894
APA StyleGesualdi, L., Berardini, M., Scicchitano, B. M., Castaldo, C., Bizzarri, M., Filippini, A., Riccioli, A., Schiraldi, C., Ferranti, F., Liguoro, D., Mancini, R., Ricci, G., & Catizone, A. (2023). ERK Signaling Pathway Is Constitutively Active in NT2D1 Non-Seminoma Cells and Its Inhibition Impairs Basal and HGF-Activated Cell Proliferation. Biomedicines, 11(7), 1894. https://doi.org/10.3390/biomedicines11071894