
Characteristics of Intestinal Microbiota in Japanese Patients with Mild Cognitive Impairment and a Risk-Estimating Method for the Disorder

 , ,
, , 
Abstract
1. Introduction
2. Materials and Methods
2.1. Study Participants
2.2. Ethical Considerations
2.3. Questionnaire Survey
2.4. Stool Samples
2.5. 16S rRNA Data Analysis
2.6. Analysis of Intestinal Microbiota
2.7. Statistical Analysis of Data Excluding Intestinal Microbiota Data
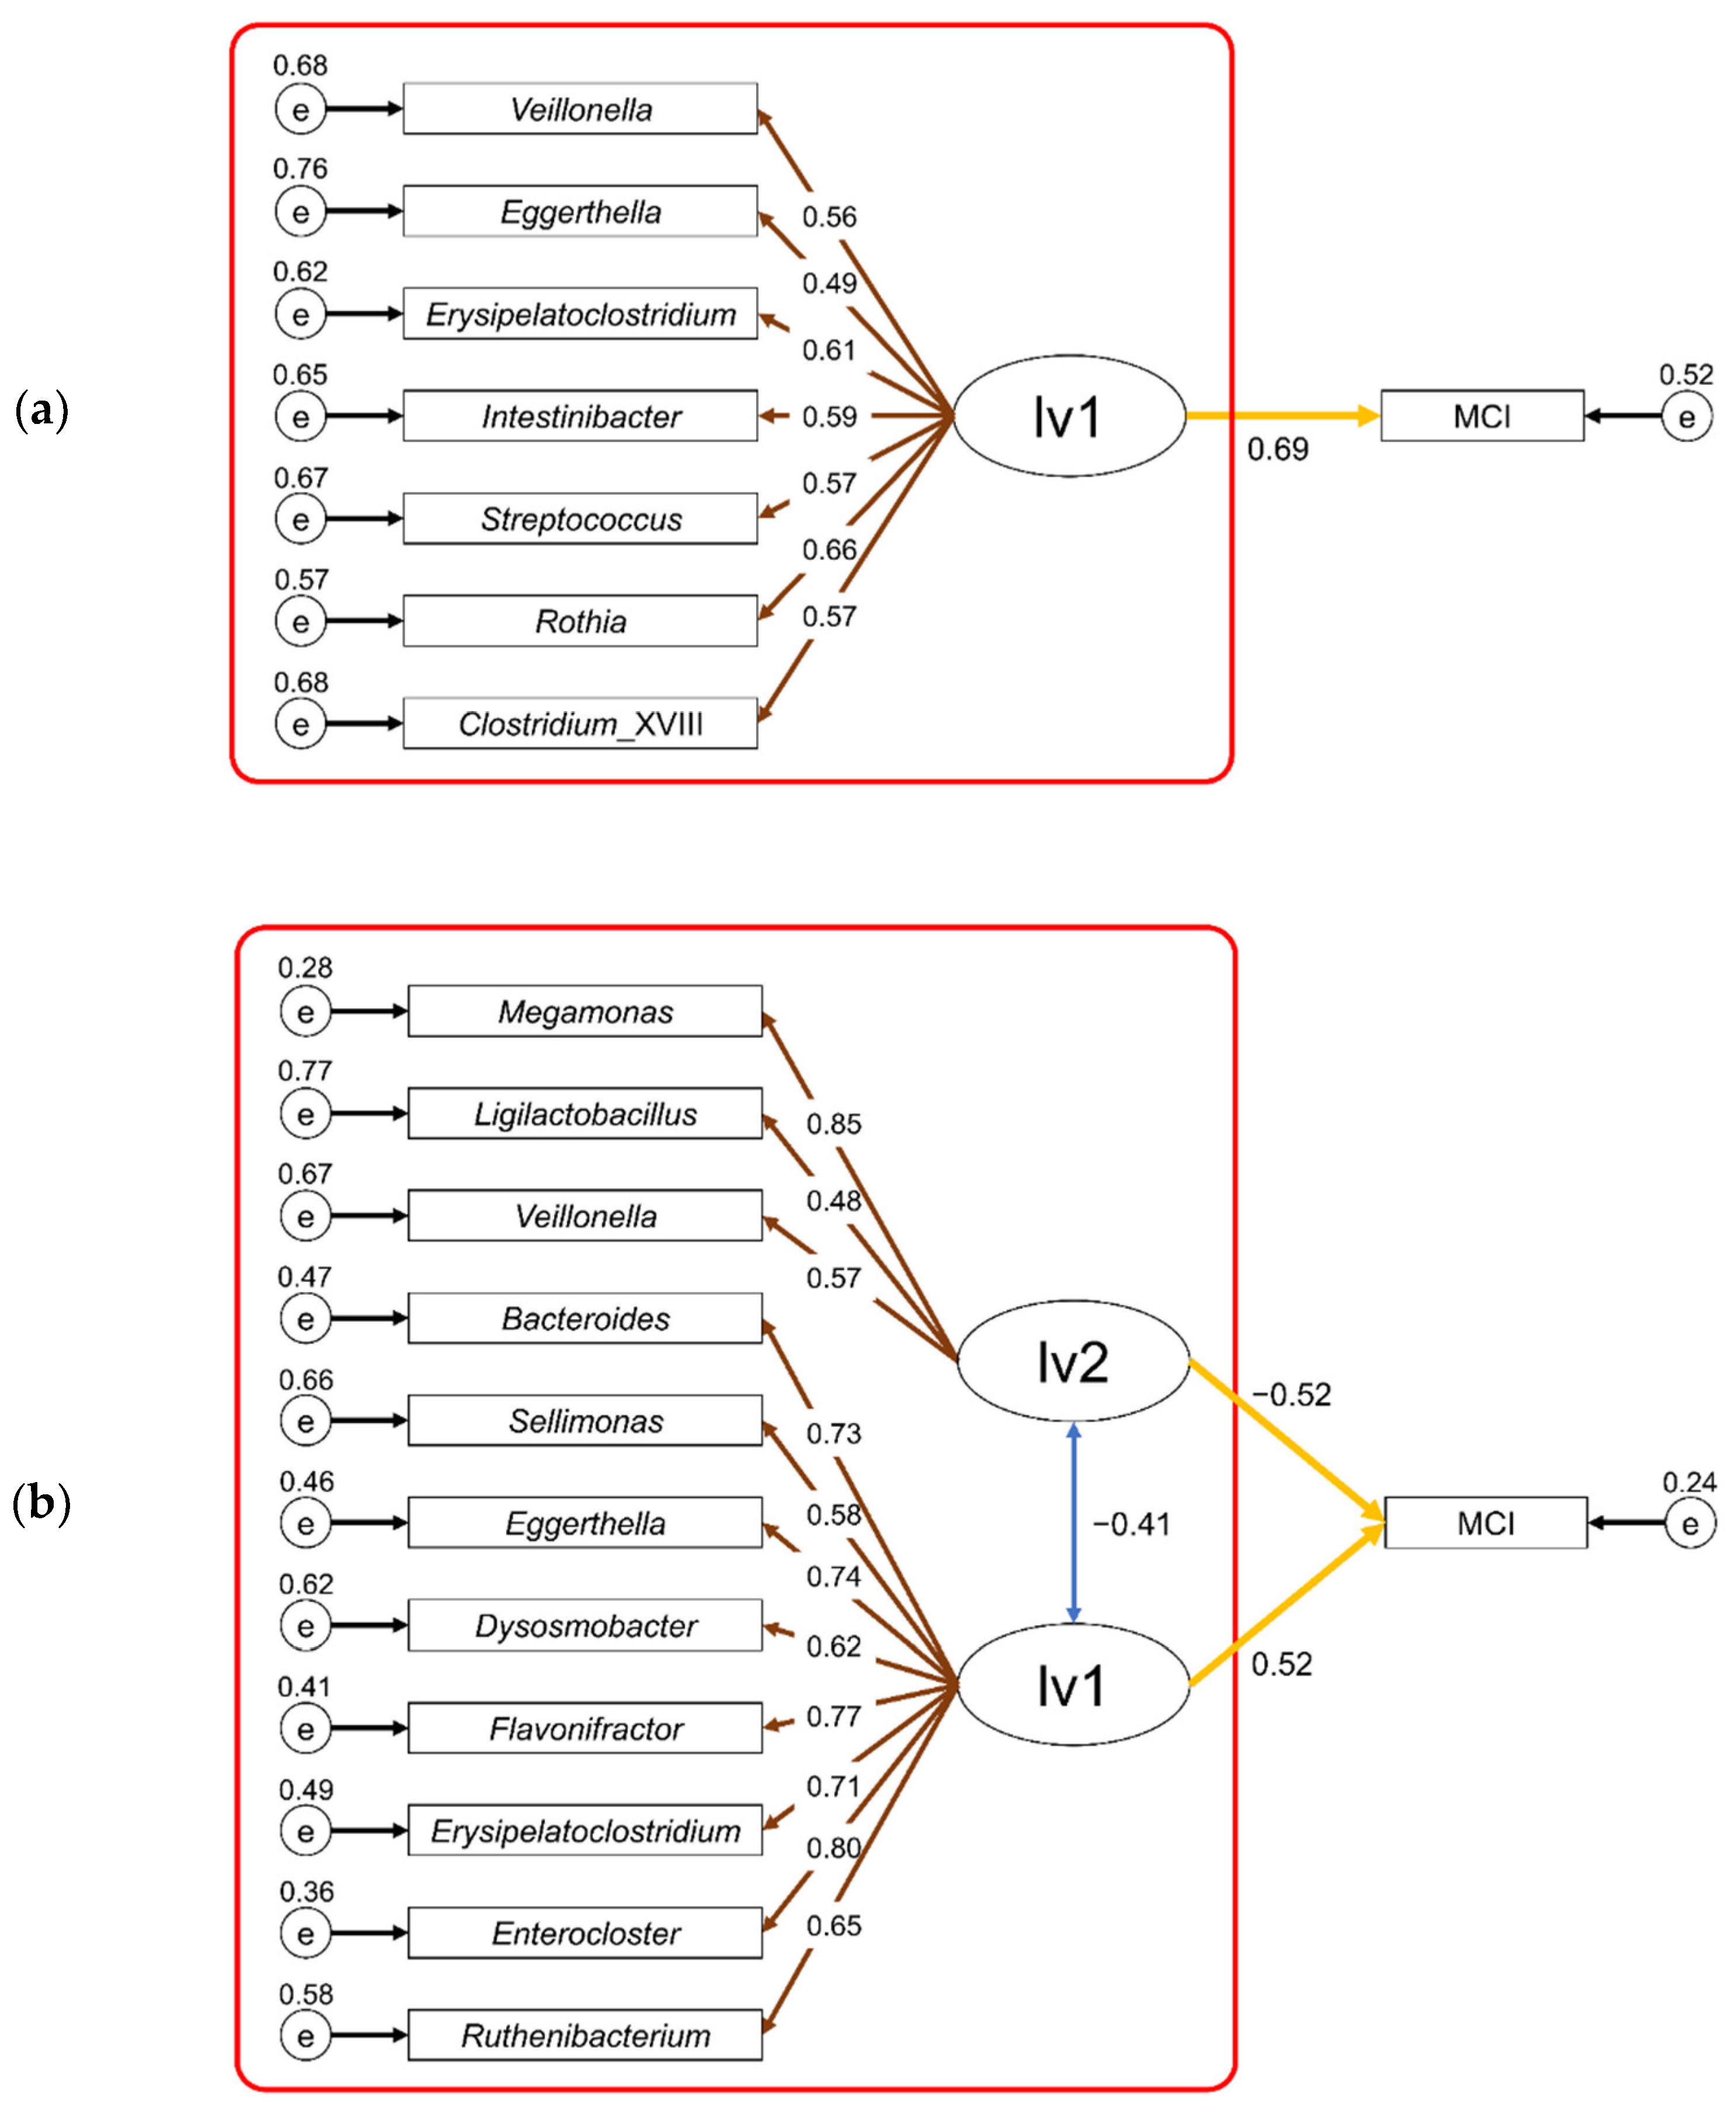
2.8. MCI Risk Estimation Modeling
3. Results
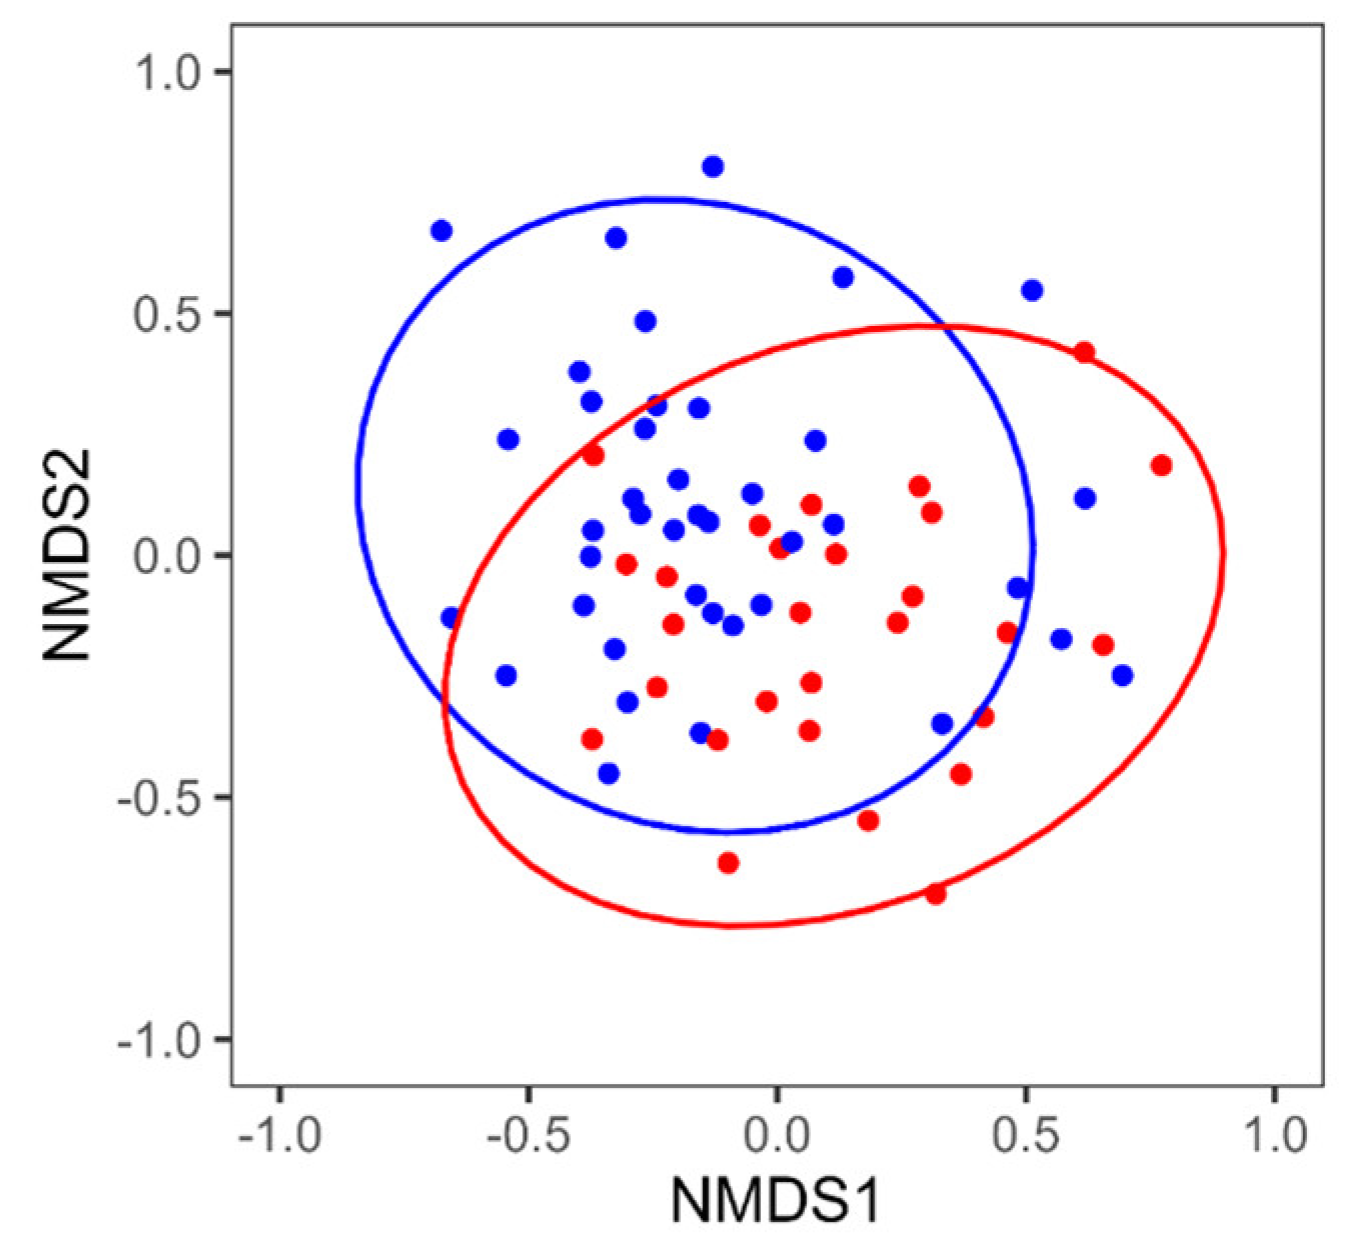
3.1. Comparison of Intestinal Microbiota between MCI and Control Groups (Mixed Sex)
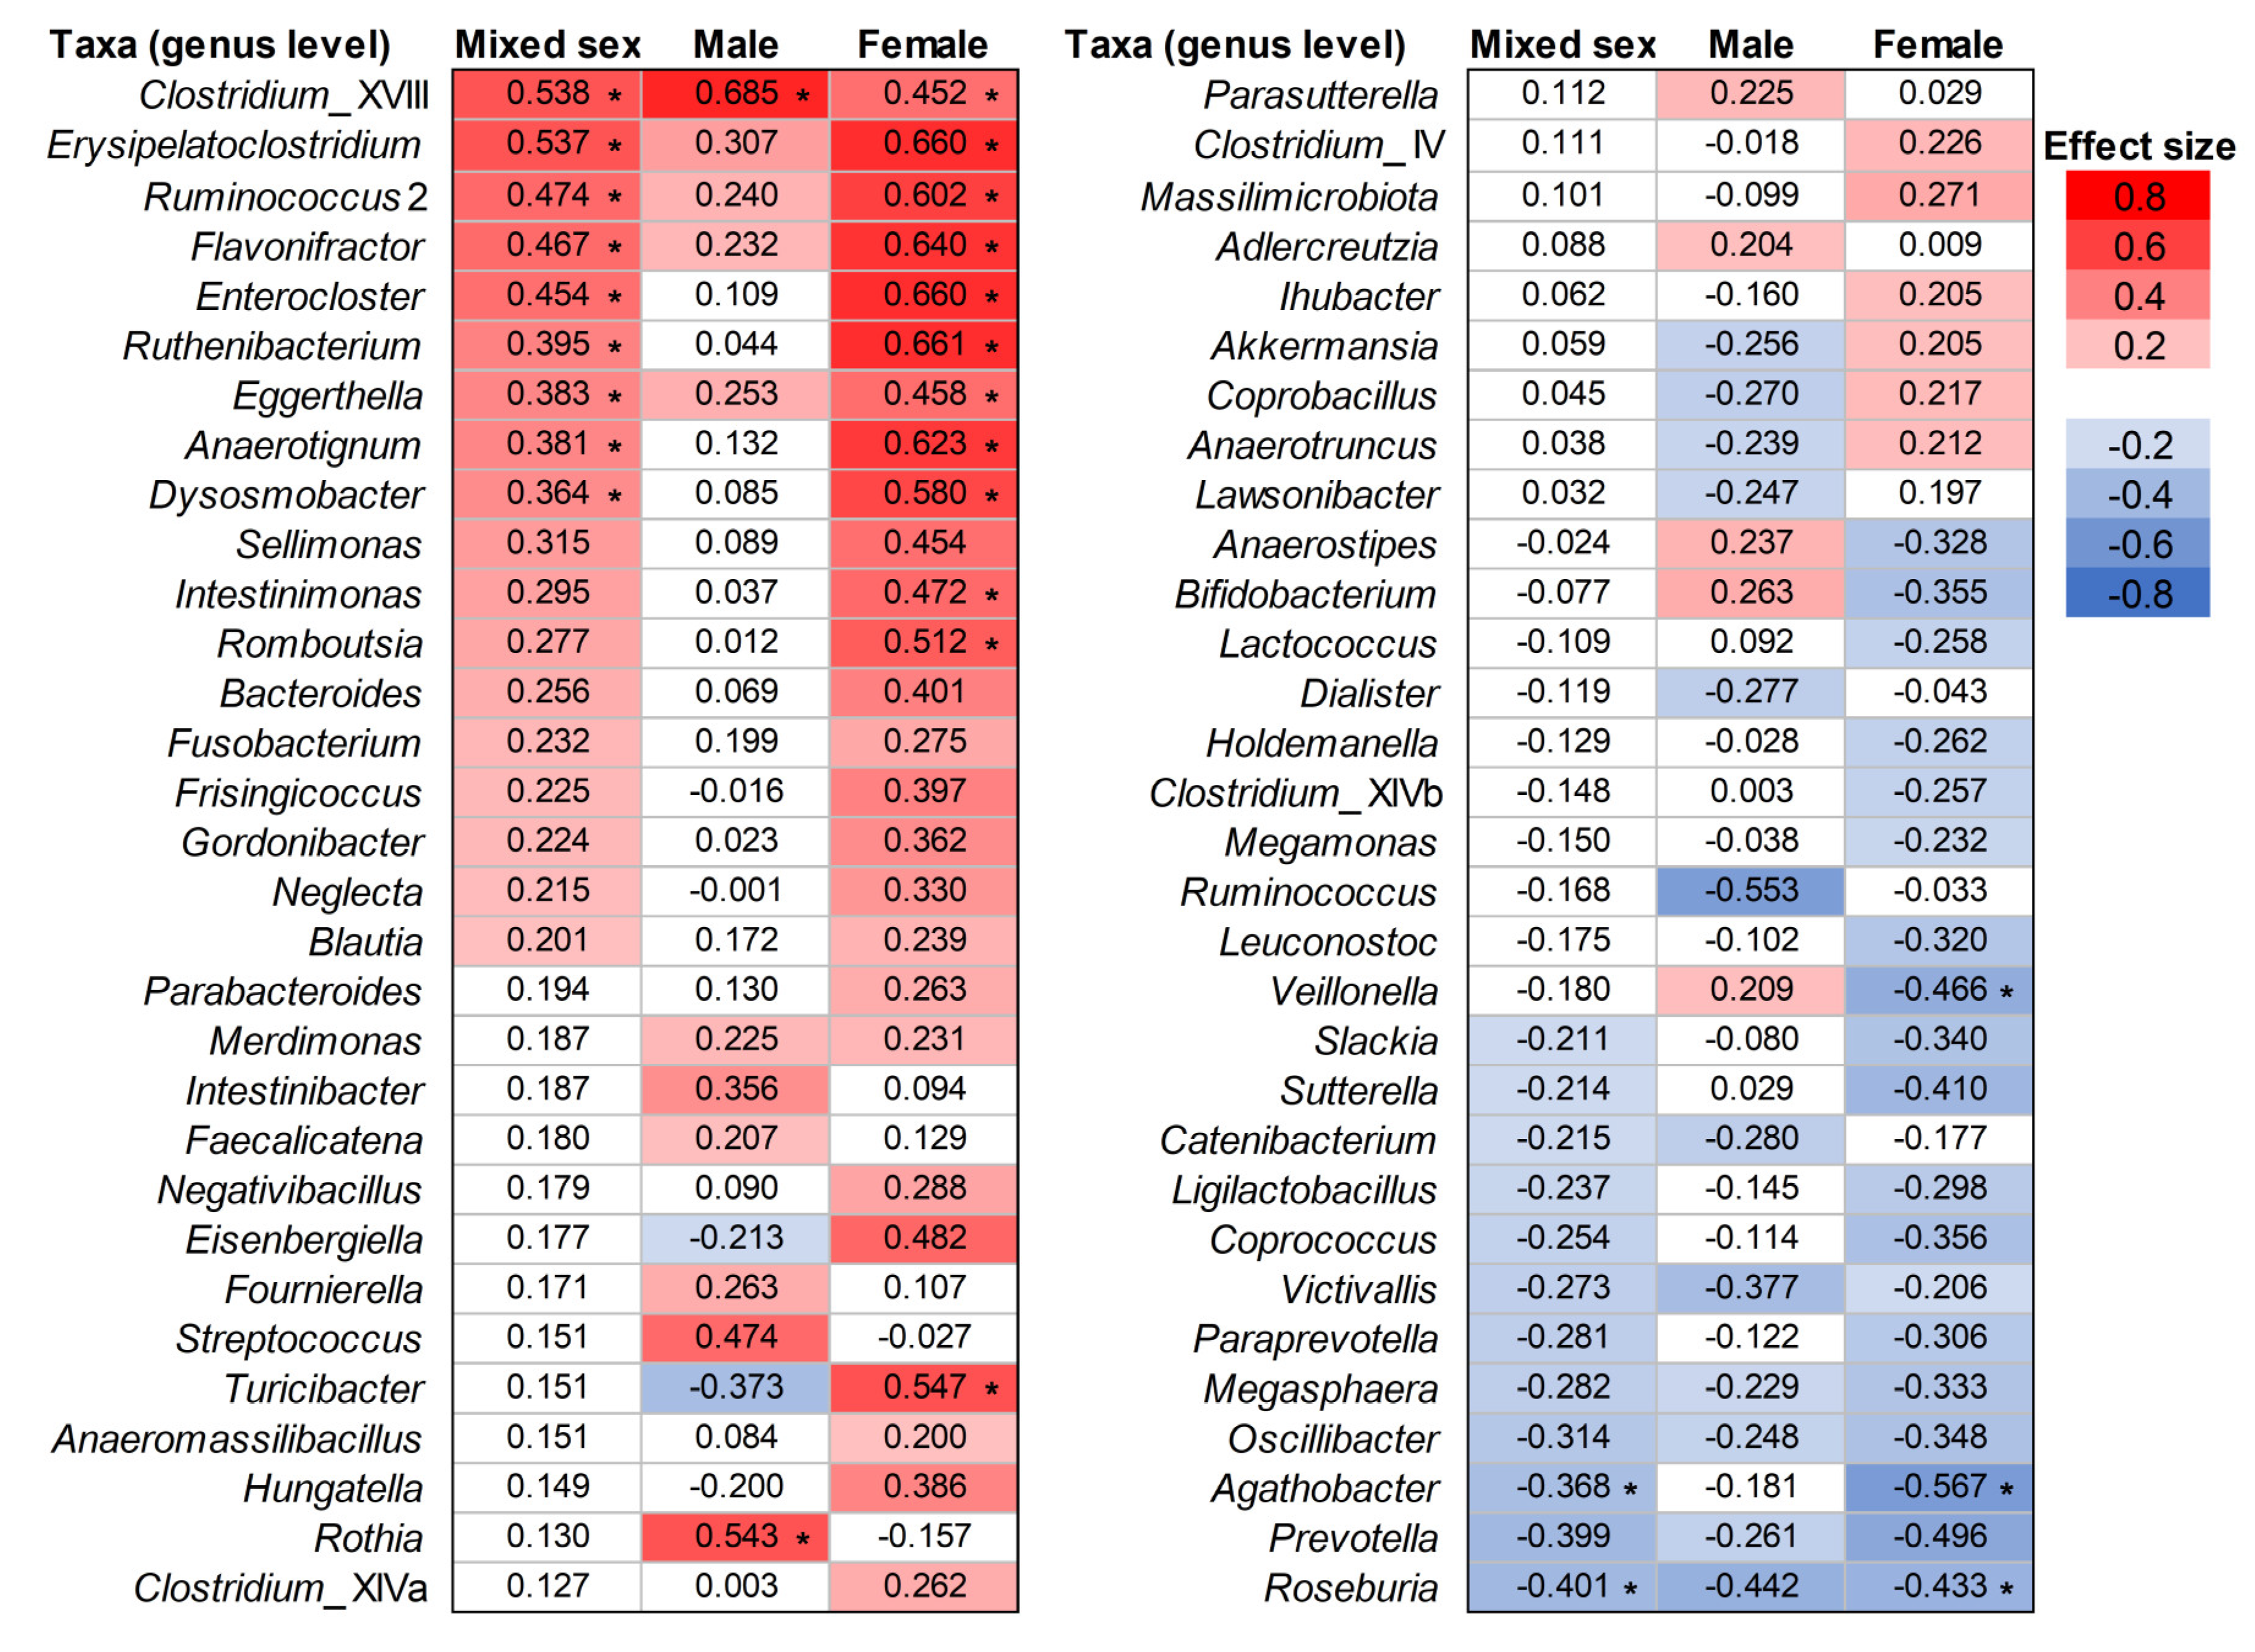
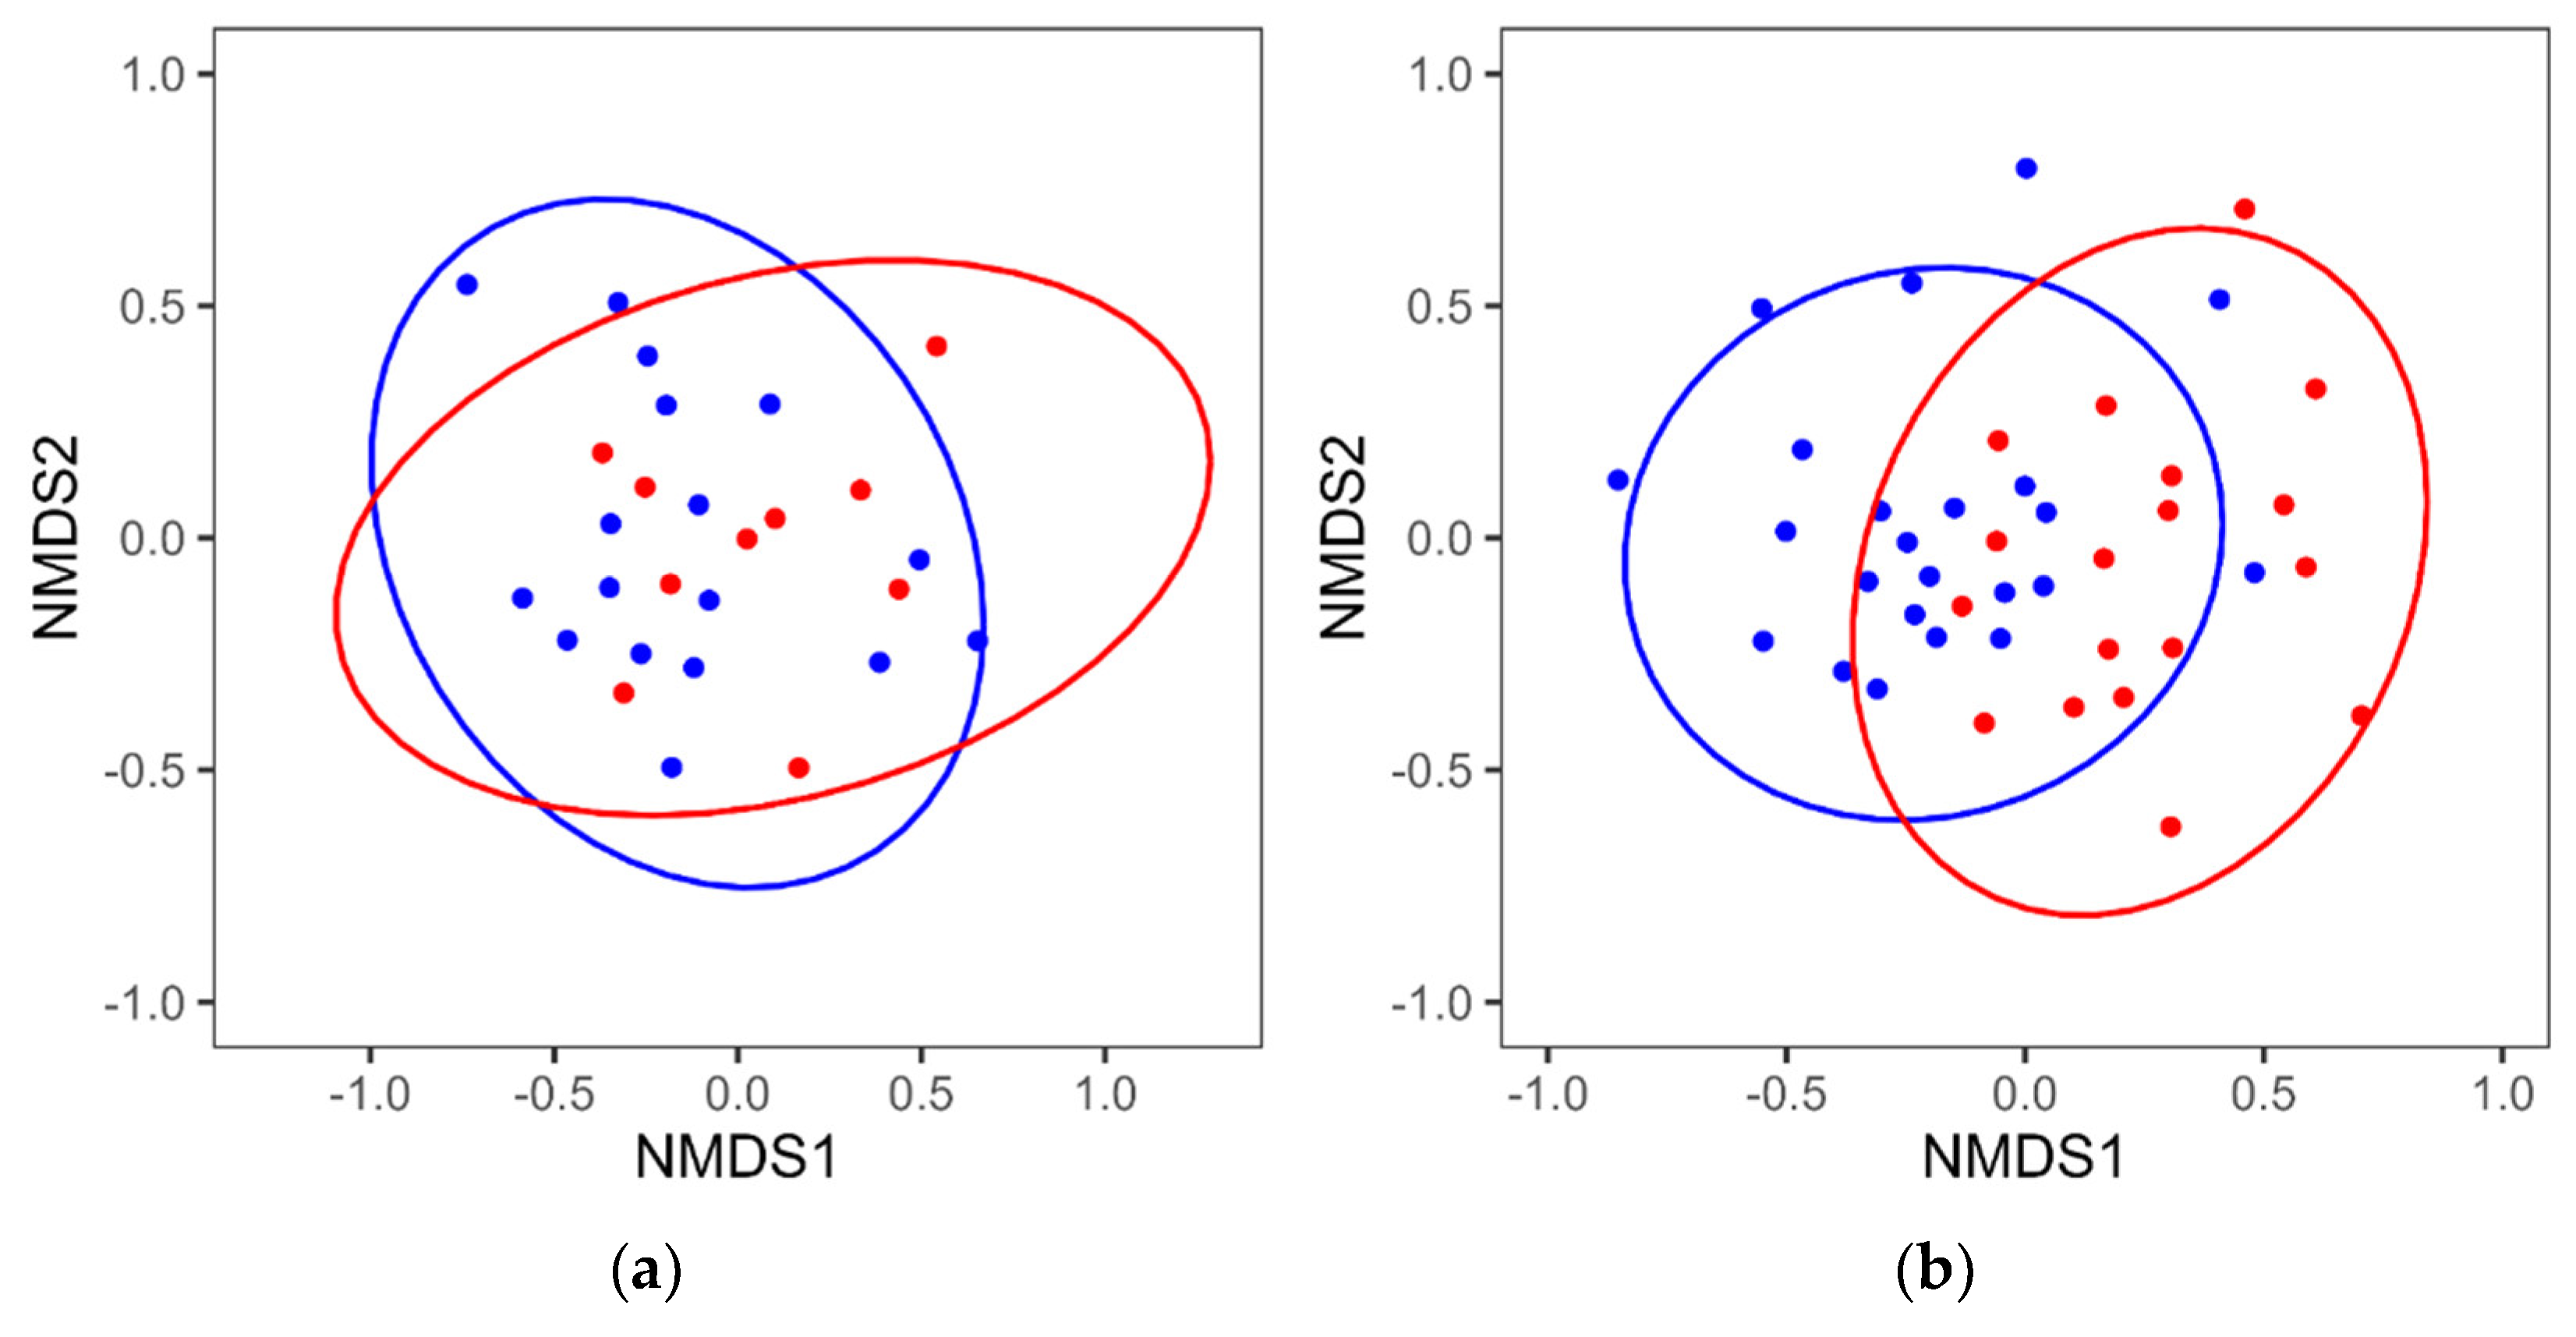
3.2. Reanalysis of the MCI and Control Groups by Sex
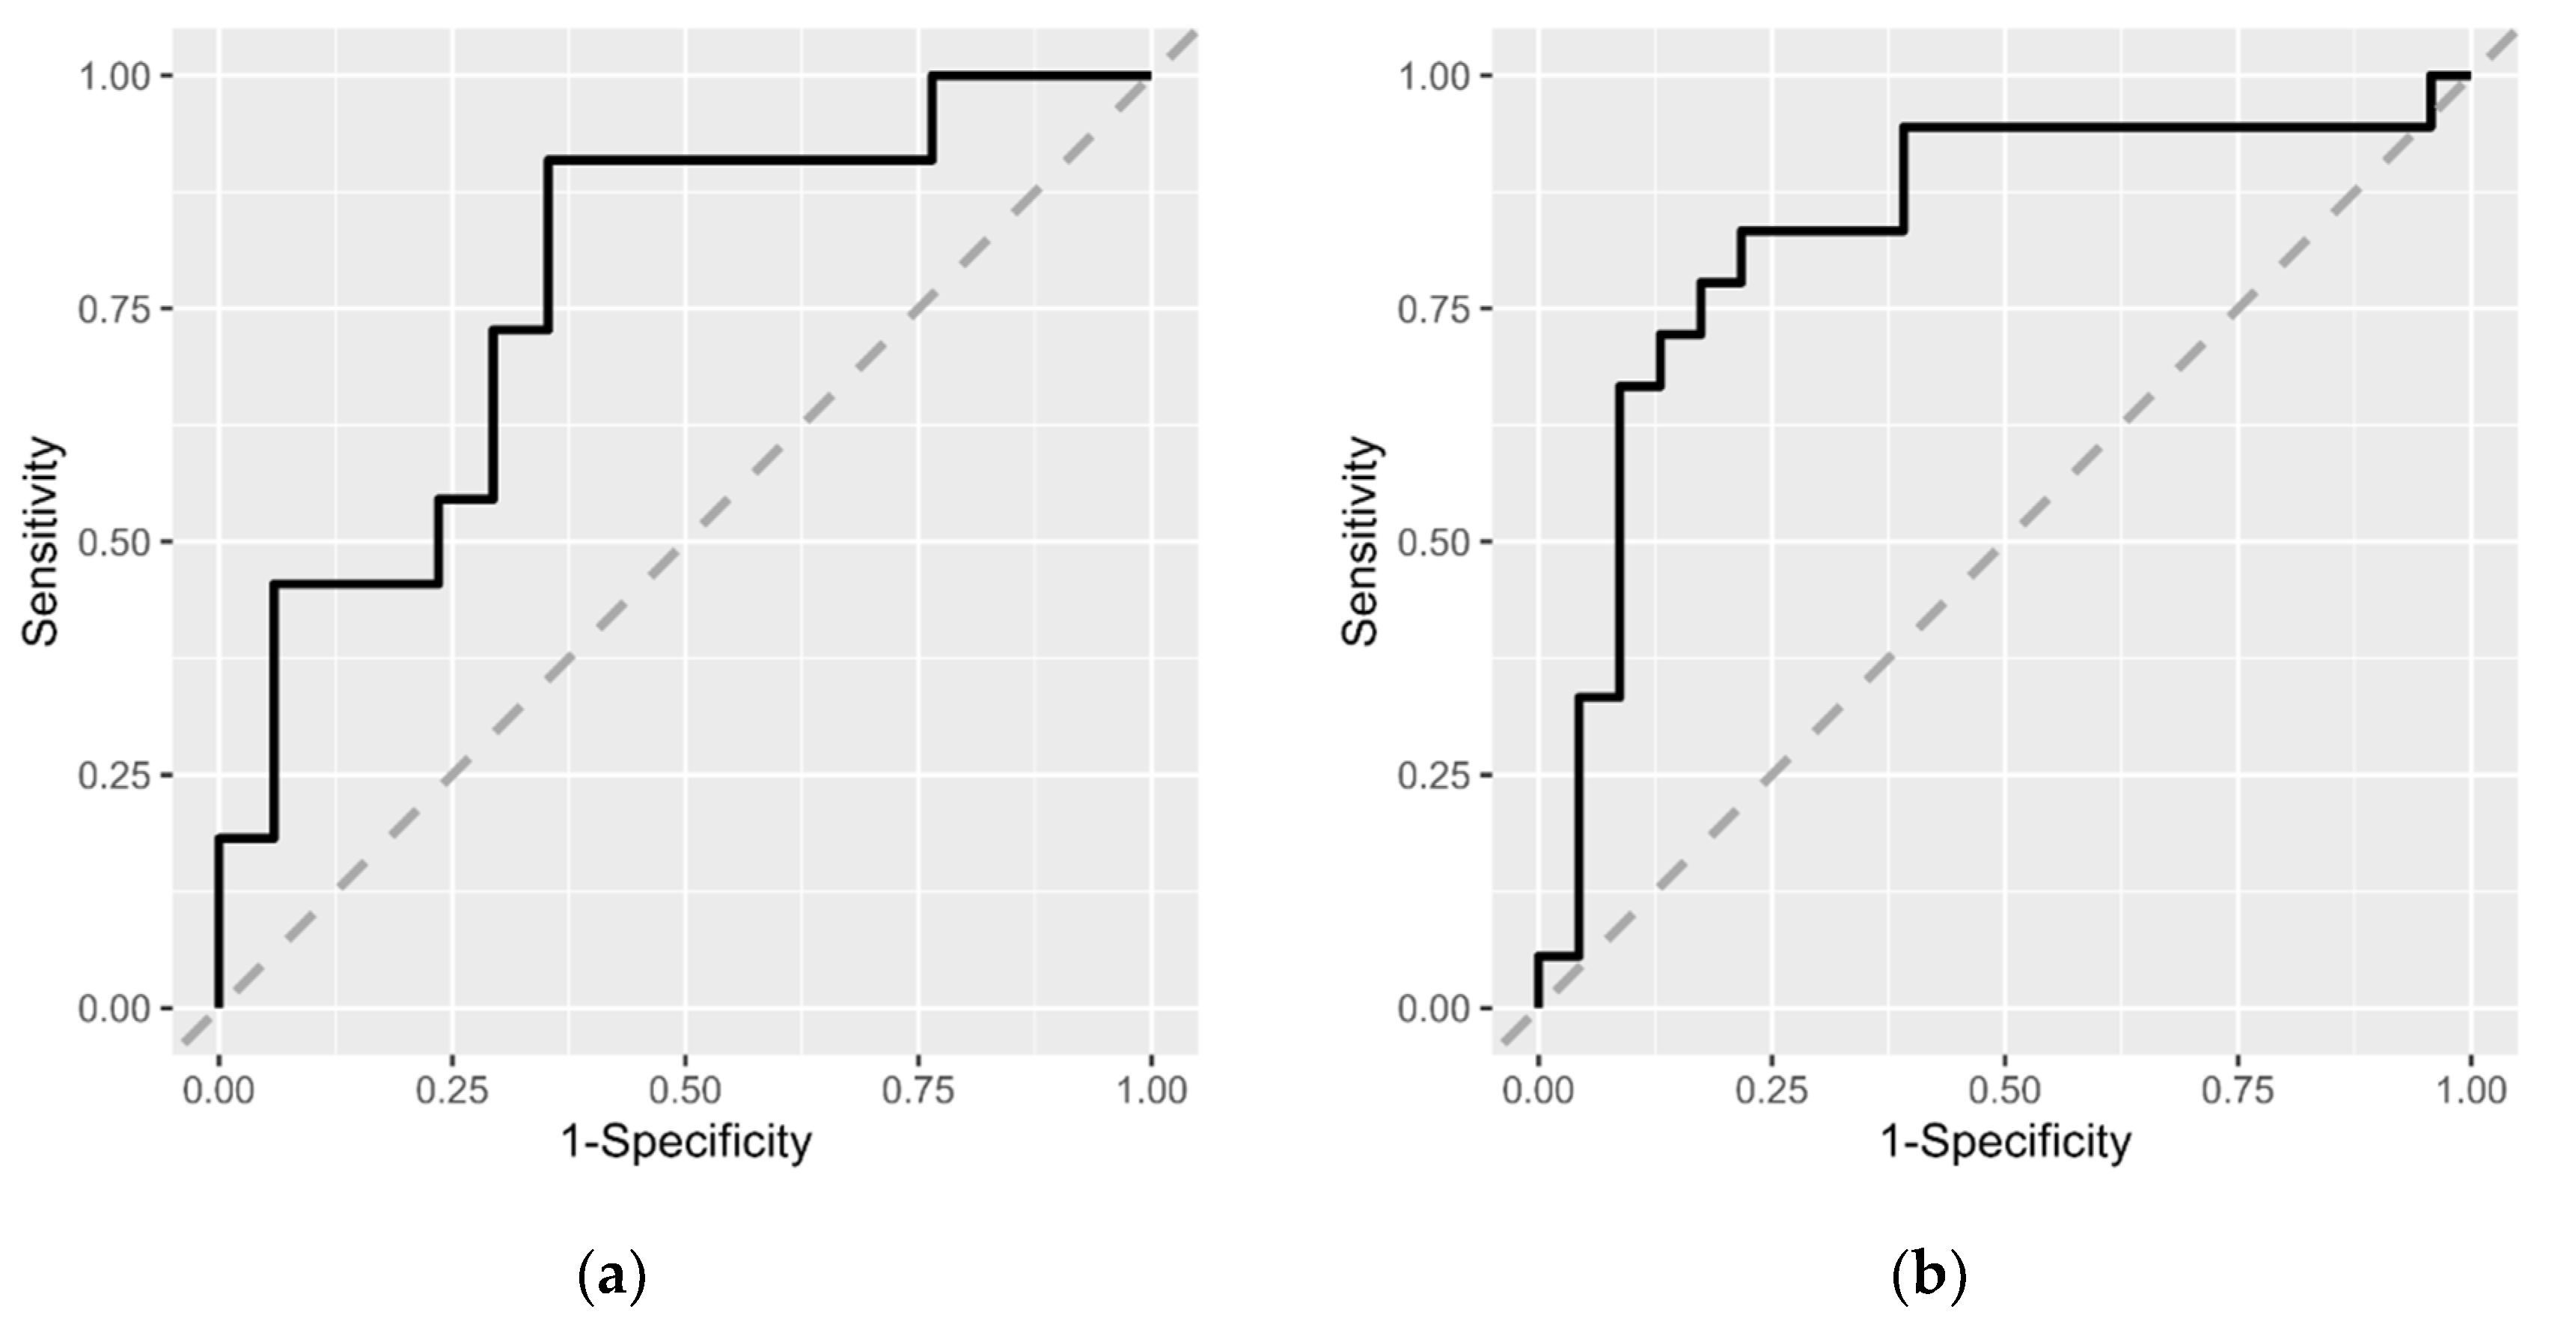
3.3. Risk Estimation for MCI Based on Intestinal Microbiota
4. Discussion
5. Conclusions
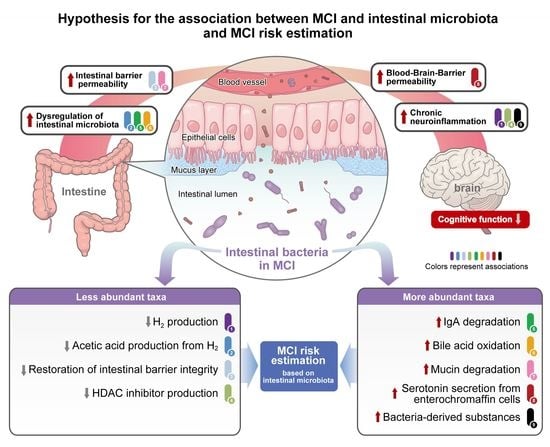
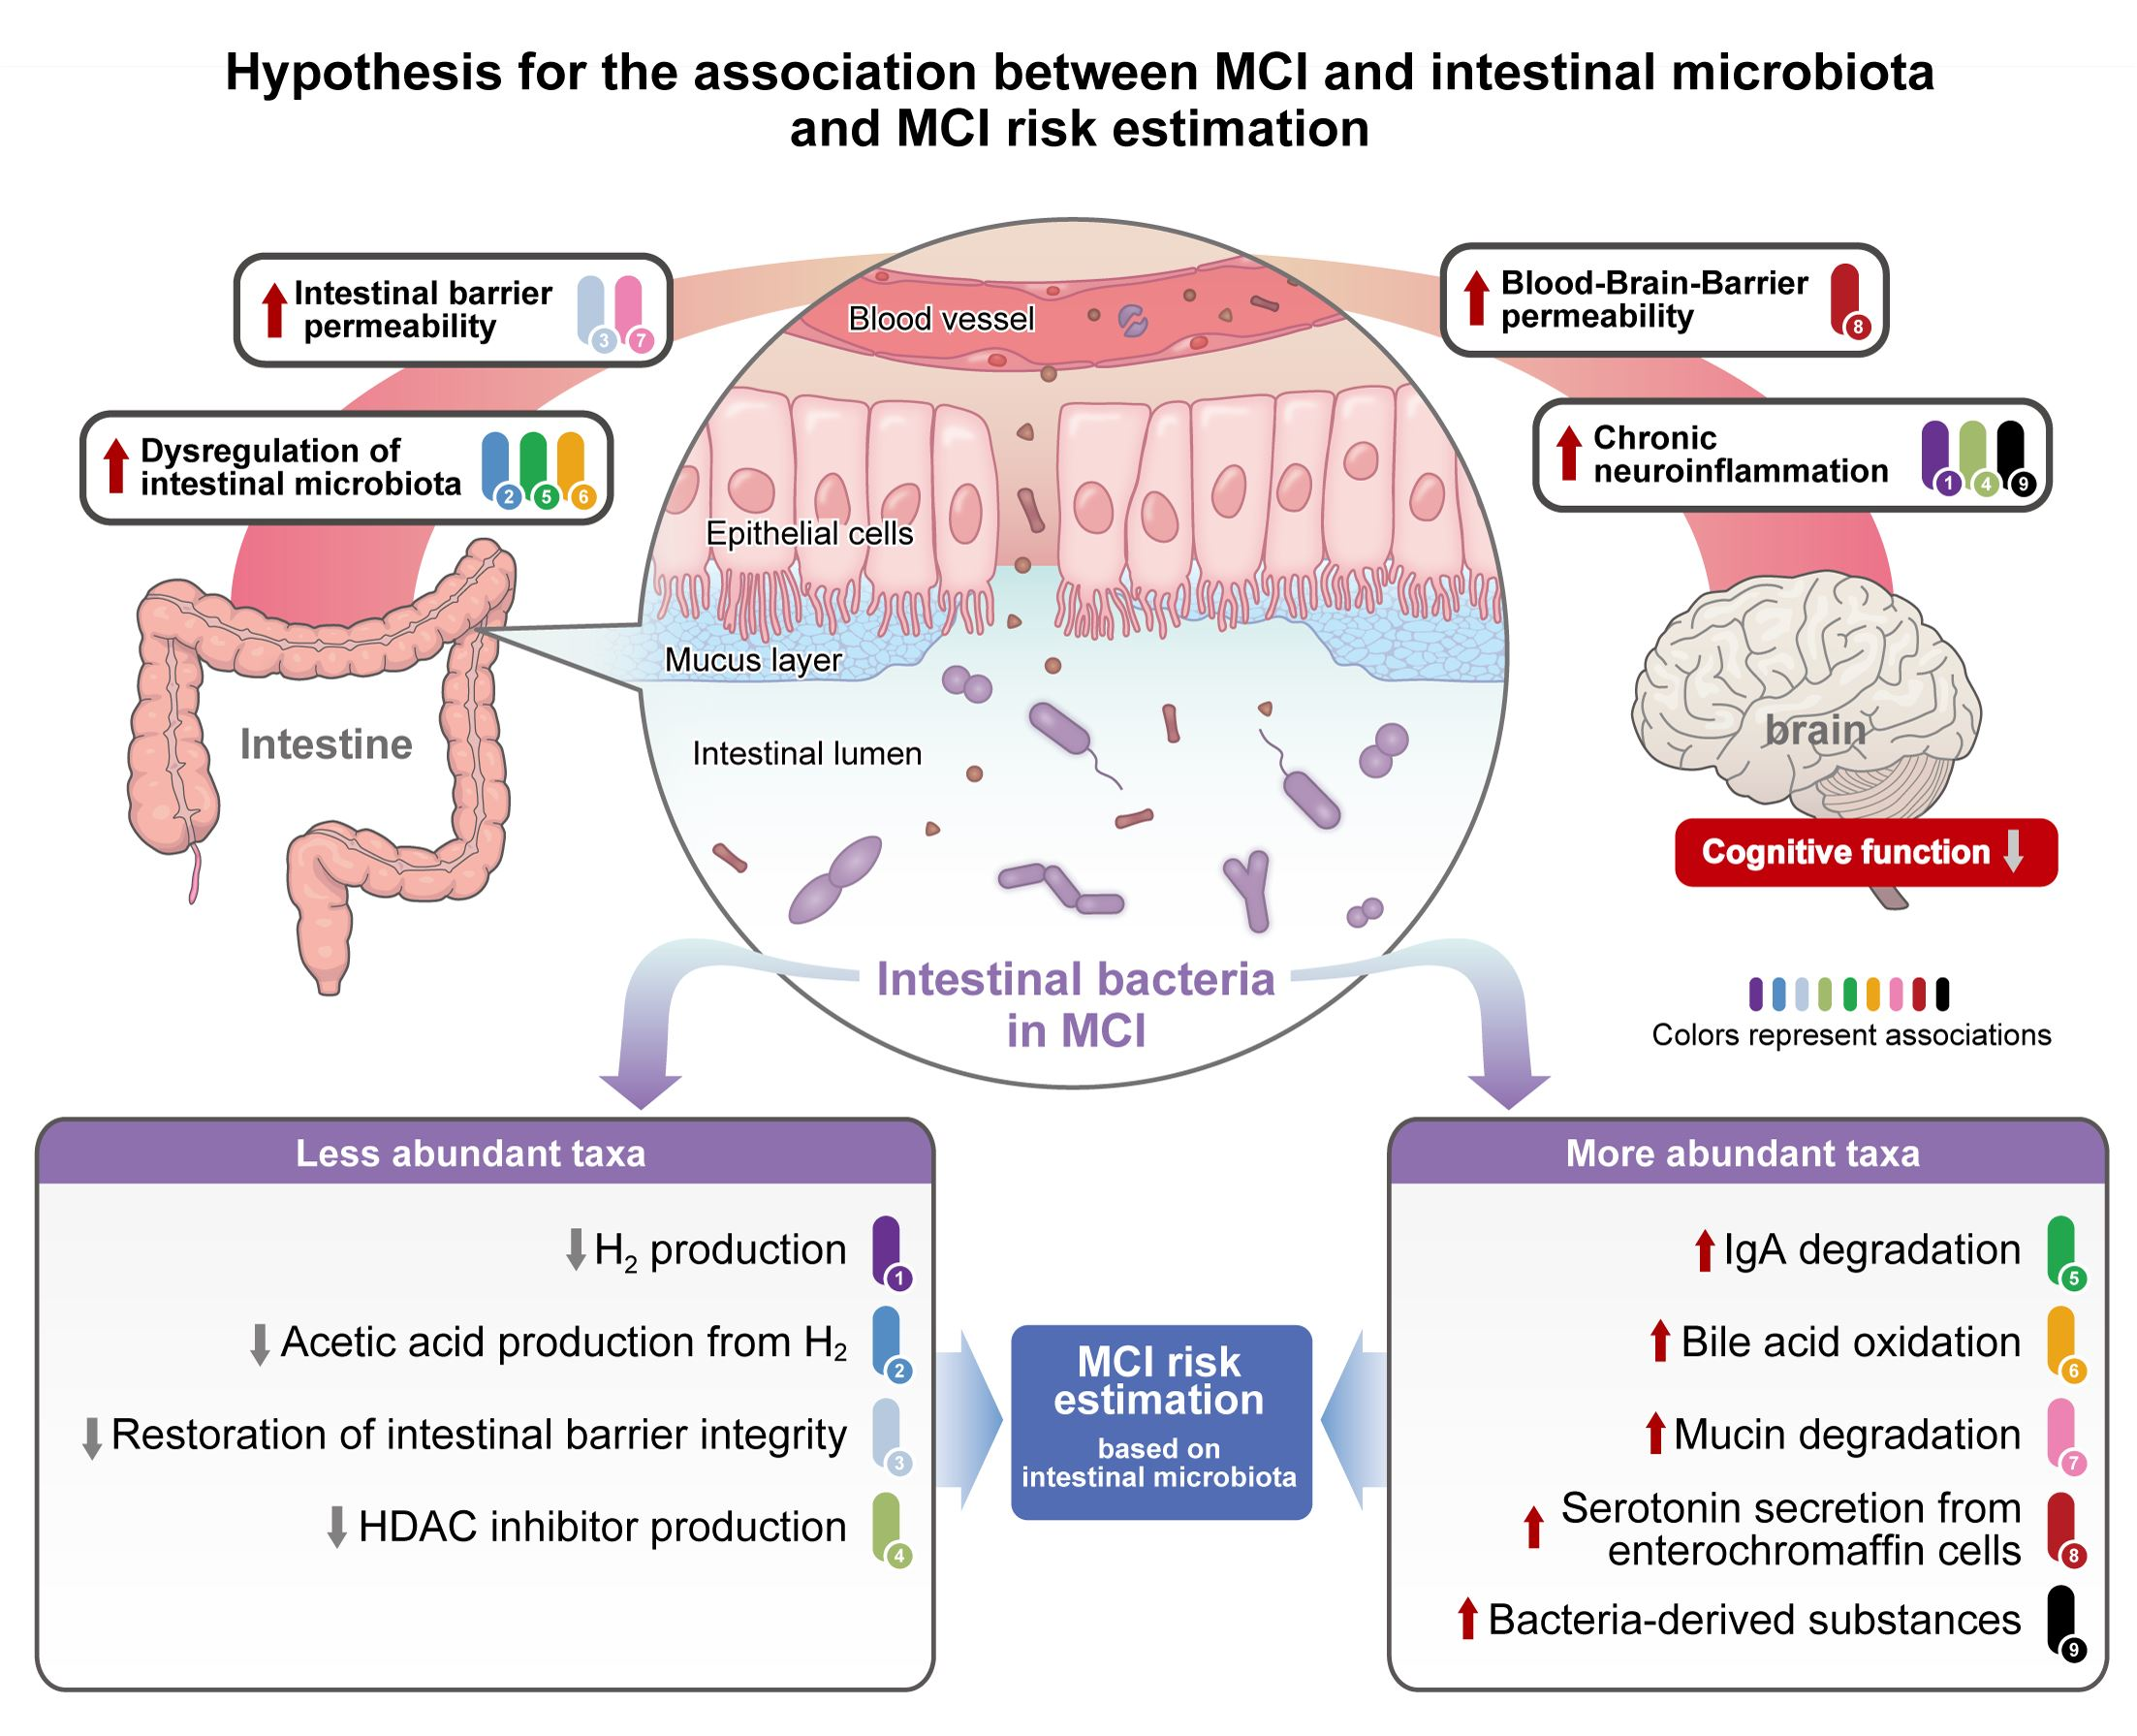
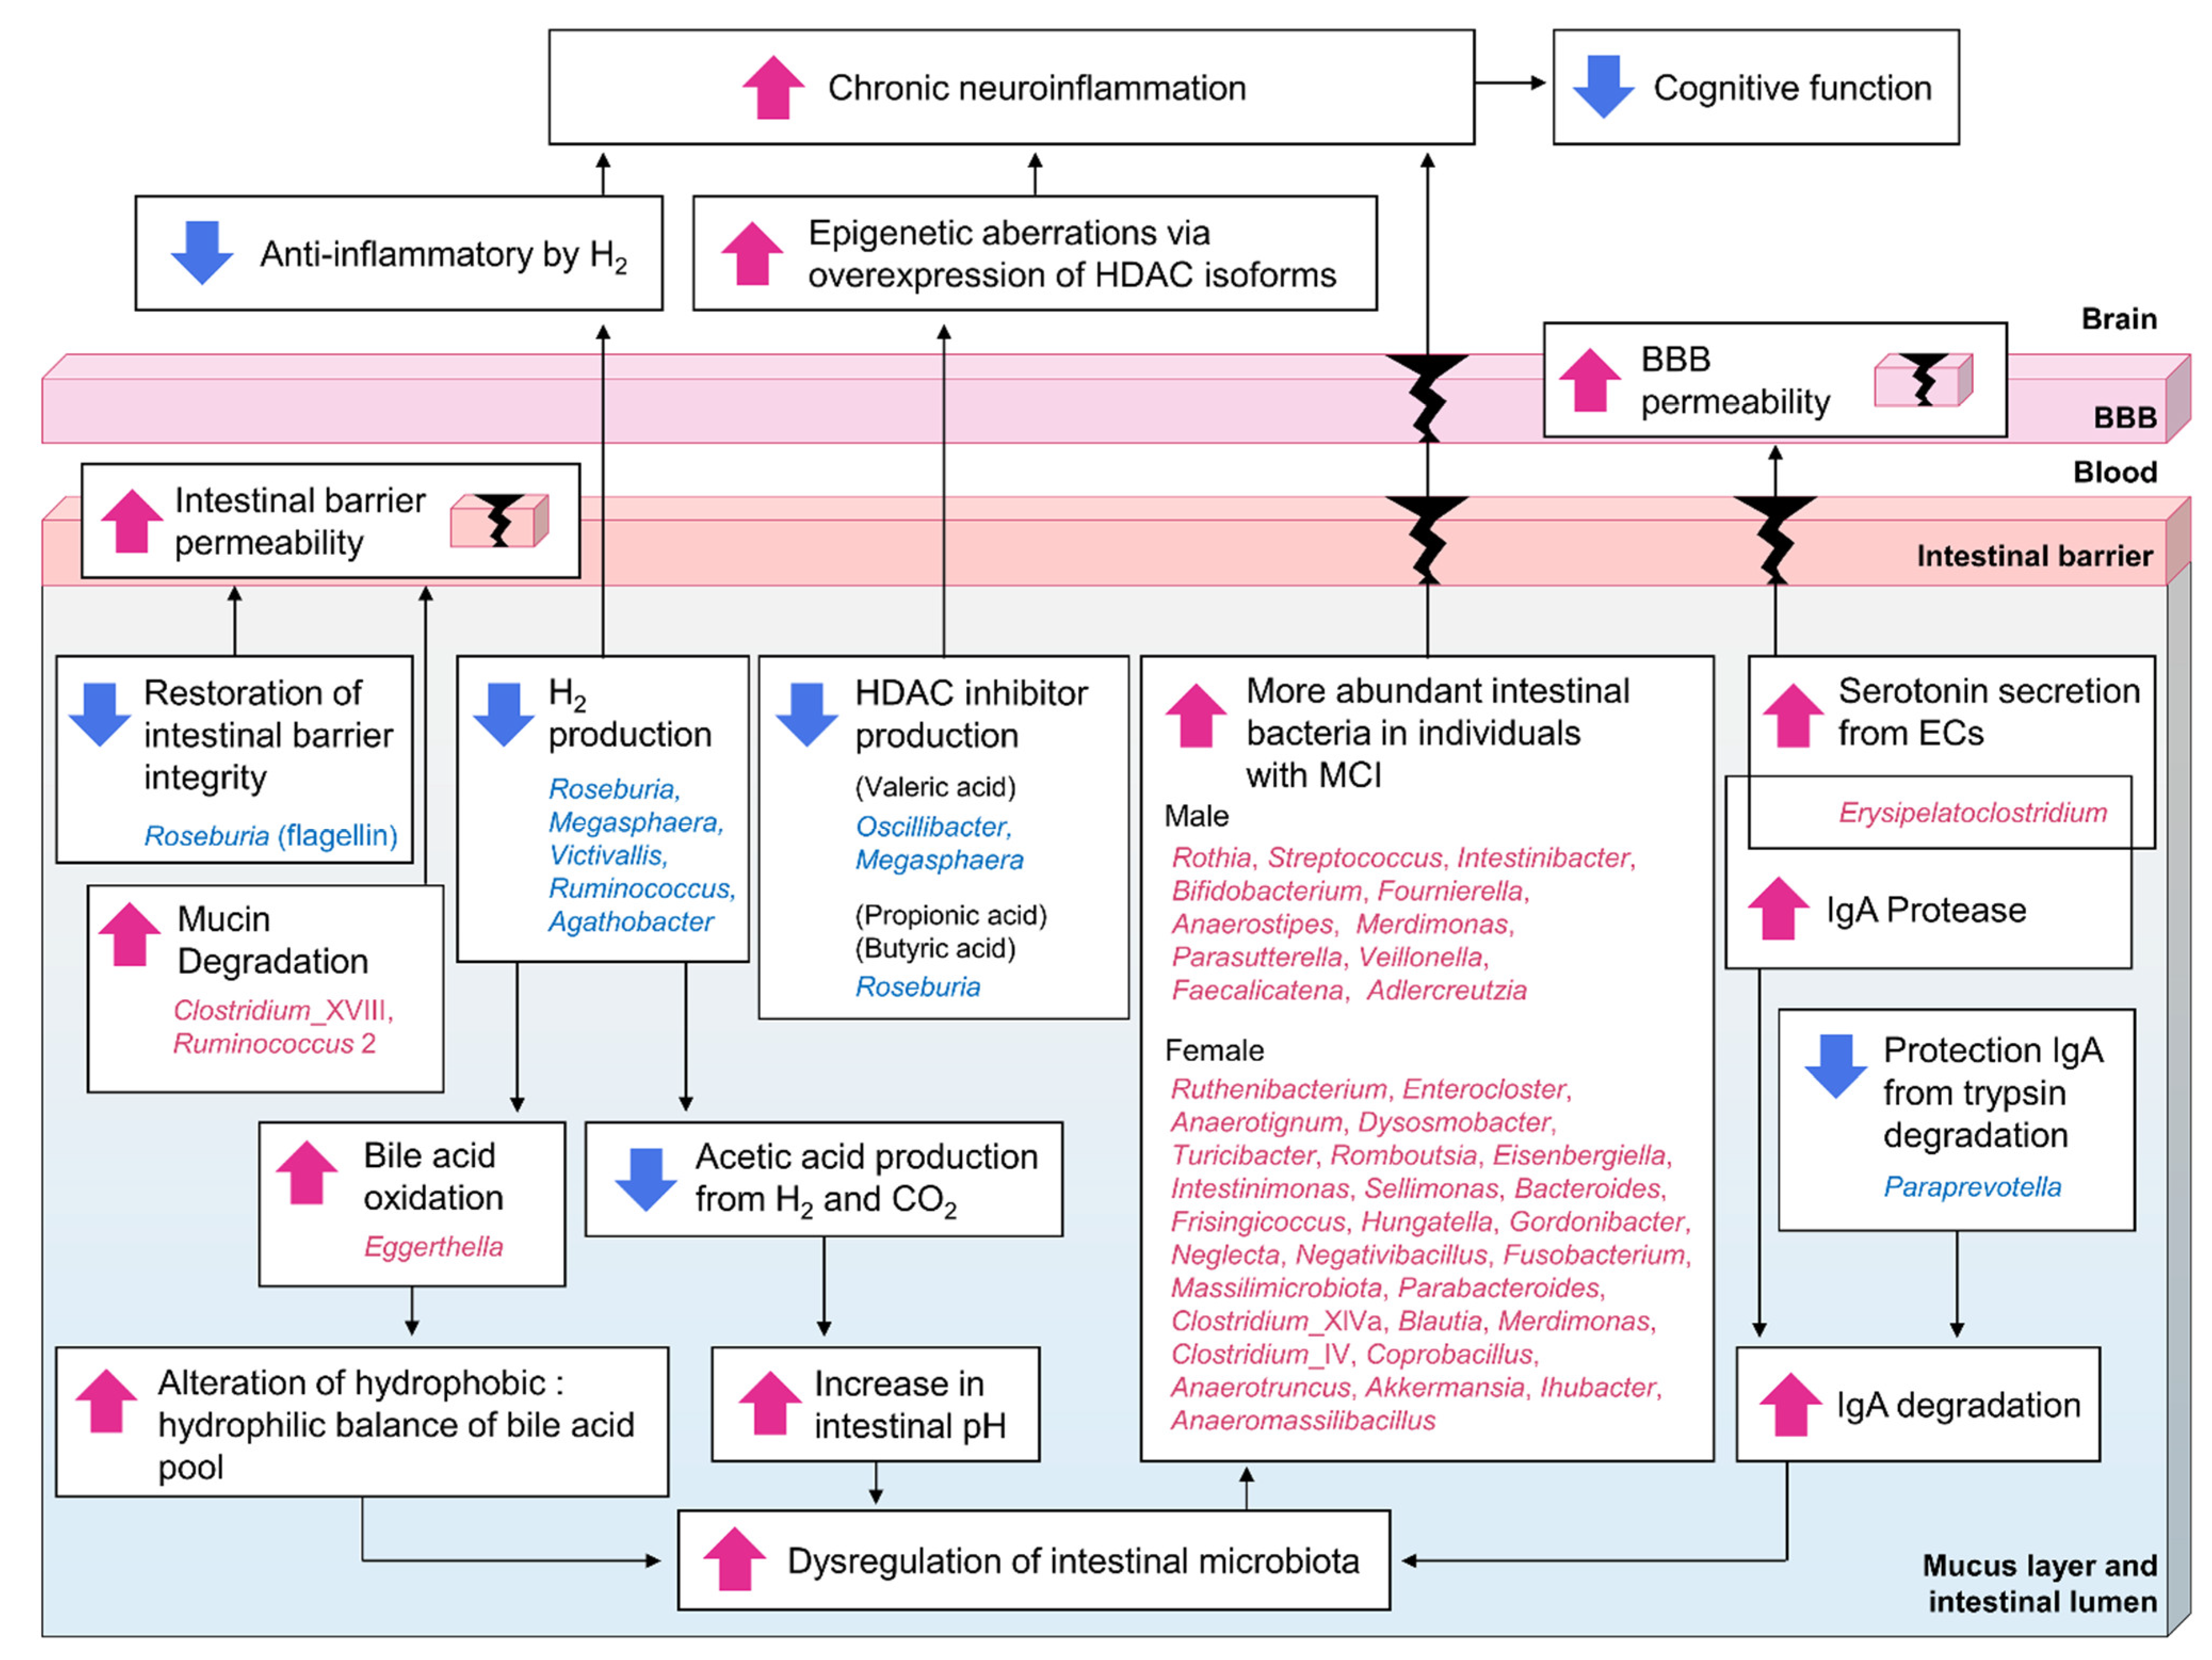
- A decrease in the abundance of H2-producing Roseburia, Megasphaera, Victivallis, Ruminococcus, and Agathobacter, and an increase in the abundance of Eggerthella, which oxidizes bile acids in an H2 concentration-dependent manner, leads to dysregulation of the intestinal microbiota.
- A decrease in the abundance of H2-producing Roseburia, Megasphaera, Victivallis, Ruminococcus, and Agathobacter leads to dysregulation of the intestinal microbiota by indirectly causing an increase in intestinal pH due to decreased acetic acid production.
- An increase in the abundance of IgA protease-producing Erysipelatoclostridium and a decrease in the abundance of Paraprevotella, which protects IgA via the degradation of intestinal trypsin, leads to dysregulation of the intestinal microbiota and increased inflammation of intestinal epithelial cells.
- An increase in the abundance of Clostridium_XVIII and Ruminococcus 2, which are associated with mucin degradation, and a decrease in the abundance of Roseburia, associated with the protection of intestinal barrier function, leads to increased intestinal barrier permeability.
- An increase in the abundance of Erysipelatoclostridium, which promotes serotonin secretion in the intestine, leads to increased BBB permeability.
- The taxa of intestinal bacteria that are more abundant due to dysregulation of the intestinal microbiota differ between sexes, but they contribute to inflammation.
- A decrease in the abundance of HDAC-inhibitor-producing bacteria (such as Oscillibacter and Megasphaera, which produce valeric acid, and Roseburia, which produces propionic acid and butyric acid) leads to epigenetic dysregulation due to excess HDAC activity, leading to increased inflammation.
- A decrease in the abundance of H2-producing Roseburia, Megasphaera, Victivallis, Ruminococcus, and Agathobacter leads to decreased reactive oxygen species removal by H2 and increased chronic inflammation.
- The composition of the intestinal microbiota in MCI-affected individuals leads to dysregulation of the intestinal microbiota, increased intestinal barrier and BBB permeability, and increased chronic neuroinflammation, which, when sustained over time, ultimately leads to cognitive decline.
Supplementary Materials
Author Contributions
Funding
Institutional Review Board Statement
Informed Consent Statement
Data Availability Statement
Acknowledgments
Conflicts of Interest
References
- Anderson, N.D. State of the science on mild cognitive impairment (MCI). CNS Spectr. 2019, 24, 78–87. [Google Scholar] [CrossRef] [PubMed]
- Roberts, R.; Knopman, D.S. Classification and epidemiology of MCI. Clin. Geriatr. Med. 2013, 29, 753–772. [Google Scholar] [CrossRef] [PubMed]
- Jongsiriyanyong, S.; Limpawattana, P. Mild Cognitive Impairment in Clinical Practice: A Review Article. Am. J. Alzheimer’s Dis. Other Dement. 2018, 33, 500–507. [Google Scholar] [CrossRef] [PubMed]
- Van Giau, V.; Bagyinszky, E.; An, S.S.A. Potential Fluid Biomarkers for the Diagnosis of Mild Cognitive Impairment. Int. J. Mol. Sci. 2019, 20, 4149. [Google Scholar] [CrossRef] [PubMed]
- He, Y.; Li, B.; Sun, D.; Chen, S. Gut Microbiota: Implications in Alzheimer’s Disease. J. Clin. Med. 2020, 9, 2042. [Google Scholar] [CrossRef]
- Connell, E.; Le Gall, G.; Pontifex, M.G.; Sami, S.; Cryan, J.F.; Clarke, G.; Müller, M.; Vauzour, D. Microbial-derived metabolites as a risk factor of age-related cognitive decline and dementia. Mol. Neurodegener. 2022, 17, 43. [Google Scholar] [CrossRef]
- Zhang, X.; Wang, Y.; Liu, W.; Wang, T.; Wang, L.; Hao, L.; Ju, M.; Xiao, R. Diet quality, gut microbiota, and microRNAs associated with mild cognitive impairment in middle-aged and elderly Chinese population. Am. J. Clin. Nutr. 2021, 114, 429–440. [Google Scholar] [CrossRef]
- Ueda, A.; Shinkai, S.; Shiroma, H.; Taniguchi, Y.; Tsuchida, S.; Kariya, T.; Kawahara, T.; Kobayashi, Y.; Kohda, N.; Ushida, K.; et al. Identification of Faecalibacterium prausnitzii strains for gut microbiome-based intervention in Alzheimer’s-type dementia. Cell Rep. Med. 2021, 2, 100398. [Google Scholar] [CrossRef]
- Saji, N.; Murotani, K.; Hisada, T.; Tsuduki, T.; Sugimoto, T.; Kimura, A.; Niida, S.; Toba, K.; Sakurai, T. The relationship between the gut microbiome and mild cognitive impairment in patients without dementia: A cross-sectional study conducted in Japan. Sci. Rep. 2019, 9, 19227. [Google Scholar] [CrossRef]
- Wanapaisan, P.; Chuansangeam, M.; Nopnipa, S.; Mathuranyanon, R.; Nonthabenjawan, N.; Ngamsombat, C.; Thientunyakit, T.; Muangpaisan, W. Association between Gut Microbiota with Mild Cognitive Impairment and Alzheimer’s Disease in a Thai Population. Neurodegener. Dis. 2022, 22, 43–54. [Google Scholar] [CrossRef]
- Zhu, Z.; Ma, X.; Wu, J.; Xiao, Z.; Wu, W.; Ding, S.; Zheng, L.; Liang, X.; Luo, J.; Ding, D.; et al. Altered Gut Microbiota and Its Clinical Relevance in Mild Cognitive Impairment and Alzheimer’s Disease: Shanghai Aging Study and Shanghai Memory Study. Nutrients 2022, 14, 3959. [Google Scholar] [CrossRef] [PubMed]
- Ren, T.; Gao, Y.; Qiu, Y.; Jiang, S.; Zhang, Q.; Zhang, J.; Wang, L.; Zhang, Y.; Wang, L.; Nie, K. Gut Microbiota Altered in Mild Cognitive Impairment Compared with Normal Cognition in Sporadic Parkinson’s Disease. Front. Neurol. 2020, 11, 137. [Google Scholar] [CrossRef] [PubMed]
- Pan, Q.; Li, Y.-Q.; Guo, K.; Xue, M.; Gan, Y.; Wang, K.; Xu, D.-B.; Tu, Q.-Y. Elderly Patients with Mild Cognitive Impairment Exhibit Altered Gut Microbiota Profiles. J. Immunol. Res. 2021, 2021, 5578958. [Google Scholar] [CrossRef] [PubMed]
- Hatayama, K.; Kono, K.; Okuma, K.; Hasuko, K.; Masuyama, H.; Benno, Y. Sex Differences in Intestinal Microbiota and Their Association with Some Diseases in a Japanese Population Observed by Analysis Using a Large Dataset. Biomedicines 2023, 11, 376. [Google Scholar] [CrossRef] [PubMed]
- Kono, K.; Murakami, Y.; Ebara, A.; Okuma, K.; Tokuno, H.; Odachi, A.; Ogasawara, K.; Hidaka, E.; Mori, T.; Satoh, K.; et al. Fluctuations in Intestinal Microbiota Following Ingestion of Natto Powder Containing Bacillus subtilis var. natto SONOMONO Spores: Considerations Using a Large-Scale Intestinal Microflora Database. Nutrients 2022, 14, 3839. [Google Scholar] [CrossRef]
- Callahan, B.J.; McMurdie, P.J.; Rosen, M.J.; Han, A.W.; Johnson, A.J.A.; Holmes, S.P. DADA2: High-resolution sample inference from Illumina amplicon data. Nat. Methods 2016, 13, 581–583. [Google Scholar] [CrossRef]
- R Core Team. R: A Language and Environment for Statistical Computing; R Foundation for Statistical Computing: Vienna, Austria, 2020. [Google Scholar]
- Cole, J.R.; Wang, Q.; Fish, J.A.; Chai, B.; McGarrell, D.M.; Sun, Y.; Brown, C.T.; Porras-Alfaro, A.; Kuske, C.R.; Tiedje, J.M. Ribosomal Database Project: Data and tools for high throughput rRNA analysis. Nucleic Acids Res. 2014, 42, D633–D642. [Google Scholar] [CrossRef]
- Fernandes, A.D.; Macklaim, J.M.; Linn, T.G.; Reid, G.; Gloor, G.B. ANOVA-Like Differential Expression (ALDEx) Analysis for Mixed Population RNA-Seq. PLoS ONE 2013, 8, e67019. [Google Scholar] [CrossRef]
- Tokuno, H.; Itoga, T.; Kasuga, J.; Okuma, K.; Hasuko, K.; Masuyama, H.; Benno, Y. Method for estimating disease risk from microbiome data using structural equation modeling. Front. Microbiol. 2023, 14, 1035002. [Google Scholar] [CrossRef]
- Rosseel, Y. Lavaan: An R package for Structural Equation Modeling. J. Stat. Softw. 2012, 48, 1–36. [Google Scholar] [CrossRef]
- Kuhn, M. Caret: Classification and Regression Training. R Package Version 6.0-93. 2022. Available online: https://CRAN.R-project.org/package=caret (accessed on 11 April 2023).
- Hvitfeldt, E. Themis: Extra Recipes Steps for Dealing with Unbalanced Data. 2022. Available online: https://CRAN.R-project.org/package=themis (accessed on 11 April 2023).
- Robin, X.; Turck, N.; Hainard, A.; Tiberti, N.; Lisacek, F.; Sanchez, J.-C.; Müller, M. pROC: An open-source package for R and S+ to analyze and compare ROC curves. BMC Bioinform. 2011, 12, 77. [Google Scholar] [CrossRef] [PubMed]
- Boureau, H.; Decré, D.; Carlier, J.P.; Guichet, C.; Bourlioux, P. Identification of a Clostridium cocleatum strain involved in an anti-Clostridium difficile barrier effect and determination of its mucin-degrading enzymes. Res. Microbiol. 1993, 144, 405–410. [Google Scholar] [CrossRef] [PubMed]
- Hoskins, L.C.; Agustines, M.; McKee, W.B.; Boulding, E.T.; Kriaris, M.; Niedermeyer, G. Mucin degradation in human colon ecosystems. Isolation and properties of fecal strains that degrade ABH blood group antigens and oligosaccharides from mucin glycoproteins. J. Clin. Investig. 1985, 75, 944–953. [Google Scholar] [CrossRef]
- Tamanai-Shacoori, Z.; Smida, I.; Bousarghin, L.; Loreal, O.; Meuric, V.; Fong, S.B.; Bonnaure-Mallet, M.; Jolivet-Gougeon, A. Roseburia spp.: A marker of health? Futur. Microbiol. 2017, 12, 157–170. [Google Scholar] [CrossRef]
- Seo, B.; Jeon, K.; Moon, S.; Lee, K.; Kim, W.-K.; Jeong, H.; Cha, K.H.; Lim, M.Y.; Kang, W.; Kweon, M.-N.; et al. Roseburia spp. Abundance Associates with Alcohol Consumption in Humans and Its Administration Ameliorates Alcoholic Fatty Liver in Mice. Cell Host Microbe 2020, 27, 25–40.e6. [Google Scholar] [CrossRef] [PubMed]
- Verhaar, B.J.H.; Hendriksen, H.M.A.; de Leeuw, F.A.; Doorduijn, A.S.; van Leeuwenstijn, M.; Teunissen, C.E.; Barkhof, F.; Scheltens, P.; Kraaij, R.; van Duijn, C.M.; et al. Gut Microbiota Composition Is Related to AD Pathology. Front. Immunol. 2021, 12, 794519. [Google Scholar] [CrossRef]
- Haran, J.P.; Bhattarai, S.K.; Foley, S.E.; Dutta, P.; Ward, D.V.; Bucci, V.; McCormick, B.A. Alzheimer’s Disease Microbiome Is Associated with Dysregulation of the Anti-Inflammatory P-Glycoprotein Pathway. mBio 2019, 10, e00632-19. [Google Scholar] [CrossRef]
- Wang, Q.; Luo, Y.; Chaudhuri, K.R.; Reynolds, R.; Tan, E.-K.; Pettersson, S. The role of gut dysbiosis in Parkinson’s disease: Mechanistic insights and therapeutic options. Brain 2021, 144, 2571–2593. [Google Scholar] [CrossRef]
- Nicholson, K.; Bjornevik, K.; Abu-Ali, G.; Chan, J.; Cortese, M.; Dedi, B.; Jeon, M.; Xavier, R.; Huttenhower, C.; Ascherio, A.; et al. The human gut microbiota in people with amyotrophic lateral sclerosis. Amyotroph. Lateral Scler. Front. Degener. 2021, 22, 186–194. [Google Scholar] [CrossRef]
- Lu, S.; Yang, Y.; Xu, Q.; Wang, S.; Yu, J.; Zhang, B.; Wang, Z.; Zhang, Y.; Lu, W.; Hong, K. Gut Microbiota and Targeted Biomarkers Analysis in Patients with Cognitive Impairment. Front. Neurol. 2022, 13, 834403. [Google Scholar] [CrossRef]
- Mandić, A.D.; Woting, A.; Jaenicke, T.; Sander, A.; Sabrowski, W.; Rolle-Kampcyk, U.; von Bergen, M.; Blaut, M. Clostridium ramosum regulates enterochromaffin cell development and serotonin release. Sci. Rep. 2019, 9, 1177. [Google Scholar] [CrossRef] [PubMed]
- Senda, S.; Fujiyama, Y.; Ushijima, T.; Hodohara, K.; Bamba, T.; Hosoda, S.; Kobayashi, K. Clostridium ramosum, an IgA Protease-Producing Species and Its Ecology in the Human Intestinal Tract. Microbiol. Immunol. 1985, 29, 1019–1028. [Google Scholar] [CrossRef] [PubMed]
- Kutschera, M.; Engst, W.; Blaut, M.; Braune, A. Isolation of catechin-converting human intestinal bacteria. J. Appl. Microbiol. 2011, 111, 165–175. [Google Scholar] [CrossRef]
- Dong, X.; Guthrie, B.G.H.; Alexander, M.; Noecker, C.; Ramirez, L.; Glasser, N.R.; Turnbaugh, P.J.; Balskus, E.P. Genetic manipulation of the human gut bacterium Eggerthella lenta reveals a widespread family of transcriptional regulators. Nat. Commun. 2022, 13, 7624. [Google Scholar] [CrossRef] [PubMed]
- Stanton, T.B.; Savage, D.C. Roseburia cecicola gen. nov., sp. nov., a Motile, Obligately Anaerobic Bacterium from a Mouse Cecum. Int. J. Syst. Bacteriol. 1983, 33, 618–627. [Google Scholar] [CrossRef]
- Precup, G.; Vodnar, D.-C. Gut Prevotella as a possible biomarker of diet and its eubiotic versus dysbiotic roles: A comprehensive literature review. Br. J. Nutr. 2019, 122, 131–140. [Google Scholar] [CrossRef]
- Iino, T.; Mori, K.; Tanaka, K.; Suzuki, K.-I.; Harayama, S. Oscillibacter valericigenes gen. nov., sp. nov., a valerate-producing anaerobic bacterium isolated from the alimentary canal of a Japanese corbicula clam. Int. J. Syst. Evol. Microbiol. 2007, 57, 1840–1845. [Google Scholar] [CrossRef]
- Yuille, S.; Reichardt, N.; Panda, S.; Dunbar, H.; Mulder, I.E. Human gut bacteria as potent class I histone deacetylase inhibitors in vitro through production of butyric acid and valeric acid. PLoS ONE 2018, 13, e0201073. [Google Scholar] [CrossRef]
- Ohnishi, A.; Bando, Y.; Fujimoto, N.; Suzuki, M. Development of a simple bio-hydrogen production system through dark fermentation by using unique microflora. Int. J. Hydrogen Energy 2010, 35, 8544–8553. [Google Scholar] [CrossRef]
- Zoetendal, E.G.; Plugge, C.M.; Akkermans, A.D.L.; de Vos, W.M. Victivallis vadensis gen. nov., sp. nov., a sugar-fermenting anaerobe from human faeces. Int. J. Syst. Evol. Microbiol. 2003, 53, 211–215. [Google Scholar] [CrossRef]
- Berger, M.; Gray, J.A.; Roth, B.L. The Expanded Biology of Serotonin. Annu. Rev. Med. 2009, 60, 355–366. [Google Scholar] [CrossRef] [PubMed]
- Lawther, B.K.; Kumar, S.; Krovvidi, H. Blood–brain barrier. Contin. Educ. Anaesth. Crit. Care Pain 2011, 11, 128–132. [Google Scholar] [CrossRef]
- Radjabzadeh, D.; Bosch, J.A.; Uitterlinden, A.G.; Zwinderman, A.H.; Ikram, M.A.; van Meurs, J.B.J.; Luik, A.I.; Nieuwdorp, M.; Lok, A.; van Duijn, C.M.; et al. Gut microbiome-wide association study of depressive symptoms. Nat. Commun. 2022, 13, 7128. [Google Scholar] [CrossRef]
- Kosowska, K.; Reinholdt, J.; Rasmussen, L.K.; Sabat, A.; Potempa, J.; Kilian, M.; Poulsen, K. The Clostridium ramosum IgA Proteinase Represents a Novel Type of Metalloendopeptidase. J. Biol. Chem. 2002, 277, 11987–11994. [Google Scholar] [CrossRef] [PubMed]
- Chen, K.; Magri, G.; Grasset, E.K.; Cerutti, A. Rethinking mucosal antibody responses: IgM, IgG and IgD join IgA. Nat. Rev. Immunol. 2020, 20, 427–441. [Google Scholar] [CrossRef]
- Li, Y.; Watanabe, E.; Kawashima, Y.; Plichta, D.R.; Wang, Z.; Ujike, M.; Ang, Q.Y.; Wu, R.; Furuichi, M.; Takeshita, K.; et al. Identification of trypsin-degrading commensals in the large intestine. Nature 2022, 609, 582–589. [Google Scholar] [CrossRef]
- Harris, S.C.; Devendran, S.; García, C.M.; Mythen, S.M.; Wright, C.L.; Fields, C.J.; Hernandez, A.G.; Cann, I.; Hylemon, P.B.; Ridlon, J.M. Bile acid oxidation by Eggerthella lenta strains C592 and DSM 2243T. Gut Microbes 2018, 9, 523–539. [Google Scholar] [CrossRef]
- Hylemon, P.B.; Harris, S.C.; Ridlon, J.M. Metabolism of hydrogen gases and bile acids in the gut microbiome. FEBS Lett. 2018, 592, 2070–2082. [Google Scholar] [CrossRef]
- Pedersen, K.J.; Haange, S.-B.; Žížalová, K.; Viehof, A.; Clavel, T.; Leniček, M.; Engelmann, B.; Wick, L.Y.; Schaap, F.G.; Jehmlich, N.; et al. Eggerthella lenta DSM 2243 Alleviates Bile Acid Stress Response in Clostridium ramosum and Anaerostipes caccae by Transformation of Bile Acids. Microorganisms 2022, 10, 2025. [Google Scholar] [CrossRef]
- Nishijima, S.; Suda, W.; Oshima, K.; Kim, S.-W.; Hirose, Y.; Morita, H.; Hattori, M. The gut microbiome of healthy Japanese and its microbial and functional uniqueness. DNA Res. 2016, 23, 125–133. [Google Scholar] [CrossRef]
- Takeuchi, T.; Miyauchi, E.; Kanaya, T.; Kato, T.; Nakanishi, Y.; Watanabe, T.; Kitami, T.; Taida, T.; Sasaki, T.; Negishi, H.; et al. Acetate differentially regulates IgA reactivity to commensal bacteria. Nature 2021, 595, 560–564. [Google Scholar] [CrossRef] [PubMed]
- Yamamoto, H.; Ichikawa, Y.; Hirano, S.-I.; Sato, B.; Takefuji, Y.; Satoh, F. Molecular Hydrogen as a Novel Protective Agent against Pre-Symptomatic Diseases. Int. J. Mol. Sci. 2021, 22, 7211. [Google Scholar] [CrossRef] [PubMed]
- Korovljev, D.; Trivic, T.; Stajer, V.; Drid, P.; Sato, B.; Ostojic, S. Short-term H2 inhalation improves cognitive function in older women: A pilot study. Int. J. Gerontol. 2020, 14, 149–150. [Google Scholar] [CrossRef]
- Nishimaki, K.; Asada, T.; Ohsawa, I.; Nakajima, E.; Ikejima, C.; Yokota, T.; Kamimura, N.; Ohta, S. Effects of Molecular Hydrogen Assessed by an Animal Model and a Randomized Clinical Study on Mild Cognitive Impairment. Curr. Alzheimer Res. 2018, 15, 482–492. [Google Scholar] [CrossRef]
- Chassard, C.; Delmas, E.; Robert, C.; Lawson, P.A.; Bernalier-Donadille, A. Ruminococcus champanellensis sp. nov., a cellulose-degrading bacterium from human gut microbiota. Int. J. Syst. Evol. Microbiol. 2012, 62, 138–143. [Google Scholar] [CrossRef] [PubMed]
- Rosero, J.A.; Killer, J.; Sechovcová, H.; Mrázek, J.; Benada, O.; Fliegerová, K.; Havlík, J.; Kopečný, J. Reclassification of Eubacterium rectale (Hauduroy et al. 1937) Prévot 1938 in a new genus Agathobacter gen. nov. as Agathobacter rectalis comb. nov., and description of Agathobacter ruminis sp. nov., isolated from the rumen contents of sheep and cows. Int. J. Syst. Evol. Microbiol. 2016, 66, 768–773. [Google Scholar] [CrossRef] [PubMed]
- Sheridan, P.O.; Duncan, S.H.; Walker, A.W.; Scott, K.P.; Louis, P.; Flint, H.J. Objections to the proposed reclassification of Eubacterium rectale as Agathobacter rectalis. Int. J. Syst. Evol. Microbiol. 2016, 66, 2106. [Google Scholar] [CrossRef] [PubMed]
- Mahady, L.; Nadeem, M.; Malek-Ahmadi, M.; Chen, K.; Perez, S.E.; Mufson, E.J. Frontal Cortex Epigenetic Dysregulation during the Progression of Alzheimer’s Disease. J. Alzheimer’s Dis. 2018, 62, 115–131. [Google Scholar] [CrossRef]
- Da Silva, L.G.; Ferguson, B.S.; Avila, A.S.; Faciola, A.P. Sodium propionate and sodium butyrate effects on histone deacetylase (HDAC) activity, histone acetylation, and inflammatory gene expression in bovine mammary epithelial cells. J. Anim. Sci. 2018, 96, 5244–5252. [Google Scholar] [CrossRef]
- Song, L.; Sun, Q.; Zheng, H.; Zhang, Y.; Wang, Y.; Liu, S.; Duan, L. Roseburia hominis Alleviates Neuroinflammation via Short-Chain Fatty Acids through Histone Deacetylase Inhibition. Mol. Nutr. Food Res. 2022, 66, 2200164. [Google Scholar] [CrossRef]
- Heyck, M.; Ibarra, A. Microbiota and memory: A symbiotic therapy to counter cognitive decline? Brain Circ. 2019, 5, 124–129. [Google Scholar] [CrossRef] [PubMed]
- Ley, R.E. Prevotella in the gut: Choose carefully. Nat. Rev. Gastroenterol. Hepatol. 2016, 13, 69–70. [Google Scholar] [CrossRef] [PubMed]
- Maraki, S.; Papadakis, I.S. Rothia mucilaginosa pneumonia: A literature review. Infect. Dis. 2015, 47, 125–129. [Google Scholar] [CrossRef] [PubMed]
- Mashima, I.; Nakazawa, F. Interaction between Streptococcus spp. and Veillonella tobetsuensis in the Early Stages of Oral Biofilm Formation. J. Bacteriol. 2015, 197, 2104–2111. [Google Scholar] [CrossRef]
- Kieser, K.J.; Kagan, J.C. Multi-receptor detection of individual bacterial products by the innate immune system. Nat. Rev. Immunol. 2017, 17, 376–390. [Google Scholar] [CrossRef] [PubMed]
- Zhang, H.; Chen, Y.; Wang, Z.; Xie, G.; Liu, M.; Yuan, B.; Chai, H.; Wang, W.; Cheng, P. Implications of Gut Microbiota in Neurodegenerative Diseases. Front. Immunol. 2022, 13, 785644. [Google Scholar] [CrossRef]
- Mandrekar, J.N. Receiver Operating Characteristic Curve in Diagnostic Test Assessment. J. Thorac. Oncol. 2010, 5, 1315–1316. [Google Scholar] [CrossRef] [PubMed]
- Riedel, B.C.; Thompson, P.M.; Brinton, R.D. Age, APOE and sex: Triad of risk of Alzheimer’s disease. J. Steroid Biochem. Mol. Biol. 2016, 160, 134–147. [Google Scholar] [CrossRef]
- Sundermann, E.E.; Maki, P.; Biegon, A.; Lipton, R.B.; Mielke, M.M.; Machulda, M.; Bondi, M.W.; Alzheimer’s Disease Neu-roimaging Initiative. Sex-specific norms for verbal memory tests may improve diagnostic accuracy of amnestic MCI. Neurology 2019, 93, e1881–e1889. [Google Scholar] [CrossRef]
- Sullivan, G.M.; Feinn, R. Using Effect Size—Or Why the p Value Is Not Enough. J. Grad. Med. Educ. 2012, 4, 279–282. [Google Scholar] [CrossRef]


| MCI (n = 29) | Control (n = 40) | p-Value 1 | |
|---|---|---|---|
| Sex (male/female, n) | 11/18 | 17/23 | 0.894 |
| Age (years, mean ± SD) | 74.2 ± 2.1 | 72.6 ± 2.7 | <0.001 |
| Body mass index (kg/m2, mean ± SD) | 21.4 ± 2.5 | 21.2 ± 2.6 2 | 0.775 |
| α-diversity indices (mean ± SD): | |||
| Shannon | 2.66 ± 0.25 | 2.66 ± 0.29 | 0.976 |
| Simpson | 0.88 ± 0.03 | 0.88 ± 0.04 | 0.731 |
| Richness | 50.5 ± 15.2 | 46.1 ± 13.7 | 0.173 |
| Pielou | 0.69 ± 0.05 | 0.70 ± 0.06 | 0.122 |
| MCI (n = 11) | Control (n = 17) | p-Value 1 | |
|---|---|---|---|
| Age (years, mean ± SD) | 73.2 ± 1.0 | 71.7 ± 2.1 | 0.001 |
| Body mass index (kg/m2, mean ± SD) | 21.5 ± 2.8 | 21.6 ± 2.9 | 0.689 |
| α-diversity indices (mean ± SD): | |||
| Shannon | 2.57 ± 0.25 | 2.76 ± 0.33 | 0.100 |
| Simpson | 0.88 ± 0.03 | 0.89 ± 0.04 | 0.175 |
| Richness | 46.9 ± 17.1 | 48.4 ± 15.9 | 0.851 |
| Pielou | 0.69 ± 0.06 | 0.72 ± 0.06 | 0.122 |
| MCI (n = 18) | Control (n = 23) | p-Value 1 | |
|---|---|---|---|
| Age (years, mean ± SD) | 74.9 ± 2.3 | 73.3 ± 2.9 | 0.052 |
| Body mass index (kg/m2, mean ± SD) | 21.4 ± 2.4 | 20.9 ± 2.3 2 | 0.438 |
| α-diversity indices (mean ± SD): | |||
| Shannon | 2.71 ± 0.23 | 2.58 ± 0.22 | 0.113 |
| Simpson | 0.88 ± 0.03 | 0.87 ± 0.03 | 0.383 |
| Richness | 52.7 ± 13.5 | 44.5 ± 11.7 | 0.092 |
| Pielou | 0.69 ± 0.04 | 0.69 ± 0.05 | 0.785 |
| Taxa | Known Characteristics of Members of the Taxon | Reference |
|---|---|---|
| More abundant taxa in the MCI groups: | ||
| Clostridium_XVIII | Clostridium cocleatum is involved in mucin degradation. | [25] |
| Erysipelatoclostridium | Erysipelatoclostridium ramosum promotes intestinal serotonin secretion, therefore promoting the development of intestinal lipid absorption and obesity. | [34] |
| Erysipelatoclostridium ramosum produces IgA proteases that help evade host immune defenses. | [35] | |
| Ruminococcus 2 | Ruminococcus torques is involved in the degradation of mucin. | [26] |
| Flavonifractor | Flavonifractor plautii is involved in the degradation of catechins. | [36] |
| Eggerthella | Eggerthella lenta is involved in the inactivation of the cardiac drug digoxin, various reactions of dietary phytochemicals, dehydroxylation of catechols, and metabolism of bile acids. | [37] |
| Less abundant taxa in the MCI groups: | ||
| Roseburia | Roseburia species produce butyric acid. | [27] |
| Flagellin from Roseburia intestinalis is involved in protecting the intestinal barrier function. | [28] | |
| Roseburia cecicola produces H2. | [38] | |
| Prevotella | Prevotella correlates with plant-rich diets, abundant in carbohydrates and fibers. | [39] |
| Oscillibacter | Oscillibacter valericigenes produces valeric acid. | [40] |
| Megasphaera | Megasphaera massiliensis produces valeric acid. | [41] |
| Megasphaera elsdenii produces H2. | [42] | |
| Victivallis | Victivallis vadensis produces H2. | [43] |
Disclaimer/Publisher’s Note: The statements, opinions and data contained in all publications are solely those of the individual author(s) and contributor(s) and not of MDPI and/or the editor(s). MDPI and/or the editor(s) disclaim responsibility for any injury to people or property resulting from any ideas, methods, instructions or products referred to in the content. |
© 2023 by the authors. Licensee MDPI, Basel, Switzerland. This article is an open access article distributed under the terms and conditions of the Creative Commons Attribution (CC BY) license (https://creativecommons.org/licenses/by/4.0/).
Share and Cite
Hatayama, K.; Ebara, A.; Okuma, K.; Tokuno, H.; Hasuko, K.; Masuyama, H.; Ashikari, I.; Shirasawa, T. Characteristics of Intestinal Microbiota in Japanese Patients with Mild Cognitive Impairment and a Risk-Estimating Method for the Disorder. Biomedicines 2023, 11, 1789. https://doi.org/10.3390/biomedicines11071789
Hatayama K, Ebara A, Okuma K, Tokuno H, Hasuko K, Masuyama H, Ashikari I, Shirasawa T. Characteristics of Intestinal Microbiota in Japanese Patients with Mild Cognitive Impairment and a Risk-Estimating Method for the Disorder. Biomedicines. 2023; 11(7):1789. https://doi.org/10.3390/biomedicines11071789
Chicago/Turabian StyleHatayama, Kouta, Aya Ebara, Kana Okuma, Hidetaka Tokuno, Kazumi Hasuko, Hiroaki Masuyama, Iyoko Ashikari, and Takuji Shirasawa. 2023. "Characteristics of Intestinal Microbiota in Japanese Patients with Mild Cognitive Impairment and a Risk-Estimating Method for the Disorder" Biomedicines 11, no. 7: 1789. https://doi.org/10.3390/biomedicines11071789
APA StyleHatayama, K., Ebara, A., Okuma, K., Tokuno, H., Hasuko, K., Masuyama, H., Ashikari, I., & Shirasawa, T. (2023). Characteristics of Intestinal Microbiota in Japanese Patients with Mild Cognitive Impairment and a Risk-Estimating Method for the Disorder. Biomedicines, 11(7), 1789. https://doi.org/10.3390/biomedicines11071789