
Association of Metabolic Syndrome Components and Nutritional Status with Kidney Cancer in Young Adult Population: A Nationwide Population-Based Cohort Study in Korea


Abstract
1. Introduction
2. Methods
2.1. Data Source
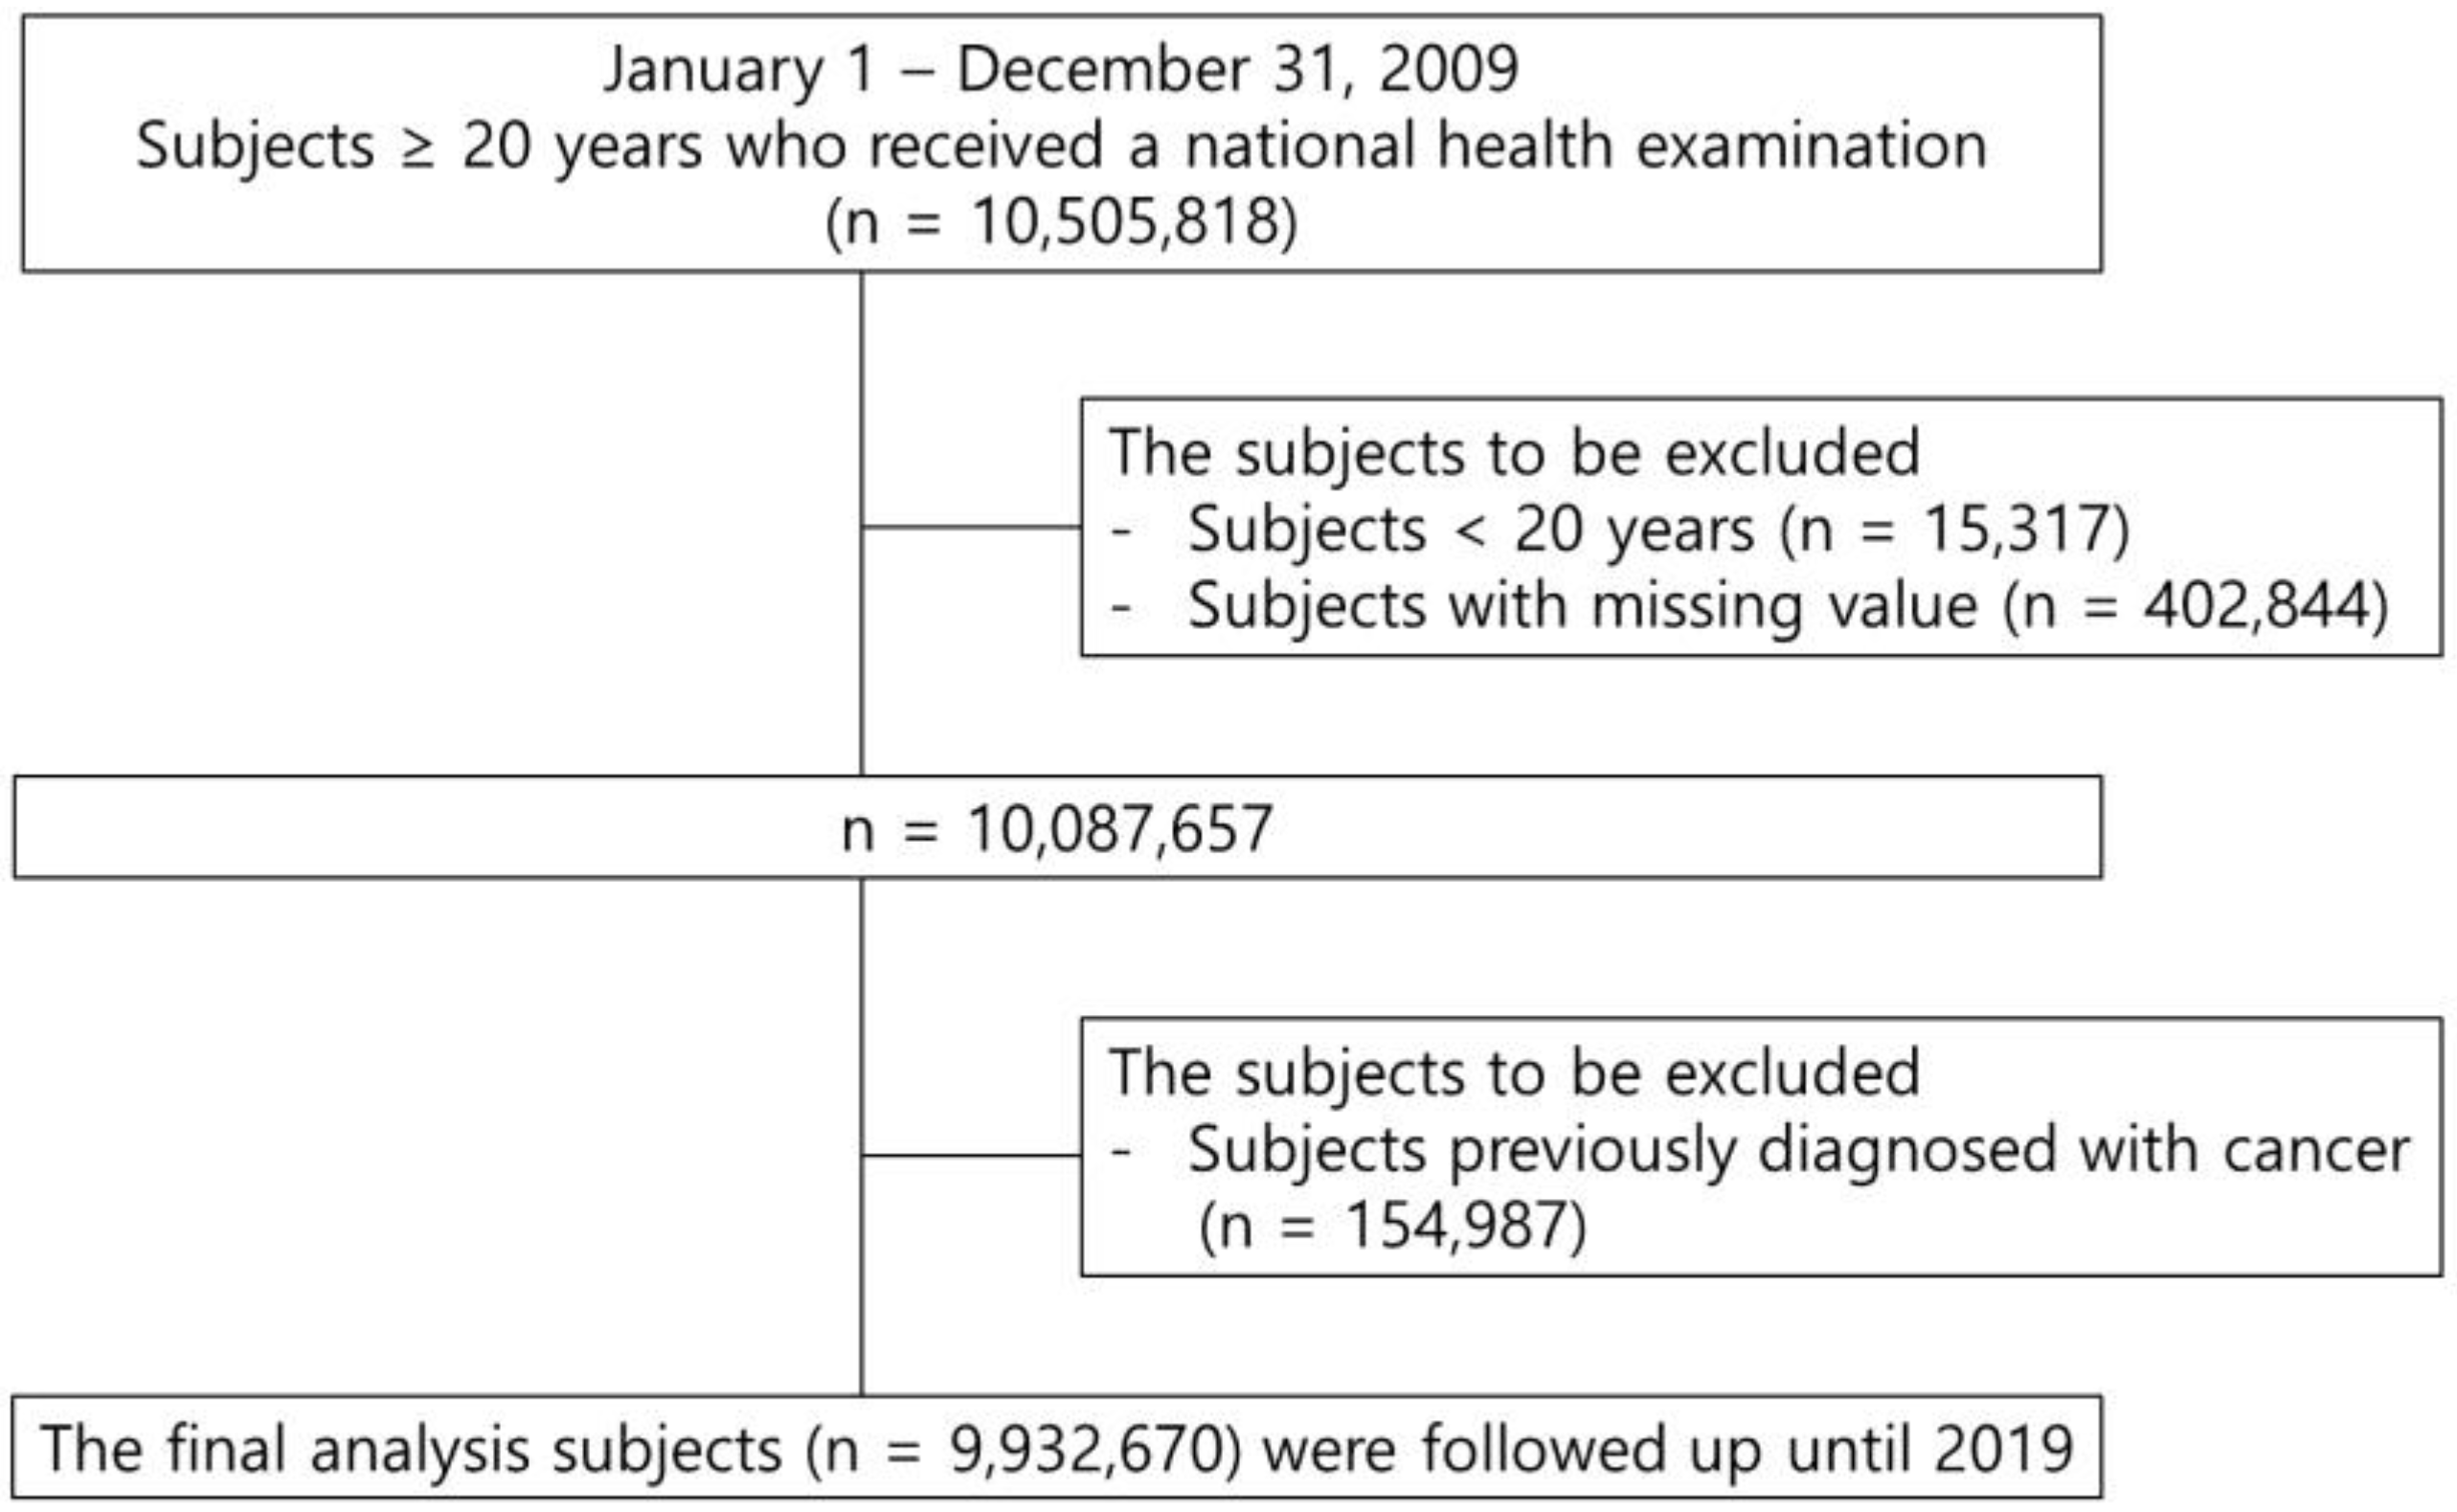
2.2. Study Population
2.3. Definition
2.4. Statistical Analyses
3. Results
3.1. Baseline Characteristics of Study Population
3.2. Association of Metabolic Syndrome with Kidney Cancer According to Age
3.3. Gender Difference in the Association of Kidney Cancer with Metabolic Syndrome
4. Discussion
5. Conclusions
Author Contributions
Funding
Institutional Review Board Statement
Informed Consent Statement
Data Availability Statement
Conflicts of Interest
References
- Park, J.H.; Choi, I.S.; Han, K.D.; Park, H.; Kim, K.H.; Kim, J.S. Association Between Fatty Liver Index and Risk of Breast Cancer: A Nationwide Population-Based Study. Clin. Breast Cancer 2020, 20, e450–e457. [Google Scholar] [CrossRef] [PubMed]
- Bray, F.; Ferlay, J.; Soerjomataram, I.; Siegel, R.L.; Torre, L.A.; Jemal, A. Global cancer statistics 2018: GLOBOCAN estimates of incidence and mortality worldwide for 36 cancers in 185 countries. CA Cancer J. Clin. 2018, 68, 394–424. [Google Scholar] [CrossRef] [PubMed]
- Safiri, S.; Kolahi, A.A.; Mansournia, M.A.; Almasi-Hashiani, A.; Ashrafi-Asgarabad, A.; Sullman, M.J.M.; Bettampadi, D.; Qorbani, M.; Moradi-Lakeh, M.; Ardalan, M.; et al. The burden of kidney cancer and its attributable risk factors in 195 countries and territories, 1990–2017. Sci. Rep. 2020, 10, 13862. [Google Scholar] [CrossRef] [PubMed]
- Adams, K.F.; Leitzmann, M.F.; Albanes, D.; Kipnis, V.; Moore, S.C.; Schatzkin, A.; Chow, W.H. Body size and renal cell cancer incidence in a large US cohort study. Am. J. Epidemiol. 2008, 168, 268–277. [Google Scholar] [CrossRef] [PubMed]
- Hidayat, K.; Du, X.; Zou, S.Y.; Shi, B.M. Blood pressure and kidney cancer risk: Meta-analysis of prospective studies. J. Hypertens. 2017, 35, 1333–1344. [Google Scholar] [CrossRef]
- Neovius, M.; Sundström, J.; Rasmussen, F. Combined effects of overweight and smoking in late adolescence on subsequent mortality: Nationwide cohort study. BMJ 2009, 338, b496. [Google Scholar] [CrossRef]
- Scelo, G.; Larose, T.L. Epidemiology and Risk Factors for Kidney Cancer. J. Clin. Oncol. 2018, 36, Jco2018791905. [Google Scholar] [CrossRef]
- Ko, S.H.; Han, K.D.; Yun, J.S.; Chung, S.; Koh, E.S. Impact of obesity and diabetes on the incidence of kidney and bladder cancers: A nationwide cohort study. Eur. J. Endocrinol. 2019, 181, 489–498. [Google Scholar] [CrossRef]
- Kim, S.Y.; Han, K.D.; Joo, Y.H. Metabolic Syndrome and Incidence of Laryngeal Cancer: A Nationwide Cohort Study. Sci. Rep. 2019, 9, 667. [Google Scholar] [CrossRef]
- Sin, S.; Lee, C.H.; Choi, S.M.; Han, K.D.; Lee, J. Metabolic Syndrome and Risk of Lung Cancer: An Analysis of Korean National Health Insurance Corporation Database. J. Clin. Endocrinol. Metab. 2020, 105, dgaa596. [Google Scholar] [CrossRef]
- Oh, T.R.; Han, K.D.; Choi, H.S.; Kim, C.S.; Bae, E.H.; Ma, S.K.; Kim, S.W. Metabolic Syndrome Resolved within Two Years is Still a Risk Factor for Kidney Cancer. J. Clin. Med. 2019, 8, 1329. [Google Scholar] [CrossRef]
- Lee, Y.H.; Han, K.; Ko, S.H.; Ko, K.S.; Lee, K.U. Data Analytic Process of a Nationwide Population-Based Study Using National Health Information Database Established by National Health Insurance Service. Diabetes Metab. J. 2016, 40, 79–82. [Google Scholar] [CrossRef] [PubMed]
- Alberti, K.G.M.M.; Eckel, R.H.; Grundy, S.M.; Zimmet, P.Z.; Cleeman, J.I.; Donato, K.A.; Fruchart, J.-C.; James, W.P.T.; Loria, C.M.; Smith, S.C. Harmonizing the Metabolic Syndrome. Circulation 2009, 120, 1640–1645. [Google Scholar] [CrossRef]
- Shen, T.; Shu, X.O.; Xiang, Y.B.; Li, H.L.; Cai, H.; Gao, Y.T.; Zheng, W.; Lipworth, L. Association of hypertension and obesity with renal cell carcinoma risk: A report from the Shanghai Men’s and Women’s Health Studies. Cancer Causes Control 2015, 26, 1173–1180. [Google Scholar] [CrossRef] [PubMed]
- Kim, C.S.; Han, K.D.; Choi, H.S.; Bae, E.H.; Ma, S.K.; Kim, S.W. Association of Hypertension and Blood Pressure with Kidney Cancer Risk: A Nationwide Population-Based Cohort Study. Hypertension 2020, 75, 1439–1446. [Google Scholar] [CrossRef]
- Bao, C.; Yang, X.; Xu, W.; Luo, H.; Xu, Z.; Su, C.; Qi, X. Diabetes mellitus and incidence and mortality of kidney cancer: A meta-analysis. J. Diabetes Complicat. 2013, 27, 357–364. [Google Scholar] [CrossRef] [PubMed]
- Tseng, C.H. Type 2 Diabetes Mellitus and Kidney Cancer Risk: A Retrospective Cohort Analysis of the National Health Insurance. PLoS ONE 2015, 10, e0142480. [Google Scholar] [CrossRef]
- Zhu, J.; Tu, H.; Matin, S.F.; Tannir, N.M.; Wood, C.G.; Wu, X. Glycemic index, glycemic load and carbohydrate intake in association with risk of renal cell carcinoma. Carcinogenesis 2017, 38, 1129–1135. [Google Scholar] [CrossRef]
- Landberg, A.; Fält, A.; Montgomery, S.; Sundqvist, P.; Fall, K. Overweight and obesity during adolescence increases the risk of renal cell carcinoma. Int. J. Cancer 2019, 145, 1232–1237. [Google Scholar] [CrossRef]
- Di Meo, N.A.; Lasorsa, F.; Rutigliano, M.; Loizzo, D.; Ferro, M.; Stella, A.; Bizzoca, C.; Vincenti, L.; Pandolfo, S.D.; Autorino, R.; et al. Renal Cell Carcinoma as a Metabolic Disease: An Update on Main Pathways, Potential Biomarkers, and Therapeutic Targets. Int. J. Mol. Sci. 2023, 23, 22. [Google Scholar] [CrossRef]
- Yu, C.P.; Ho, J.Y.; Huang, Y.T.; Cha, T.L.; Sun, G.H.; Yu, D.S.; Chang, F.W.; Chen, S.P.; Hsu, R.J. Estrogen inhibits renal cell carcinoma cell progression through estrogen receptor-β activation. PLoS ONE 2013, 8, e56667. [Google Scholar] [CrossRef] [PubMed]
- Czarnecka, A.M.; Niedzwiedzka, M.; Porta, C.; Szczylik, C. Hormone signaling pathways as treatment targets in renal cell cancer (Review). Int. J. Oncol. 2016, 48, 2221–2235. [Google Scholar] [CrossRef] [PubMed]
- Song, W.; He, D.; Chen, Y.; Yeh, C.R.; Hsu, I.; Huang, Q.; Zhang, X.; Chang, L.S.; Zuo, L.; Chen, J.; et al. Targeting newly identified ERβ/TGF-β1/SMAD3 signals with the FDA-approved anti-estrogen Faslodex or an ERβ selective antagonist in renal cell carcinoma. Mol. Oncol. 2018, 12, 2055–2071. [Google Scholar] [CrossRef] [PubMed]


| Age (Years) | Total | 20–39 | 40–64 | ≥65 | ||||||||
| Kidney cancer | (−) | (+) | p | (−) | (+) | p | (−) | (+) | p | (−) | (+) | p |
| n | 9,919,912 | 12,758 | 3,153,202 | 1297 | 5,500,258 | 7829 | 1,266,452 | 3632 | ||||
| BMI (kg/m2) | 23.71 ± 3.2 | 24.68 ± 3.09 | <0.0001 | 23.13 ± 3.5 | 24.89 ± 3.68 | <0.0001 | 24 ± 2.99 | 24.84 ± 2.96 | <0.0001 | 23.9 ± 3.15 | 24.24 ± 3.11 | <0.0001 |
| WC (cm) | 80.24 ± 9.06 | 84.61 ± 8.4 | <0.0001 | 78.08 ± 9.7 | 83.41 ± 9.83 | <0.0001 | 80.8 ± 8.54 | 84.47 ± 8.2 | <0.0001 | 83.21 ± 8.38 | 85.35 ± 8.21 | <0.0001 |
| Glucose (mg/dL) | 97.08 ± 22.83 | 102.27 ± 26.45 | <0.0001 | 90.99 ± 16.01 | 93.66 ± 18.08 | <0.0001 | 99.12 ± 24.34 | 102.79 ± 27.5 | <0.0001 | 103.37 ± 26.82 | 104.24 ± 26.06 | 0.0507 |
| SBP (mmHg) | 122.41 ± 14.92 | 127.64 ± 15.4 | <0.0001 | 118.48 ± 12.96 | 123.15 ± 14.38 | <0.0001 | 122.87 ± 14.9 | 126.77 ± 15.06 | <0.0001 | 130.16 ± 16.2 | 131.11 ± 15.82 | 0.0004 |
| DBP (mmHg) | 76.3 ± 9.97 | 78.9 ± 10.17 | <0.0001 | 74.37 ± 9.28 | 77.46 ± 10.33 | <0.0001 | 76.96 ± 10.15 | 79.33 ± 10.08 | <0.0001 | 78.25 ± 10.05 | 78.48 ± 10.24 | 0.1789 |
| HDL (mg/dL) | 55.56 ± 20.98 | 52.65 ± 22.33 | <0.0001 | 56.45 ± 18.09 | 53.07 ± 18.86 | <0.0001 | 55.34 ± 20.88 | 52.74 ± 21.73 | <0.0001 | 54.25 ± 27.1 | 52.31 ± 24.64 | <0.0001 |
| TG (mg/dL) | 134.13 ± 92.77 | 151.31 ± 97.92 | <0.0001 | 123.63 ± 92.77 | 154.21 ± 109 | <0.0001 | 138.67 ± 94.47 | 154.07 ± 99.57 | <0.0001 | 140.51 ± 82.57 | 144.32 ± 89.46 | 0.0054 |
| Renal duration | 8.26 ± 0.79 | 4.49 ± 2.48 | <0.0001 | 8.31 ± 0.37 | 5.01 ± 2.32 | <0.0001 | 8.3 ± 0.65 | 4.48 ± 2.49 | <0.0001 | 7.92 ± 1.62 | 4.3 ± 2.47 | <0.0001 |
| Age (Years) | Total | 20–39 | 40–64 | ≥65 | ||||||||
|---|---|---|---|---|---|---|---|---|---|---|---|---|
| Mets Var. | Incidence | Model 1 | Model 2 | Incidence | Model 1 | Model 2 | Incidence | Model 1 | Model 2 | Incidence | Model 1 | Model 2 |
| Body mass index (kg/m2) | ||||||||||||
| <18.5 | 0.07 | 0.67 (0.58, 0.76) | 0.78 (0.68, 0.9) | 0.02 | 0.73 (0.53, 1.02) | 1.03 (0.74, 1.43) | 0.09 | 0.77 (0.62, 0.96) | 0.78 (0.62, 0.97) | 0.29 | 0.9 (0.73, 1.1) | 0.86 (0.7, 1.06) |
| 18.5–22.9 | 0.11 | 1 (Ref.) | 1 (Ref.) | 0.03 | 1 (Ref.) | 1 (Ref.) | 0.12 | 1 (Ref.) | 1 (Ref.) | 0.33 | 1 (Ref.) | 1 (Ref.) |
| 23–24.9 | 0.17 | 1.55 (1.48, 1.62) | 1.31 (1.25, 1.38) | 0.05 | 1.72 (1.47, 2.02) | 1.34 (1.14, 1.58) | 0.17 | 1.44 (1.36, 1.53) | 1.28 (1.2, 1.36) | 0.38 | 1.17 (1.07, 1.27) | 1.22 (1.1, 1.32) |
| 25–29.9 | 0.21 | 1.94 (1.86, 2.03) | 1.61 (1.54, 1.68) | 0.09 | 2.85 (2.49, 3.25) | 2.07 (1.8, 2.39) | 0.23 | 1.88 (1.78, 2) | 1.6 (1.52, 1.7) | 0.39 | 1.19 (1.1, 1.29) | 1.34 (1.24, 1.46) |
| ≥30 | 0.22 | 2.07 (1.9, 2.25) | 2.06 (1.89, 2.24) | 0.10 | 3.25 (2.6, 4.06) | 2.56 (2.05, 3.21) | 0.28 | 2.31 (2.072, 2.57 | 2.25 (2.02, 2.5) | 0.39 | 1.21 (1.0, 1.45) | 1.66 (1.38, 1.99) |
| Waist circumference (cm, M/F) | ||||||||||||
| <70/<65 | 0.05 | 0.52 (0.45, 0.6) | 0.7 (0.61, 0.81) | 0.02 | 0.58 (0.43, 0.8) | 0.8 (0.59, 1.1) | 0.08 | 0.74 (0.61, 0.9) | 0.81 (0.67, 0.99) | 0.19 | 0.6 (0.44, 0.82) | 0.54 (0.39, 0.74) |
| 70–79/65–74 | 0.09 | 1 (Ref.) | 1 (Ref.) | 0.03 | 1 (Ref.) | 1 (Ref.) | 0.10 | 1 (Ref.) | 1 (Ref.) | 0.32 | 1 (Ref.) | 1 (Ref.) |
| 80–89/75–84 | 0.17 | 1.95 (1.86, 2.05) | 1.44 (1.37, 1.51) | 0.06 | 2.07 (1.81, 2.37) | 1.58 (1.38, 1.82) | 0.18 | 1.73 (1.63, 1.84) | 1.39 (1.31, 1.48) | 0.36 | 1.13 (1.03, 1.25) | 1.2 (1.09, 1.32) |
| 90–99/85–94 | 0.25 | 2.76 (2.62, 2.91) | 1.81 (1.72, 1.91) | 0.09 | 3.14 (2.67, 3.69) | 2.28 (1.93, 2.7) | 0.25 | 2.41 (2.25, 2.58) | 1.8 (1.68, 1.93) | 0.38 | 1.2 (1.08, 1.33) | 1.37 (1.23, 1.51) |
| ≥100/≥95 | 0.29 | 3.21 (2.94, 3.5) | 2.27 (2.08, 2.47) | 0.13 | 4.2 (3.25, 5.43) | 3.35 (2.59, 4.34) | 0.28 | 2.72 2.41, 3.06) | 2.16 (1.92, 2.44) | 0.45 | 1.42 (1.22, 1.65) | 1.82 (1.57, 2.12) |
| Age (Years) | All | 20–39 | 40–64 | ≥65 | ||||
|---|---|---|---|---|---|---|---|---|
| HR (95% CI) | HR (95% CI) | HR (95% Cl) | HR (95% CI) | |||||
| Model 1 | Model 2 | Model 1 | Model 2 | Model1 | Model2 | Model1 | Model2 | |
| Obesity | 1.65 (1.6, 1.71) | 1.48 (1.43, 1.53) | 2.47 (2.21, 2.75) | 1.89 (1.69, 2.12) | 1.63 (1.56, 1.71) | 1.48 (1.421.55) | 1.12 (1.05, 1.2) | 1.26 (1.18, 1.35) |
| Central obesity | 1.93 (1.83, 1.98) | 1.48 (1.43, 1.54) | 2.38 (2.1, 2.69) | 1.88 (1.65, 2.13) | 1.72(1.64, 1.8) | 1.47 (1.4, 1.54) | 1.14 (1.07, 1.22) | 1.28 (1.2, 1.37) |
| DM | 1.7 (1.64, 1.76) | 1.21 (1.17, 1.26) | 1.43 (1.26, 1.62) | 1.12 (0.98, 1.27) | 1.44 (1.37, 1.5) | 1.16 (1.11, 1.21) | 1.16 (1.09, 1.24) | 1.12 (1.04, 1.19) |
| HTN | 2.47 (2.38, 2.56) | 1.58 (1.52, 1.64) | 1.97 (1.77, 2.2) | 1.49 (1.33, 1.68) | 1.97 (1.88, 2.06) | 1.54 (1.47, 1.61) | 1.41 (1.3, 1.53) | 1.44 (1.33, 1.56) |
| low HDL | 1.57 (1.51, 1.63) | 1.38 (1.33, 1.44) | 1.44 (1.27, 1.64) | 1.38 (1.21, 1.57) | 1.29 (1.24, 1.35) | 1.34 (1.28, 1.4) | 1.02 (0.96, 1.1) | 1.32 (1.24, 1.41) |
| High TG | 1.7 (1.64, 1.76) | 1.29 (1.25, 1.34) | 1.87 (1.67, 2.09) | 1.29 (1.15, 1.45) | 1.54 (1.47, 1.61) | 1.25 (1.19, 1.3) | 1.12 (1.05, 1.19) | 1.22 (1.14, 1.3) |
| MetS | 2.28 (2.2, 2.36) | 1.56 (1.51, 1.62) | 2.55 (2.25, 2.89) | 1.82 (1.6, 2.07) | 1.87 (1.78, 1.95) | 1.5 (1.43, 1.57) | 1.2 (1.13, 1.28) | 1.37 (1.29, 1.47) |
| Number of MetS components | ||||||||
| 1 | 1.67 (1.56, 1.77) | 1.23 (1.16, 1.31) | 1.48 (1.28, 1.72) | 1.21 (1.04, 1.41) | 1.36 (1.26, 1.47) | 1.16 (1.07, 1.26) | 1.09 (0.94, 1.27) | 1.13 (0.97, 1.32) |
| 2 | 2.5 (2.35, 2.66) | 1.52 (1.43, 1.61) | 2 (1.7, 2.35) | 1.39 (1.18, 1.64) | 1.88 (1.74, 2.03) | 1.43 (1.33, 1.55) | 1.22 (1.06, 1.42) | 1.34 (1.16, 1.55) |
| 3 | 3.21 (3.02, 3.42) | 1.77 (1.66, 1.89) | 3.11 (2.61, 3.7) | 1.98 (1.65, 2.37) | 2.26 (2.09, 2.44) | 1.61 (1.49, 1.75) | 1.27 (1.1, 1.47) | 1.5 (1.29, 1.73) |
| 4 | 4.29 (4.01, 4.58) | 2.18 (2.04, 2.33) | 4 (3.19, 5.01) | 2.43 (1.93, 3.06) | 2.97 (2.73, 3.23) | 2.01 (1.85, 2.19) | 1.44 (1.24, 1.67) | 1.74 (1.51, 2.04) |
| 5 | 5.25 (4.83, 5.71) | 2.53 (2.33, 2.76) | 4.98 (3.32, 7.48) | 2.92 (1.94, 4.41) | 3.67 (3.29, 4.09) | 2.41 (2.16, 2.69) | 1.53 (1.29, 1.81) | 1.97 (1.66, 2.33) |
| Obesity/MetS | ||||||||
| (−/+) | 2.32 (2.2, 2.44) | 1.44 (1.37, 1.52) | 2.3 (1.75, 3) | 1.57 (1.2, 2.07) | 1.71 (1.6, 1.83) | 1.33 (1.24, 1.42) | 1.14 (1.05, 1.24) | 1.29 (1.19, 1.41) |
| (+/−) | 1.42 (1.35, 1.49) | 1.33 (1.26, 1.4) | 2.18 (1.92, 2.49) | 1.74 (1.52, 1.99) | 1.41 (1.32, 1.5) | 1.33 (1.24, 1.41) | 0.99 (0.88, 1.12) | 1.12 (0.99, 1.26) |
| (+/+) | 2.61 (2.5, 2.73) | 1.87 (1.79, 1.95) | 3.47 (3.01, 4.01) | 2.41 (2.08, 2.8) | 2.27 (2.15, 2.4) | 1.82 (1.72, 1.92) | 1.26 (1.16, 1.37) | 1.53 (1.4, 1.66) |
| Gender | Age (Years) | BMI Cutoff (kg/m2) | Youden’s Index | Sensitivity | Specificity | WC Cutoff (cm) | Youden’s Index | Sensitivity | Specificity |
|---|---|---|---|---|---|---|---|---|---|
| Total | 20–39 | 23.9 | 0.229 | 0.608 | 0.621 | 81 | 0.244 | 0.645 | 0.598 |
| 40–64 | 23.9 | 0.133 | 0.626 | 0.507 | 82 | 0.191 | 0.652 | 0.539 | |
| ≥65 | 23.5 | 0.058 | 0.609 | 0.449 | 84 | 0.106 | 0.592 | 0.514 | |
| Male | 20–39 | 24.1 | 0.182 | 0.655 | 0.527 | 81 | 0.178 | 0.746 | 0.432 |
| 40–64 | 24 | 0.106 | 0.643 | 0.463 | 85 | 0.121 | 0.601 | 0.521 | |
| ≥65 | 23.5 | 0.071 | 0.574 | 0.497 | 84 | 0.074 | 0.639 | 0.435 | |
| Female | 20–39 | 21.6 | 0.117 | 0.496 | 0.621 | 72 | 0.097 | 0.462 | 0.635 |
| 40–64 | 23.1 | 0.124 | 0.666 | 0.458 | 79 | 0.133 | 0.534 | 0.600 | |
| ≥65 | 24.4 | 0.095 | 0.567 | 0.528 | 84 | 0.076 | 0.496 | 0.580 |
| Age (Years) | All | 20–39 | 40–64 | ≥65 | ||||
|---|---|---|---|---|---|---|---|---|
| HR (95% CI) | HR (95% CI) | HR (95% CI) | HR (95% CI) | |||||
| Gender | Male | Female | Male | Female | Male | Female | Male | Female |
| Body mass index (kg/m2) | ||||||||
| <18.5 | 0.75 (0.64, 0.89) | 0.7 (0.56, 0.89) | 0.86 (0.49, 1.5) | 1.01 (0.66, 1.53) | 0.78 (0.59, 1.03) | 0.76 (0.53, 1.11) | 0.92 (0.73, 1.16) | 0.69 (0.44, 1.09) |
| 18.5–22.9 | 1 (Ref.) | 1 (Ref.) | 1 (Ref.) | 1 (Ref.) | 1 (Ref.) | 1 (Ref.) | 1 (Ref.) | 1 (Ref.) |
| 23–24.9 | 1.35 (1.28, 1.43) | 1.29 (1.18, 1.41) | 1.52 (1.27, 1.82) | 0.74 (0.46, 1.19) | 1.33 (1.24, 1.44) | 1.2 (1.08, 1.34) | 1.3 (1.08, 1.32) | 1.27 (1.08, 1.47) |
| 25–29.9 | 1.7 (1.61, 1.79) | 1.53 (1.41, 1.66) | 2.3 (1.96, 2.69) | 1.27 (0.83, 1.92) | 1.7 (1.59, 1.82) | 1.45 (1.3, 1.6) | 1.32 (1.2, 1.46) | 1.39 (1.2, 1.61) |
| ≥30 | 2.22 (2, 2.46) | 2 (1.73, 2.31) | 2.84 (2.23, 3.61) | 1.77 (0.86, 3.61) | 2.41 (2.11, 2.75) | 2.04 (1.7, 2.44) | 1.71 (1.31, 2.24) | 1.64 (1.27, 2.12) |
| Waist circumference (cm) | ||||||||
| <70/<65 | 0.63 (0.52, 0.78) | 0.74 (0.6, 0.92) | 0.65 (0.38, 1.1) | 0.82 (0.55, 1.22) | 0.71 (0.54, 0.95) | 0.91 (0.69, 1.21) | 0.49 (0.34, 0.71) | 0.74 (0.4, 1.37) |
| 70–79/65–74 | 1 (Ref.) | 1 (Ref.) | 1 (Ref.) | 1 (Ref.) | 1 (Ref.) | 1 (Ref.) | 1 (Ref.) | 1 (Ref.) |
| 80–89/75–84 | 1.52 (1.43, 1.61) | 1.42 (1.31, 1.54) | 1.73 (1.48, 2.03) | 1.15 (0.82, 1.61) | 1.43 (1.32, 1.54) | 1.37 (1.24, 1.52) | 1.2 (1.08, 1.34) | 1.19 (1, 1.43) |
| 90–99/85–94 | 1.99 (1.87, 2.12) | 1.62 (1.46, 1.78) | 2.55 (2.13, 3.06) | 1.06 (0.57, 1.96) | 1.91 (1.75, 2.08) | 1.62 (1.43, 1.83) | 1.4 (1.24, 1.57) | 1.32 (1.091.59) |
| ≥100/≥95 | 2.61 (2.33, 2.9) | 1.91 (1.64, 2.22) | 3.79 (2.88, 5) | 1.78 (0.73, 4.36) | 2.51 (2.17, 2.89) | 1.62 (1.3, 2.04) | 1.83 (1.5, 2.23) | 1.82 (1.44, 2.31) |
| MetS | 1.64 (1.57, 1.71) | 1.44 (1.34, 1.54) | 1.82 (1.6, 2.09) | 1.61 (0.91, 2.83) | 1.55 (1.47, 1.63) | 1.39 (1.27, 1.52) | 1.42 (1.31, 1.53) | 1.3 (1.15, 1.46) |
| Obesity | 1.52 (1.46, 1.58) | 1.45 (1.36, 1.56) | 1.96 (1.74, 2.21) | 1.41 (0.98, 2.03) | 1.52 (1.44, 1.6) | 1.41 (1.3, 1.54) | 1.25 (1.15, 1.36) | 1.29 (1.15, 1.45) |
| Central obesity | 1.56 (1.49, 1.63) | 1.35 (1.25, 1.45) | 1.94 (1.7, 2.21) | 1.21 (0.72, 2.01) | 1.53 (1.44, 1.62) | 1.33 (1.21, 1.47) | 1.3 (1.2, 1.41) | 1.25 (1.11, 1.4) |
| DM | 1.21 (1.16, 1.26) | 1.24 (1.15, 1.32) | 1.08 (0.95, 1.24) | 1.38 (0.96, 1.98) | 1.14 (1.08, 1.2) | 1.21 (1.11, 1.32) | 1.11 (1.03, 1.21) | 1.13 (1, 1.26) |
| HTN | 1.61 (1.54, 1.68) | 1.57 (1.46, 1.69) | 1.52 (1.34, 1.71) | 1.29 (0.87, 1.91) | 1.55 (1.47, 1.64) | 1.52 (1.39, 1.65) | 1.45 (1.31, 1.6) | 1.43 (1.24, 1.65) |
| Low HDL | 1.43 (1.37, 1.49) | 1.29 (1.21, 1.38) | 1.39 (1.2, 1.6) | 1.35 (0.99, 1.83) | 1.4 (1.32, 1.48) | 1.22 (1.12, 1.32) | 1.36 (1.26, 1.48) | 1.24 (1.1, 1.39) |
| High TG | 1.33 (1.27, 1.38) | 1.25 (1.17, 1.34) | 1.27 (1.13, 1.44) | 1.52 (1.01, 2.3) | 1.29 (1.23, 1.36) | 1.15 (1.05, 1.25) | 1.25 (1.15, 1.35) | 1.17 (1.05, 1.32) |
| Obesity and Metabolic syndrome | ||||||||
| MetS only | 1.49 (1.4, 1.59) | 1.39 (1.26, 1.53) | 1.53 (1.15, 2.04) | 2.38 (1.05, 5.39) | 1.34 (1.23, 1.45) | 1.32 (1.16, 1.51) | 1.33 (1.3, 1.47) | 1.23 (1.05, 1.44) |
| Obesity only | 1.34 (1.26, 1.42) | 1.43 (1.3, 1.57) | 1.79 (1.55, 2.06) | 1.47 (0.98, 2.19) | 1.32 (1.23, 1.43) | 1.36 (1.22, 1.53) | 1.07 (0.92, 1.23) | 1.22 (1, 1.5) |
| Both | 1.97 (1.88, 2.08) | 1.73 (1.59, 1.89) | 2.49 (2.13, 2.91) | 1.36 (0.63, 2.89) | 1.9 (1.78, 2.02) | 1.66 (1.48, 1.85) | 1.54 (1.4, 1.71) | 1.49 (1.29, 1.73) |
Disclaimer/Publisher’s Note: The statements, opinions and data contained in all publications are solely those of the individual author(s) and contributor(s) and not of MDPI and/or the editor(s). MDPI and/or the editor(s) disclaim responsibility for any injury to people or property resulting from any ideas, methods, instructions or products referred to in the content. |
© 2023 by the authors. Licensee MDPI, Basel, Switzerland. This article is an open access article distributed under the terms and conditions of the Creative Commons Attribution (CC BY) license (https://creativecommons.org/licenses/by/4.0/).
Share and Cite
Lee, H.Y.; Han, K.-D.; Woo, I.S.; Kwon, H.-S. Association of Metabolic Syndrome Components and Nutritional Status with Kidney Cancer in Young Adult Population: A Nationwide Population-Based Cohort Study in Korea. Biomedicines 2023, 11, 1425. https://doi.org/10.3390/biomedicines11051425
Lee HY, Han K-D, Woo IS, Kwon H-S. Association of Metabolic Syndrome Components and Nutritional Status with Kidney Cancer in Young Adult Population: A Nationwide Population-Based Cohort Study in Korea. Biomedicines. 2023; 11(5):1425. https://doi.org/10.3390/biomedicines11051425
Chicago/Turabian StyleLee, Hee Yeon, Kyung-Do Han, In Sook Woo, and Hyuk-Sang Kwon. 2023. "Association of Metabolic Syndrome Components and Nutritional Status with Kidney Cancer in Young Adult Population: A Nationwide Population-Based Cohort Study in Korea" Biomedicines 11, no. 5: 1425. https://doi.org/10.3390/biomedicines11051425
APA StyleLee, H. Y., Han, K.-D., Woo, I. S., & Kwon, H.-S. (2023). Association of Metabolic Syndrome Components and Nutritional Status with Kidney Cancer in Young Adult Population: A Nationwide Population-Based Cohort Study in Korea. Biomedicines, 11(5), 1425. https://doi.org/10.3390/biomedicines11051425