Article

Elucidating the Histone Deacetylase Gene Expression Signatures in Peripheral Blood Mononuclear Cells That Correlate Essential Cardiac Function and Aid in Classifying Coronary Artery Disease through a Logistic Regression Model

1
Drug Discovery and Multi-omics Laboratory, Faculty of Allied Health Sciences, Chettinad Academy of Research and Education, Chettinad Hospital and Research Institute, Kelambakkam 603103, India
2
Department of Cardiology, Chettinad Hospital and Research Institute, Chettinad Health City, Kelambakkam 603103, India
3
Department of Pharmacology and Toxicology, College of Pharmacy, King Saud University, Riyadh 11451, Saudi Arabia
4
Department of Pathology and Laboratory Medicine, Warren Alpert Medical School, Brown University, Providence, RI 02912, USA
5
Legorreta Cancer Center, Brown University, Providence, RI 02912, USA
6
Department of Pharmacy, Faculty of Allied Health Sciences, Daffodil International University, Dhaka 1207, Bangladesh
7
Madras Diabetes Research Foundation, Chennai 600086, India
8
Department of Neurology, University of New Mexico Albuquerque, Albuquerque, NM 87131, USA
*
Authors to whom correspondence should be addressed.
Biomedicines 2023, 11(11), 2952; https://doi.org/10.3390/biomedicines11112952
Submission received: 30 September 2023 / Revised: 26 October 2023 / Accepted: 28 October 2023 / Published: 1 November 2023

Abstract

:
A proinflammatory role of HDACs has been implicated in the pathogenesis of atherosclerosis as an emerging novel epigenetic diagnostic biomarker. However, its association with the clinical and cardiovascular function in coronary artery disease is largely unknown. The study aimed to profile the gene expression of HDAC111 in human peripheral blood mononuclear cells and to evaluate their influence on hematological, biochemical, and two-dimensional echocardiographic indices in CAD. The HDAC gene expression profiles were assessed in 62 angioproven CAD patients and compared with 62 healthy controls. Among the HDACs, upregulated HDACs 1,2, 4, 6, 8, 9, and 11 were upregulated, and HDAC3 was downregulated, which was significantly (p ≤ 0.05) linked with the hematological (basophils, lymphocytes, monocytes, and neutrophils), biochemical (LDL, HDL, and TGL), and echocardiographic parameters (cardiac function: biplane LVEF, GLS, MV E/A, IVRT, and PV S/D) in CAD. Furthermore, our constructed diagnostic model with the crucial HDACs establishes the most crucial HDACs in the classification of CAD from control with an excellent accuracy of 88.6%. Conclusively, our study has provided a novel perspective on the HDAC gene expression underlying cardiac function that is useful in developing molecular methods for CAD diagnosis.

Graphical Abstract

1. Introduction

Coronary artery disease (CAD) continues to be a leading cause of mortality globally [1]. CAD is caused by atherosclerosis. Plaque formation and progression result from the intricate interaction of cellular molecules, exacerbated by traditional risk factors such as diabetes, smoking, hypertension, and obesity. These traditional risk factors significantly impact the endothelium and increase the disease burden, resulting in significant complications [2]. Clinical symptoms, an electrocardiogram (ECG) [3,4], stress testing, cardiac computed tomography (CT), and molecular markers [5] are used to diagnose coronary artery disease. Despite these diagnostic methods, there is no effective early detection procedure for CAD. Consequently, a diagnostic method that can screen for and predict CAD with high sensitivity and specificity is still desired.
Recent discoveries on epigenetic regulation implicate them as predictive markers in clinical contexts for cancer, neurodegenerative disorders, cardiovascular diseases, metabolic syndrome, inflammation, and immune disorders [6]. Several epigenetic modifications, such as histone protein modification, DNA methylation, microRNA expression, and long noncoding RNAs, influence transcription machinery, resulting in cellular and molecular changes [7]. Histone deacetylase (HDAC) is essential in modulating cellular gene expression and contributing to physiological changes in the cardiovascular system [8]. Several animal and cell model experiments implicate HDACs in endothelial and inflammatory processes associated with the pathogenesis of CAD [9]. However, the effect of HDACs on the structure and function of the myocardium is largely unknown. Establishing the HDAC mechanisms associated with cardiac physiology may aid in developing a biomarker for diagnosing CAD.
This study aimed to profile the HDAC gene expression in human peripheral blood mononuclear cells (PBMCs) to correlate with the hemodynamic status of the heart based on the hematological, biochemical, and two-dimensional echocardiographic indices in participants with CAD. The assessment of hemodynamic status reveals a substantial epigenetic connection between HDACs and cardiovascular function. Further, the developed diagnostic model with logistic regression provides evidence to rationalize specific HDACs as a possible diagnostic marker for CAD.

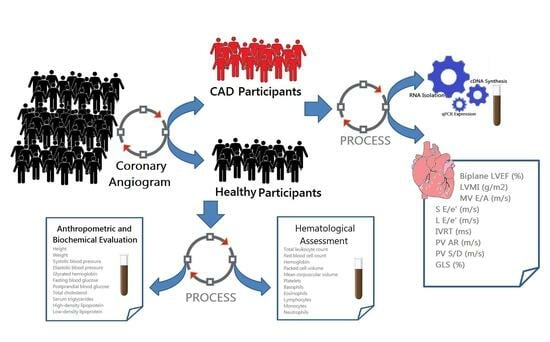
2. Materials and Methods

2.1. Clinical Specimens

The institutional human ethics committee of the Chettinad Academy of Research and Education (IHEC/10-17/Proposal No. 372) was obtained for this study. All participantssigned informed consent before the initiation of the investigation process. Study participants were recruited at Chettinad Super Specialty Hospital between August 2019 and December 2019 and underwent a coronary angiogram with angina symptoms. Each study participant’s demographic and clinical histories were recorded based on a questionnaire approved by the institution’s institutional review board. By the inclusion and exclusion criteria, 124 participants were recruited for the study. The inclusion criteria for the study participants include the following:(1) Participants belonging to South Indian ancestry of both genders. (2) Physiological status was diagnosed or classified by a qualified senior consultant cardiologist based on the coronary angiogram (for CAD, a lesion greater than 30% in the primary coronary artery or main branches, and participants without CAD, lesions below 30%). The exclusion criteria include the following: 1. previous history of myocardial infarction (MI); 2. heart failure; 3. arterial revascularization; 4. rheumatic disease; 5. cardiomyopathies; 6. pericardial diseases; 7. a severe systemic inflammatory disorder; and 8. acute or chronic respiratory diseases.

2.2. Human Anthropometric and Biochemical Evaluation

Standardized methodologies were used to measure anthropometric measurements such as height (m2) and weight (kg) to yield the body mass index (BMI). A mercury sphygmomanometer was used to measure systolic blood pressure (BP) and diastolic BP for the participants. The biochemical indices such as glycated hemoglobin (HbA1c) (urease method), fasting (FBS) and postprandial blood glucose (PPBS) (hexokinase method), total cholesterol (T. cholesterol) (CHOD/POD end method), serum triglycerides (TGL) (GPO POD method), high-density lipoprotein (HDL) (direct method), low-density lipoprotein (LDL) (Friedewald formula), and complete blood count including, total leukocyte count (TLC), red blood cell count (RBC), hemoglobin (HB), packed cell volume (PCV), mean corpuscular volume (MCV), mean corpuscular hemoglobin (MCH), mean corpuscular hemoglobin concentration (MCHC), red cell distribution width (RDW), platelets, basophils, eosinophils, lymphocytes, monocytes, and neutrophils were assessed using Coulter LH 780 Hematology Analyzer (Beckman Coulter, Brea, CA, USA).

2.3. Gene Expression Profiling of HDAC

Peripheral blood (5 mL) was collected from the study participants (62 CAD and 62 control) in the K2EDTA BD Vacutainer (BD Vacutainer®) at Cath ICU, Department of Cardiology, Chettinad Super Specialty Hospital. Following the manufacturer’s protocol, histopaque (Cat#1077, Sigma-Aldrich, St. Louis, MO, USA) was used to isolate the PBMCs from the collected whole blood. Total RNA was extracted from PBMCs (1.30 × 10⁶ cells/mL) using Trizol reagent (cat#15596026, Invitrogen, Waltham, MA, USA). The Nanodrop 2000 Spectrophotometer (Thermo Scientific, Waltham, MA, USA) was used to quantify the collected RNA. The reverse transcription was carried out for cDNA synthesis using a SuperScript III First-Strand (Life Technologies, Carlsbad, CA, USA). The gene expression was performed using ABI-7000 (Applied Biosystems, Waltham, MA, USA) with SYBR green master mix (Takara, Kusatsu, Japan) and gene-specific primers for HDACs (Table 1). The HDAC gene expressions were normalized with the housekeeping gene (GAPDH), and the expression was calculated by the ΔΔCt method.

2.4. Echocardiography Imaging

Transthoracic 2D echocardiography was performed using Esaote (MyLabTM25Gold) according to the guidelines of the American Society of Echocardiography [10,11]. Left ventricular structural indices such as left ventricular interventricular septal, posterior wall thickness, left ventricular end-systolic dimension, and left ventricular end-diastolic dimension were measured using M-mode echocardiography at the chordae tendineae level to determine left ventricular ejection fraction (biplane LVEF). Further, the mass index of the left ventricle (LVMI) was calculated using the Devereux 1987 method. The biplane Simpson’s technique and global longitudinal strain (GLS) were utilized to determine the left ventricle’s systolic functions. Furthermore, pulsed wave transmitral flow and tissue Doppler velocity were implemented to determine the left ventricular diastolic functions based on early and late transmitral flow velocity, mitral inflow E/A ratio (MV E/A), mitral peak lateral (L E/e′) and septal myocardial early diastolic velocity (S E/e′), isovolumetric relaxation time (IVRT), pulmonary vein AR duration (PV AR), and pulmonary venous systolic velocity/diastolic velocity ratio (PV S/D).

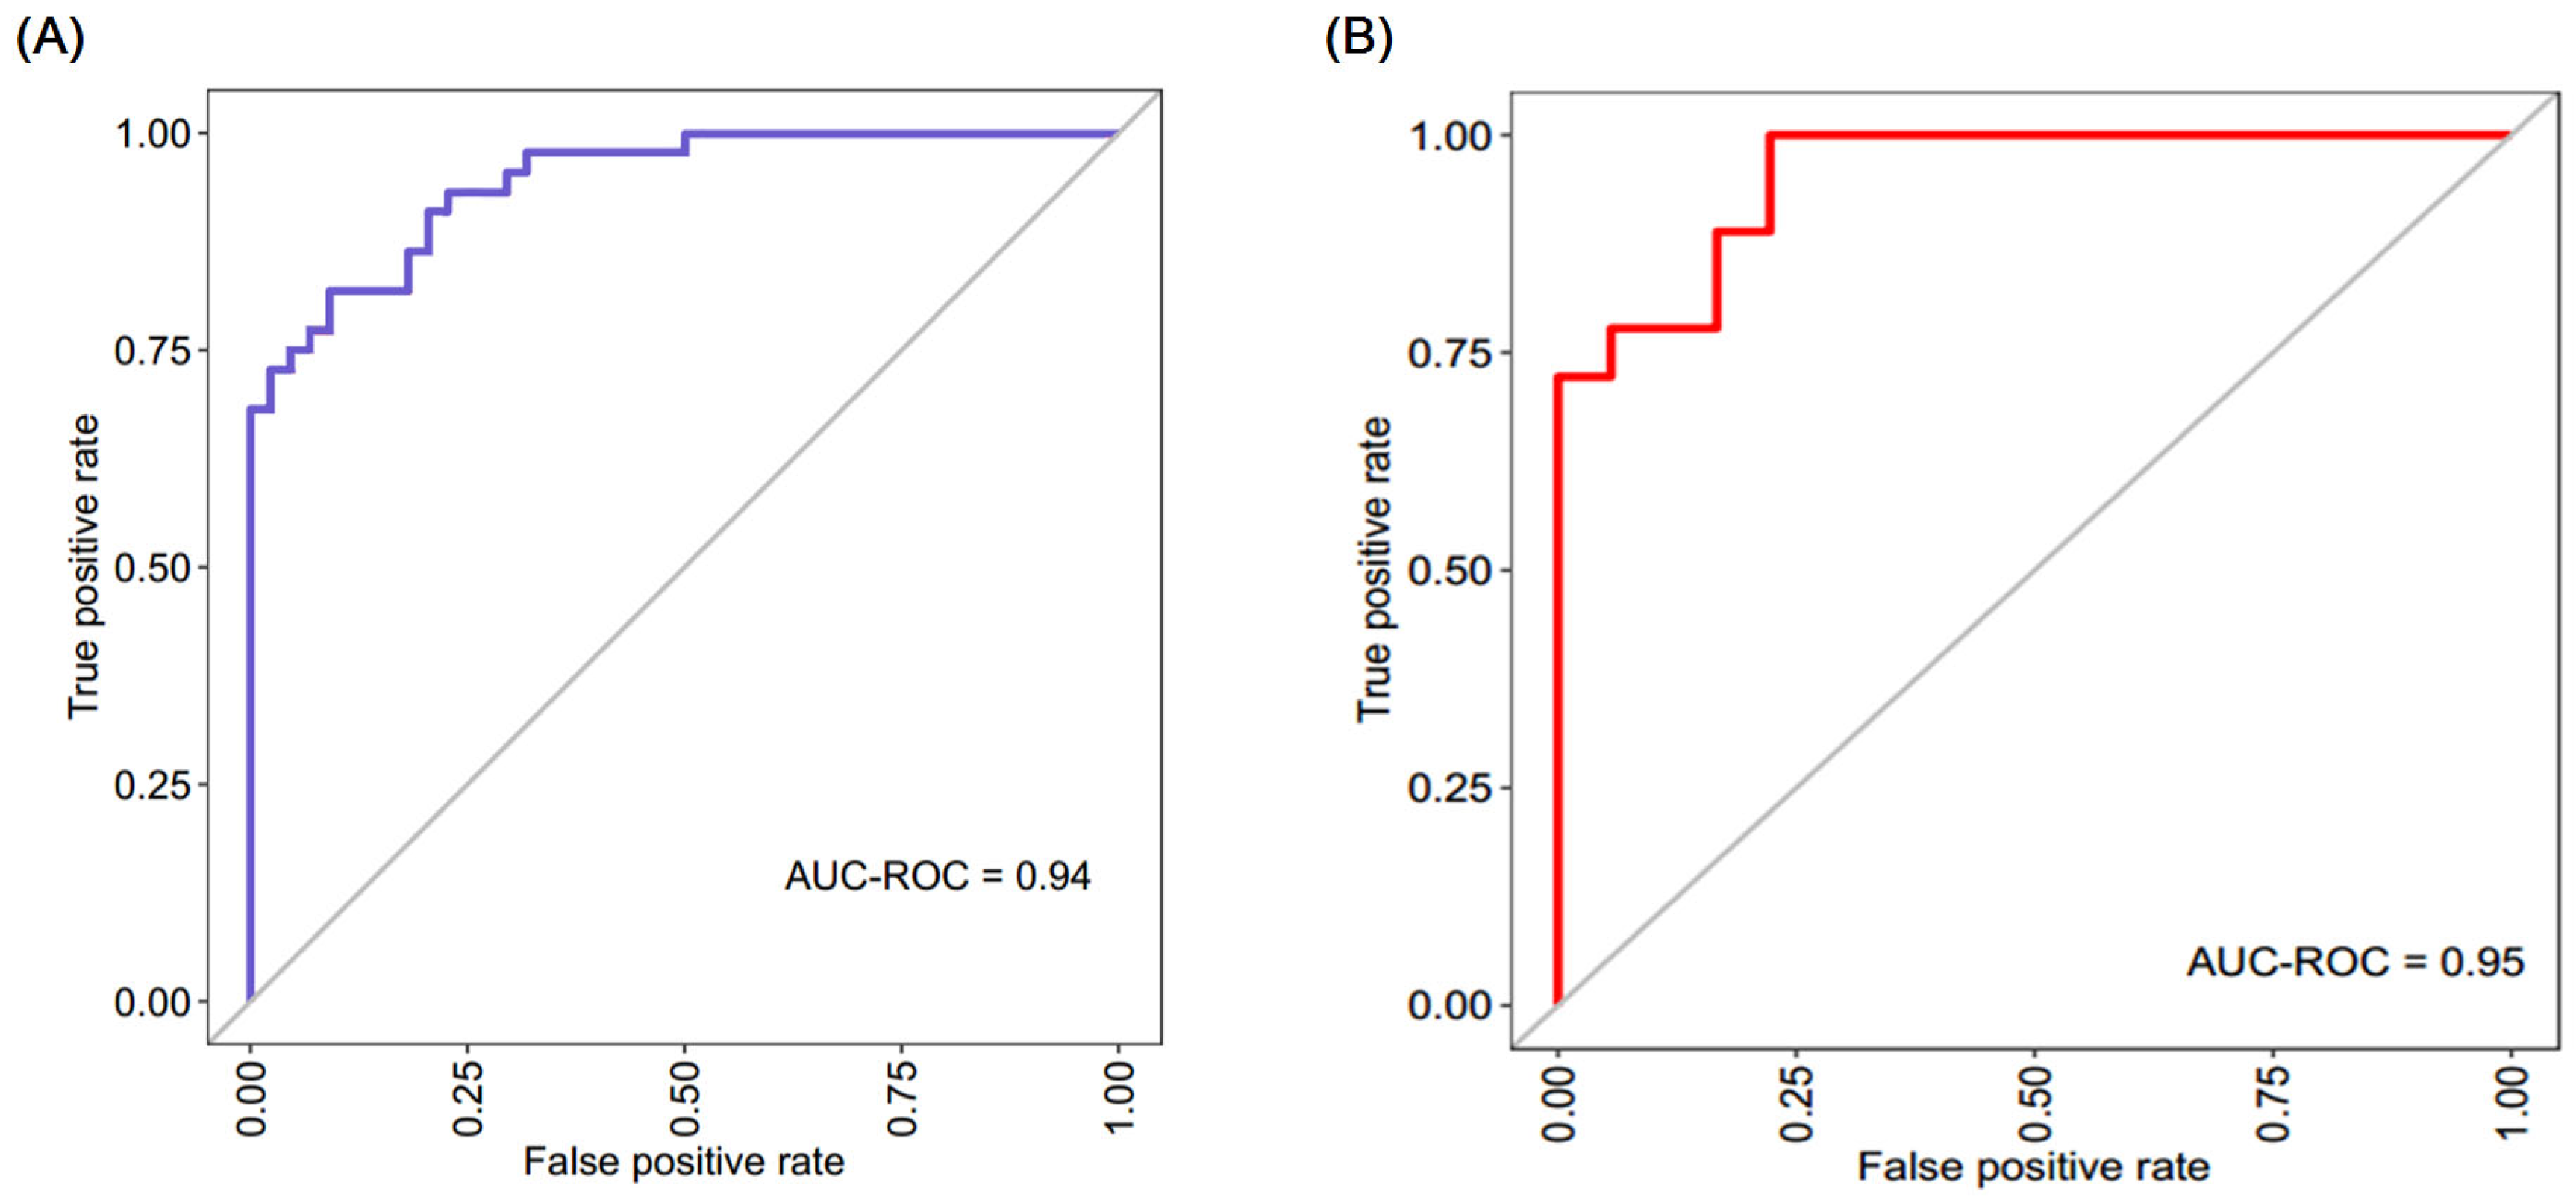
2.5. Diagnostic Model Using Binary Logistic Regression

To assess the diagnostic value of the HDACs related to anthropometric, biochemical, and imaging parameters, the diagnostic model was constructed by fitting the expression value of the significant HDACs into a binary logistic regression model (glm2 package version 1.2.1, R package). Youden’s J index was used to find the optimal threshold. All 124 participants were classified into training (70%) and test set (30%). The training cohort was utilized for constructing the model, while the testing cohort was employed to assess the model’s performance. Then, the receiver operating characteristic (ROC) curves were utilized to evaluate the model’s efficacy.

2.6. Statistical Examination

The characteristics of participants, such as anthropometric, biochemical, molecular, and imaging parameters, were represented as the mean ± standard deviation. The difference between the CAD and control was determined using a student t-test for each characteristic except gender data. The categorical data (gender) were assessed throughthe Chi-square test. The Pearson correlation was implemented to assess the association between the characteristics. All statistical analyses were performed using SPSS (version 21), and significance was determined if the p-value was less than 0.05.

3. Results

3.1. Evaluation of Anthropometric, Hematological, and Biochemical Features

In anthropometric measurements, systolic BP and diastolic BP were significantly elevated in CAD. Similarly, lipid parameters such as T. cholesterol (p < 0.05), TGL (p < 0.001), and LDL (p < 0.001) were significantly elevated in CAD compared to the control group. In contrast, HDL (p < 0.001) decreased in CAD compared to the controls. Similarly, the complete blood count parameters, including TLC (p < 0.001), HB (p < 0.001), RBC (p < 0.001), PCV (p < 0.001), basophils (p < 0.05), lymphocytes (p < 0.05), monocytes (p < 0.001), and neutrophils (p < 0.001) were significantly altered. In contrast, there were no statistically significant differences between CAD and the control for age, BMI, FBS, PPBS, MCV, MCH, MCHC, RDW, platelets, eosinophils, and HbA1c levels (Table 2).

3.2. Gene Expression Profiling of HDACs in PBMCs

The gene expression of HDACs was evaluated in PBMCs and compared between CAD and control groups. As shown in Table 3, CAD exhibited a significant increase in HDAC1, HDAC2, HDAC4, HDAC6, HDAC8, HDAC9, and HDAC11 expression, while HDAC3 expression decreased compared to the control. In contrast, HDAC5, HDAC7, and HDAC10 failed to reach the minimal significance level between groups.

3.3. Assessment of 2D Echocardiographic Imaging

Using echocardiography, the structure and functional behavior of the heart were evaluated in 124 participants. Table 4 displays the outcome of echocardiographic indices. In CAD, the echocardiographic indices of LVMI, PV S/D, and IVRT were significantly increased. In contrast, the ratios of MV E/A, S E/e′, L E/e, PV AR, biplane LVEF, and GLS weredecreased compared to the control. Consequently, the statistical analysis of echocardiographic indices confirms the left ventricular dysfunction in CAD relative to healthy individuals.

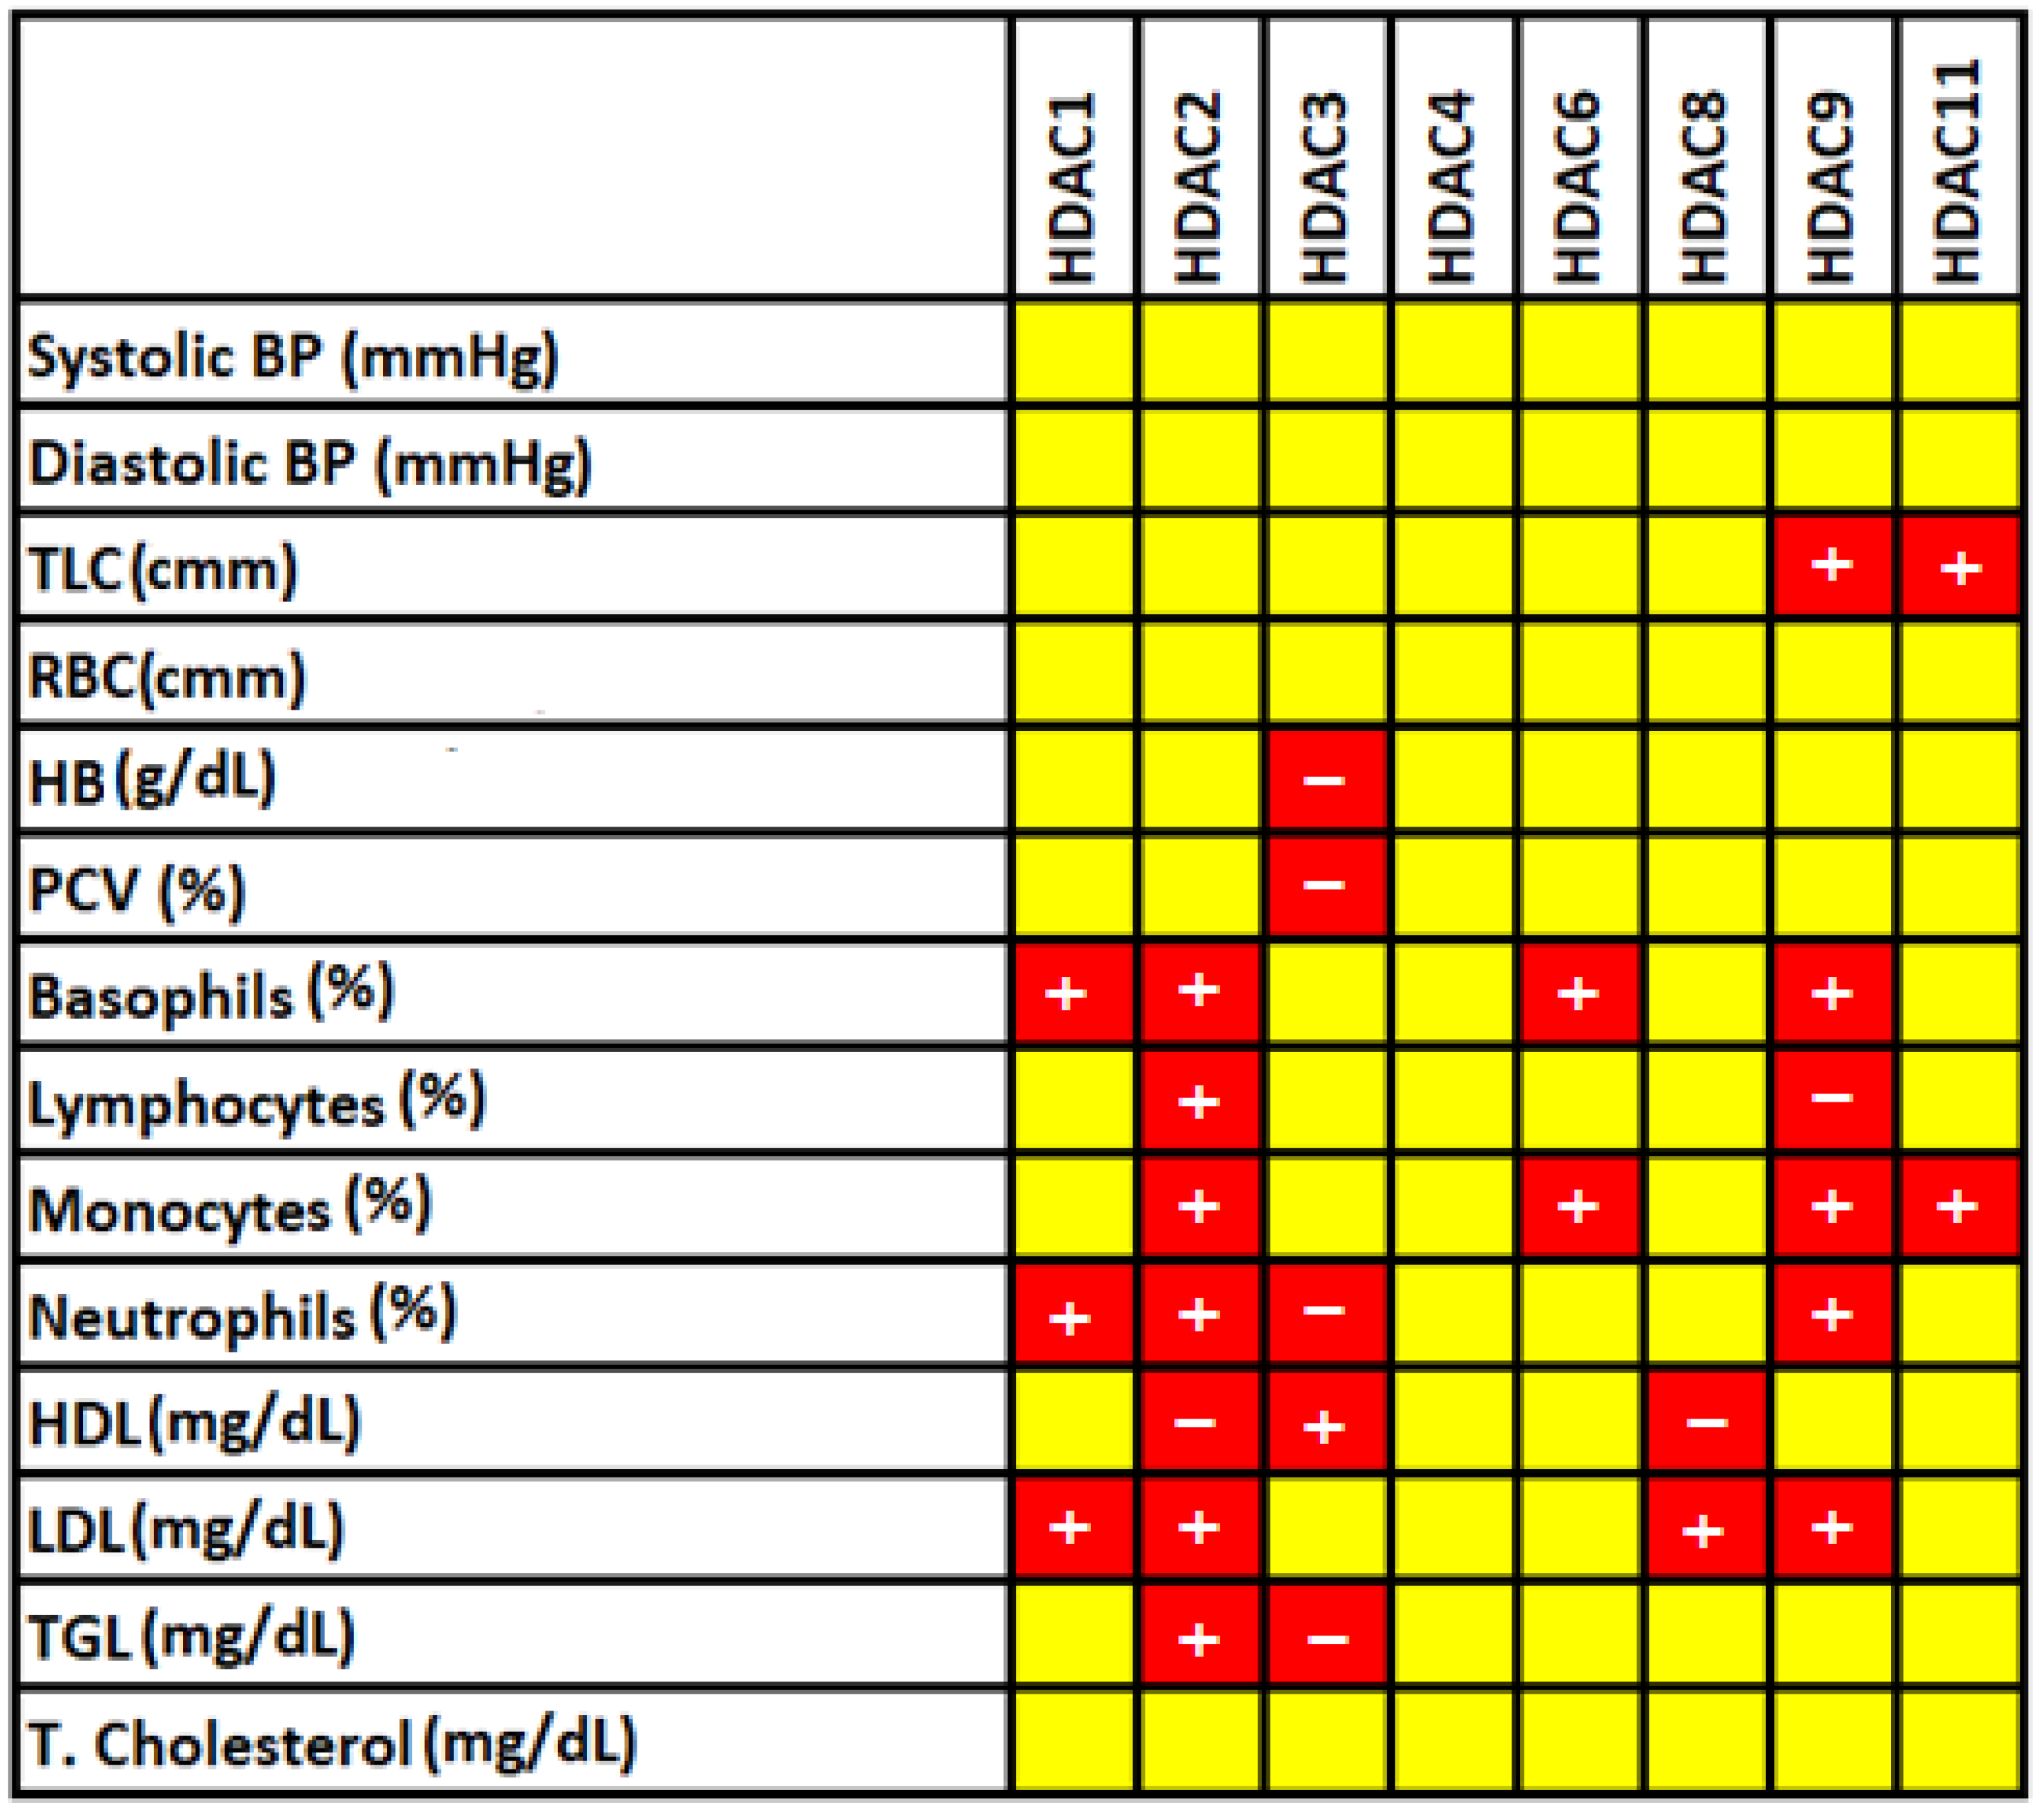
3.4. Correlation of Significantly Altered Hematological and Biochemical Features Characteristics with HDACs

The association between HDACs and anthropometric and biochemical characteristics was evaluated using Pearson correlation analyses. HDAC2 shows a positive correlation with basophils (r = 0.59, p = 0.026), lymphocytes (r = 0.782, p < 0.001), monocytes (r = 0.677, p = 0.008), neutrophils (r = 0.703, p = 0.005), LDL (r = 0.883, p = <0.001), TGL (r = 0.643, p = 0.003), and negatively correlated with HDL (r = −0.773, p = 0.001). Further, HDAC9 showed a positive correlation with TLC (r = 0.925, p < 0.001), basophils (r = 0.728, p = 0.017), monocytes (r = 0.778, p = 0.008), neutrophils (r = 0.753, p = 0.012), and LDL (r = 0.752, p = 0.012), and a negative association with lymphocyte (r = −0.685, p = 0.029). Likewise, Pearson correlation analysis revealed a significant relationship between HDAC1, HDAC3, HDAC6, HDAC8, and HDAC11, along with anthropometric and biochemical characteristics (Figure 1). In contrast, HDAC4 has no significant relationship with anthropometric or biochemical parameters.

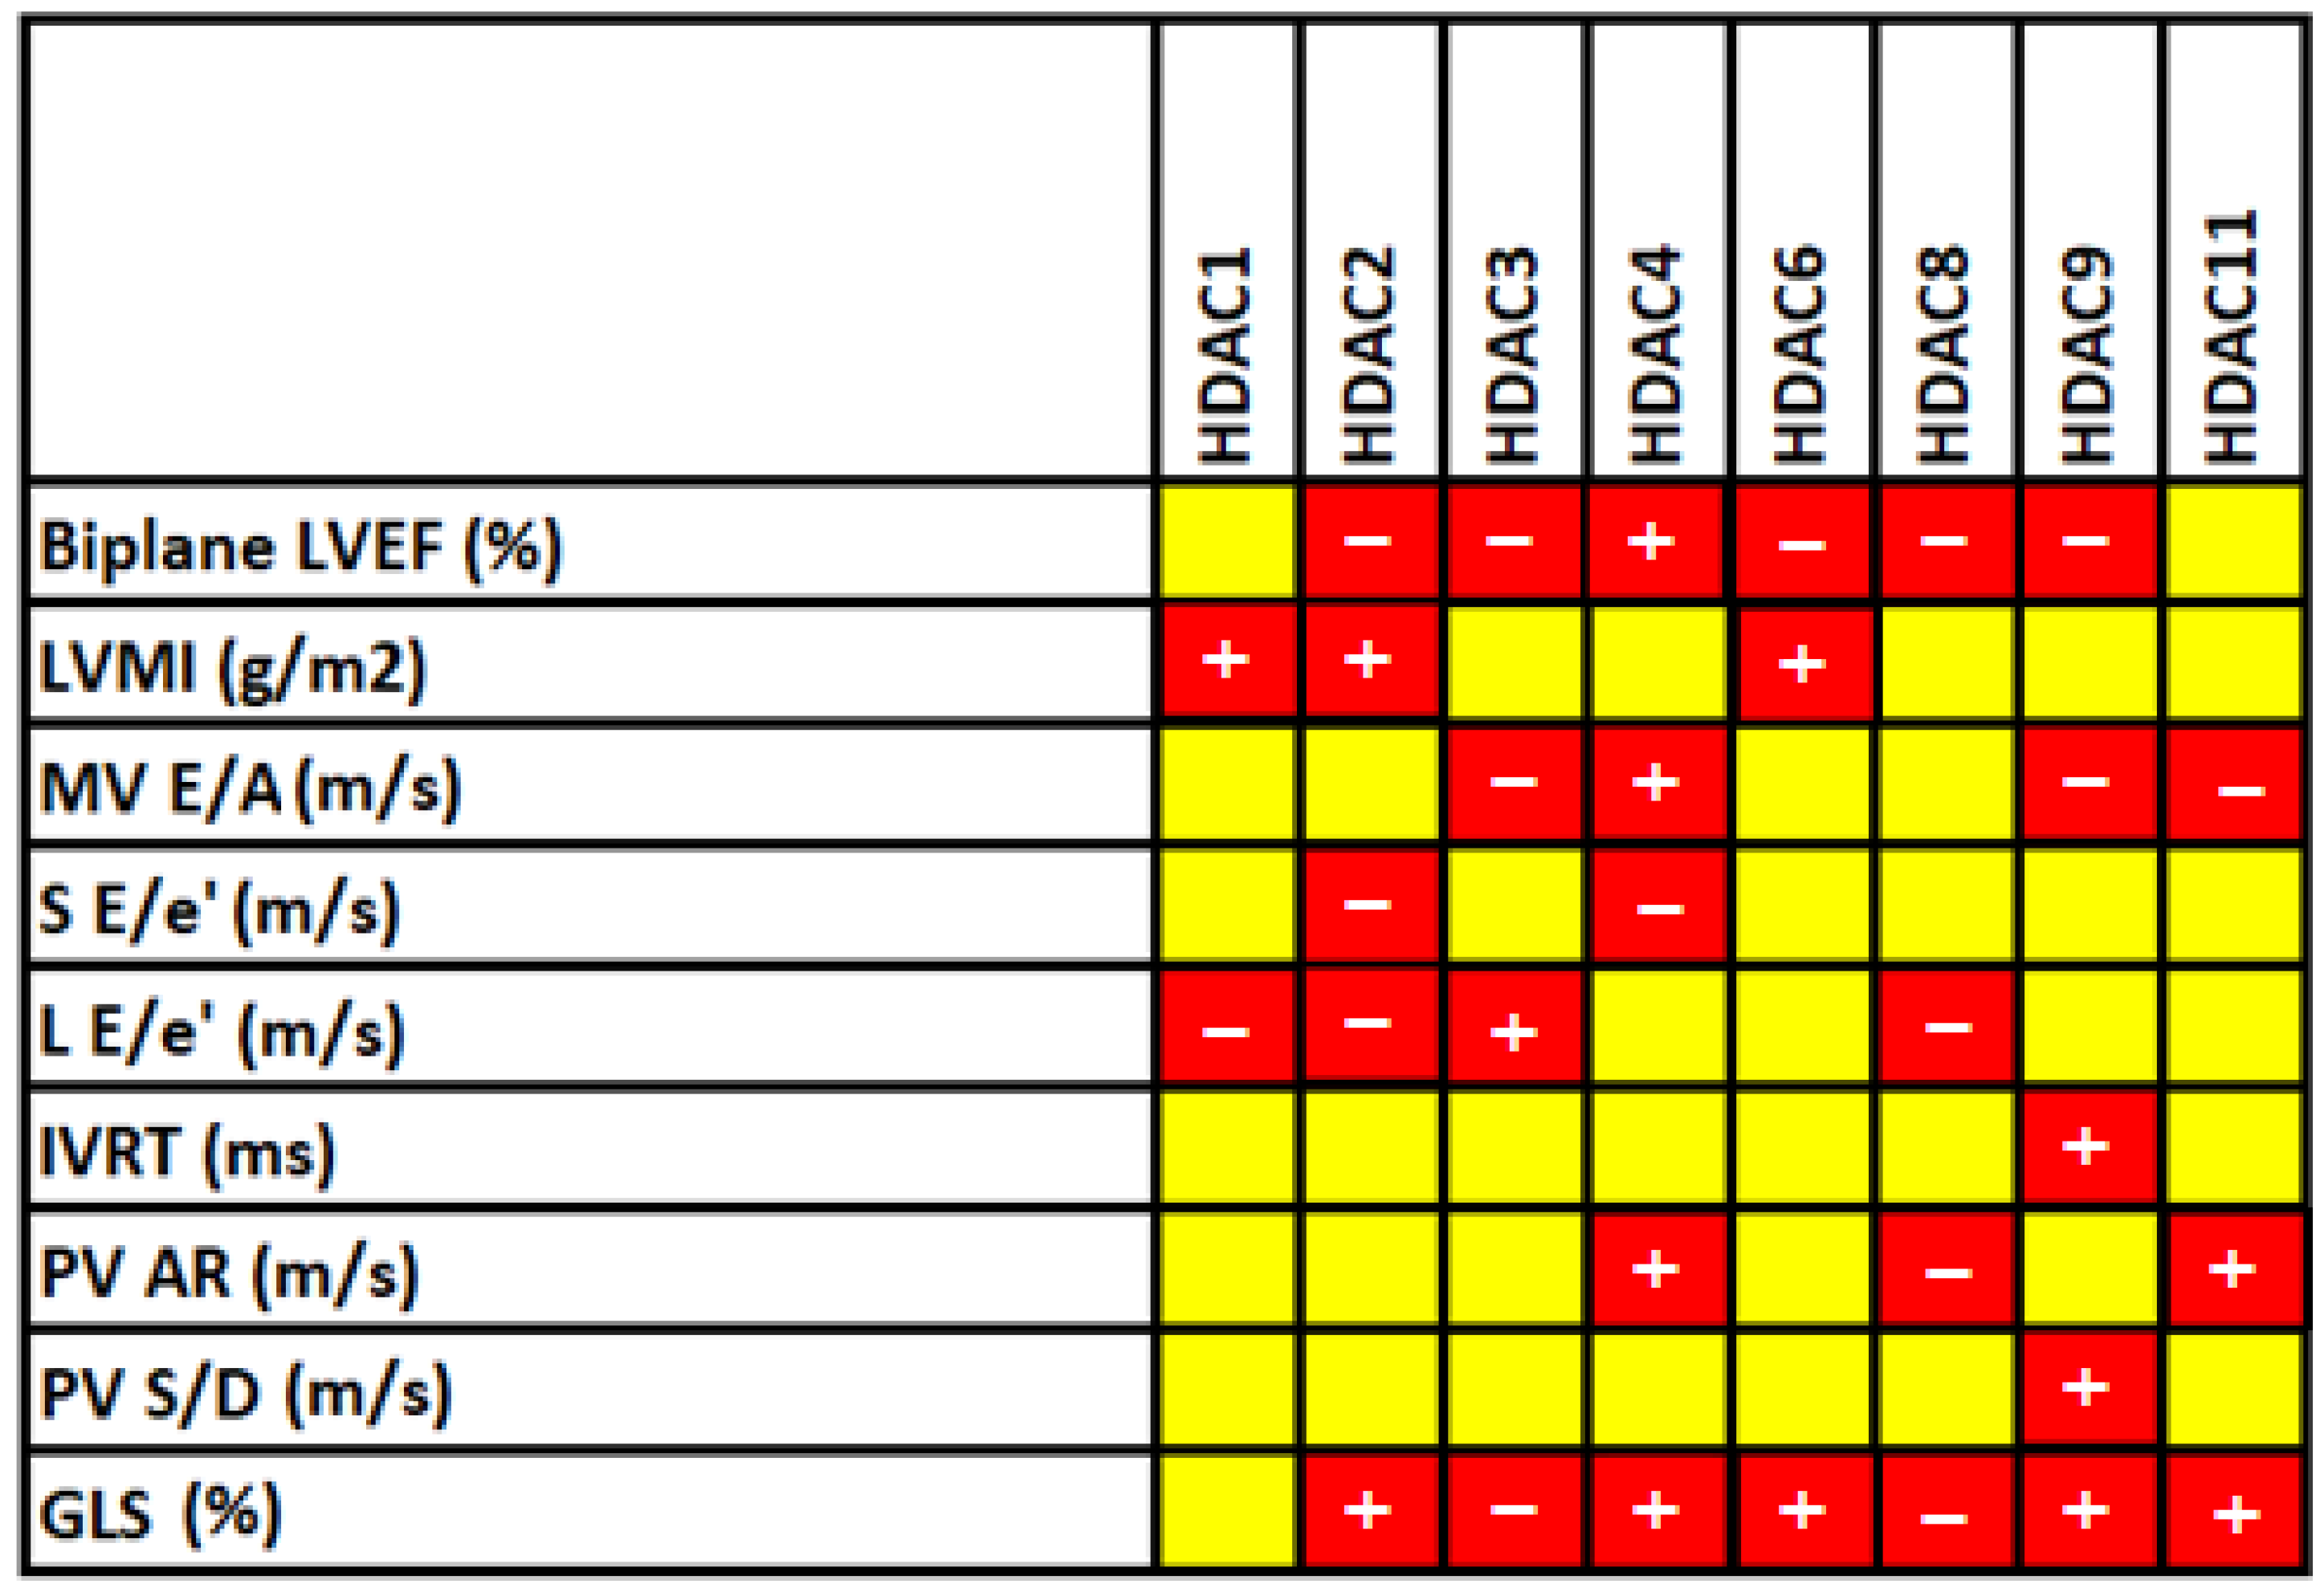
3.5. Correlation between HDAC Levels and 2D Echocardiographic Parameters

In correlation analysis of HDACs with echocardiographic indices, HDAC2 showed a positive correlation with LVMI (r = 0.634, p = 0.015) and GLS (r = 0.709, p = 0.004) and a negative association with biplane LVEF (r = −0.701, p = 0.005), S E/e’ (r = −0.811, p < 0.001), and L E/e’ (r = −0.773, p < 0.001). Similarly, HDAC9 expression confirmed the negative correlation with biplane LVEF (r = −0.8436, p = 0.003) and MV E/A (r = −0.837, p = 0.003) and the positive association of GLS (r = 0.793, p = 0.006), IVRT (r = 0.748, p = 0.013), and PV S/D (r = 0.697, p = 0.025). Likewise, a significant association was noticed for other HDACs with echocardiographic indices (Figure 2), presenting the involvement of HDACs with heart structure and functional indices.

3.6. Diagnostic Model with Crucial HADCs for CAD Classification

A logistic regression analysis was performed after the screening of HDACs based on the correlation significance with hematological, biochemical, and echocardiographic indices. The diagnostic model was created using the R-package version 3.2.0, incorporating the variables HDAC1, HDAC2, HDAC3, HDAC4, HDAC6, HDAC8, HDAC9, and HDAC11. The model utilizes a training set including 70% of the randomly selected 124 people and a test set consisting of the remaining 30%. The diagnostic regression equation was constructed as logit (P) = −16.937 + 0.763 × HDAC11 + 1.595 × HDAC9 + 0.298 × HDAC8 + 1.652 × HDAC4 − 0.676 × HDAC3. The diagnostic capabilities of this equation were evaluated using ROC analysis, as shown in the figures. The training set yielded an accuracy of 88.6% with a 0.94 area under the curve (AUC), a specificity of 86.4%, and a sensitivity of 90.9% (Figure 3A). Similarly, the test set demonstrated an accuracy of 83.3% with a 0.95 AUC, a specificity of 72.2%, and a sensitivity of 94.4% (Figure 3B). These results provide evidence that these HDACs possess strong predictive capabilities of CAD.

4. Discussion

The emphasis of our research has been to observe the types of epigenetic alterations in patients presenting with angina pectoris that are further grouped as angioproven CAD and healthy controls. The scientific application of this perception can immensely support the development of effective diagnostic biomarkers for CAD. Earlier clinical studies on animals and human atherosclerotic tissues have demonstrated the epigenetic modification that plays a predominant role in the regulatory network of inflammation, oxidative stress, and vascular smooth muscle cell proliferation, contributing to vascular diseases such as atherosclerosis and restenosis [12]. Evidence of HDAC modification in atherosclerosis has been well-established as a valid target for novel therapeutic approaches [13]. Yet, the increased understanding of HDAC regulatory activity in atherosclerosis as a diagnostic biomarker associated with echo imaging, biochemical, and hematological analysis is unseen. Hence, to our knowledge, the present study is the first report demonstrating HDAC profiling and altered gene expression in the PBMCs of patients with CAD and healthy controls. Our study demonstrated the significant variation in HDACs 111 activity between the angioproven CAD and control individuals. Regarding HDAC profiling, our t-test analysis identified certain HDACs as the exclusive significant factor. Further, using the Pearson correlation, the significant HDACs and biochemical, hematological, and echocardiographic parameters were analyzed and proven to be possible diagnostic markers for CAD.
Histone modification profiling in human PBMCs was performed between angioproven CAD and healthy participants to discover a novel selective diagnostic marker for CAD. Interestingly, by profiling HDACs 111, we observed changes in the HDAC gene expression and their statistical significance in the PBMCs between CAD and healthy participants. Several animal, cell, and human model studies have highlighted that class I HDAC is predominant in mediating proinflammatory molecules, inflammation, and endothelial dysfunction and regulating VSMC proliferation, thrombus formation, and atherosclerosis [14]. In our study, Class I HDACs (1-3, and 8) were solely significant and dysregulated in the study group. Studies by Manea et al. revealed that HDAC1 and 2 were upregulated in human atherosclerotic aorta/carotid arteries, and ApoE¯/¯ mice thereby witnessed the dominant role of HDAC1 and 2 in the development of atherosclerotic plaque [15]. Yao et al. have reported that the levels of class I HDAC3 were downregulated, which legalizes the cyclic strain and promotes the migration and proliferation of VSMCs in the development of atherosclerosis [16]. Another study by Kee et al. demonstrated that the inhibition of HDAC8 in a mouse model lowers blood pressure, reduces the aortic wall thickness, and increases vascular relaxation, resulting in the inhibition of inflammation that leads to atherosclerosis [17]. In our present study, we observed statistically significant upregulation of HDAC1, 2, and 8 and downregulation of HDAC3 in CAD participants.
Furthermore, Class II HDACs (4, 5, 6, 7, 9, and 10) were analyzed, resulting in upregulated expressions of histone acetylation, of which HDACs 4, 6, and 9 were statistically significant among the study participants. Numerous studies [18,19,20,21] have proved that HDAC4 promotes VSMC proliferation, migration, and atherosclerotic plaque formation. In addition, HDAC4 was involved in VSMC proliferation, which plays a crucial role in vascular calcification [22] and the inflammatory response [23]. Likewise, increasing evidence has supported our study results that HDAC6 plays a decisive role in endothelial dysfunction [24], oxidative stress [25], and inflammation [26] and has a protective role in promoting vascular homeostasis [27]. Among all the classical HDACs, HDAC9 is the most well-studied individual subtype for its association with atherosclerosis in animal and human models. It has been reported that an increase in HDAC9 gene expression in human internal carotid [28], plasma/coronary artery disease [29,30], the blood of patients with large atherosclerotic lesions [31], and plaque vulnerability [32] results in plaque formation and the development of atherosclerosis that further causes severe cardiac events. However, our study was in line with other studies in which the levels of HDAC were upregulated and highly significant among our CAD participants. Although the HDACs (5, 7, and 10) showed dysregulation in CAD, they were not statistically significant. Of note, HDAC11 is the only member of Class IV that has been least explored and analyzed in the development of atherosclerosis in humans and animals. Our study showed that Class IV (HDAC11) levels were significantly upregulated among CAD participants. In contrast to our investigation, Zhang and Ge et al. and Yanginler and Logie et al. [33,34] demonstrated that HDAC11 potentially treats atherosclerosis. Hence, these findings determine the dysfunction of HDAC11 in the pathogenesis of atherosclerosis and CAD, which must be further studied in detail.
In addition to HDAC gene expression profiling, we have also analyzed the association of significantly altered HDACs (1–4, 6, 8, 9, and 11) with the hematological and biochemical parameters that play a vital role in the cascade of events that leads to atherosclerosis. Despite all these studies, the association between HDAC levels and hematological/biochemical parameters related to CAD has not been explored. In our present investigation, our data showed that dysregulated levels of HDACs such as HDAC2 (basophils, lymphocytes, monocytes, neutrophils, HDL, and LDL), HDAC3 (HB, PCV, neutrophils, HDL, and LDL), HDAC9 (TLC, basophils, lymphocytes, monocytes, neutrophils, HDL, and LDL), HDAC1 (basophils and neutrophils), HDAC6 (SBP, DBP, basophils, monocytes, and T. cholesterol), HDAC8 (HDL and LDL), and less known HDAC11 was correlated with the hematological/biochemical parameters (TLC and monocytes) of CAD patients. Studies such as Dorneles et al. and Chi et al. provided good evidence for our data by demonstrating an imbalance of HDAC2 expression levels in obese patients [35] and the role of HDAC6 in cardiac dysfunction regulated by angiotensin II [36]. Hence, the present experimental association of dysregulated HDACs with the hematological and lipid profiles of CAD indicates the crucial pathological role of HDACs in atherosclerosis [37], which can potentially serve as a diagnostic biomarker for CAD with clinical benefits.
To address whether dysregulated HDAC gene expression distresses the left ventricular mass diastolic and systolic function, we validated the statistically significant profiled HDACs with 2D transthoracic echocardiographic imaging. Left ventricular mass index is recognized as one marker of cardiovascular risk in patients without CAD. Abdi-Ali et al. [38] and Kee et al. [39] ruled out the significant association of LVMI with cardiac hypertrophy and future cascades of cardiac events. Our data found a similar association between dysregulated HDACs 1, 2, and 6 and LVMI in the CAD group, demonstrating the regulatory mechanism of HDAC activity in LV mass hypertrophy. Further, the assessment of LV function showed a significant association of dysregulated HDACs 1–4, 6, 8, 9, and 11 with systolic and diastolic function. Several studies in CAD patients have elucidated that subclinical LV systolic and LV diastolic impairments are independent markers for predicting CAD. Our data results were in line with a few studies performed on both animal and human models by Kimbrough et al., Chen et al., and Jeong et al. [40,41,42] that illustrate that dysregulated HDACs promote endothelial dysfunction and contribute to the pathological process that leads to CAD and mediated cardiac events. Altogether with prior research, alterations in HDAC mRNA expression are detected in numerous CAD-associated cells, including endothelial cells, smooth muscle cells, and cardiomyocytes. Comparable patterns of gene expression were identified in peripheral blood mononuclear cells (PBMCs) that correlate with cardiac function in CAD. Considering the CAD association of these HDACs, we constructed a diagnostic model with significant HDACs that showed accuracy greater than 83% in both training and testing sets, which showed that our model had a strong clinical application value. To our knowledge, no existing study has developed a diagnostic model utilizing HDAC gene expression. Therefore, this diagnostic model holds significant novelty and potential for application in laboratory settings. Overall, this study has demonstrated that the process of histone deacetylation has the potential to function as a diagnostic biomarker for coronary artery disease.

5. Conclusions

In conclusion, our study evaluated the gene expression levels of various classes of HDACs in the human peripheral mononuclear cells in patients with CAD and compared them with the healthy control group. It was observed that significant alterations in HDACs 1-4, 6, 8, 9, and 11 were associated with the critical hematological, biochemical, and cardiac indicators of CAD. Further utilizing the HDACs, the diagnostic model was generated, which showed significant accuracy in classifying CAD from healthy normal.

Author Contributions

Design, supervision, and interpretation—S.S.S.J.A. and P.P.; investigation, formal analysis, and data curation—K.M.; formal analysis—S.M.; resource, software, formal analysis, and data curation—M.C., S.F.A. and T.B.E. All authors have read and agreed to the published version of the manuscript.

Funding

This research was funded by King Saud University, Riyadh, Saudi Arabia, Project Number (RSPD2023R709).

Institutional Review Board Statement

The Institutional Review Board of the Chettinad Hospital and Research Institute, Chettinad Academy of Research and Education, Kelambakkam, Tamil Nadu, India approved the study (IHEC/10-17/Proposal No. 372). The Declaration of Helsinki carried out experiments involving humans.

Informed Consent Statement

Written informed consent has been obtained from the patient(s) to publish this paper.

Data Availability Statement

Data are available on request.

Acknowledgments

All authors thank their institutes for the infrastructure support for this study. The authors acknowledge and extend their appreciation to the Researchers Supporting Project Number (RSPD2023R709), King Saud University, Riyadh, Saudi Arabia, for funding this study.

Conflicts of Interest

The authors declare no conflict of interest.

References

  1. Roth, G.A.; Johnson, C.; Abajobir, A.; Abd-Allah, F.; Abera, S.F.; Abyu, G.; Ahmed, M.; Aksut, B.; Alam, T.; Alam, K.; et al. Global, regional, and national burden of cardiovascular diseases for 10 causes. J. Am. Coll. Cardiol. 2017, 70, 1–25. [Google Scholar] [CrossRef] [PubMed]
  2. Sumi, M.P.; Mahajan, B.; Sattar, R.S.; Nimisha Apurva Kumar, A.; Sharma, A.K.; Ahmad, E.; Ali, A.; Saluja, S.S. Elucidation of Epigenetic Landscape in Coronary Artery Disease: A Review on Basic Concept to Personalized Medicine. Epigenetics Insights 2021, 14, 2516865720988567. [Google Scholar] [CrossRef] [PubMed]
  3. Qin, C.; Murali, S.; Lee, E.; Supramaniam, V.; Hausenloy, D.J.; Obungoloch, J.; Brecher, J.; Lin, R.; Ding, H.; Akudjedu, T.N.; et al. Sustainable low-field cardiovascular magnetic resonance in changing healthcare systems. Eur. Heart J. Cardiovasc. Imaging 2022, 23, e246–e260. [Google Scholar] [CrossRef] [PubMed]
  4. Monisha, K.G.; Prabu, P.; Chokkalingam, M.; Murugesan, R.; Milenkovic, D.; Ahmed, S.S.S.J. Clinical utility of brain-derived neurotrophic factor as a biomarker with left ventricular echocardiographic indices for potential diagnosis of coronary artery disease. Sci. Rep. 2020, 10, 16359. [Google Scholar] [CrossRef] [PubMed]
  5. Scirica, B.M. Acute coronary syndrome: Emerging tools for diagnosis and risk assessment. J. Am. Coll. Cardiol. 2010, 55, 1403–1415. [Google Scholar] [CrossRef] [PubMed]
  6. Zarzour, A.; Kim, H.W.; Weintraub, N.L. Epigenetic regulation of vascular diseases. Arterioscler. Thromb. Vasc. Biol. 2019, 39, 984–990. [Google Scholar] [CrossRef] [PubMed]
  7. Handy, D.E.; Castro, R.; Loscalzo, J. Epigenetic modifications: Basic mechanisms and role in cardiovascular disease. Circulation 2011, 123, 2145–2156. [Google Scholar] [CrossRef]
  8. Zhao, T.C.; Wang, Z.; Zhao, T.Y. The important role of histone deacetylases in modulating vascular physiology and arteriosclerosis. Atherosclerosis 2020, 303, 36–42. [Google Scholar] [CrossRef]
  9. Wang, Z.Y.; Qin, W.; Yi, F. Targeting histone deacetylases: Perspectives for epigenetic-based therapy in cardio-cerebrovascular disease. J. Geriatr. Cardiol. JGC 2015, 12, 153. [Google Scholar]
  10. Lang, R.M.; Badano, L.P.; Mor-Avi, V.; Afilalo, J.; Armstrong, A.; Ernande, L.; Flachskampf, F.A.; Foster, E.; Goldstein, S.A.; Kuznetsova, T.; et al. Recommendations for cardiac chamber quantification by echocardiography in adults: An update from the American Society of Echocardiography and the European Association of Cardiovascular Imaging. J. Am. Soc. Echocardiogr. 2015, 28, 1440–1457. [Google Scholar] [CrossRef]
  11. Nagueh, S.F.; Smiseth, O.A.; Appleton, C.P.; Byrd, B.F.; Dokainish, H.; Edvardsen, T. Recommendations for the evaluation of left ventricular diastolic function by echocardiography: An update from the American Society of Echocardiography and the European Association of Cardiovascular Imaging. J. Am. Soc. Echocardiogr. 2016, 29, 277–314. [Google Scholar] [CrossRef] [PubMed]
  12. Wierda, R.J.; Geutskens, S.B.; Jukema, J.W.; Quax, P.H.; van den Elsen, P.J. Epigenetics in atherosclerosis and inflammation. J. Cell. Mol. Med. 2010, 14, 1225–1240. [Google Scholar] [CrossRef] [PubMed]
  13. Neele, A.E.; Willemsen, L.; Chen, H.J.; Dzobo, K.E.; de Winther, M.P. Targeting epigenetics as atherosclerosis treatment: An updated view. Curr. Opin. Lipidol. 2020, 31, 324. [Google Scholar] [CrossRef] [PubMed]
  14. Marchio, P.; Guerra-Ojeda, S.; Vila, J.M.; Aldasoro, M.; Victor, V.M.; Mauricio, M.D. Targeting early atherosclerosis: A focus on oxidative stress and inflammation. Oxidative Med. Cell. Longev. 2019, 2019, 8563845. [Google Scholar] [CrossRef]
  15. Manea, S.A.; Vlad, M.L.; Fenyo, I.M.; Lazar, A.G.; Raicu, M.; Muresian, H.; Simionescu, M.; Manea, A. Pharmacological inhibition of histone deacetylase reduces NADPH oxidase expression, oxidative stress and the progression of atherosclerotic lesions in hypercholesterolemic apolipoprotein E-deficient mice; potential implications for human atherosclerosis. Redox Biol. 2020, 28, 101338. [Google Scholar] [CrossRef] [PubMed]
  16. Yao, Q.P.; Zhang, P.; Qi, Y.X.; Chen, S.G.; Shen, B.R.; Han, Y.; Yan, Z.Q.; Jiang, Z.L. The role of SIRT6 in the differentiation of vascular smooth muscle cells in response to cyclic strain. Int. J. Biochem. Cell Biol. 2014, 49, 98–104. [Google Scholar] [CrossRef] [PubMed]
  17. Kee, H.J.; Ryu, Y.; Seok, Y.M.; Choi, S.Y.; Sun, S.; Kim, G.R.; Jeong, M.H. Selective inhibition of histone deacetylase 8 improves vascular hypertrophy, relaxation, and inflammation in angiotensin II hypertensive mice. Clin. Hypertens. 2019, 25, 13. [Google Scholar] [CrossRef]
  18. Usui, T.; Morita, T.; Okada, M.; Yamawaki, H. Histone deacetylase 4 controls neointimal hyperplasia via stimulating proliferation and migration of vascular smooth muscle cells. Hypertension 2014, 63, 397–403. [Google Scholar] [CrossRef]
  19. Li, Y.; Li, L.; Qian, Z.; Lin, B.; Chen, J.; Luo, Y.; Qu, J.; Raj, J.U.; Gou, D. Phosphatidylinositol 3-Kinase-DNA Methyltransferase 1-miR-1281-Histone Deacetylase 4 Regulatory Axis Mediates Platelet-Derived Growth Factor-Induced Proliferation and Migration of Pulmonary Artery Smooth Muscle Cells. J. Am. Heart Assoc. 2018, 7, e007572. [Google Scholar] [CrossRef]
  20. Zhang, B.; Dong, Y.; Liu, M.; Yang, L.; Zhao, Z. miR-149-5p inhibits vascular smooth muscle cells proliferation, invasion, and migration by targeting histone deacetylase 4 (HDAC4). Med. Sci. Monit. Int. Med. J. Exp. Clin. Res. 2019, 25, 7581. [Google Scholar] [CrossRef]
  21. Zheng, X.; Wu, Z.; Xu, K.; Qiu, Y.; Su, X.; Zhang, Z.; Zhou, M. Interfering histone deacetylase 4 inhibits the proliferation of vascular smooth muscle cells via regulating MEG3/miR-125a-5p/IRF1. Cell Adhes. Migr. 2019, 13, 41–49. [Google Scholar] [CrossRef] [PubMed]
  22. Abend, A.; Shkedi, O.; Fertouk, M.; Caspi, L.H.; Kehat, I. Salt-inducible kinase induces cytoplasmic histone deacetylase 4 to promote vascular calcification. EMBO Rep. 2017, 18, 1166–1185. [Google Scholar] [CrossRef] [PubMed]
  23. Lee, C.W.; Lin, C.C.; Luo, S.F.; Lee, H.C.; Lee, I.T.; Aird, W.C.; Yang, C.M. Tumor necrosis factor-α enhances neutrophil adhesiveness: Induction of vascular cell adhesion molecule-1 via activation of Akt and CaM kinase II and modifications of histone acetyltransferase and histone deacetylase 4 in human tracheal smooth muscle cells. Mol. Pharmacol. 2008, 73, 1454–1464. [Google Scholar] [CrossRef] [PubMed]
  24. Leucker, T.M.; Nomura, Y.; Kim, J.H.; Bhatta, A.; Wang, V.; Wecker, A.; Jandu, S.; Santhanam, L.; Berkowitz, D.; Romer, L.; et al. Cystathionine γ-lyase protects vascular endothelium: A role for inhibition of histone deacetylase 6. Am. J. Physiol. Heart Circ. Physiol. 2017, 312, H711–H720. [Google Scholar] [CrossRef] [PubMed]
  25. Abouhish, H.; Thounaojam, M.C.; Jadeja, R.N.; Gutsaeva, D.R.; Powell, F.L.; Khriza, M.; Martin, P.M.; Bartoli, M. Inhibition of HDAC6 attenuates diabetes-induced retinal redox imbalance and microangiopathy. Antioxidants 2020, 9, 599. [Google Scholar] [CrossRef] [PubMed]
  26. Karki, P.; Ke, Y.; Tian, Y.; Ohmura, T.; Sitikov, A.; Sarich, N.; Montgomery, C.P.; Birukova, A.A. Staphylococcus aureus–induced endothelial permeability and inflammation are mediated by microtubule destabilization. J. Biol. Chem. 2019, 294, 3369–3384. [Google Scholar] [CrossRef] [PubMed]
  27. Chen, J.; Zhang, J.; Shaik, N.F.; Yi, B.; Wei, X.; Yang, X.F.; Naik, U.P.; Summer, R.; Yan, G.; Xu, X.; et al. The histone deacetylase inhibitor tubacin mitigates endothelial dysfunction by up-regulating the expression of endothelial nitric oxide synthase. J. Biol. Chem. 2019, 294, 19565–19576. [Google Scholar] [CrossRef] [PubMed]
  28. Grbić, E.; Gorkič, N.; Pleskovič, A.; Zorc, M.; Ljuca, F.; Gasparini, M.; Mrđa, B.; Cilenšek, I.; MankočSanach, M.; Petrovič, D. Association between rs2107595 HDAC9 gene polymorphism and advanced carotid atherosclerosis in the Slovenian cohort. Lipids Health Dis. 2020, 19, 71. [Google Scholar] [CrossRef]
  29. Wang, X.B.; Han, Y.D.; Sabina, S.; Cui, N.H.; Zhang, S.; Liu, Z.J.; Li, C.; Zheng, F. HDAC9 variant Rs2107595 modifies susceptibility to coronary artery disease and the severity of coronary atherosclerosis in a Chinese Han population. PLoS ONE 2016, 11, e0160449. [Google Scholar] [CrossRef]
  30. Prestel, M.; Prell-Schicker, C.; Webb, T.; Malik, R.; Lindner, B.; Ziesch, N.; Rex-Haffner, M.; Röh, S.; Viturawong, T.; Lehm, M.; et al. The atherosclerosis risk variant rs2107595 mediates allele-specific transcriptional regulation of HDAC9 via E2F3 and Rb1. Stroke 2019, 50, 2651–2660. [Google Scholar] [CrossRef]
  31. Shroff, N.; Ander, B.P.; Zhan, X.; Stamova, B.; Liu, D.; Hull, H.; Hamade, F.R.; Dykstra-Aiello, C.; Ng, K.; Sharp, F.R.; et al. HDAC9 polymorphism alters blood gene expression in patients with large vessel atherosclerotic stroke. Transl. Stroke Res. 2019, 10, 19–25. [Google Scholar] [CrossRef]
  32. Asare, Y.; Campbell-James, T.A.; Bokov, Y.; Yu, L.L.; Prestel, M.; El Bounkari, O.; Roth, S.; Megens, R.T.; Straub, T.; Thomas, K.; et al. Histone deacetylase 9 activates IKK to regulate atherosclerotic plaque vulnerability. Circ. Res. 2020, 127, 811–823. [Google Scholar] [CrossRef]
  33. Zhang, R.; Ge, J. Proteinase-Activated Receptor-2 Modulates Ve-Cadherin Expression to Affect Human Vascular Endothelial Barrier Function. J. Cell. Biochem. 2017, 118, 4587–4593. [Google Scholar] [CrossRef] [PubMed]
  34. Yanginlar, C.; Logie, C. HDAC11 is a regulator of diverse immune functions. Biochim. Biophys. Acta (BBA) Gene Regul. Mech. 2018, 1861, 54–59. [Google Scholar] [CrossRef] [PubMed]
  35. Dorneles, G.P.; Boeira, M.C.R.; Schipper, L.L.; Silva, I.R.; Elsner, V.R.; Dal Lago, P.; Romão, P.R. Acute strenuous exercise induces an imbalance on histone H4 acetylation/histone deacetylase 2 and increases the proinflammatory profile of PBMC of obese individuals. Oxidative Med. Cell. Longev. 2017, 2017, 1530230. [Google Scholar] [CrossRef] [PubMed]
  36. Chi, Z.; Le, T.P.; Lee, S.K.; Guo, E.; Kim, D.; Lee, S.; Seo, S.Y.; Lee, S.Y.; Kim, J.H.; Lee, S.Y. Honokiol ameliorates angiotensin II-induced hypertension and endothelial dysfunction by inhibiting HDAC6-mediated cystathionine γ-lyase degradation. J. Cell. Mol. Med. 2020, 24, 10663–10676. [Google Scholar] [CrossRef] [PubMed]
  37. Liu, Y.; Zhu, Y.; Jia, W.; Sun, D.; Zhao, L.; Zhang, C.; Wang, C.; Lyu, Q.; Chen, Y.; Chen, G.; et al. Association of the Total White Blood Cell, Neutrophils, and Monocytes Count with the Presence, Severity, and Types of Carotid Atherosclerotic Plaque. Front. Med. 2020, 7, 313. [Google Scholar] [CrossRef]
  38. Abdi-Ali, A.; Miller, R.J.; Southern, D.; Zhang, M.; Mikami, Y.; Knudtson, M.; Heydari, B.; Howarth, A.G.; Lydell, C.P.; James, M.T.; et al. LV mass independently predicts mortality and need for future revascularization in patients undergoing diagnostic coronary angiography. JACC Cardiovasc. Imaging 2018, 11, 423–433. [Google Scholar] [CrossRef]
  39. Kee, H.J.; Bae, E.H.; Park, S.; Lee, K.E.; Suh, S.H.; Kim, S.W.; Jeong, M.H. HDAC inhibition suppresses cardiac hypertrophy and fibrosis in DOCA-salt hypertensive rats via regulation of HDAC6/HDAC8 enzyme activity. Kidney Blood Press. Res. 2013, 37, 229–239. [Google Scholar] [CrossRef]
  40. Kimbrough, D.; Wang, S.H.; Wright, L.H.; Mani, S.K.; Kasiganesan, H.; LaRue, A.C.; Cheng, Q.; Nadig, S.N.; Atkinson, C.; Menick, D.R. HDAC inhibition helps post-MI healing by modulating macrophage polarization. J. Mol. Cell. Cardiol. 2018, 119, 51–63. [Google Scholar] [CrossRef]
  41. Chen, Y.; Du, J.; Zhao, Y.T.; Zhang, L.; Lv, G.; Zhuang, S.; Qin, G.; Zhao, T.C. Histone deacetylase (HDAC) inhibition improves myocardial function and prevents cardiac remodeling in diabetic mice. Cardiovasc. Diabetol. 2015, 14, 99. [Google Scholar] [CrossRef]
  42. Jeong, M.Y.; Lin, Y.H.; Wennersten, S.A.; Demos-Davies, K.M.; Cavasin, M.A.; Mahaffey, J.H.; Monzani, V.; Saripalli, C.; Mascagni, P.; Reece, T.B.; et al. Histone deacetylase activity governs diastolic dysfunction through a nongenomic mechanism. Sci. Transl. Med. 2018, 10, eaao0144. [Google Scholar] [CrossRef]
Figure 1. Correlation analysis of significantly altered hematological and biochemical features with HDACs (1–4, 6, 8, 9, and 11) in CAD participants. The yellow color represents an insignificant association between the analyzed features, and the red color indicates a significant association. Of those, the mathematical sign + and − represent positive and negative correlation, respectively.
Biomedicines 11 02952 g001
Figure 2. Correlation analysis of significantly altered echocardiographic indices with HDACs (1–4, 6, 8, 9, and 11) in CAD participants. The yellow color represents an insignificant association between the analyzed features, and the red color indicates a significant association. Of those, the mathematical sign + and − represent positive and negative correlation, respectively.
Biomedicines 11 02952 g002
Figure 3. Area under the ROC curve graphs for the CAD diagnostic model’s training (A) and test (B) sets based on HDAC gene expression levels. The color code (blue and red) represent the area under the curve (AUC).
Biomedicines 11 02952 g003
Table 1. List of primers used in our study.
S.NoGeneFORWARD 5′<-----Sequence----->3′REVERSE 5′<-----Sequence----->3′
1HDAC1GAGATGACCAAGTACCACAGCTGACAGAACTCAAACAGGCC
2HDAC2TGACAAACCAGAACACTCCAGTGACAAACCAGAACACTCCAG
3HDAC3GGACTTCTACCAACCCACGCAGCACGAGTAGAGGGATATTG
4HDAC4ACAAGGAGAAGGGCAAAGAGGCGTTTTCCCGTACCAGTAG
5HDAC5TCACCGCAAAACTCCTACAGAGTTCCCGTTGTCATAGCG
6HDAC6TTCAACTCTGTGGCTGTGGGGGACACATATAGCACACTGG
7HDAC7GCAGATCATTCAACAGCCATGTTGGTAGAAGGTTTGCTGGG
8HDAC8AATTAACTGGTCTGGAGGGTGTGCAGATCCAAATCCACGTAG
9HDAC9ACACATTACCAGGAGCACAAGCAACATTTCCATCCTTCCGC
10HDAC10GTCCTTTACTTCTCCTGGCACGTAGTCAGCGTTTCCCATCC
11HDAC11GTTTCTGTTTGAGCGTGTGGGGTAGATGTGGCGGTTGTAG
12GAPDHTGTCATCAACGGAAAGGCGCATCAGCAGAAGGAGCA
Table 2. Characteristics of the study population in anthropometric, hematological, and biochemical features.
ParametersControl (Mean ± Standard Deviation)CAD (Mean ± Standard Deviation)p-Value
Age (years)44.90 ± 8.9648.23 ± 9.340.096
Gender (male/female)38/2433/290.360
BMI (kg/m2)23.76 ± 2.9825.02 ± 1.190.081
Systolic BP (mmHg)103.44 ± 18.43118.65 ± 18.64<0.001
Diastolic BP (mmHg)69.62 ± 8.8778.60 ± 14.02<0.001
FBS (mg/dL)99 ± 16.59107.55 ± 12.18<0.071
PPBS (mg/dL)109.62 ± 38.86105.34 ± 26.84<0.065
TLC (cmm)7034.88 ± 1700.969783.72 ± 4165.04<0.001
RBC (cmm)5.14 ± 0.654.62 ± 0.58<0.001
HB (g/dL)14.57 ± 1.6213.18 ± 1.60<0.001
PCV (%)44.48 ± 4.9640.05 ± 4.87<0.001
MCV (fl)87.23 ± 7.8686.57 ± 7.110.686
MCH (pg)28.66 ± 2.8628.69 ± 2.840.955
MCHC (g/dL)32.82 ± 0.6833.12 ± 0.950.096
RDW (%)14.25 ± 1.5014.41 ± 1.540.631
Platelet (cmm)2.83 ± 0.682.81 ± 0.730.926
Basophil (%)0.57 ± 0.440.83 ± 0.490.015
Eosinophil (%)3.66 ± 3.243.9 ± 3.620.750
Lymphocyte (%)29.69 ± 8.7936.03 ± 12.230.007
Monocyte (%)4.18 ± 1.807.12 ± 2.86<0.001
Neutrophil (%)54.83 ± 8.7766.46 ± 12.76<0.001
HDL (mg/dL)38.11 ± 7.0028.81 ± 7.50<0.001
LDL (mg/dL)115.86 ± 27.92165.83 ± 46.59<0.001
TGL (mg/dL)118.90 ± 65.48189.90 ± 43.70<0.001
Total Cholesterol (mg/dL)182.302 ± 33.94211.93 ± 52.790.003
HbA1c (%)5.05 ± 0.435.35 ± 0.160.831
p < 0.05, statistical p-value < 0.05 considered as significant.
Table 3. HDAC gene expression of study participants.
HDACsControl (Mean ± Standard Deviation)CAD (Mean ± Standard Deviation)p-Value
HDAC12.33 ± 1.212.91 ± 1.480.030
HDAC24.35 ± 1.695.51 ± 1.520.014
HDAC33.82 ± 0.73 2.28 ± 0.590.044
HDAC43.43 ± 0.984.52 ± 1.010.032
HDAC51.91 ± 0.373.48 ± 1.750.202
HDAC62.26 ± 0.702.52 ± 0.710.042
HDAC70.95 ± 0.171.58 ± 0.920.130
HDAC83.80 ± 2.365.21 ± 3.020.004
HDAC93.54 ± 1.996.25 ± 1.16<0.001
HDAC100.84 ± 0.521.34 ± 0.550.184
HDAC113.36 ± 0.214.93 ± 2.19<0.001
p-value < 0.05 considered as significant.
Table 4. Characteristics of the study population in echocardiographic parameters.
Echo ParametersControl (Mean ± Standard Deviation)CAD (Mean ± Standard Deviation)p-Value
Biplane LVEF (%)58.66 ± 1.7748.51 ± 5.62<0.001
LVMI (g/m2)69.95 ± 25.9183.97 ± 18.740.004
MV E/A (m/s)1.13 ± 0.300.59 ± 0.56<0.001
S E/e′ (m/s)8.69 ± 0.977.08 ± 1.48<0.001
L E/e′ (m/s)10.20 ± 0.987.99 ± 1.05<0.001
IVRT (ms)69.54 ± 11.6299.46 ± 16.33<0.001
PV AR (m/s)33.37 ± 7.8828.14 ± 5.79<0.001
PV S/D (m/s)0.59 ± 0.190.96 ± 0.33<0.001
GLS (%)−15.91 ±0.20−14.58 ±1.01<0.001
p-value < 0.05 considered as significant.
Disclaimer/Publisher’s Note: The statements, opinions and data contained in all publications are solely those of the individual author(s) and contributor(s) and not of MDPI and/or the editor(s). MDPI and/or the editor(s) disclaim responsibility for any injury to people or property resulting from any ideas, methods, instructions or products referred to in the content.

