Article

Paneth Cells Regulate Lymphangiogenesis under Control of Microbial Signals during Experimental Portal Hypertension

by
Mohsin Hassan
1,2,†,
Oriol Juanola
3,4,†,
Irene Keller
5,
Paolo Nanni
6,
Witold Wolski
6,
Sebastián Martínez-López
7,8,
Esther Caparrós
7,8,
Rubén Francés
7,8,9,10 and
Sheida Moghadamrad
2,3,4,11,*
1
Department of Hepatology & Gastroenterology, Charité Universitätsmedizin Berlin, 13353 Berlin, Germany
2
Department for Biomedical Research (DBMR), University of Bern, 3008 Bern, Switzerland
3
Laboratories for Translational Research, Department of Gastroenterology and Hepatology, Ente Ospedaliero Cantonale, 6500 Bellinzona, Switzerland
4
Faculty of Biomedical Sciences, Università della Svizzera Italiana, 6900 Lugano, Switzerland
5
Interfaculty Bioinformatics Unit, Swiss Institute of Bioinformatics, University of Bern, 3008 Bern, Switzerland
6
Functional Genomics Center Zurich, University/ETH Zurich, 8057 Zurich, Switzerland
7
Hepatic and Intestinal Immunobiology Group, Departamento Medicina Clínica, Universidad Miguel Hernández, 03550 Alicante, Spain
8
Instituto de Investigación Sanitaria ISABIAL, Hospital General Universitario, 03010 Alicante, Spain
9
Instituto de Investigación, Desarrollo e Innovación en Biotecnología Sanitaria de Elche (IDiBE), Universidad Miguel Hernández, 03207 Elche, Spain
10
CIBERehd, Instituto Salud Carlos III, 28029 Madrid, Spain
11
University Clinic of Visceral Surgery and Medicine, Inselspital, 3008 Bern, Switzerland
*
Author to whom correspondence should be addressed.
These authors contributed equally to this work.
Biomedicines 2022, 10(7), 1503; https://doi.org/10.3390/biomedicines10071503
Submission received: 12 April 2022 / Revised: 15 June 2022 / Accepted: 22 June 2022 / Published: 25 June 2022
(This article belongs to the Special Issue Lymphatic Function and Dysfunction: From Physiopathology to Therapy)

Abstract

:
Intestinal microbiota can modulate portal hypertension through the regulation of the intestinal vasculature. We have recently demonstrated that bacterial antigens activate Paneth cells (PCs) to secrete products that regulate angiogenesis and portal hypertension. In the present work we hypothesized that Paneth cells regulate the development of lymphatic vessels under the control of intestinal microbiota during experimental portal hypertension. We used a mouse model of inducible PCs depletion (Math1Lox/LoxVilCreERT2) and performed partial portal vein ligation (PPVL) to induce portal hypertension. After 14 days, we performed mRNA sequencing and evaluated the expression of specific lymphangiogenic genes in small intestinal tissue. Intestinal and mesenteric lymphatic vessels proliferation was assessed by immunohistochemistry. Intestinal organoids with or without PCs were exposed to pathogen-associated molecular patterns, and conditioned media (CM) was used to stimulate human lymphatic endothelial cells (LECs). The lymphangiogenic activity of stimulated LECs was assessed by tube formation and wound healing assays. Secretome analysis of CM was performed using label-free proteomics quantification methods. Intestinal immune cell infiltration was evaluated by immunohistochemistry. We observed that the intestinal gene expression pattern was altered by the absence of PCs only in portal hypertensive mice. We found a decreased expression of specific lymphangiogenic genes in the absence of PCs during portal hypertension, resulting in a reduced proliferation of intestinal and mesenteric lymphatic vessels as compared to controls. In vitro analyses demonstrated that lymphatic tube formation and endothelial wound healing responses were reduced significantly in LECs treated with CM from organoids without PCs. Secretome analyses of CM revealed that PCs secrete proteins that are involved in lipid metabolism, cell growth and proliferation. Additionally, intestinal macrophages infiltrated the ileal mucosa and submucosa of mice with and without Paneth cells in response to portal hypertension. Our results suggest that intestinal microbiota signals stimulate Paneth cells to secrete factors that modulate the intestinal and mesenteric lymphatic vessels network during experimental portal hypertension.

1. Introduction

The lymphatic system consists of lymph, lymphatic vessels and lymphoid organs that act as a parallel circulatory network to the blood vasculature [1]. Lymphatic capillaries are formed by a monolayer of lymphatic endothelial cells (LECs) connected by discontinuous button-like junctions facilitating the entrance of interstitial fluids, immune cells and macromolecules [2]. The biological functions of lymphatic vessels are the maintenance of tissue fluid homeostasis, tissue immunosurveillance, dietary fat absorption and transport in the digestive system [3]. The formation and maintenance of lymphatic vessels depend on several molecular factors such as cell surface lymphatic vessel endothelial hyaluronan receptor 1 (LYVE1), the transcription factor prospero-related homeobox 1 (PROX1), vascular endothelial growth factor C (VEGFC) and its tyrosine kinase receptor 3 (VEGFR3), among others [4].
An impairment in the lymphatic flow or structural changes of the lymphatic system may lead to severe clinical manifestations and has been reported in various pathological conditions such as inflammatory bowel disease, cancer, and chronic liver disease [5,6,7]. Advanced chronic liver disease (CLD) is associated with an increased density of lymphatic vessels and/or an increase in lymph flow because of portal hypertension [8,9,10]. Lymphatic imbalance characterized by insufficient splanchnic and peripheral lymph drainage has been described during CLD and proposed as a plausible origin of ascites formation [11,12]. In addition to the increased abundance of lymphatic vessels as a physiological compensation, the change in size of these vessels has been found in patients or animal models as a result of an increase in lymph production during advanced CLD [13,14]. While structural and functional changes in the lymphatic system have been studied in models of chronic liver disease, knowledge about the lymphatic network within the intestinal or mesenteric circulation and its function in the development of portal hypertension is limited [15].
We demonstrated in the past that intestinal microbiota contribute to the development of portal hypertension through regulation of intestinal blood and lymphatic vessels [16]. We observed that Paneth cells were also affected not only by the presence of intestinal microbiota, but also after experimental portal hypertension, suggesting a link between portal hypertension, intestinal vascularization and PCs [16]. PCs are members of intestinal innate immunity that control the quantity and diversity of intestinal microbiota [17], while hampering pathogen invasion [18] by releasing antimicrobial peptides, such as α-defensin, lysozyme, regenerating islet derived protein 3 (REG3A) and angiogenin 4. Recently, we have demonstrated that pathogen-associated molecular patterns (PAMPs) stimulate PCs to secrete pro-angiogenic factors which promote intestinal and mesenteric vascularization, thus contributing to increased experimental portal hypertension [19]. These results support previous studies describing the role of intestinal microbiota and PCs in modulation of intestinal angiogenesis [20,21]. Since the blood and lymphatic vessels are complementary circulatory systems, further studies aimed at better understanding the potential role of PCs in the regulation of lymphatic system are of the utmost interest. Therefore, we were interested in a more in-depth investigation to better understand the relationship between Paneth cells and their possible role in the regulation of lymphatic vessels.
Based on previous results and current knowledge about the role of intestinal microbiota and PCs in the development of intestinal vascularization, in the present study, we speculated that factors released by PCs may contribute to the regulation of intestinal and mesenteric lymphatic vasculature during experimental portal hypertension.

2. Material and Methods

2.1. Animals

Nine-week-old male Math1Lox/LoxVilCreERT2 (hereafter designated as Math1Δintestine or Math1Δint) mice with a mixed C57BL/6 and SV129 background were used for the study. Math1lox/loxVilCreERT2 and control (cre negative) littermates were housed under specific pathogen-free (SPF) conditions in a ventilated cage system with a 12 h light/dark cycle in the central animal facility of the University of Berne. The depletion of PCs was achieved by activation of Cre recombinase after injection of 1 mg/mice/day tamoxifen (Tm, Sigma T5648) for three consecutive days in Math1Δintestine and control littermate mice [22]. Partial portal vein ligation (PPVL) was carried out 5 days after the last tamoxifen injection under sterile conditions to induce pre-hepatic portal hypertension, or sham-operated as described in the past [19]. Animals were euthanized and tissues were harvested 14 days after PPVL for further experiments. All animal experiments were performed according to the international regulations concerning conduct of animal experimentation. Experimental protocols were approved by research animal ethics committee of the canton of Bern (authorization number BE 94/16).

2.2. Genotyping of Mice

Ear biopsies from Math1Δintestine and control mice were obtained and processed for the isolation of DNA using a DNA isolation kit (Macherey-Nagel GmbH, Düren, Germany). Following the manufacturer’s instructions, pure DNA was eluted and 10 µL of DNA (10 ng/µL) was used to detect Cre recombinase and Math-1. The primers used for genotyping are provided in Supplementary Table S1.

2.3. RNA Isolation

Total RNA was purified from 50 mg distal intestine (ileum) of all experimental groups using the RNeasy Plus Mini Kit (Qiagen, Hilden, Germany). Following manufacturer’s instructions, the RNA extracts were eluted in 30 μL of RNase and DNase free water. The total yield of RNA was quantified using a nanodrop spectrophotometer (Thermofisher, Waltham, MA, USA).

2.4. mRNA-Sequencing in Small Intestinal Tissue

Transcriptomic analysis (n = 4/group) was performed as previously described [19]. Briefly, the quality of RNA was evaluated using the Qubit RNA BR Assay kit (ThermoFisher, Q10211) and an advanced analytical fragment analyzer RNA kit (Agilent, Santa Clara, CA, USA, DNF-47). RNA libraries were prepared using an Illumina Truseq Stranded mRNA Library Prep kit (Illumina, Santa Clara, CA, USA, 20020595), following the manufacturer’s instructions, and libraries were sequenced paired-end (2 × 50 bp) using an Illumina NovaSeq 6000 sequencer. The next generation sequencing (NGS) reads were mapped to the reference genome of mouse (GRCm38.94) using HiSat2 v. 2.1.0, and the number of overlapping reads for each gene was counted with Feature Counts v. 1.6.0 [23,24]. Differential expression analysis was performed using DESeq2 v.1.24.0 in R v. 3.6.1 [25]. The Benjamini and Hochberg procedure [26] was used to calculate adjusted p values (p-adj), and genes with a p-adj < 0.05 were considered significant. Heatmaps were generated with gplots v. 3.0.4 in R v.3.6.1. The weight01 algorithm in topGO v. 2.38.1 was used for Gene Ontology enrichment analysis. Major terms with at least 2 genes were selected based on the p-values from a Fisher’s exact test.

2.5. RT2 Profiler qPCR Array and Gene Expression Quantification by Real-Time PCR

Reverse transcription was performed with M-MLV Reverse transcriptase (Invitrogen) and a random hexamer mix (PROMEGA, USA) for cDNA synthesis. RT2 SYBR Green qPCR master mix (Qiagen) was mixed with cDNA synthesis reaction as per defined protocol, and loaded using a multichannel pipette onto a customized qPCR plate. The plate was sealed with thin-walled caps provided with the kit. Before performing the qPCR reaction in a 7900 HT real time cycler (Thermofisher), the plate was briefly centrifuged for 1 min to ensure all the contents were settled at the bottom of the wells. The qPCR results were obtained using Mouse Angiogenesis RT2 Profiler PCR Array (96 well format; Qiagen). Then, 1 μL of cDNA was used for real-time PCR using PROX1, forkhead box C2 (FOXC2), VEGFR2 and VEGFR3 specific primers and probes (Supplementary Table S2), and TaqMan™ Fast Universal PCR Master Mix (ThermoFisher). Using the ΔΔCT method, CT values for each gene were subtracted from the endogenous control gene GAPDH, and then normalised to experimental control sham mice. All experiments were performed in triplicate (n = 5 each group).

2.6. Immunohistochemistry

Swiss rolls (≈ 5 cm) of tissue sections from distal (ileum) and proximal (duodenum) intestine were prepared and fixed in 10% buffered formalin solution for 24 h, as previously described (n = 5/group) [27]. After embedding in paraffin, 5-micron thick sections were prepared and mounted on a glass slide. The slides were heated at 45 °C for 15–20 min, incubated in xylol for 10 min to deparaffinize the tissue sections, and then rehydrated in graded ethanol. Slides were incubated for 10 min with 0.4% hydrogen peroxide (H2O2) and antigen retrieval was performed in sodium citrate buffer (pH 6) for 15 min. The tissue sections were blocked with TBS/1% BSA/0,1% Tween-20 for 1 h at room temperature to prevent non-specific binding. The sections were subsequently incubated overnight at 4 °C with anti-CD3 (1:250, Cell Signaling Technology, #78588), anti-F4/80 (1:200, Cell Signaling Technology, #70076), anti-LYVE1 (1:30, R&D, #BAF2125) and anti-lysozyme (1:500, Thermofisher, #PA5-16668) primary antibodies, followed by an incubation for 1 h at room temperature with biotinylated secondary goat anti-rabbit (1:400, Dako/Agilent, Santa Clara, CA, USA #E0433) or (1/200, Vector, #BA-1000). The sections were either treated with streptavidin, horseradish peroxidase or ABC solution, (Vector laboratories, Newark, CA, USA) for 30 min. Then, a mixed solution of 3,3-diaminobenzidine-tetrahydrochloride (DAB) substrate or AEC solution (Vector laboratories, Newark, CA, USA) was applied for color development of the reaction product, followed by hematoxylin counterstaining. A panoramic digital whole slide scanner (3D HISTECH Ltd., Budapest, Hungary) was used to scan the slides stained by immunohistochemistry. Ten different fields per slide were blindly photographed using CaseViewer 2.2 software (3D HISTECH Ltd., Budapest, Hungary). MetaMorph imaging software (NX software 64 bite, version 7.8.12.0) was used to quantify positive stained areas. The data is expressed as the total number of positive pixels divided by the total number of pixels (% area).

2.7. Isolation of Crypts

Small intestinal crypts were isolated from Math1Δintestine and control animals, as described previously [28]. Briefly, the proximal part (duodenum) of the intestine of mice from each group was cut into two equal halves and washed twice in cold PBS + antibiotics (Penicillin, Streptomycin and Gentamycin). The tissue pieces were incubated with 15 mM ethylene diamine tetra acetic acid (EDTA) in PBS for 30 min on ice with discontinuous shaking. Afterwards, the tissue pieces were incubated with PBS + antibiotics and vortexed until supernatants were enriched with intestinal crypts. Each fraction obtained after vortexing was observed under the microscope. Crypt enriched fractions were filtered using 70 μm BD cell strainers and centrifuged at 300× g for 5 min at 4 °C. Pellets enriched in crypts were washed twice in 2 mL DMEM-F12 media (Dulbecco’s Modified Eagle Medium/Nutrient Mixture F-12), and then resuspended in Matrigel.

2.8. Development and Passaging of Intestinal Organoids

As described previously [28,29], around 1000 intestinal crypts resuspended in Matrigel were plated and incubated at 37 °C for 5 min to polymerize the Matrigel. Then, complete media (DMEM-F12) containing specific intestinal organoid growth factors R-Spondin 1 (500 ng/mL), EGF (50 ng/mL), Noggin (100 ng/mL), and Wnt3a (100 ng/mL), (Peprotech) supplemented with N2 and B27 (Invitrogen), were added, respectively. Fresh media was supplied every three days until day 9, until complete organoids were developed. Passaging of small intestinal organoids was performed by disrupting the 3D integrity of organoids in Matrigel at day 9 by adding 1 mL of pre-chilled DMEM-F12 + 1% HEPES to each well. Afterwards, the suspension was briefly triturated with a 1 mL pipette, and then collected in 15 mL falcon tubes and centrifuged at 1700× g for 5 min at 4 °C. The Matrigel and media in supernatant was carefully aspirated, and the pellet containing organoids was incubated with 0.48 mM EDTA in 1 PBS for 10 min with intermittent shaking to dissociate organoids into individual crypts. After 10 min, 2 mL of DMEM 10% FBS was added. The suspension was again centrifuged at 1700× g for 5 min at 4 °C. Afterwards, the supernatant was aspirated, the crypts were counted and resuspended in Matrigel, and then plated again at a 1:4 split ratio till desired experimental purpose was achieved.

2.9. Stimulation of Intestinal Organoids with PAMPs

After 9 days of culture, organoids were stimulated with PAMPs stimuli including lipopolysaccharide (LPS) (1 μg/mL; Sigma-Aldrich, St. Louis, MO, USA; from E. coli 026:B7), muramyl dipeptide (MDP) (100 μg/mL; InvivoGen), peptidoglycan (PGN) (10 μg/mL; InvivoGen, San Diego, CA, USA; from S. aureus) and CpG oligodeoxynucleotides (CpG ODN) 1668 (1 μg/mL; Enzo) for 24 h at 37 °C. After stimulation, organoids were washed twice with PBS and incubated with fresh media again for 48 h at 37 °C. Unstimulated organoids served as controls. The supernatants or conditioned media (CM) were collected after 24 h and stored at −80 °C for further analyses.

2.10. Whole Mount Lysozyme Immunofluorescence of Organoids and Imaging

Each 50 μL of Matrigel containing intestinal crypts isolated from Math1Δintestine and control mice were plated in pre-warm chamber slides (SPL life sciences) and cultured under the culture conditions mentioned above. After 9 days of culture, the organoids were washed with warm PBS and fixed with 2% paraformaldehyde for 20 min. Subsequently, the organoids were washed with 1× PBS/glycine solution and permeabilized with 0.5% triton × 100 in PBS for 10 min on a shaker. The plates were blocked using 10% goat serum in wash buffer for 2 h. Primary antibody anti-lysozyme at 1:400 (Novus Biologicals, Littleton, CO, USA, #NBP2-33518) was applied for 4 h. Organoids were then incubated for 1 h at room temperature with the corresponding secondary antibody 1:500 (goat anti rabbit Alexa fluor 488, Invitrogen). The slides were then incubated with 4′,6′-diamidino-2-phenylindole (DAPI, 1:10,000) in 1× PBS and phalloidin at 1:500 for 10 min. Histokitt mounting medium (Carl Roth) was used to mount the slides. The imaging was performed to report presence or absence of PCs using a Leica DMI4000 B fluorescence system.

2.11. Lymphatic Endothelial Cell Tube Formation Assay

The capacity of dermal lymphatic microvascular endothelial cells (LECs) (Cat. No. XSEL6C1, Lonza, Basel, Switzerland) to form lymphatic tubes in vitro was assessed as previously described [19]. Briefly, LECs at passage 7 (20 × 103/well) were starved for serum and growth factors overnight and seeded in 96-well plates coated with Matrigel using fresh endothelial cell growth basal medium-2 (Lonza). Cells were then washed with PBS and incubated with previously collected CM at 37 °C, 5% CO2. Micrographs were taken after 24 h using a digital camera integrated in an inverted light microscope (ZEISS Axio Vert.A1). All experiments were performed in triplicate. Auto contrast adjustment using PhotoScape X software (MOOII Tech, Seoul, Korea) was used to increase the contrast of all panels. The number of branched points where lymphatic vessels bifurcate per field area was counted manually to assess the formation of new tubes, as represented in Supplementary Figure S1.

2.12. Wound Healing Assay

LECs migration was evaluated in vitro as described before [19]. LECs at passage 7 (50 × 103/well) were cultured in a 24-well plate until the cells were confluent, and then starved for serum and growth factors overnight. A scratch was made on the confluent cell monolayer using the narrow part of a 200 µL tip. Cells were then carefully washed with PBS and treated with organoid-derived CM at 37 °C, 5% CO2. Micrographs were taken at time 0 (T = 0) and after 12 h (T = 12) of incubation using a ZEISS Axio Vert.A1 microscope. All experiments were performed in triplicate. Auto contrast adjustment using PhotoScape X software was used to increase the contrast of all panels. The width of the scratch was measured using ImageJ software (Wayne Rasband, NIH, Bethesda, Maryland, USA) at T = 0 and T = 12 from 3 independent experiments. Wound recovery distance (µm) was calculated as the difference between the gaps at T = 0 and at T = 12.

2.13. Proteomic Analysis of Conditioned Media

Secretome analysis was performed as previously described [19]. Briefly, supernatants collected from LPS and MDP-treated Math1Δintestine and control intestinal organoids were used for label-free proteomics quantification analysis using liquid chromatography–mass spectrometry (LC-MS) (n = 4/group). Proteins were identified and quantified using MaxQuant (version 1.6.2.3). Functions implemented in the R package SRMService [30] were run to compute t-tests among experimental groups (Math1Δintestine vs. control) [31]. Detected proteins on each 2-group analysis were normalized by computing the z-score of log2 values. Proteins with at least 2 peptides and quantified with a false discovery rate < 1% were considered for further analysis. Proteins were ranked by log2 fold change, and gene set enrichment analysis (GSEA) was carried out using the gene ontology for biological processes functional database with the web-based gene set analysis toolkit (WebGestalt) [32]. Detailed proteomics analysis methods can be found in the Supplementary Methods.

2.14. Statistical Analysis

Statistical analyses were performed using GraphPad Prism software 5 (Software Inc., La Jolla, CA, USA). Data are reported as mean ± SD. Differences were considered significant at <0.05. Comparisons between two groups were performed using the Mann–Whitney U test, and more than two groups by Kruskal–Wallis one-way ANOVA.

3. Results

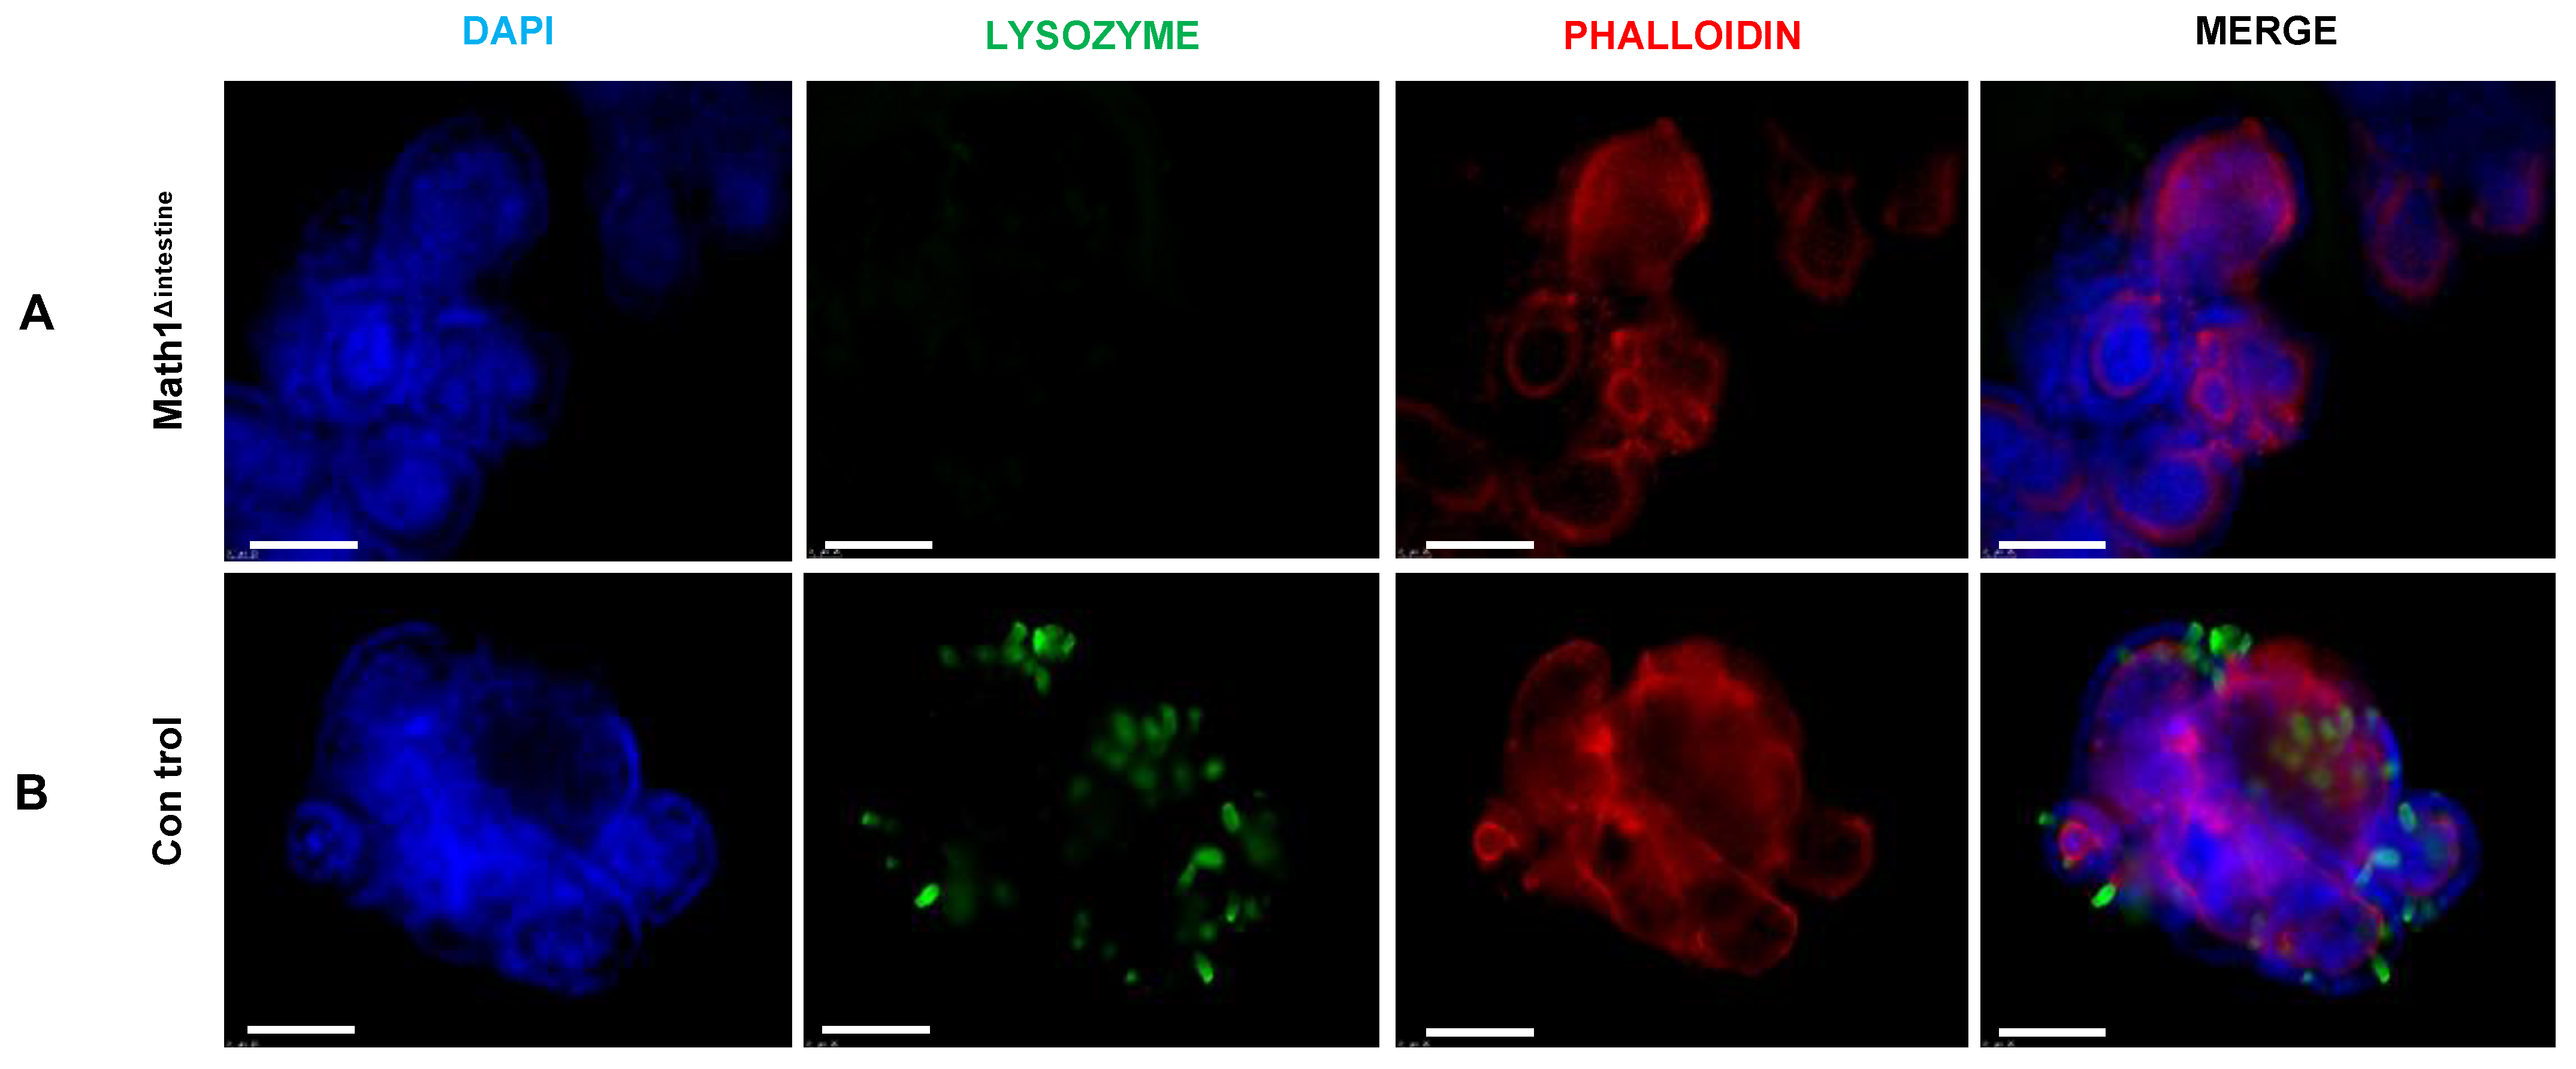
3.1. Paneth Cells Are Depleted in the Intestine of Math1Lox/LoxVilcreERT2 Mice after Tamoxifen Injection

PCs secrete several antimicrobial peptides including lysozyme. Therefore, sections of the small intestine were stained with a lysozyme antibody by IHC to detect the presence or absence of PCs in our model (Figure 1). We observed that tamoxifen treatment induced a complete depletion of PCs in the small intestines of Math1Δintestine animals (Figure 1A), whereas they remained in the base of intestinal crypts in control mice (Figure 1B).

3.2. Small Intestinal Gene Expression Is Altered in the Absence of Paneth Cells after Experimental Portal Hypertension

To study the effects of PCs depletion on gene expression signatures in the small intestinal tissue during experimental portal hypertension, we evaluated the gene expression profile in all experimental groups by mRNA sequencing (n = 4/group). We compared RNA-seq expression profiles between sham operated groups (control vs. Math1Δint) and after PPVL (control vs. Math1Δint). Detected genes were ranked based on ascending p-adj value; the top 20 are shown in Figure 2. We did not observe any distinct gene expression patterns in the small intestinal tissues of sham-operated animals regardless of the presence or absence of PCs (Figure 2A). We only found one differentially expressed gene associated with immune response (Immunoglobulin heavy variable V1-5, Ighv1-5) in sham-operated mice with PCs, as compared to the same conditions without PCs (p-adj < 0.05; Table 1). In contrast, animals with experimental portal hypertension showed differences in the gene expression pattern when comparing Paneth cell-deficient and control mice (Figure 2B), with 63 differentially expressed genes (p-adj < 0.05; Table 2).
Gene set enrichment analysis was performed for each comparison. While no significant GO terms were found among sham-operated conditions, several biological processes were enriched for genes differentially expressed between portal hypertensive mice with or without PCs (Table 3). Most of the biological processes affected by the absence of PCs during experimental portal hypertension were associated with immune-related responses, as expected. However, additional pathways relevant in lymphatic vessel functions including lipid metabolism (GO:0046321) and cell proliferation (GO:0042127) were also affected. Since previous data demonstrated that PCs are involved in the development of the intestinal vasculature [19,21], and biological functions associated to intestinal lymphatics vessels are affected in the mRNA sequencing analysis, we decided to further characterize whether PCs influence the intestinal lymphatic vasculature in the context of portal hypertension.

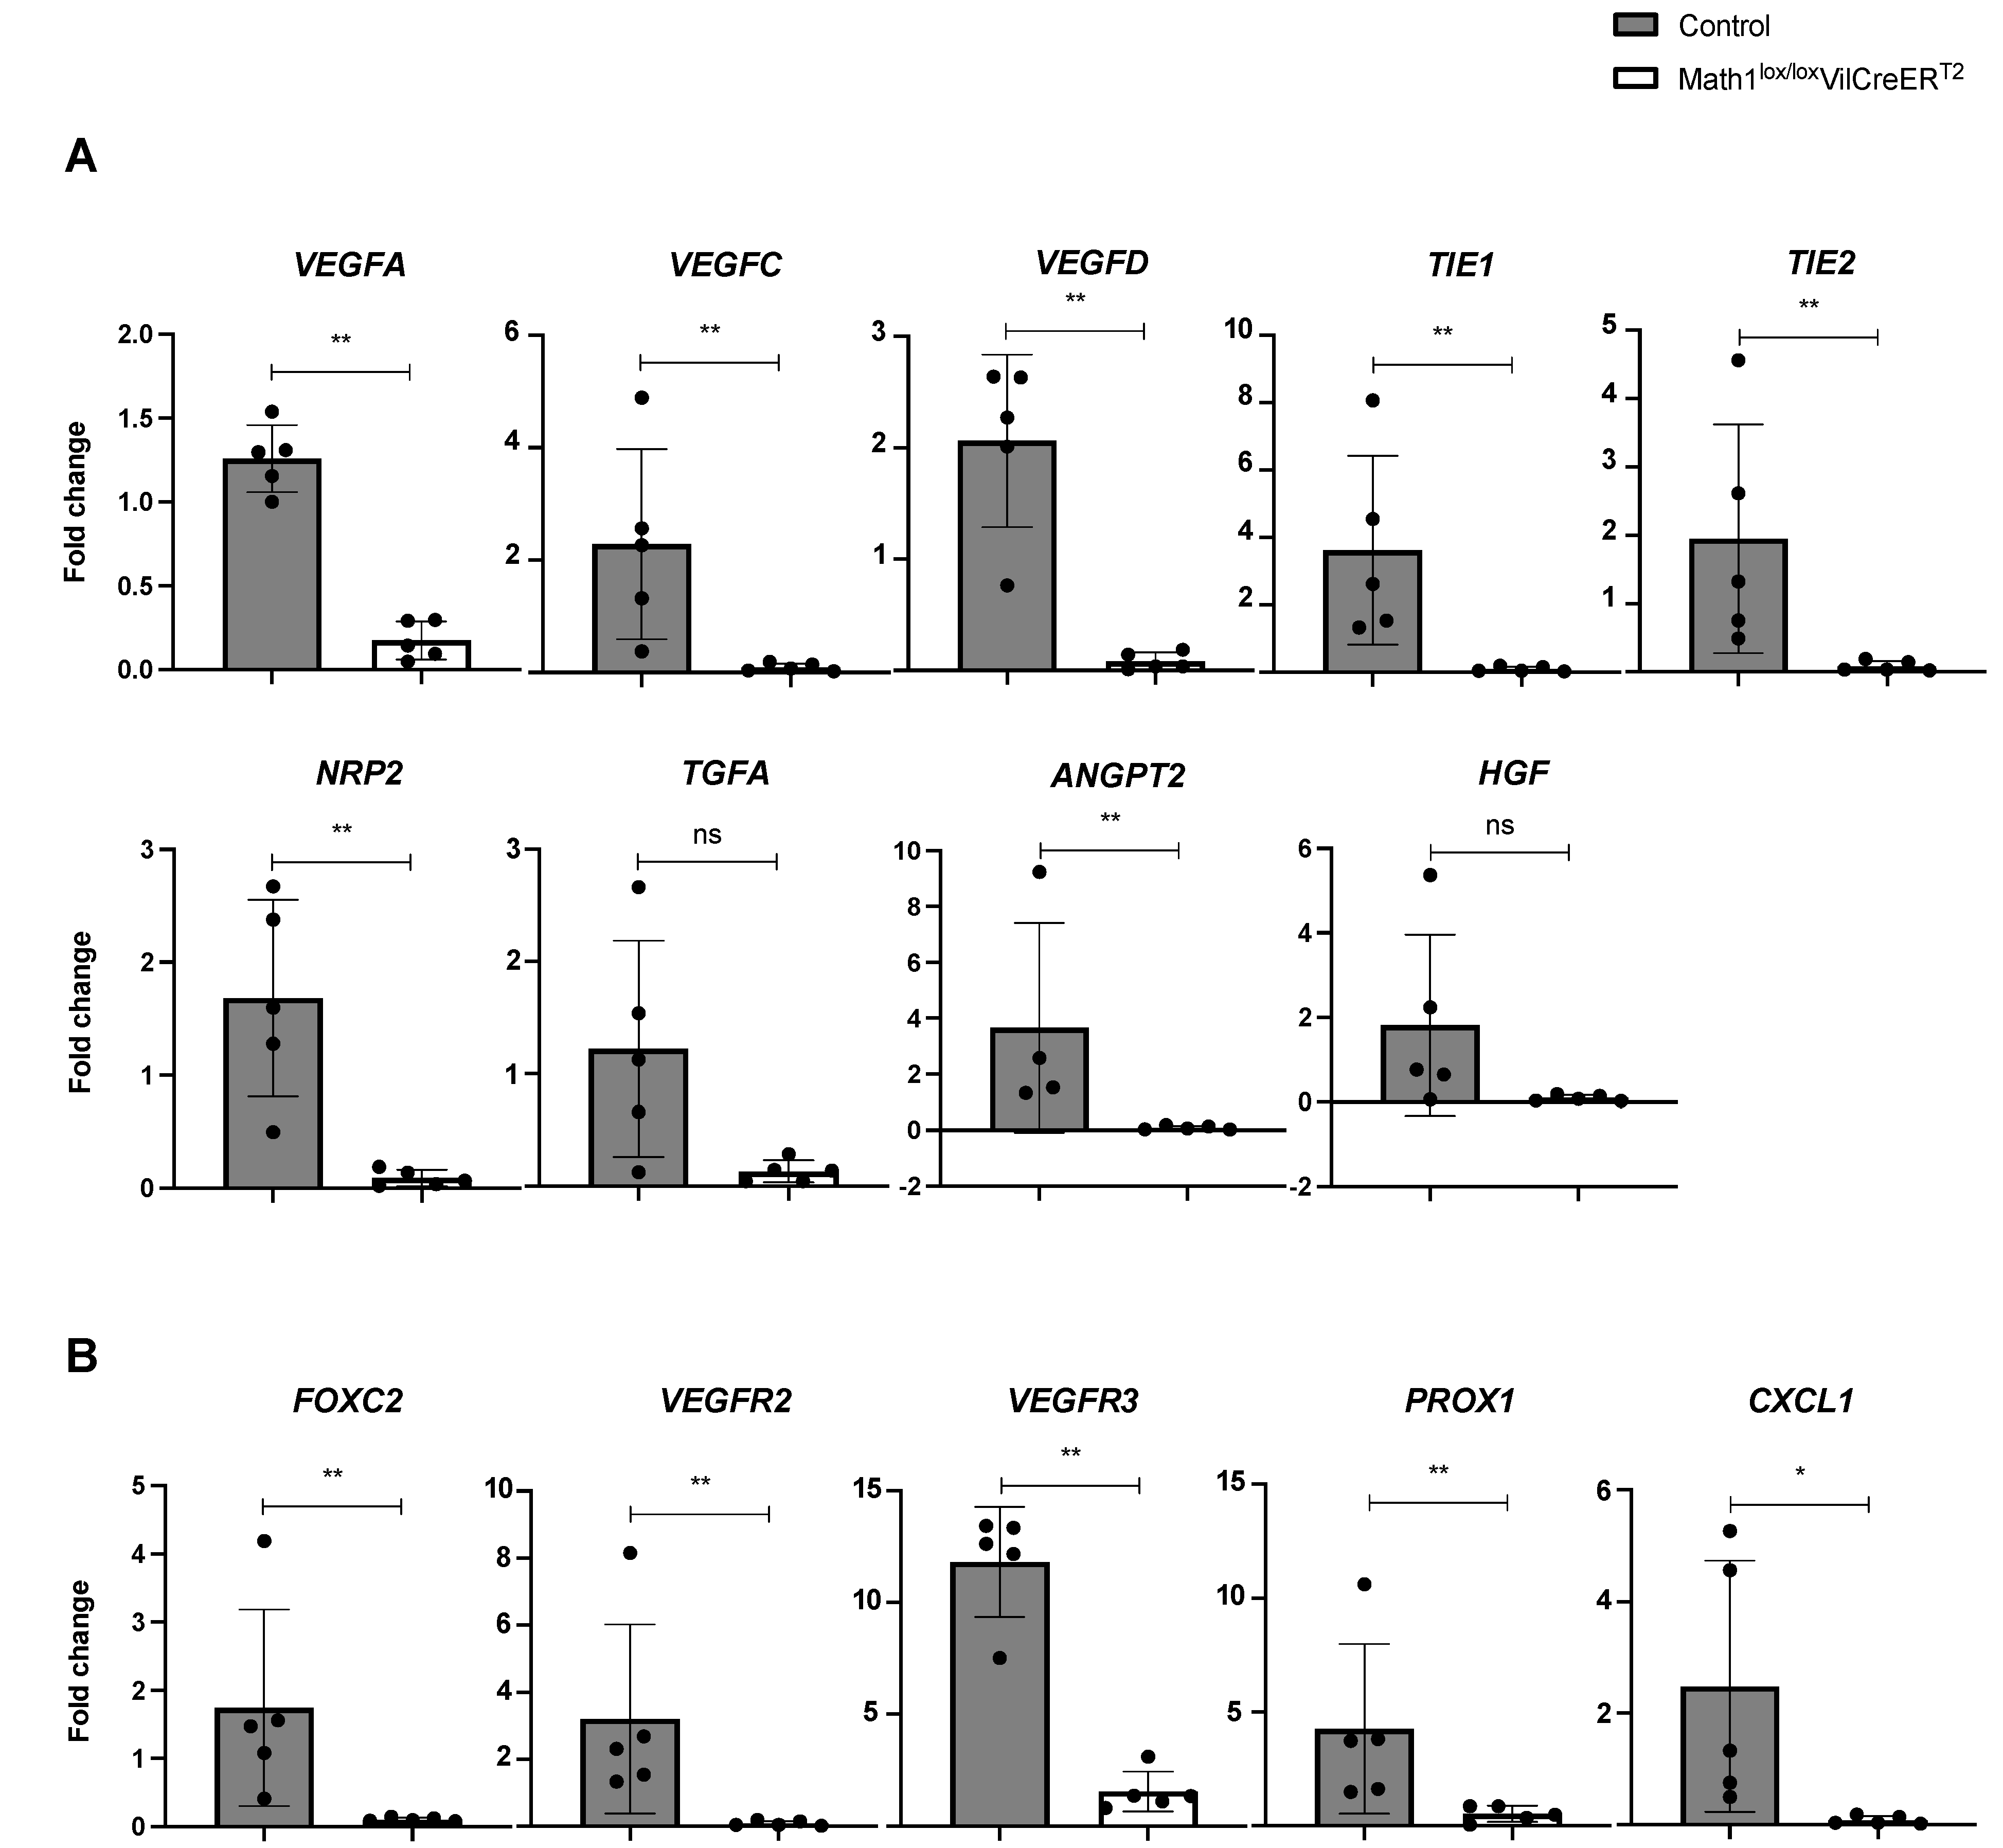
3.3. The Absence of Paneth Cells Is Associated with Reduced Expression of Lymphangiogenic Genes in Small Intestine of Portal Hypertensive Mice

To confirm the results obtained from mRNA sequencing, we investigated whether the depletion of PCs could affect the mRNA expression of genes involved in proliferation and maintenance of lymphatic vessels using RT2 qPCR array and real-time qPCR (n = 5/group). The results from RT2 qPCR analysis revealed that VEGFA, VEGFC, VEGFD, NRP2, TIE1, TIE2 and ANGPT2 genes were significantly downregulated in Math1Δintestine mice as compared to control mice after PPVL. HGF and TGFA were not significantly different between the two groups (Figure 3A). Consistently with RT2 qPCR analysis, we observed that the real-time mRNA expression of more specific markers of lymphangiogenesis, such as PROX1, FOXC2, VEGFR2 and VEGFR3 in Math1Δintestine mice, was significantly diminished as compared to control mice after PPVL (Figure 3B).

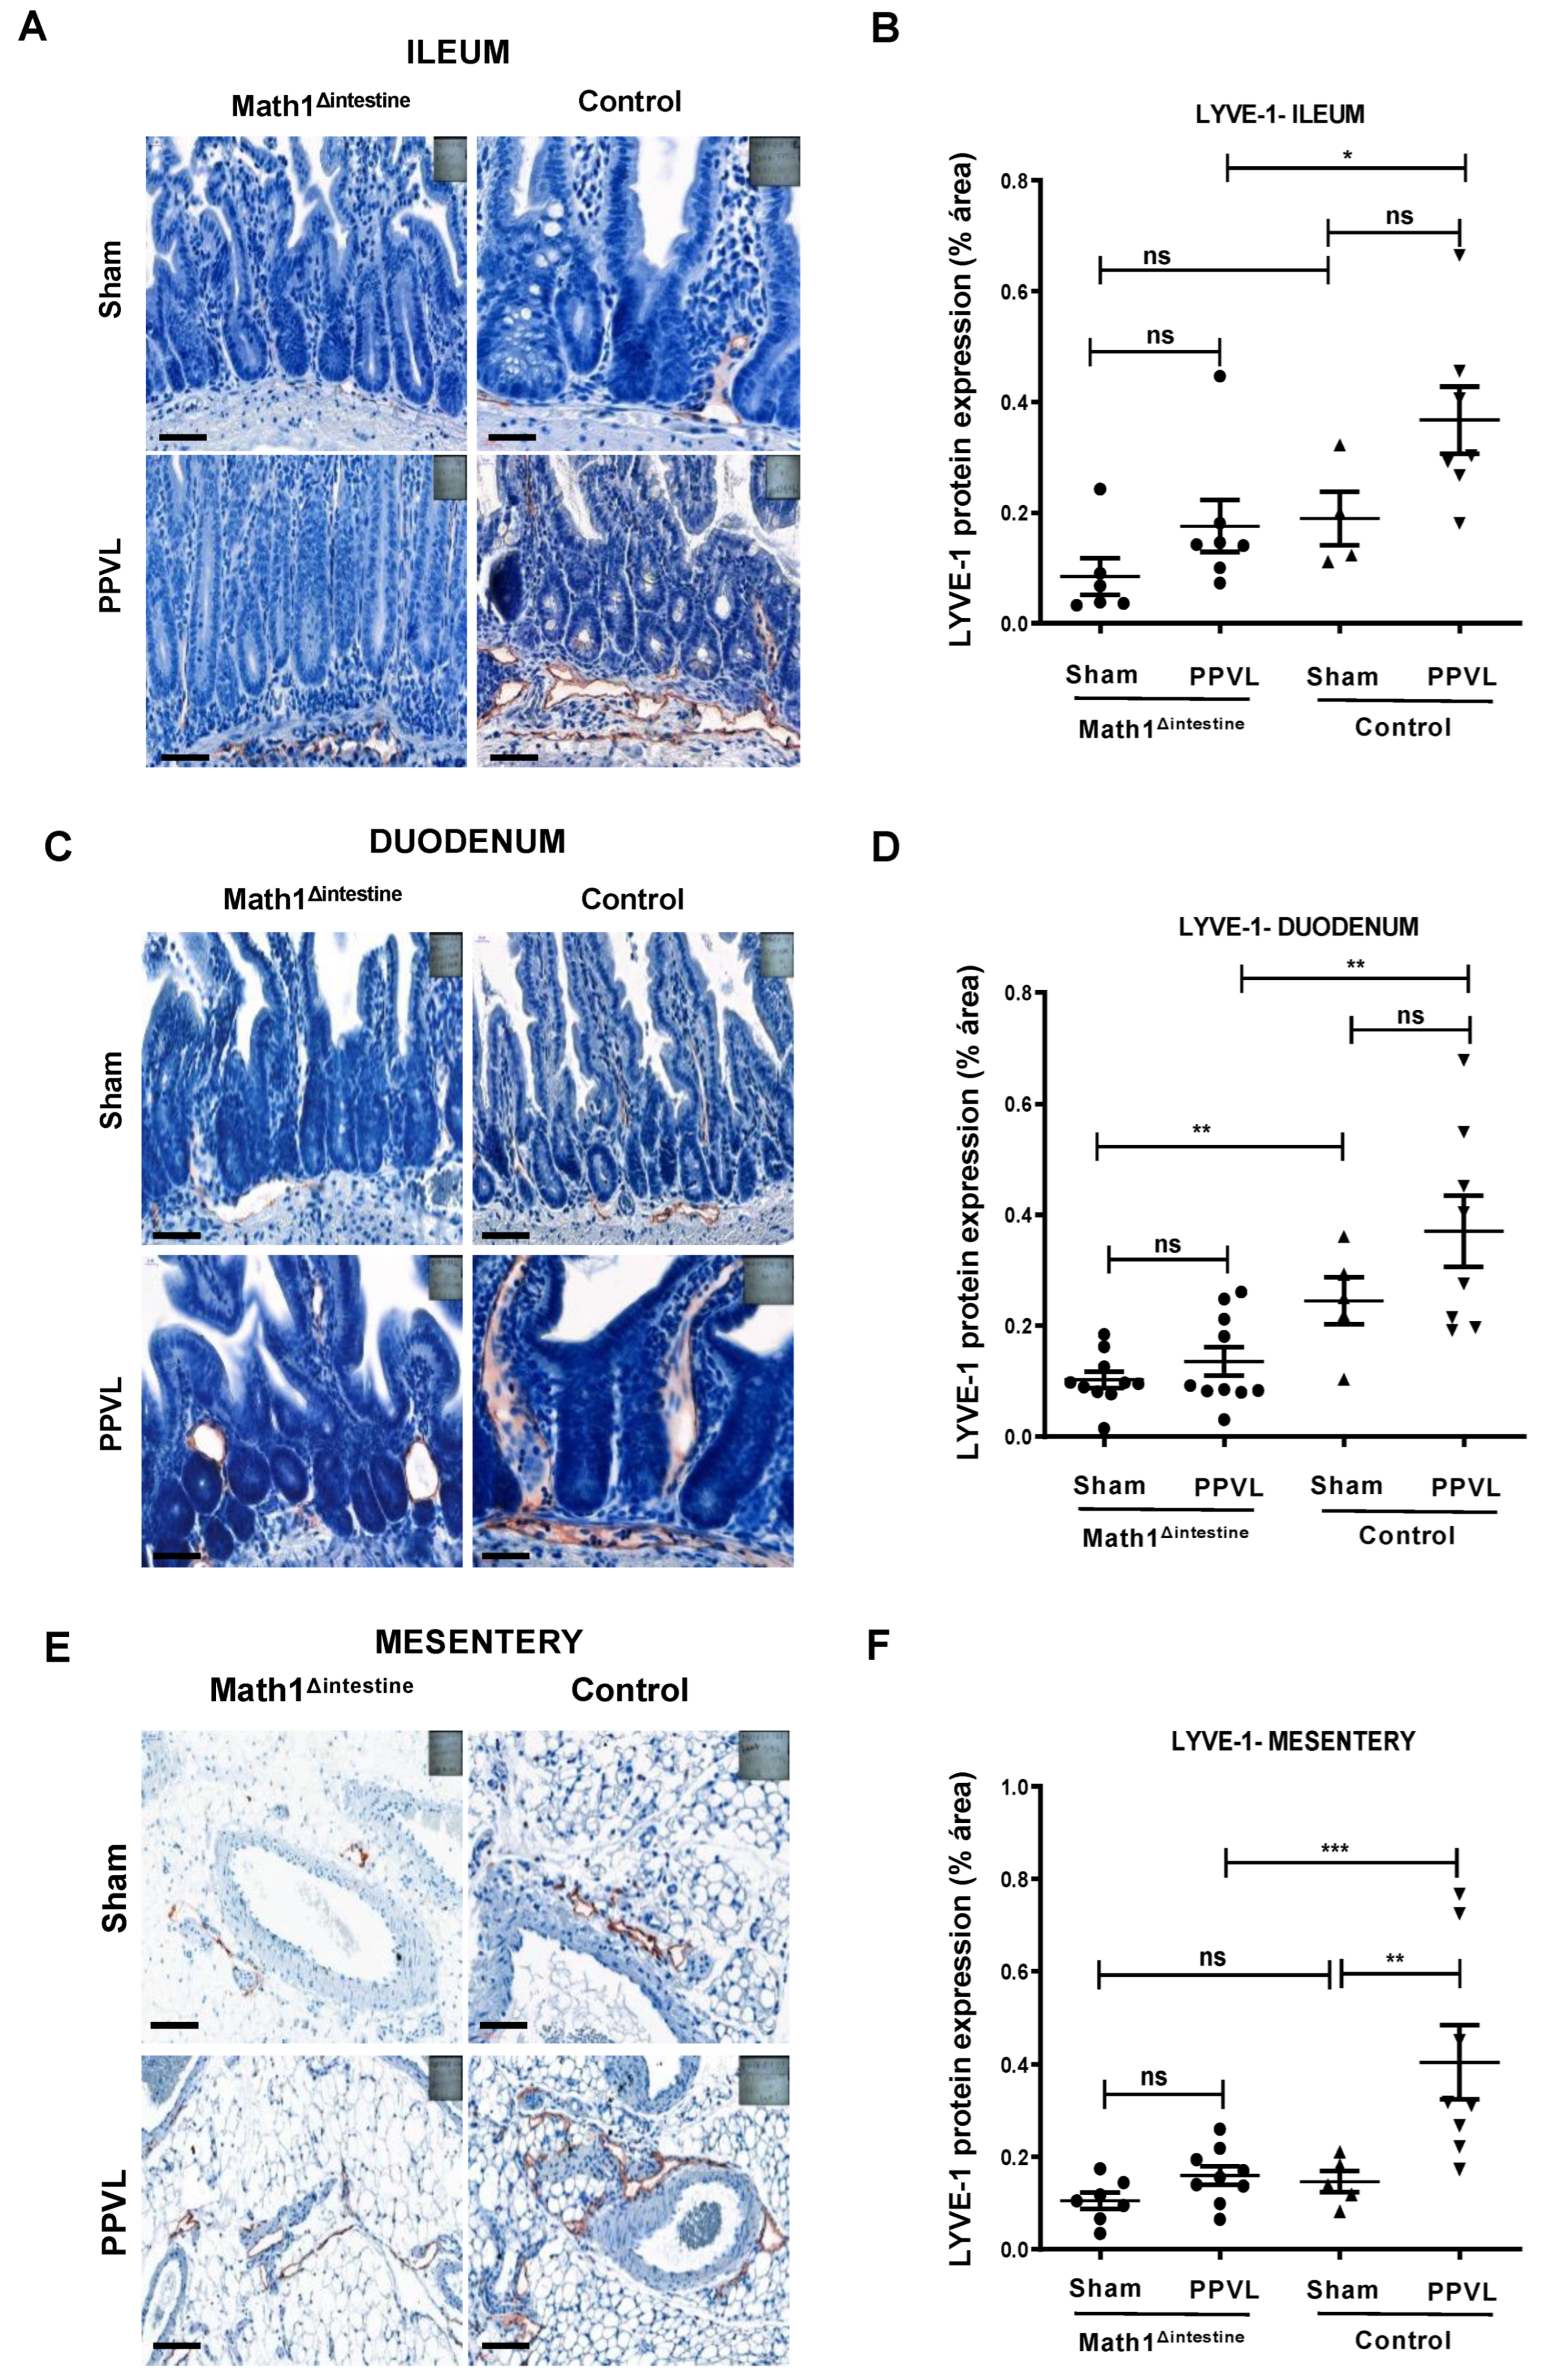
3.4. Loss of Paneth Cells Is Associated with Reduced Abundance of Intestinal and Mesenteric Lymphatic Vessels after PPVL

The effect of PC depletion on the density of lymphatic vessels was examined by the positive staining for LYVE1 in different segments of the intestine and mesentery (n = 5/group) (Figure 4). We observed that the absence of PCs was associated with reduced density of lymphatic vessels among PPVL groups in the ileum 0.176% ± 0.12 vs. 0.367% ± 0.15, (p = 0.011) (Figure 4A,B), duodenum 0.135% ± 0.08 vs. 0.370% ± 0.17, (p = 0.003), (Figure 4C,D) and mesentery 0.160% ± 0.06 vs. 0.404% ± 0.20, (p = 0.001) (Figure 4E,F), as compared to control mice. Additionally, the induction of experimental portal hypertension was associated with an increase in the abundance of mesenteric lymphatic vessels as compared to the sham-operated animals only in the presence of PCs 0.144 ± 0.12 vs. 0.404% ± 0.20 (p = 0.04) (Figure 4E,F).

3.5. The Growth of Intestinal Organoids Is Not Affected by the Absence of Paneth Cells

To better understand the underlying mechanisms, we took advantages of culturing intestinal organoids isolated from the small intestinal crypts of control and Math1Δintestine mice. We first confirmed the absence of PCs in the intestinal organoids developed from Math1Δintestine mice by immunofluorescence using a lysozyme antibody. In organoids derived from control small intestine, the green fluorescence confirms the presence of lysozyme positive PCs (Figure 5).

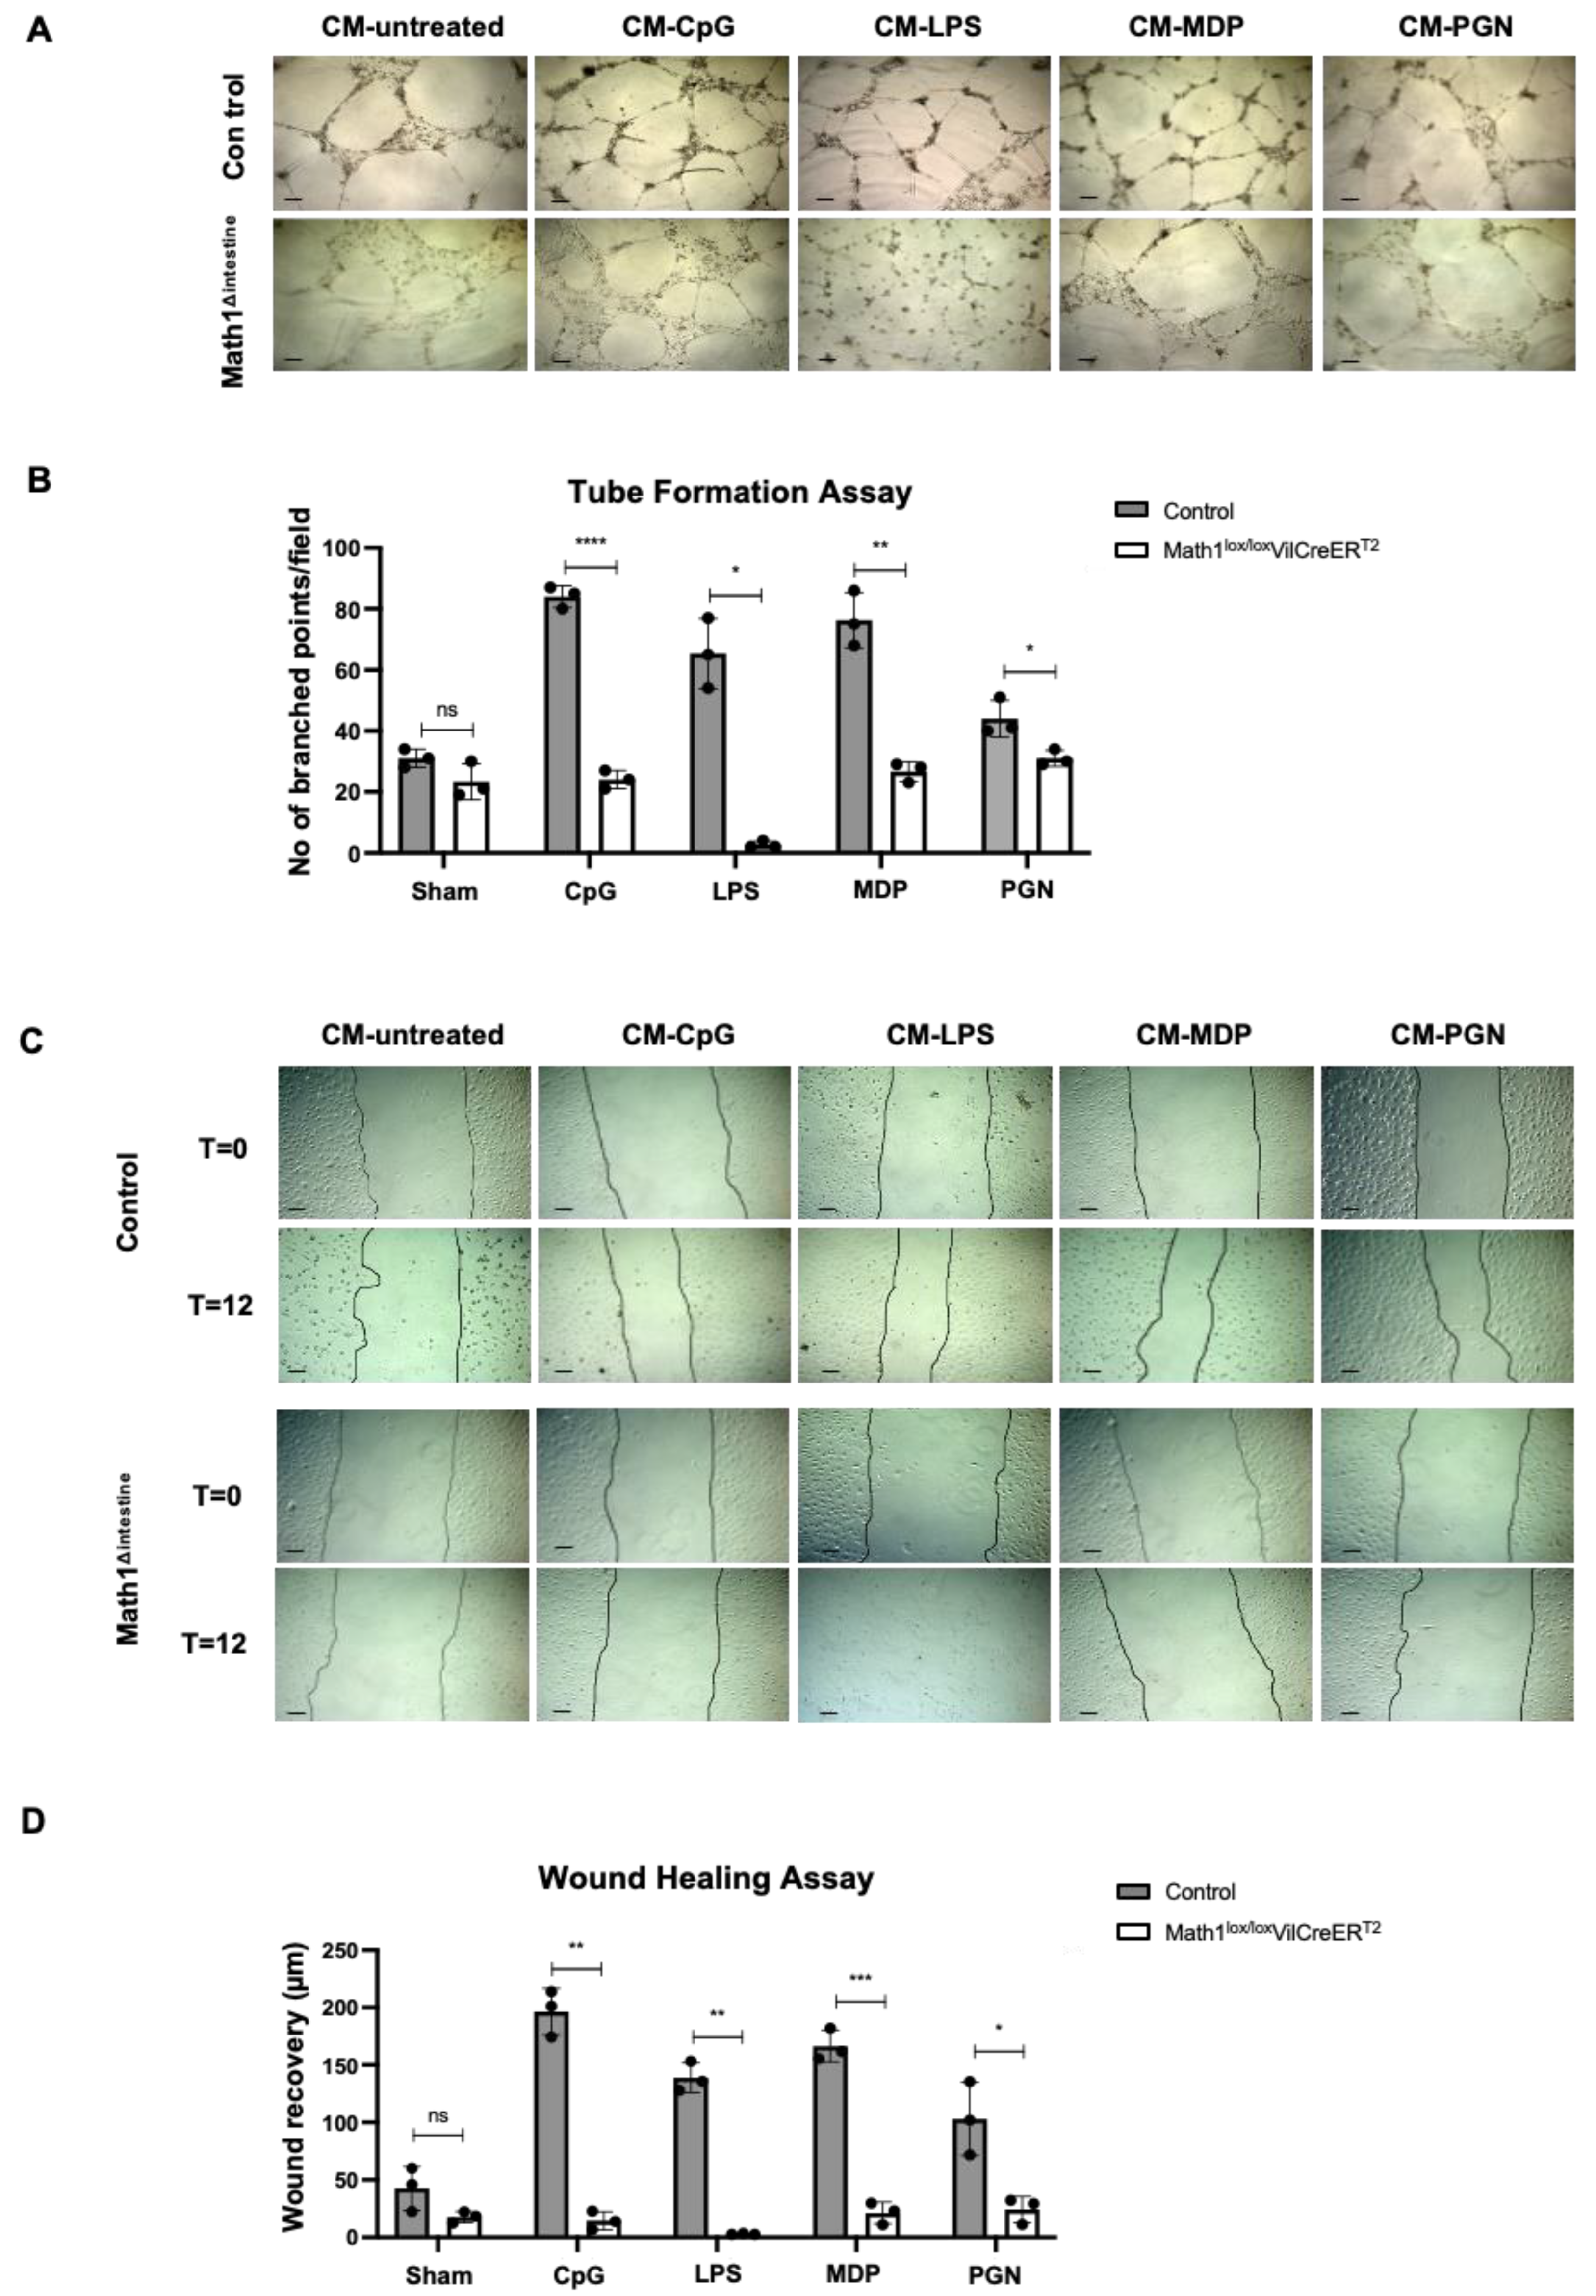
3.6. PCs Secretory Products Stimulate Lymphangiogenic Responses In Vitro

To confirm the role of PCs in the regulation of lymphangiogenesis in vitro, we stimulated PCs by challenging the intestinal organoids with PAMPs (CpG, LPS, MDP and PGN) for 24 h. The CM from unstimulated organoids or those challenged with PAMPs were collected. Lymphatic endothelial cells (LECs) were exposed to CM to evaluate whether PC-secreted factors in CM might induce lymphangiogenic activity in vitro. LECs treated with CM obtained from unstimulated organoids showed similar tube formation activities regardless of the presence or absence of PCs. However, the tube formation activity of LECs was significantly increased after treatment with CM derived from stimulated organoids with PCs, as compared to the same conditions in the absence of PCs (Figure 6A,B).
Figure 4. PCs modulate intestinal and mesenteric lymphangiogenesis. Representative immunostaining images and quantification showing the density of lymphatic vessels (stained brown) using LYVE1 antibody in sham-operated and portal hypertensive mice 14 days after PPVL in (A,B) distal intestine, (C,D) proximal intestine, (E,F) mesentery of Math1Δintestine and control mice, respectively. Black line indicates 20 µm magnification. Abbreviations: Math1Δintestine, Paneth cell depleted; PPVL, partial portal vein ligation; LYVE1, lymphatic vessel endothelial hyaluronan receptor 1; ns, not significant. Data are expressed as mean ± SD. n = 5 per group. * p < 0.05; ** p < 0.005; *** p < 0.001.
Biomedicines 10 01503 g004
Figure 5. Intestinal organoids with or without PCs from control and Math1Δintestine mice after tamoxifen injection. Representative lysozyme immunofluorescence images of organoids showing (A) absence of PCs in organoids isolated from Math1Δintestine small intestine, and (B) presence of PCs (green) in organoids isolated from the intestinal crypts of control mice. Abbreviations: Math1Δintestine, Paneth cell depleted; PCs, Paneth cells.
Biomedicines 10 01503 g005
Lymphangiogenic activities of peptides secreted by PCs were further confirmed by performing wound scratch assays in LECs treated with the same CM, as discussed above. LECs migration remained unaltered when incubated with CM obtained from unstimulated organoids with or without PCs. Consistent with the results obtained in the tube formation assays, treatment of LECs with CM derived from PAMPs-challenged control organoids resulted in a significant increase of lymphatic cell migration, as compared to the same conditions in the absence of PCs (Figure 6C,D). Furthermore, we detected increased LECs proliferation after treatment with CM collected from PAMPs-challenged organoids with PCs (Supplementary Figure S2). These data are in line with the augmented haptotaxis and differentiation capacity of LECs treated under similar conditions in the presence of PCs. Collectively, these results suggest that factors secreted by PCs in response to bacterial products have lymphangiogenic properties in vitro.
Figure 6. Lymphangiogenic properties of factors released by PCs in response to PAMPs. (A) Representative images showing tube formation assays of LECs co-cultured with CM for 24 h, collected from intestinal organoids unstimulated or stimulated with indicated microbial products in the presence or absence of PCs. Black lines indicate 100 µm magnification. (B) Quantification of tube formation assays indicating the number of branched points per field area. (C) Representative images showing wound healing assays of LECs co-cultured with CM collected from intestinal organoids unstimulated or stimulated with indicated microbial products in the presence or absence of PCs at time 0 h (T = 0) or after 12 h (T = 12) of incubation. Black lines indicate 50 µm magnification. (D) Quantification of wound healing assays indicating the distance (µm) that LECs migrated after 12 h (wound recovery). Abbreviations: CM, conditioned media; CpG, CpG motifs of bacterial DNA; LECs, lymphatic endothelial cells; LPS, lipopolysaccharide; Math1lox/lox VilCreERT2, Paneth cell depleted; MDP, muramyl dipeptide; ns, not significant; PGN, peptidoglycan; PCs, Paneth cells. Data are expressed as mean ± SD and are representative of 3 independent experiments. * p < 0.05; ** p < 0.005; *** p < 0.001; **** p < 0.0001.
Biomedicines 10 01503 g006

3.7. Proteins Secreted by Paneth Cells Are Associated with Metabolic Processes, Cell Proliferation and Cell Growth

To validate whether PC-secreted products modulate the intestinal lymphatic network, we performed two-group analysis to compare differentially secreted proteins in CM after challenge with PAMPs (LPS and MDP) collected from intestinal organoids of control and Math1Δintestine mice. We identified 314 proteins in the supernatants of LPS-challenged Math1Δintestine vs. control organoids. The functions of these proteins were associated with metabolic processes, biological regulation, response to stimulus, cell communication, cell proliferation and cell growth, among others (Figure 7A). Additionally, gene ontology enrichment analysis (GSEA) revealed that biological processes associated with regulation of plasma lipoprotein particle levels, cell proliferation and cell redox homeostasis were enriched among the proteins secreted by control organoids challenged with LPS, while cell-substrate adhesion, protein metabolism and exocytosis were enriched in the factors secreted by organoids without PCs in response to this bacterial product (Figure 7B).
Similarly, secretome analysis performed in the supernatants of MDP-challenged Math1Δintestine vs. control organoids quantified 330 proteins associated with metabolic processes, biological regulation, response to stimulus, cell proliferation and growth (Figure 7C). More specifically, regulation of growth, epithelial cell proliferation and lipid localization were biological processes enriched among the proteins secreted by PCs in control organoids after challenge with MDP, whereas regulation of protein catabolic process, nucleotide phosphorylation, reactive oxygen species, apoptotic pathway and cofactor metabolic process were biological processes enriched in the CM collected from organoids without PCs (Figure 7D). Taken together, these results confirm that PCs secrete proteins in response to PAMPs stimuli, which are involved in lipid metabolism, cell proliferation and growth. The complete list of the quantified proteins in both conditions is provided in Supplementary Table S3.

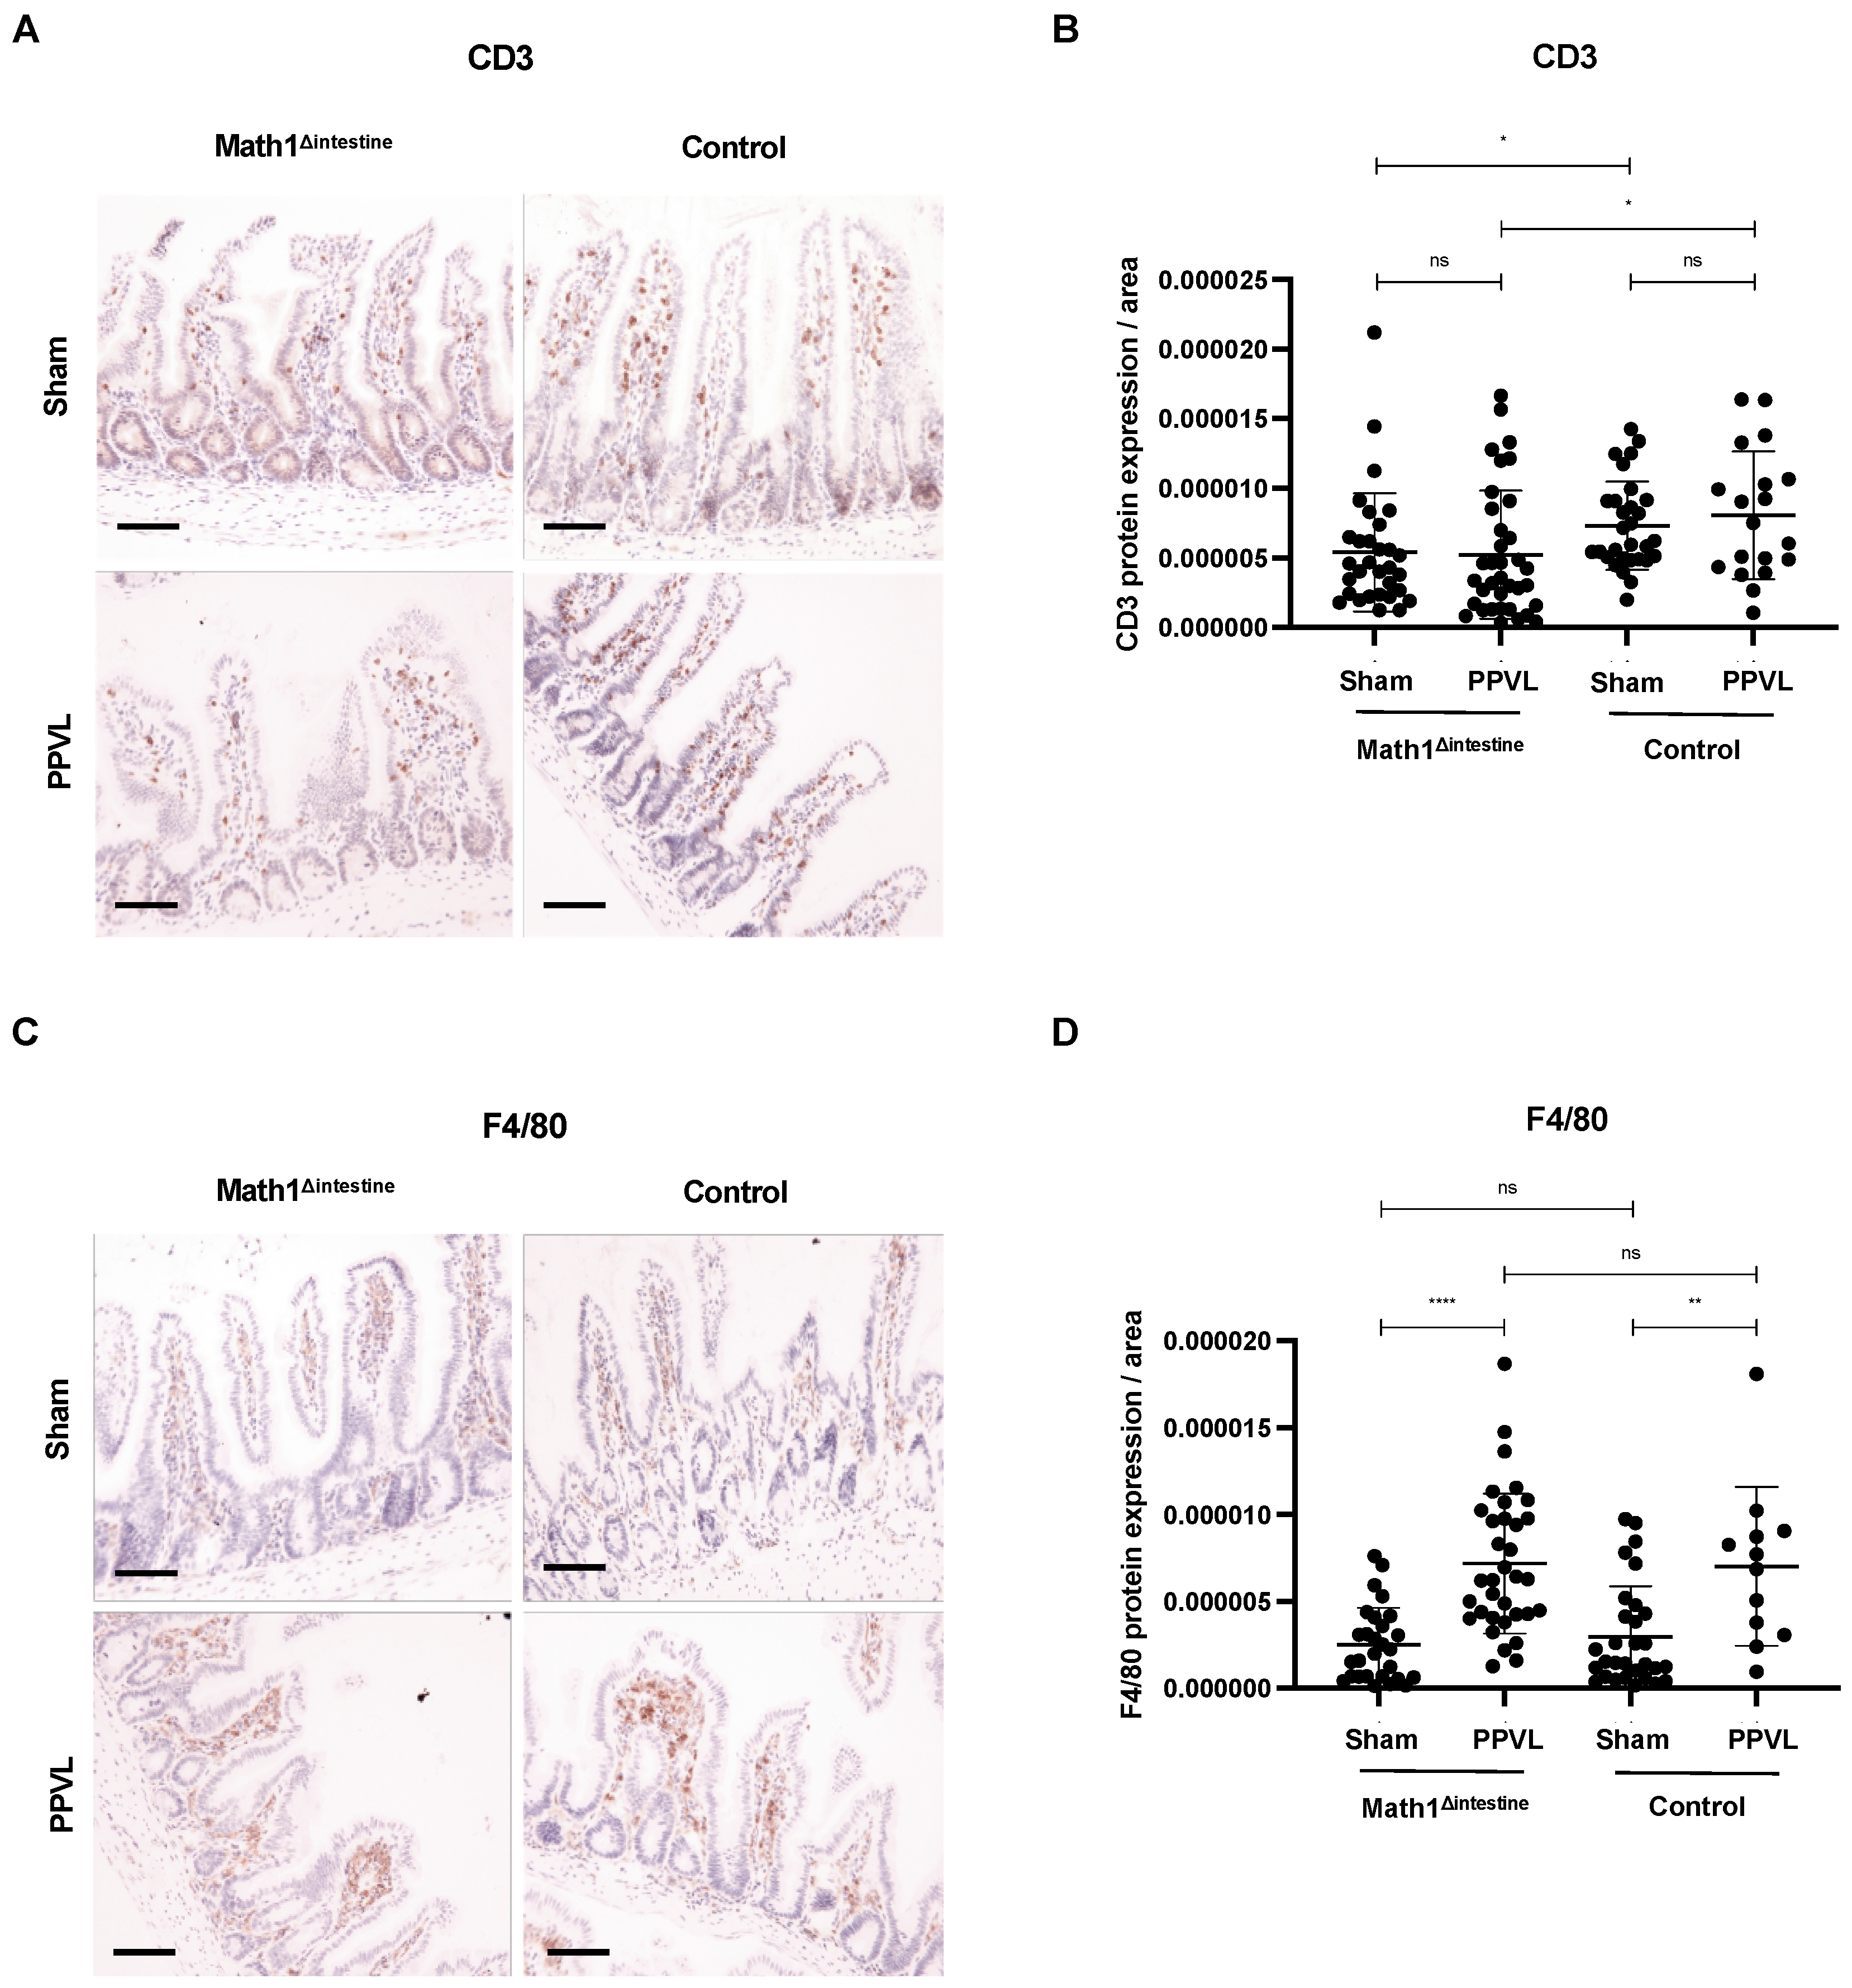
3.8. Intestinal Immune Cell Infiltration Is Slightly Affected by the Presence or Absence of Paneth Cells

We showed that secretory proteins from Paneth cells induce lymphangiogenic responses in portal hypertensive mice in vivo and in LECs in vitro. However, we sought to determine whether other factors may influence lymphatic vessels during portal hypertension in our model. It is known that lymphangiogenic factors can be released from different cell types, including fibroblasts, immune, tumoral and epithelial cells [33]. Since we detected reduced gene expression of CXCL1 in the intestines of portal hypertensive mice without PCs (Figure 3B), we wondered whether PCs depletion could change the intestinal cell infiltration and recruitment of other immune cells. We evaluated, through immunohistochemistry, the expression of CD3 and F4/80 in ileal samples to detect the intestinal infiltration of lymphocytes and macrophages in our study groups. Among animals with the same genotype, the induction of experimental portal hypertension was not associated with a significant increase of lymphocyte infiltration as compared to sham-operated animals (Figure 8A,B). However, the ileum of mice with PCs presented a discrete increase in the infiltration of intestinal lymphocytes that reached significancy, as compared to the mice without PCs, independently of the induction of portal hypertension (Figure 8A,B). The infiltration of intestinal macrophages was significantly increased in the ileal mucosa and submucosa of portal hypertensive mice, as compared to sham-operated animals, independently of the presence or absence of PCs (Figure 8C,D).
Figure 7. PAMPs stimulate PCs to secrete factors associated with cell growth. Secretome analysis of CM collected from LPS- and MDP-stimulated organoids with or without PCs. (A) GO slim bar chart of biological processes of the 314 proteins quantified in LPS-stimulated Math1Δintestine vs. control organoids. (B) Bar chart showing GSEA of the 314 proteins quantified in LPS-stimulated Math1Δintestine vs. control organoids. (C) GO slim bar chart of biological processes of the 330 proteins quantified in MDP-stimulated control organoids vs. Math1Δintestine organoids. (D) Bar chart showing GSEA of the 330 proteins quantified in MDP-stimulated Math1Δintestine vs. control organoids. The height of the bar represents the number of IDs in the user list and in the category in (A,C). Blue bars show positively, and yellow bars represent negatively enriched biological processes among identified proteins in (B,D). n = 4 per group. Abbreviations: GO, gene ontology; GSEA, gene set enrichment analysis; LPS, lipopolysaccharide; Math1Δintestine, Paneth cell depleted; MDP, muramyl dipeptide.
Biomedicines 10 01503 g007

4. Discussion

In the present study, we demonstrated that PCs regulate the intestinal and mesenteric lymphatic proliferation during portal hypertension by modulating the density of lymphatic vessels and the expression of lymphangiogenic genes, as summarized in Figure 9. Our findings also provide evidence that bacterial products stimulate PCs to secrete pro-lymphangiogenic factors that may be involved in these processes.
Portal hypertension is associated with an increase in the splanchnic and hepatic lymphatic vessel density and lymph flow in chronic liver disease [34,35]. These results are in line with our previous observations showing increased lymphangiogenesis after PPVL [16]. In the absence of intestinal microbiota, we observed that portal hypertension, the density of intestinal lymphatic vessels and the number of PCs were significantly reduced. Moreover, in a recent study, our group showed the role of PCs as contributors to the intestinal vascularization and subsequent effects in portal hypertension [19]. Our current findings provide concrete evidence for the first time that intestinal and mesenteric lymphangiogenesis could also be under the control of PCs through microbial stimuli, in addition to portal hypertension.
Paneth cells secrete antimicrobial peptides in response to PAMPs that protect the intestinal milieu and prevent pathogen invasion [36]. Therefore, their activity is required to promote intestinal homeostasis and foster a balanced host–microbiota interaction. Indeed, Wehkamp et al. demonstrated that ileal Crohn’s disease is characterized by a compromised activity of PCs due to reduced production of alpha defensins [37]. The relevance of PCs in the pathogenesis of chronic liver disease was previously addressed in the study by Teltschik et al., where the authors demonstrated that reduced function of PCs predispose to bacterial translocation [38]. The regulatory role of PCs during development of portal hypertension was first evidenced in our work by performing mRNA sequencing of the small intestine. Unsupervised hierarchical clustering revealed that samples with different phenotypes for PCs showed similar gene expression patterns under basal conditions. The low number of differentially expressed genes under baseline might be due to the increased variability observed among the samples from mice without PCs. Nevertheless, following the induction of experimental portal hypertension, the gene expression pattern in the small intestinal tissue was significantly affected by the absence of PCs.
Multiple studies have previously reported the expression of specific markers to distinguish the lymphatic vessels from blood vessels [8,39,40,41]. We therefore evaluated the expression levels of PROX1, FOXC2, VEGFC and VEGFR3, and found a significant downregulation in portal hypertensive mice without PCs. These genes are required for the stimulation of lymphatic endothelial cells, as well as for the growth and maintenance of lymphatic vessels [42,43]. Therefore, our results suggest an association between PCs and the regulation of lymphatic vascular proliferation in the intestinal and mesenteric vascular beds during portal hypertension.
Lymphatic vessel endothelial hyaluronic acid receptor (LYVE) 1 is a binding membrane glycoprotein expressed on lymphatic endothelial cells [39]. Previously, increased intestinal expression of LYVE1 was reported in experimental models of portal hypertension [16]. We observed herein that PCs can affect the lymphatic vasculature since the absence of this cell population was associated with reduced intestinal and mesenteric lymphatic vessels, determined by LYVE-1 immunostaining, in portal hypertensive mice. Previous studies suggested a dysfunctional lymphatic drainage in advanced CLD and portal hypertension in patients and experimental models [12]. Fluorescent lymphangiography in cirrhotic rats revealed that the dysfunctional lymphatic drainage observed in peripheral, as well as splanchnic, circulation was associated with a high expression of endothelial nitric oxid synthase (eNOS) in mesenteric LECs [10,44]. Despite these findings, the precise cellular and molecular mechanisms explaining the role of the intestinal–mesenteric lymphatic system in the context of portal hypertension remains not fully understood.
Previous studies reported that intestinal microbiota is a major stimulus for PCs to regulate intestinal angiogenesis [19,21]. We further investigated the role of intestinal microbiota and its association with PCs for the regulation of lymphangiogenesis during portal hypertension. We observed that factors secreted by PCs in response to microbial products induced lymphangiogenic activities in LECs, as observed in tube formation and wound healing assays. Moreover, the gene set enrichment analysis performed after two-group proteomic analysis (Math1Δintestine vs. control) revealed that proteins secreted by PCs following PAMPs-challenge were associated with lipid metabolism, cell proliferation and growth, among other biological pathways. LPS is a well-known pathogen-associated molecular pattern (PAMP) that elicits inflammatory responses. It activates and upregulates the secretion of cytokines and adhesion molecules, as well as inducing apoptotic cell death in endothelial cells [45]. Antimicrobial peptides secreted by PCs can recognize LPS and neutralize its cytotoxic activity in LECs [46]. Therefore, reduced antimicrobial peptides in the CM isolated from LPS-treated organoids without PCs might explain the deleterious effect of this CM on LECs. Collectively, these data supported our initial hypothesis that microbial derived signals may stimulate PCs to secrete factors with a potential role in the regulation of intestinal and mesenteric lymphangiogenic responses during the development of portal hypertension.
Different cell subtypes can influence the formation of lymphatic vessels by secreting lymphangiogenic molecules as VEGFC, VEGFD or Ang1. It is well known that infiltrating macrophages induce lymphangiogenesis [47], and their depletion in the cornea results in inhibition of lymphangiogenesis associated with reduced production of VEGFA, VEGFC and VEGFD [48]. Interestingly, the interaction between T lymphocytes and macrophages activates macrophages to secrete VEGFC and induce lymphangiogenesis [49]. Along these lines, removal of CD4+ using a specific anti-CD4 results in reduced expression of VEGFC, VEGFD and ameliorated lymphangiogenesis, as evidenced by reduced expression of Lyve-1 in the diapragm [50]. We observed compromised immune responses to portal hypertension in Math1Δintestine mice, as shown by reduced ileal gene expression of the chemokine CXCL1 that correlated with decreased infiltration of lymphocytes in the mucosa and submucosa of the ileum in sham and portal hypertensive Math1Δintestine mice. It is possible that the small intestines of Math1Δintestine mice are not fully immunocompetent and their capacity to respond to the intestinal stress induced by the congestion of the portal vein is altered. Although we can not exclude that other cellular sources can modulate the intestinal lymphatic vasculature, our data presented here suggest that secretory products of PCs may play an important role in this process.
We acknowledge that additional studies are required to identify the specific factors responsible for the lymphangiogenic effects of PC secretory products. It is important to note that the mRNA expression data is obtained directly from ileal tissue, while proteomics was performed in the supernatants obtained from organoids isolated from the small intestine. Since the expression of genes, and hence of proteins, is highly context-dependent, we should be cautious when comparing both datasets to identify molecular targets. Additionaly, we cannot exclude the possible effect of different multicellular responses in the presence or absence of PCs. Thus, the direct or indirect involvement of PCs in lymphangiogenesis needs to be elucitated in detail in the future.

5. Conclusions

In conclusion, our results suggest that PCs actively promote intestinal and mesenteric lymphangiogenesis in a process regulated by intestinal microbiota in experimental portal hypertension. These findings represent novel significant knowledge in the understanding of portal hypertension, suggesting that the components of the innate immune system (i.e., Paneth cells) are also involved in the regulation of previously unrelated mechanisms (i.e., portal pressure). This study supports further investigations to address the potential benefits of targeting the secretory products of Paneth cells as a new therapeutic intervention to diminish portal pressures in portal hypertension.

Supplementary Materials

The following supporting information can be downloaded at: https://www.mdpi.com/article/10.3390/biomedicines10071503/s1. Figure S1: Manual quantitation of tubularization; Figure S2: LECs proliferation after treatment with organoids CM; Table S1: Primers used for genotyping of Math1Lox/LoxVilCreERT2 mice; Table S2: Details of probes used for TaqMan® gene expression assays; Table S3: Proteins identified in secretome analysis of CM collected from organoids treated with LPS and MDP (Math1Δint vs control).

Author Contributions

Designing research studies and grant acquisition: S.M.; conducting experiments: M.H., O.J., I.K., P.N., W.W., S.M.-L., E.C., R.F. and S.M.; acquiring data: M.H., O.J., I.K., P.N., W.W., S.M.-L., E.C., R.F. and S.M.; analyzing data: M.H., O.J., I.K., P.N., W.W., S.M.-L., E.C., R.F. and S.M.; writing the manuscript: M.H., O.J. and S.M. All authors have read and agreed to the published version of the manuscript.

Funding

This work was supported by grants from the Johanna Dürmüller-Bol Foundation, the Novartis Foundation for Medical-Biological Research, and the SWISS-NASH Foundation to Sheida Moghadamrad. Oriol Juanola was supported by the Swiss National Science Foundation (IZSEZ0_205275).

Institutional Review Board Statement

The animal study protocol was approved by the Ethics Committee of the canton of Bern (protocol code BE 94/16 and date of approval 24.11.2016).

Informed Consent Statement

Not applicable.

Data Availability Statement

The data that support the findings of this study are available within the article and upon reasonable request to the corresponding author, S.M.

Acknowledgments

The authors would like to thank Giandomenica Iezzi and her laboratory team for their support during cell culture experiments, and Carlo Catapano and Gianluca Civenni for their support at the microscopy imaging center. Next generation sequencing was performed by the NGS Platform of the University of Bern, and computational infrastructure was provided by the Interfaculty Bioinformatics Unit, University of Bern.

Conflicts of Interest

The authors have declared that no conflict of interest exists.

Abbreviations

Paneth cells (PCs), partial portal vein ligation (PPVL), immunohistochemistry (IHC), lymphatic vessel endothelial hyaluronic acid receptor 1 (LYVE1), pathogen-associated molecular patterns (PAMPs), conditioned media (CM), lymphatic microvascular endothelial cells (LECs), prospero-related homeobox 1 (PROX1), vascular endothelial growth factor C (VEGFC), vascular endothelial growth factor receptor 3 (VEGFR3), chronic liver disease (CLD), regenerating islet derived protein 3 (REG3A), endothelial nitric oxid synthase (eNOS), specific pathogen free (SPF), forkhead box C2 (FOXC2), 3,3-diaminobenzidine-tetrahydrochloride (DAB), ethylene diamine tetra acetic acid (EDTA), diamidino-2-phenylindole (DAPI), mass spectrometry (MS), lipopolysaccharide (LPS), muramyl dipeptide (MDP), peptidoglycan (PGN), CpG oligodeoxynucleotides (CpG ODN).

References

  1. Oliver, G.; Kipnis, J.; Randolph, G.J.; Harvey, N.L. The Lymphatic Vasculature in the 21st Century: Novel Functional Roles in Homeostasis and Disease. Cell 2020, 182, 270–296. [Google Scholar] [CrossRef] [PubMed]
  2. Baluk, P.; Fuxe, J.; Hashizume, H.; Romano, T.; Lashnits, E.; Butz, S.; Vestweber, D.; Corada, M.; Molendini, C.; Dejana, E.; et al. Functionally specialized junctions between endothelial cells of lymphatic vessels. J. Exp. Med. 2007, 204, 2349–2362. [Google Scholar] [CrossRef] [PubMed]
  3. Petrova, T.V.; Koh, G.Y. Biological functions of lymphatic vessels. Science 2020, 369, eaax4063. [Google Scholar] [CrossRef] [PubMed]
  4. Bernier-Latmani, J.; Petrova, T.V. Intestinal lymphatic vasculature: Structure, mechanisms and functions. Nat. Rev. Gastroenterol. Hepatol. 2017, 14, 510–526. [Google Scholar] [CrossRef]
  5. Van Kruiningen, H.J.; Colombel, J.F. The forgotten role of lymphangitis in Crohn’s disease. Gut 2008, 57, 1–4. [Google Scholar] [CrossRef]
  6. Colombel, J.F.; Watson, A.J.; Neurath, M.F. The 10 remaining mysteries of inflammatory bowel disease. Gut 2008, 57, 429–433. [Google Scholar] [CrossRef] [Green Version]
  7. Tanaka, M.; Iwakiri, Y. The Hepatic Lymphatic Vascular System: Structure, Function, Markers, and Lymphangiogenesis. Cell Mol. Gastroenterol. Hepatol. 2016, 2, 733–749. [Google Scholar] [CrossRef] [Green Version]
  8. Chung, C.; Iwakiri, Y. The lymphatic vascular system in liver diseases: Its role in ascites formation. Clin. Mol. Hepatol. 2013, 19, 99–104. [Google Scholar] [CrossRef]
  9. Witte, M.H.; Dumont, A.E.; Cole, W.R.; Witte, C.L.; Kintner, K. Lymph circulation in hepatic cirrhosis: Effect of portacaval shunt. Ann. Intern. Med. 1969, 70, 303–310. [Google Scholar] [CrossRef]
  10. Ribera, J.; Córdoba-Jover, B.; Portolés, I.; Morales-Ruiz, M. The Role of Hepatic and Splanchnic Lymphatic System in Portal Hypertension and Ascites. Curr. Hepatol. Rep. 2019, 18, 157–163. [Google Scholar] [CrossRef]
  11. Cardenas, A.; Bataller, R.; Arroyo, V. Mechanisms of ascites formation. Clin. Liver. Dis. 2000, 4, 447–465. [Google Scholar] [CrossRef]
  12. Henriksen, J.H. Estimation of lymphatic conductance: A model based on protein-kinetic studies and haemodynamic measurements in patients with cirrhosis of the liver and in pigs. Scand. J. Clin. Lab. Investig. 1985, 45, 123–130. [Google Scholar] [CrossRef] [PubMed]
  13. Yamauchi, Y.; Michitaka, K.; Onji, M. Morphometric analysis of lymphatic and blood vessels in human chronic viral liver diseases. Am. J. Pathol. 1998, 153, 1131–1137. [Google Scholar] [CrossRef] [Green Version]
  14. Yokomori, H.; Oda, M.; Kaneko, F.; Kawachi, S.; Tanabe, M.; Yoshimura, K.; Kitagawa, Y.; Hibi, T. Lymphatic marker podoplanin/D2-40 in human advanced cirrhotic liver-Re-evaluations of microlymphatic abnormalities. BMC Gastroenterol. 2010, 10, 131. [Google Scholar] [CrossRef] [PubMed] [Green Version]
  15. Jeong, J.; Tanaka, M.; Iwakiri, Y. Hepatic lymphatic vascular system in health and disease. J. Hepatol. 2022, 77, 206–218. [Google Scholar] [CrossRef] [PubMed]
  16. Moghadamrad, S.; McCoy, K.D.; Geuking, M.B.; Sägesser, H.; Kirundi, J.; Macpherson, A.J.; De Gottardi, A. Attenuated portal hypertension in germ-free mice: Function of bacterial flora on the development of mesenteric lymphatic and blood vessels. Hepatology 2015, 61, 1685–1695. [Google Scholar] [CrossRef]
  17. Salzman, N.H.; Hung, K.; Haribhai, D.; Chu, H.; Karlsson-Sjöberg, J.; Amir, E.; Teggatz, P.; Barman, M.; Hayward, M.; Eastwood, D.; et al. Enteric defensins are essential regulators of intestinal microbial ecology. Nat. Immunol. 2010, 11, 76–83. [Google Scholar] [CrossRef] [PubMed]
  18. Fernandez, M.I.; Regnault, B.; Mulet, C.; Tanguy, M.; Jay, P.; Sansonetti, P.J.; Pédron, T. Maturation of paneth cells induces the refractory state of newborn mice to Shigella infection. J. Immunol. 2008, 180, 4924–4930. [Google Scholar] [CrossRef] [Green Version]
  19. Hassan, M.; Moghadamrad, S.; Sorribas, M.; Muntet, S.G.; Kellmann, P.; Trentesaux, C.; Fraudeau, M.; Nanni, P.; Wolski, W.; Keller, I.; et al. Paneth cells promote angiogenesis and regulate portal hypertension in response to microbial signals. J. Hepatol. 2020, 73, 628–639. [Google Scholar] [CrossRef]
  20. Hooper, L.V.; Stappenbeck, T.S.; Hong, C.V.; Gordon, J.I. Angiogenins: A new class of microbicidal proteins involved in innate immunity. Nat. Immunol. 2003, 4, 269–273. [Google Scholar] [CrossRef]
  21. Stappenbeck, T.S.; Hooper, L.V.; Gordon, J.I. Developmental regulation of intestinal angiogenesis by indigenous microbes via Paneth cells. Proc. Natl. Acad. Sci. USA 2002, 99, 15451–15455. [Google Scholar] [CrossRef] [Green Version]
  22. Durand, A.; Donahue, B.; Peignon, G.; Letourneur, F.; Cagnard, N.; Slomianny, C.; Perret, C.; Shroyer, N.F.; Romagnolo, B. Functional intestinal stem cells after Paneth cell ablation induced by the loss of transcription factor Math1 (Atoh1). Proc. Natl. Acad. Sci. USA 2012, 109, 8965–8970. [Google Scholar] [CrossRef] [PubMed] [Green Version]
  23. Kim, D.; Langmead, B.; Salzberg, S.L. HISAT: A fast spliced aligner with low memory requirements. Nat. Methods 2015, 12, 357–360. [Google Scholar] [CrossRef] [PubMed] [Green Version]
  24. Liao, Y.; Smyth, G.K.; Shi, W. featureCounts: An efficient general purpose program for assigning sequence reads to genomic features. Bioinformatics 2014, 30, 923–930. [Google Scholar] [CrossRef] [PubMed] [Green Version]
  25. Love, M.I.; Huber, W.; Anders, S. Moderated estimation of fold change and dispersion for RNA-seq data with DESeq2. Genome Biol. 2014, 15, 550. [Google Scholar] [CrossRef] [Green Version]
  26. Benjamini, Y.; Hochberg, Y. Controlling the false discovery rate: A practical and powerful approach to multiple testing. J. R. Stat. Soc. Ser. B (Methodol.) 1995, 57, 289–300. [Google Scholar] [CrossRef]
  27. Moolenbeek, C.; Ruitenberg, E.J. The “Swiss roll”: A simple technique for histological studies of the rodent intestine. Lab. Anim. 1981, 15, 57–59. [Google Scholar] [CrossRef]
  28. Mahe, M.M.; Aihara, E.; Schumacher, M.A.; Zavros, Y.; Montrose, M.H.; Helmrath, M.A.; Sato, T.; Shroyer, N.F. Establishment of Gastrointestinal Epithelial Organoids. Curr. Protoc. Mouse Biol. 2013, 3, 217–240. [Google Scholar] [CrossRef] [Green Version]
  29. Sato, T.; Vries, R.G.; Snippert, H.J.; van de Wetering, M.; Barker, N.; Stange, D.E.; van Es, J.H.; Abo, A.; Kujala, P.; Peters, P.J.; et al. Single Lgr5 stem cells build crypt-villus structures in vitro without a mesenchymal niche. Nature 2009, 459, 262–265. [Google Scholar] [CrossRef]
  30. Trachsel, C.; Panse, C.; Kockmann, T.; Wolski, W.E.; Grossmann, J.; Schlapbach, R. rawDiag: An R Package Supporting Rational LC-MS Method Optimization for Bottom-up Proteomics. J. Proteome Res. 2018, 17, 2908–2914. [Google Scholar] [CrossRef] [Green Version]
  31. Smyth, G.K. Linear models and empirical bayes methods for assessing differential expression in microarray experiments. Stat. Appl. Genet. Mol. Biol. 2004, 3, 3. [Google Scholar] [CrossRef] [PubMed]
  32. Wang, J.; Vasaikar, S.; Shi, Z.; Greer, M.; Zhang, B. WebGestalt 2017: A more comprehensive, powerful, flexible and interactive gene set enrichment analysis toolkit. Nucleic Acids Res. 2017, 45, W130–W137. [Google Scholar] [CrossRef] [PubMed]
  33. Zheng, W.; Aspelund, A.; Alitalo, K. Lymphangiogenic factors, mechanisms, and applications. J. Clin. Investig. 2014, 124, 878–887. [Google Scholar] [CrossRef]
  34. Barrowman, J.A.; Granger, D.N. Effects of experimental cirrhosis on splanchnic microvascular fluid and solute exchange in the rat. Gastroenterology 1984, 87, 165–172. [Google Scholar] [CrossRef]
  35. Oikawa, H.; Masuda, T.; Sato, S.; Yashima, A.; Suzuki, K.; Satodate, R. Changes in lymph vessels and portal veins in the portal tract of patients with idiopathic portal hypertension: A morphometric study. Hepatology 1998, 27, 1607–1610. [Google Scholar] [CrossRef]
  36. Ayabe, T.; Satchell, D.P.; Wilson, C.L.; Parks, W.C.; Selsted, M.E.; Ouellette, A.J. Secretion of microbicidal alpha-defensins by intestinal Paneth cells in response to bacteria. Nat. Immunol. 2000, 1, 113–118. [Google Scholar] [CrossRef]
  37. Wehkamp, J.; Salzman, N.H.; Porter, E.; Nuding, S.; Weichenthal, M.; Petras, R.E.; Shen, B.; Schaeffeler, E.; Schwab, M.; Linzmeier, R.; et al. Reduced Paneth cell alpha-defensins in ileal Crohn’s disease. Proc. Natl. Acad. Sci. USA 2005, 102, 18129–18134. [Google Scholar] [CrossRef] [PubMed] [Green Version]
  38. Teltschik, Z.; Wiest, R.; Beisner, J.; Nuding, S.; Hofmann, C.; Schoelmerich, J.; Bevins, C.L.; Stange, E.F.; Wehkamp, J. Intestinal bacterial translocation in rats with cirrhosis is related to compromised Paneth cell antimicrobial host defense. Hepatology 2012, 55, 1154–1163. [Google Scholar] [CrossRef]
  39. Adams, R.H.; Alitalo, K. Molecular regulation of angiogenesis and lymphangiogenesis. Nat. Rev. Mol. Cell Biol. 2007, 8, 464–478. [Google Scholar] [CrossRef]
  40. Partanen, T.A.; Arola, J.; Saaristo, A.; Jussila, L.; Ora, A.; Miettinen, M.; Stacker, S.A.; Achen, M.G.; Alitalo, K. VEGF-C and VEGF-D expression in neuroendocrine cells and their receptor, VEGFR-3, in fenestrated blood vessels in human tissues. FASEB J. Off. Publ. Fed. Am. Soc. Exp. Biol. 2000, 14, 2087–2096. [Google Scholar] [CrossRef]
  41. Ohtani, O.; Ohtani, Y. Lymph circulation in the liver. Anat. Rec. (Hoboken) 2008, 291, 643–652. [Google Scholar] [CrossRef] [PubMed]
  42. Petrova, T.V.; Mäkinen, T.; Mäkelä, T.P.; Saarela, J.; Virtanen, I.; Ferrell, R.E.; Finegold, D.N.; Kerjaschki, D.; Ylä-Herttuala, S.; Alitalo, K. Lymphatic endothelial reprogramming of vascular endothelial cells by the Prox-1 homeobox transcription factor. EMBO J. 2002, 21, 4593–4599. [Google Scholar] [CrossRef] [PubMed] [Green Version]
  43. Mäkinen, T.; Veikkola, T.; Mustjoki, S.; Karpanen, T.; Catimel, B.; Nice, E.C.; Wise, L.; Mercer, A.; Kowalski, H.; Kerjaschki, D.; et al. Isolated lymphatic endothelial cells transduce growth, survival and migratory signals via the VEGF-C/D receptor VEGFR-3. EMBO J. 2001, 20, 4762–4773. [Google Scholar] [CrossRef] [Green Version]
  44. Ribera, J.; Pauta, M.; Melgar-Lesmes, P.; Tugues, S.; Fernández-Varo, G.; Held, K.F.; Soria, G.; Tudela, R.; Planas, A.M.; Fernández-Hernando, C.; et al. Increased nitric oxide production in lymphatic endothelial cells causes impairment of lymphatic drainage in cirrhotic rats. Gut 2013, 62, 138–145. [Google Scholar] [CrossRef] [PubMed]
  45. Bannerman, D.D.; Goldblum, S.E. Mechanisms of bacterial lipopolysaccharide-induced endothelial apoptosis. Am. J. Physiol. Lung. Cell Mol. Physiol. 2003, 284, L899–L914. [Google Scholar] [CrossRef] [Green Version]
  46. Pulido, D.; Nogués, M.V.; Boix, E.; Torrent, M. Lipopolysaccharide neutralization by antimicrobial peptides: A gambit in the innate host defense strategy. J. Innate Immun. 2012, 4, 327–336. [Google Scholar] [CrossRef] [PubMed]
  47. Kerjaschki, D. The crucial role of macrophages in lymphangiogenesis. J. Clin. Investig. 2005, 115, 2316–2319. [Google Scholar] [CrossRef] [Green Version]
  48. Watari, K.; Nakao, S.; Fotovati, A.; Basaki, Y.; Hosoi, F.; Bereczky, B.; Higuchi, R.; Miyamoto, T.; Kuwano, M.; Ono, M. Role of macrophages in inflammatory lymphangiogenesis: Enhanced production of vascular endothelial growth factor C and D through NF-kappaB activation. Biochem. Biophys. Res. Commun. 2008, 377, 826–831. [Google Scholar] [CrossRef]
  49. Ogata, F.; Fujiu, K.; Matsumoto, S.; Nakayama, Y.; Shibata, M.; Oike, Y.; Koshima, I.; Watabe, T.; Nagai, R.; Manabe, I. Excess Lymphangiogenesis Cooperatively Induced by Macrophages and CD4(+) T Cells Drives the Pathogenesis of Lymphedema. J. Investig. Dermatol. 2016, 136, 706–714. [Google Scholar] [CrossRef] [Green Version]
  50. Tsuru, S.; Ito, Y.; Matsuda, H.; Hosono, K.; Inoue, T.; Nakamoto, S.; Kurashige, C.; Mishima, T.; Tsujikawa, K.; Okamoto, H.; et al. RAMP1 signaling in immune cells regulates inflammation-associated lymphangiogenesis. Lab. Investig. 2020, 100, 738–750. [Google Scholar] [CrossRef]
Figure 1. Intestinal phenotype of Math1Δintestine and control mice after tamoxifen injection. Representative images of intestinal sections. The presence of PCs is observed by positive lysozyme immunostaining stained brown. (A) Small intestine of Math1Δintestine mice and (B) small intestine of control mice. Black lines indicate 100 µm magnification (upper panels) or 50 µm magnification (lower panels), respectively. Abbreviations: Math1Δintestine, Paneth cell depleted; PCs, Paneth cells.
Biomedicines 10 01503 g001
Figure 2. Paneth cells alter the intestinal gene expression pattern after induction of experimental portal hypertension. Gene expression analysis of small intestinal tissue of sham-operated and PPVL mice with or without PCs. Read counts are presented as heatmaps using the top 20 dysregulated genes (lowest p-adj values) in the small intestine of control and Math1Δintestine under (A) basal conditions and (B) 14 days after PPVL. In the matrix view, the samples are represented in columns and the genes in rows. The color intensity represents the expression level, as shown in the legend. n = 4 per group. Abbreviations: Math1Δintestine, Paneth cell depleted; PCs, Paneth cells; PPVL, partial portal vein ligation; STRING, search tool for the retrieval of interacting genes/proteins; PPI, protein–protein interaction.
Biomedicines 10 01503 g002
Figure 3. The expression of lymphangiogenic genes in the small intestine is affected by PCs in response to portal hypertension. Bar graphs showing (A) RT2 PCR array mRNA expression of lymphangiogenic genes in the intestine of PPVL-Math1Δintestine vs. PPVL-control mice normalised to sham, and (B) RT-qPCR mRNA expression of specific lymphangiogenic genes in the intestine of PPVL-Math1Δintestine vs. PPVL-control mice normalised to corresponding sham. Abbreviations: Math1Δintestine, Paneth cell depleted; PCs, Paneth cells; PPVL, partial portal vein ligation; vs, versus; VEGFA, C, D, vascular endothelial growth factor A, C, D; NRP2, neuropilin-2; TIE1, 2, tyrosine kinase with immunoglobulin-like and EGF-like domains 1, 2; ANGPT2, angiopoietin 2; HGF, hepatocyte growth factor; TGFA, transforming growth factor α; FOXC2, forkhead box protein C2; VEGFR2, 3, vascular endothelial growth factor receptor 2, 3; PROX1, prospero homeobox 1; CXCL1, CXC motif chemokine ligand 1; ns, not significant. Data are expressed as mean ± SD. n = 5 per group. * p < 0.05; ** p < 0.005.
Biomedicines 10 01503 g003
Figure 8. Intestinal immune cell composition. Representative immunostaining images showing intestinal T lymphocytes (A,B) and macrophages (C,D) in ileum tissue sections from the different study groups. Black line indicates 20 µm magnification. Abbreviations: Math1Δintestine, Paneth cell depleted; PPVL, partial portal vein ligation; CD3, cluster of differentiation 3; ns, not significant. Data are expressed as mean ± SD. n = 3–5 per group. * p < 0.05; ** p < 0.005; **** p < 0.0001.
Biomedicines 10 01503 g008
Figure 9. Paneth cells favor intestinal lymphangiogenic responses during portal hypertension.
Biomedicines 10 01503 g009
Table 1. Differentially expressed gene detected in the comparison of sham control vs. sham Math1Δint.
Sham Control vs. Sham Math1Δint
S.No.Gene_IDMgi_Symbollog2 Fold Changep-adj
1ENSMUSG00000096499Ighv1-51.8130.002
Table 2. Differentially expressed genes detected in the comparison of PPVL control vs. PPVL Math1Δint.
PPVL Control vs. PPVL Math1Δint
S.No.Gene_IDMgi_Symbollog2 Fold Changep-adj
1ENSMUSG00000020407Upp11.3560.007
2ENSMUSG00000003355Fkbp111.2410.007
3ENSMUSG00000030659Nucb21.2220.007
4ENSMUSG00000053695Defb37−1.5980.007
5ENSMUSG00000025196Cpn1−1.6690.009
6ENSMUSG00000070427Il18bp1.4800.010
7ENSMUSG00000093394Gm20621−1.5980.011
8ENSMUSG00000000440Pparg−1.2420.013
9ENSMUSG00000040543Pitpnm3−1.3170.015
10ENSMUSG00000029417Cxcl91.4820.016
11ENSMUSG00000061825Ces2c−1.1470.018
12ENSMUSG00000095981Ighv10-11.5180.020
13ENSMUSG00000096727Psmb91.1950.023
14ENSMUSG00000074934Grem1−0.8020.026
15ENSMUSG00000079116Gm152931.3210.026
16ENSMUSG00000081769Gm122161.0800.026
17ENSMUSG00000004933Matk−1.4760.026
18ENSMUSG00000027514Zbp11.4670.026
19ENSMUSG00000079339Ifit1bl11.4760.026
20ENSMUSG00000055748Gsdmc4−1.4330.026
21ENSMUSG00000047844Bex4−1.4570.026
22ENSMUSG00000110639Gm6831−1.4600.026
23ENSMUSG00000067599Klra71.4280.026
24ENSMUSG00000032418Me1−1.4580.026
25ENSMUSG00000094662Defa361.3340.026
26ENSMUSG00000022216Psme10.7000.026
27ENSMUSG00000076633Ighv5-2−1.4330.027
28ENSMUSG00000035692Isg151.4210.027
29ENSMUSG00000056293Gsdmc2−1.3740.027
30ENSMUSG00000040808S100g−1.3540.027
31ENSMUSG00000046718Bst20.8920.027
32ENSMUSG00000068614Actc1−1.4140.030
33ENSMUSG00000022964Tmem50b0.4470.030
34ENSMUSG00000095328Defa-ps61.4220.031
35ENSMUSG00000035105Egln3−1.3160.031
36ENSMUSG00000094797Igkv6-151.3810.031
37ENSMUSG00000021730Hcn1−1.4150.031
38ENSMUSG00000078612Fyb2−1.3700.034
39ENSMUSG00000055827Gsdmc3−1.3360.034
40ENSMUSG00000076512Igkv9-1231.2250.034
41ENSMUSG00000039323Igfbp2−1.3880.036
42ENSMUSG00000022587Ly6e0.9530.036
43ENSMUSG00000020469Myl70.8720.036
44ENSMUSG00000025041Nt5c2−0.9530.036
45ENSMUSG00000026104Stat11.1330.036
46ENSMUSG00000030107Usp181.3040.036
47ENSMUSG00000098557Kctd12−1.1940.037
48ENSMUSG00000094687Defa251.2310.037
49ENSMUSG00000078853Igtp1.3720.037
50ENSMUSG00000028965Tnfrsf91.2390.037
51ENSMUSG00000052373Mpp3−1.3320.038
52ENSMUSG00000095565Ighv2-9-11.2940.041
53ENSMUSG00000027397Slc20a1−1.1940.043
54ENSMUSG00000030173Klra51.3490.043
55ENSMUSG00000018211Wfdc15b−1.2960.043
56ENSMUSG00000026981Il1rn−1.2780.046
57ENSMUSG00000050097Ces2b−1.3440.046
58ENSMUSG00000020319Wdpcp1.1680.046
59ENSMUSG00000024600Slc27a6−1.3060.048
60ENSMUSG00000054169Ceacam101.2880.048
61ENSMUSG00000046460Sh2d7−1.3330.049
62ENSMUSG00000029307Dmp1−1.3300.049
63ENSMUSG00000020571Pdia60.6090.049
Table 3. Major biological processes enriched for differentially expressed genes in the comparison of PPVL control vs. PPVL Math1Δintestine. Annotated = total number of genes in GO term; Significant = total number of differentially expressed genes in term (p-adj < 0.05).
GO.IDTermAnnotatedSignificantWeight01.Fisher
p-Value
Genes
GO:0071222Cellular response to lipopolysaccharide17750.00Cxcl9, Defa25, Gm15293, Il1rn, Stat1
GO:0061844Antimicrobial humoral immune response mediated by antimicrobial peptide5630.00Cxcl9, Defa25, Gm15293
GO:0042742Defense response to bacterium18550.00Defa25, Defb37, Gm15293, Isg15, Wfdc15b
GO:0046321Positive regulation of fatty acid oxidation1720.00Nucb2, Pparg
GO:0045648Positive regulation of erythrocyte differentiation2320.00Isg15, Stat1
GO:0051673Membrane disruption in other organism2520.00Defa25, Gm15293
GO:0002227Innate immune response in mucosa3120.00Defa25, Gm15293
GO:0072608Interleukin-10 secretion1220.01Isg15, Tnfrsf9
GO:0061326Renal tubule development8020.01Grem1, Stat1
GO:0042127Regulation of cell proliferation139380.01Bex4, Egln3, Grem1, Igfbp2, Matk, Pparg, Stat1, Tnfrsf9
GO:0019731Antibacterial humoral response3820.01Defa25, Gm15293
GO:0035458Cellular response to interferon-beta4520.01Igtp, Stat1
GO:0010742Macrophage derived foam cell differentiation2320.01Pparg, Stat1
GO:1900077Negative regulation of cellular response to insulin stimulus4020.01Nucb2, Pparg
GO:0090278Negative regulation of peptide hormone secretion5620.02Bst2, Isg15
GO:0051893Regulation of focal adhesion assembly5620.02Grem1, Wdpcp
GO:0034340Response to type I interferon3730.02Isg15, Stat1, Zbp1
Publisher’s Note: MDPI stays neutral with regard to jurisdictional claims in published maps and institutional affiliations.

