Abstract
DNA methylation modification plays a vital role in the pathophysiology of high blood pressure (BP). Herein, we applied three machine learning (ML) algorithms including deep learning (DL), support vector machine, and random forest for detecting high BP using DNA methylome data. Peripheral blood samples of 50 elderly individuals were collected three times at three visits for DNA methylome profiling. Participants who had a history of hypertension and/or current high BP measure were considered to have high BP. The whole dataset was randomly divided to conduct a nested five-group cross-validation for prediction performance. Data in each outer training set were independently normalized using a min–max scaler, reduced dimensionality using principal component analysis, then fed into three predictive algorithms. Of the three ML algorithms, DL achieved the best performance (AUPRC = 0.65, AUROC = 0.73, accuracy = 0.69, and F1-score = 0.73). To confirm the reliability of using DNA methylome as a biomarker for high BP, we constructed mixed-effects models and found that 61,694 methylation sites located in 15,523 intragenic regions and 16,754 intergenic regions were significantly associated with BP measures. Our proposed models pioneered the methodology of applying ML and DNA methylome data for early detection of high BP in clinical practices.
1. Introduction
High blood pressure (BP) is a leading risk factor for morbidity and mortality worldwide, causing a major public health challenge that demands interdisciplinary efforts [1]. It has been predicted that the global burden of hypertension will be around 1.6 billion by 2025, accounting for 29% of the world’s population [2]. According to a recent analysis of trends in hypertension prevalence, the number of adults aged from 30 to 79 years old with hypertension has doubled to nearly 1.3 billion in the last 30 years [3]. However, only 46.5% of people with high BP are aware of this problem until it has reached a dangerous level, because there are no warning signs or symptoms [4]. Prior work has estimated that less than 1 in 5 persons with hypertension is being monitored [1]. Existing evidence has indicated that early detection of high BP is an effective strategy for preventing and managing hypertension [5].
Clinically diagnosing suspected subjects as hypertension patients has been mostly performed at clinics using either a validated oscillometric upper-arm cuff or a calibrated auscultatory device, because these methods are convenient and the instruments used are cheap. In addition, they can be easily applied on a large scale. However, white-coat hypertension (i.e., elevated office BP but normal out-of-office BP) and masked hypertension (i.e., normal office BP but elevated out-of-office BP) could not be detected using these kinds of diagnosis methods. For such cases, applications of 24 h ambulatory BP and home BP monitoring are required to confirm the diagnosis clinically [4]. Wearing the device continuously for 24 h may cause discomfort and soreness to patients as well as a potential systemic bias related to a loose arm cuff at specific timepoints. Therefore, novel approaches of using biomarkers to assist early detection of high BP have received great attention in the past decade.
It is widely known that epigenetic modifications play an important role in the biological pathway of hypertension [6]. Among these modifications, DNA methylation is the best studied [7]. The DNA methylation process involves adding a methyl group to the cytosine base at a region including repeated cytosine-guanine bonds (CpG island). When a gene is heavily methylated, it tends to remain in a transcriptionally silent state. In response to environmental factors, methylation level can change dramatically [8]. Promoter CpG island (i.e., clusters of CpG sites located in the promoter) methylation is considered a potential type of biomarkers for disease detection, subtype classification, prognosis, and treatment response prediction [9].
Recent studies have discovered significant associations between DNA methylations and BP variations [7,8,10,11,12,13]. Han et al. [7] highlighted an important role of gene-specific DNA methylation in the pathogenesis of high BP in relation to angiotensin-converting enzyme [14], lipid and amino acid metabolism [15], and dysfunction of glucose metabolism [16]. A subsequent review has concluded that DNA methylation is an epigenetic mediator in the pathogenesis of systemic hypertension [8]. Richard et al. [10] identified 13 replicated CpG sites that could explain 1.4% and 2.0% of interindividual variations in systolic BP (SBP) and diastolic BP (DBP), respectively. More interestingly, emerging evidence has indicated that DNA methylation is significantly associated with lifestyle habits (e.g., smoking, drinking, and diet), aging, obesity, and sex, all of which are important risk factors for high BP [7]. Kim et al. [17] found the association between DNA methylation in peripheral blood leukocytes and prevalence of hypertension, indicating a potential of DNA methylation as a biomarker for high BP.
Machine learning (ML) has emerged to play a vital role in bioinformatics due to its ability to handle exponentially increasing amount of data [18]. Many researchers have applied ML to DNA data [19,20,21,22]. In particular, several applications of ML in epigenomics have assisted medical professionals and researchers to perform human disease-related tasks such as disease detection, subtype classification, prognosis, and treatment response prediction [23,24,25,26,27,28]. Given the success of existing ML models for detecting breast cancer [29,30], lung cancer [31], coarctation [32], concussion [33], and schizophrenia [34], we proposed DNA methylome-based predictive models using three common ML algorithms including deep learning (DL), random forest (RF), and support vector machine (SVM) for high BP prediction in this study.
2. Materials and Methods
2.1. Study Participants
DNA methylome and BP data were obtained from 50 elderly individuals approved for this study among 60 elderly individuals who participated in a previous randomized crossover trial study [35]. They were all at least 60 years old without having any medical history for heart diseases, cancer, liver diseases, and endocrine diseases.
Details about our study design were described in a previous publication [35]. In brief, participants were asked to visit the study site three times, at one-week intervals. At each visit, their blood samples were collected and their BPs were measured twice after they stayed in a sedentary position for ≥ 10 min using an automatic sphygmomanometer (HEM-780: Omron, Kyoto, Japan) with a standard cuff. If the two measurements differed by ≥ 5 mmHg, a third measurement was performed to ensure the reliability of results. Means of measurements were used for analysis. Participants were considered to have high BP if they met at least one of the following criteria: (1) a history of hypertension diagnosed, (2) SBP ≥ 140 mmHg, and (3) DBP ≥ 90 mmHg.
2.2. DNA Methylome Level Measurements
A total of 150 blood samples were stored for DNA methylome profiling using an Illumina Infinium HumanMethylation450 BeadChip in accordance with the manufacturer’s protocol (Illumina Inc., San Diego, CA, USA). In brief, the quality of each DNA sample was initially checked using a NanoDrop® ND-1000 UV-Vis Spectrophotometer. Qualified DNA samples (500 ng) were then bisulfite-converted using a Zymo EZ DNA methylation kit. They were then amplified and hybridized for BeadChips. Subsequently, fluorescently stained BeadChips were scanned by Illumina iScan scanner following standard Illumina procedures (iScanTM System, https://sapac.illumina.com/systems/ array-scanners/iscan.html). Image intensities were extracted using Illumina’s GenomeStudio software version 2011.1 (methylation model version 1.9.0) (Illumina Korea, Seoul, Korea). Eventually, the methylation level of each CpG site was calculated as a ratio of methylation intensity to total methylation and unmethylation intensities.
Because of varying characteristics between two types of assays simultaneously used in the Infinium HumanMethylation450 array, a sequence of cleaning methods for DNA methylation data were applied according to the manufacturer’s suggestions to reduce a systemic bias, as follows (Infinium® HumanMethylation450 BeadChip, Illumina, Inc., San Diego, CA, USA):
Within-array normalization: Raw data were background-corrected and then dye-bias equalized using Methylumi [36] and Lumi [37] packages in R, respectively.
Filtering: To reduce threats of artifactual data, CpG sites with detection p-values (hereafter p-values) ≥ 0.05 displaying in at least 25% of all samples were filtered out [38]. In further details, the p-value was generated for every CpG site in every sample to evaluate the magnitude of the signal by comparing the total signal level (i.e., sum of unmethylated intensity and methylated fluorescent intensity) with the background signal level, which was estimated using negative control probes. A smaller p-value indicated a more reliable signal, while a high p-value indicated a low-quality signal. Additionally, CpG sites with missing values in at least one sample and CpG sites on X or Y chromosome were excluded to ensure a strict dataset and to avoid a potential gender-specific bias of the dataset, respectively.
Between-array normalization: Filtered data were normalized with beta-mixture quantile dilation method that could adjust -values of type II assay into a statistical distribution characteristic of type I assay using a three-state beta-mixture model [39].
2.3. Nested Cross-Validation
Because of a small sample size, we applied a nested cross-validation (CV) to estimate an unbiased generalization performance. The dataset was initially divided into five groups, with roughly the same ratio (1.4:1) of those with high BP to those without high BP using a random split. To avoid biological bias due to a participant being sampled three times, data obtained from the same participant were allocated in the same group. In other words, each group consisted of 10 participants with 30 samples.
There was a total of five outer CVs. In an outer CV, when a group was used as a test set for estimating prediction results (i.e., outer test set), the four remaining groups (i.e., outer training set), which constructed an inner loop CV, were used for hyperparameter tuning. Of these four groups, one was subsequently used as inner test set and the remaining three groups were used as inner training set. The optimal model for each outer CV was selected based on its performance on the inner test set.
2.4. DNA Methylome Data Preprocessing
To avoid data leakage, we performed preprocessing using data obtained from 120 samples in the outer training sets of each outer CV separately. After normalizing DNA methylome data using a min–max scaler, we reduced the dimensionality of the data using principal component analysis (PCA), a simple unsupervised method that could find a low-dimensional representation (i.e., principal components) of the input data on condition that as much of the information as possible was captured [40].
2.5. Predictive Models
Three common supervised ML algorithms including DL, RF, and SVM were developed for high BP prediction in Python 3.9 using PyTorch, Numpy, Scikit-learn, and Pandas. The code of our study is publicly available in Github (https://github.com/lehoanglong95/high_blood_pressure_prediction, accessed on 27 February 2022).
Among DL architectures, a multi-layer perceptron (MLP) composed of an input layer, multiple hidden layers, and an output layer was proposed. Specifically, input nodes represented CpG sites that were significantly associated with high SBP and/or high DBP, whereas a binary variable in the output layer indicated the presence or the absence of a high BP. In the hidden and output layers, two common activation functions, the rectified linear unit (ReLU) [41] and the sigmoid function [42], were employed in the same order. The ReLU was used to convert all negative values to zero with the positive values remaining between layers, whereas the sigmoid function was used to generate values from 0 to 1. A threshold of 0.5 was then applied to obtain binary values. We utilized a binary cross-entropy loss function and Adam optimizer, an algorithm for stochastic optimization known to be straightforward to implement, which is computationally efficient, and which requires little memory and little tunning of hyperparameters to optimize the model parameters [43]. The initial learning rate was . Other hyperparameters were β1 = 0.9, β2 = 0.999, and ε = . To optimize the learning process, the learning rate was reduced by 10 times every 75 epochs. Batch size was set to be 5. Batch normalization was also utilized in the proposed DL models. After training procedure, optimal DL models achieving the lowest loss on the inner test sets were evaluated using the outer test sets.
RF is a supervised learning algorithm that can randomly create a great number of relatively uncorrelated decision trees at the training stage [40]. In a classification task, as each tree generates a class prediction, RF selects the class with the highest number of votes as the final prediction result. Our proposed RF was constructed with 100 trees. Each tree had the maximum depth of 100. As for SVM, we used linear kernel to construct hyperplanes in a multidimensional space, which allowed us to classify the output into having or not having a high BP [44].
2.6. Model Evaluation
Due to the small sample size, performances of the proposed models were assessed using the area under the receiver operator characteristics curve (AUROC), the area under the precision-recall curve (AUPRC), accuracy (i.e., evaluated overall classification performance), and F1-score Micro Average calculated by counting sums of True Positives, False Negatives, and False Positives across all classes (i.e., weighted the sensitivity and precision of the model evenly) [45].
For each predictive model, we calculated means and standard deviations for each evaluation metric using performance with five outer test sets. To make straight comparisons between predictive results of three models, we applied a multiple paired t-test using R version 4.1.2 (https://www.r-project.org/, accessed on 27 February 2022) with significance level set at p-value < 0.05.
2.7. Functional Analyses
To confirm the reliability of using DNA methylome as biomarkers for high BP, we constructed two mixed-effects models and evaluated the associations between DNA methylation level and SBP and/or DBP measures. In both models, potential confounding factors were selected in an a priori manner. Finally, age, sex, body mass index, sequence of visit, visit date, a history of hypertension, and a history of diabetes were adjusted. SAS version 9.4 (SAS Institute Inc., Cary, NC, USA) was used for statistical analyses with significance level set at p-value < 0.05.
CpG sites that showed significant associations with SBP and/or DBP were mapped with target genes using the manufacturer’s database (Illumina, Inc., San Diego, CA, USA). Next, the gene list was uploaded to DAVID Bioinformatics Resources 6.8 (https://david-d.ncifcrf.gov/, accessed on 27 February 2022) to discover disease classes regulated by target genes. Afterwards, we constructed a functional network to visualize associations between genes and high BP-related diseases using DisGeNet version 7.0 (Integrative Biomedical Informatics Group, Barcelona, Spain) (https://www.disgenet.org/, accessed on 27 February 2022) and Cytoscape version 3.9.0 (U.S. National Institute of General Medical Sciences, Bethesda, MD) (https://cytoscape.org/, accessed on 27 February 2022).
3. Results
3.1. Study Participants
Main characteristics and BP measurements of 50 participants are presented in Table 1. The majority (n = 47, 94%) of participants were non-smoking females. Those who were overweight and/or obese (body mass index ≥ 25 kg/m2) accounted for 50%. Twenty-six (52%) and forty-two (84%) participants had a history of hypertension and diabetes, respectively. Among 150 BP measures obtained from 50 participants, 48 (32%) and 31 (20.7%) SBP measures were elevated (130–139 mmHg) and high (≥140 mmHg), respectively, while 125 (83.3%) DBP measures were normal (<85 mmHg). According to classification criteria described above, 58% of BP measures were considered high BP.

Table 1.
Information about study participants.
3.2. Predictive Models for High BP Detection
Hyperparameters of optimal DL models selected based on their performances with the inner test sets are presented in Table S1. Performances of three proposed models with the outer test sets are summarized in Figure 1. Overall, DL significantly outperformed RF and SVM based on AUPRC and accuracy (mean ± SD) (for DL, AUPRC = 0.65 ± 0.06 and accuracy = 0.69 ± 0.05; for RF, AUPRC = 0.55 ± 0.13 and accuracy = 0.62 ± 0.06; for SVM, AUPRC = 0.47 ± 0.09 and accuracy = 0.55 ± 0.09; p < 0.05). There were significant differences in AUROC and F1-score Micro Average between DL and SVM (mean ± SD) (for DL, AUROC = 0.73 ± 0.07 and F1-score = 0.73 ± 0.05; for SVM, AUROC = 0.58 ± 0.10 and F1-score = 0.62 ± 0.10; p < 0.05).
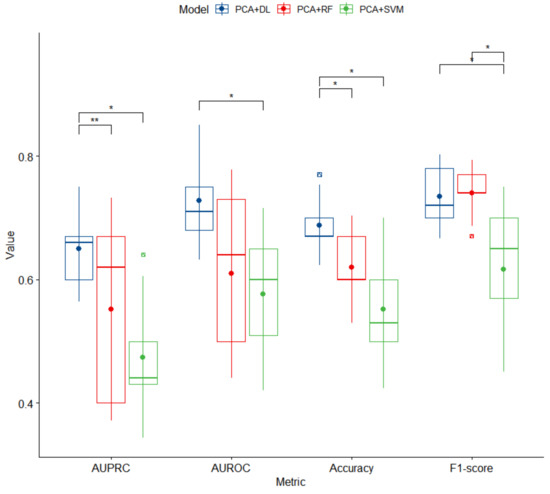
Figure 1.
Box plots of performance of three proposed models for high BP prediction. PCA, principal component analysis; DL, deep learning; RF, random forest; SVM, support vector machine; AUPRC, area under the precision-recall curve; AUROC, area under the receiver operator characteristics curve. An asterisk (*) denotes a significant difference with p-value < 0.05. A double asterisk (**) denotes a significant difference with p-value < 0.005.
3.3. CpG Sites Significantly Associated with High BP
There were 37,610 and 40,530 CpG sites significantly associated with SBP and DBP, respectively. Of these, 16,446 CpG sites were significantly associated with both SBP and DBP as presented in the Venn Diagram (Figure S1). We identified DNA methylation at 61,694 CpG sites showing significant associations with SBP and/or DBP located in 15,523 intragenic regions and 16,754 intergenic regions.
Among 15,523 genes, 9154 were found to be significantly related to 12 disease classes in DAVID Bioinformatics Resources 6.8 database (Figure 2), including 3169 (34.6%) genes involved in the regulation of cardiovascular diseases (Table S2). We found that 564 genes were significantly related to hypertension (Table S2). Comprehensive gene ontology in terms of biological process, cellular component, and molecular function as well as KEGG pathway for a total of 15,523 target genes can be found in Figure S2.
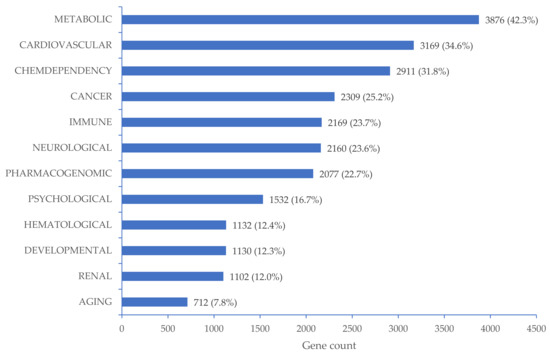
Figure 2.
Disease classes related to 9154 target genes mapped with CpG sites significantly associated with high BP. The percentages were calculated as the number of target genes that regulated the corresponding disease class divided by 9154 target genes that regulated all related disease classes.
Among 1037 genes showing significant relationships with high BP-related diseases in the DisGeNet database, 15 genes (NOS3, GNAS, IER3, EDNRA, DRD2, HRH3, NOX4, IGF1, SCNN1G, PLAT, HDAC4, PRKG1, KCNMA1, FOXO1, and EIF2AK4) were classified as significant biomarker genes for high BP-related diseases (Table S2). Detailed relationships between 15 biomarker genes and target diseases are visualized in Figure 3. There was strong evidence indicating that NOS3 was a reliable biomarker for hypertensive diseases, followed by IGF1, NOX4, GNAS, IER3, EDNRA, DRD2, HRH3, SCNN1G, and PLAT. NOS3 was also considered a biomarker for pulmonary, essential, and pregnancy-associated hypertension. EIF2AK4 significantly regulated the pulmonary hypertension-related disease class. Biomarker genes for pulmonary hypertension included PRKG1, KCNMA1, FOXO1, and NOS3. There were significant relationships between HDAC4 and two specific types of pulmonary hypertension: familial primary pulmonary hypertension and idiopathic pulmonary arterial hypertension.
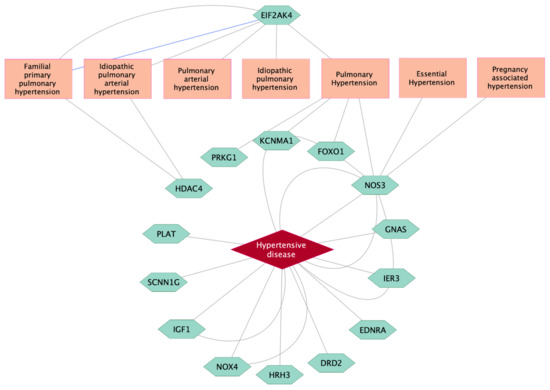
Figure 3.
Target genes as significant biomarkers for high BP-related diseases using a curated database in the DisGeNet platform. Grey lines link gene expression biomarkers for target disease, while blue line links genetic variation for target disease.
Table S3 shows detailed mapping information as well as estimation of magnitude of associations between significant CpG sites and BP measures. There were 140 significant CpG sites located in 15 biomarker genes for high BP-related diseases found in DisGeNet platform (Table S3). Because there might be multiple CpG sites located in a downstream target gene, for each biomarker gene, we selected a corresponding CpG site with the strongest association with BP (i.e., the biggest absolute value of the estimation) and/or significantly associated with both SBP and DBP measures with p-value < 0.05 to present in Table 2. Except for cg16655193 located in IGF1, which was negatively associated with only SBP along with a set of CpG sites that were positively associated with only DBP (cg03573792, cg18899064, and cg18248586, respectively located in EDNRA, PLAT, and DRD2), all remaining CpG sites were significantly associated with both SBP and DBP measures (p < 0.05). It was found that cg20203971 in HDAC4 (for SBP, estimate = 443.9, p < 0.001; for DBP, estimate = 205.5, p < 0.001) and cg04956913 in IER3 (for SBP, estimate = –413.3, p = 0.011; for DBP, estimate = –202.1, p = 0.023) showed the strongest positive and negative associations with BP, respectively.
Table 2.
Estimated associations between BP measures and the most significant CpG sites mapped with biomarker genes for high BP.
4. Discussion
Given an increasing burden of hypertension worldwide [46], there have been great efforts made towards the early detection of the “silent killer” following advancements of ML. The performance of our proposed DNA methylome-based DL model was comparable to those of some existing predictive models for high BP using demographic, lifestyle, and biochemical data [47,48,49,50,51]. For example, compared with the latest MLP for hypertension prediction developed by López-Martínez et al. [51], which achieved an accuracy of 0.73, a recall of 0.40, a precision of 0.58, an F1-score of 0.47, and an AUROC of 0.77 using data obtained from the National Health and Nutrition Examination Survey from 2007 to 2016 with 24,434 participants, our proposed MLP was slightly better, with an accuracy of 0.69, a recall of 0.77, a precision of 0.72, an F1-score of 0.73, and an AUROC of 0.73. However, it could be inappropriate to make a direct comparison between the two models using different input data. Indeed, all existing models used demographic characteristics (e.g., age, gender, employment, education level), lifestyle (e.g., physical activity, tobacco use, alcohol use, dietary habit), and biochemical parameters (e.g., total cholesterol, lipoprotein, triglyceride levels) as input data [47,48,49,50,51], while our study was the first to take advantage of DNA methylation data as biomarkers for high BP detection. A significant upside of demographic, lifestyle, and biochemical data is that they are easier, more convenient, and cheaper to be collected, leading to very large datasets. By contrast, our dataset is quite small because it is expensive and complex to obtain DNA methylation levels. Limited and imbalanced data of 150 samples obtained from only 50 participants posed a challenge for developing ML models, especially DL. Although the contribution of the first type of input data to mechanism of development of hypertension remains unclear, DNA methylome data could be highly sensitive and biologically explained, making it widely considered as novel biomarkers for hypertension [17]. Furthermore, public databases of demographic and clinical data might have several limitations [49]. First, as such datasets often provide standardized data only, a shortage of raw data related to key demographic factors could limit numbers of valuable factors for training predictive models. Second, adjustments for patient data (e.g., performing up to three biochemical measures per patient for cross-checking) might increase input nodes, thus increasing processing time. Interestingly, recent studies have found that DNA methylome can be potentially used as biomarkers not only for hypertension, but also for a wide range of non-communicable diseases such as cancer [52] and type 2 diabetes [53]. Our predictive models pioneered a comprehensive approach for assisting clinical practices using only a blood sample to obtain DNA methylome data for multiple disease prediction at a time. Nevertheless, we adjusted for potential confounding factors selected in an a priori manner in the mixed-effects models to confirm the reliability of using DNA methylome as biomarkers for high BP and found 15,523 intragenic regions showing significant associations with SBP and/or DBP. Among 15,523 intragenic regions, 3169 regions involved in the regulation of cardiovascular diseases, with 564 significantly related to hypertension. However, the significant relationships with cardiovascular diseases including hypertension disappeared when those potential confounding factors were not adjusted (data not shown here). From the results, we could expect that the integration of those potential confounding factors in the model yielded better accuracy. Nevertheless, 0.73 in AUROC found in our study was still quite low in general, and thus in the future, we need to find additional confounding factors and integrate those to use as fully automated pipelines for the task at hand.
Among DNA methylome-based ML models for high BP prediction proposed in this study, we found that DL outperformed RF and SVM overall, consistent with results obtained from a previous study conducted by Ture et al. [50] who compared performances of four statistical algorithms, three decision trees, and two neural networks in terms of sensitivity, specificity, and predictive rate and concluded that MLP yielded better results than all other techniques. Despite its superior performance, the black-box nature of DL remains a question. Little has been known about the contribution of each CpG site to the prediction results, posing a lack of interpretability. In our study, the biggest limitation was the very small sample size, as it might limit learning ability of predictive models. Furthermore, we could not stratify our subjects according to sex and smoking status because of small sample size. If the sample size became larger, the variations in machine learning models could be smaller and it could lead to better test performance. Moreover, a larger sample size will uncover the functional and causal relationships between DNA methylation and BP [10]. Furthermore, because of limited statistical power due to the relatively small sample size in our study, our analyses results need to be reconfirmed through replication in another sample of Koreans [12]. In addition, less computationally demanding methods, for example, logistic regression, naive Bayes, and stochastic gradient descent, could sometimes outperform more vaunted tools in the dimensionality reduction step. Therefore, future research should be conducted considering stratification by several factors such as sex and smoking status, using various dimensionality reduction methods with a larger dataset. It is worth noting that thanks to the availability of cancer-related data provided by open-access databases such as The Cancer Genome Atlas (TCGA) [54] and the Gene Expression Omnibus (GEO) [55], a wide range of predictive models focusing on predicting cancer (e.g., breast cancer, lung cancer, liver hepatocellular carcinoma, and kidney clear cell carcinoma) using DNA methylome data have been successfully developed [29,30,31,56,57]. This indicates that the limited data issue can be addressed with an establishment of similar databases for hypertension.
Our findings from functional analyses can strengthen the application of DNA methylome as biomarkers for high BP. The list of CpG sites showing significant associations with BP in mixed-effects models covered existing DNA methylation biomarkers in hypertension [7,58]. Such DNA methylation sites primarily participated in regulating hypertension via three biological pathways related to the etiology of hypertension, including renin-angiotensin-aldosterone system (RAAS), renal sodium retention system, and sympathetic nervous system. While the first pathway is well known to be involved in hypertension occurrence [59], the other two pathways are mostly involved in hypertension pathogenesis and pathophysiology [60,61]. As a key enzyme in the RAAS, angiotensin-converting enzyme (ACE) plays an important role in BP regulation [59]. In line with results obtained from a previous study conducted by Rangel et al. [62], we found inverse associations of DNA methylation (cg19354750 and cg23524341) with ACE activity, SBP, and DBP. Hypomethylation of the angiotensinogen gene (AGT) promoter can activate AGT expression in adipose-induced hypertension [63]. Three CpG sites (cg07502417, cg01083716, and cg24474852) were discovered to be significantly associated with SBP in our analyses. Among three subunits composing adducin (ADD), a mutation of the α-subunit encoded by ADD1 can lead to an increase in renal sodium reabsorption, subsequently causing hypertension [64]. ADD1 also directly participates in the pathophysiology of hypertension [64]. Lower ADD1 promoter DNA methylation has been found to be related to higher risk of essential hypertension [15]. Among CpG islands located in ADD1 gene promoter, cg03889700 was found to be negatively associated with DBP in our analysis.
With regard to 15 biomarker genes for high BP-related diseases found in DisGeNet database, CpG sites located in IER3 (cg00687252, cg27545367, and cg04956913) and PRKG1 (cg15583492, cg05867154, cg11486694, and cg06976598) were all negatively associated with BP, while CpG sites located in PLAT (cg18899064) and DRD2 (cg18248586) were positively associated with BP. Arlt and Schäfer [65] indicated that the ablation of IER3 can induce changes in BP control and hypertension in mice. However, little is known about their association in humans. PRKG1 plays a vital role in regulating the contractility of vascular smooth cell as well as nitric oxide signaling in cardiovascular homeostasis [66]. PRKG1 deficiency can result in pulmonary hypertension via the activation of Rho A/Rho kinase signaling pathway [67]. For the remaining biomarker genes, there were both positive and negative CpG sites in relation to BP. Based on the magnitude of the estimation, the strongest positive association was found between cg20203971 located in HDAC4 and SBP, while the strongest negative association was found between cg01995660 located in FOXO1 and SBP. Both genes were found to be significantly associated with pulmonary-related hypertension in DisGeNet database. In further detail, Usui et al. [68] indicated that in spontaneous hypertensive rats, HDAC4 can induce proinflammatory responses, which might mediate the development of hypertension. It has been found that FOXO1 can control BP via its regulation of angiotensinogen and angiotensin II [69].
Compared with 13 CpG sites identified in a previous study for BP regulation [10], we found a consistent result for cg17061862 located in the intergenic region of chromosome 11, which was positively associated with both SBP and DBP in the present study. Differences in associations between 12 remaining CpG sites and BP could be attributable to characteristics of participants. Richard et al. [10] recruited 17,010 individuals of African American, European, and Hispanic ancestry, while our study participants were elderly Korean people. Although the robustness of our analyses was confirmed by consistent evidence in DAVID Bioinformatics Resources 6.8 and DisGeNet databases, we were only able to determine the existence of associations. Future studies with larger cohorts of Korean population are needed to confirm whether DNA methylation status at CpG sites discovered in the present study could affect BP measures.
5. Conclusions
This is the first study to propose ML-based approaches to take advantage of DNA methylation level to predict high BP. Our analyses discovered 61,694 methylation sites located in 15,523 intragenic regions and 16,754 intergenic regions significantly associated with BP measures and confirmed the reliability of using DNA methylome as a biomarker for high BP. Among three ML algorithms, DL achieved the highest performance with the test set, showing AUROC, AUPRC, accuracy, and F1-score of 0.73, 0.65, 0.69, and 0.73, respectively. These results were comparable to performances of existing predictive models for high BP using demographic, lifestyle, and biochemical data, suggesting the potential applicability of a DNA methylome-based DL model in clinical practices for hypertension management.
Supplementary Materials
The following supporting information can be downloaded at: https://www.mdpi.com/article/10.3390/biomedicines10061406/s1, Figure S1: Numbers of CpG sites significantly associated with SBP and DBP measures, Figure S2: Gene ontology and KEGG pathways related to 15523 target genes mapped with CpG sites significantly associated with BP measures, Table S1: Hyperparameters of the optimal DL model for each outer CV, Table S2: Comparisons between genes mapped with CpG sites significantly associated with BP and genes regulating high BP in DAVID Bioinformatics Resources 6.8 and DisGeNet databases, Table S3: Estimated associations between significant CpG sites and BP measures.
Author Contributions
Conceptualization, T.M.N.; Funding acquisition, J.H.K.; Methodology, T.M.N. and H.L.L.; Supervision, J.H.K.; Validation, K.-B.H.; Visualization, T.M.N.; Writing—original draft, T.M.N.; Writing—review and editing, Y.-C.H. and J.H.K. All authors have read and agreed to the published version of the manuscript.
Funding
This research was funded by the Ministry of Education, Republic of Korea, grant number 2019R1I1A2A01050001.
Institutional Review Board Statement
The study was conducted according to the guidelines of the Declaration of Helsinki, and approved by the Institutional Review Board at College of Medicine, Seoul National University (C-1312-027-539) and at Sejong University (SJU-HR-E-2019-004).
Informed Consent Statement
Informed consent was obtained from all subjects involved in the study.
Data Availability Statement
The datasets analyzed during the current study are not publicly available due to protection of participant confidentiality but are available from the corresponding author on reasonable request with assurances and plans in place to protect confidentiality.
Conflicts of Interest
The authors declare no conflict of interest. The funders had no role in the design of the study; in the collection, analyses, or interpretation of data; in the writing of the manuscript, or in the decision to publish the results.
References
- World Health Organization. A Global Brief on Hypertension: Silent Killer, Global Public Health Crisis: World Health Day 2013; World Health Organization: Geneva, Switzerland, 2013. [Google Scholar]
- Kearney, P.M.; Whelton, M.; Reynolds, K.; Muntner, P.; Whelton, P.K.; He, J. Global burden of hypertension: Analysis of worldwide data. Lancet 2005, 365, 217–223. [Google Scholar] [CrossRef]
- NCD Risk Factor Collaboration. Worldwide trends in hypertension prevalence and progress in treatment and control from 1990 to 2019: A pooled analysis of 1201 population-representative studies with 104 million participants. Lancet 2021, 398, 957–980. [Google Scholar] [CrossRef]
- Oparil, S.; Acelajado, M.C.; Bakris, G.L.; Berlowitz, D.R.; Cífková, R.; Dominiczak, A.F.; Grassi, G.; Jordan, J.; Poulter, N.R.; Rodgers, A.; et al. Hypertension. Nat. Rev. Dis. Primers 2018, 4, 18014. [Google Scholar] [CrossRef] [PubMed] [Green Version]
- Gulec, S. Early diagnosis saves lives: Focus on patients with hypertension. Kidney Int. Suppl. 2013, 3, 332–334. [Google Scholar] [CrossRef] [PubMed] [Green Version]
- Wang, J.; Gong, L.; Tan, Y.; Hui, R.; Wang, Y. Hypertensive epigenetics: From DNA methylation to microRNAs. J. Hum. Hypertens. 2015, 29, 575–582. [Google Scholar] [CrossRef] [PubMed]
- Han, L.; Liu, Y.; Duan, S.; Perry, B.; Li, W.; He, Y. DNA methylation and hypertension: Emerging evidence and challenges. Brief Funct. Genomics 2016, 15, 460–469. [Google Scholar] [CrossRef] [PubMed] [Green Version]
- Liang, M. Epigenetic mechanisms and hypertension. Hypertension 2018, 72, 1244–1254. [Google Scholar] [CrossRef]
- Jung, M.; Pfeifer, G.P. CpG Islands. In Brenner’s Encyclopedia of Genetics, 2nd ed.; Maloy, S., Hughes, K., Eds.; Academic Press: San Diego, CA, USA, 2013; pp. 205–207. [Google Scholar] [CrossRef]
- Richard, M.A.; Huan, T.; Ligthart, S.; Gondalia, R.; Jhun, M.A.; Brody, J.A.; Irvin, M.R.; Marioni, R.; Shen, J.; Tsai, P.C.; et al. DNA methylation analysis identifies loci for blood pressure regulation. Am. J. Hum. Genet. 2017, 101, 888–902. [Google Scholar] [CrossRef] [Green Version]
- Kato, N.; Loh, M.; Takeuchi, F.; Verweij, N.; Wang, X.; Zhang, W.; Kelly, T.N.; Saleheen, D.; Lehne, B.; Leach, I.M.; et al. Trans-ancestry genome-wide association study identifies 12 genetic loci influencing blood pressure and implicates a role for DNA methylation. Nat. Genet. 2015, 47, 1282–1293. [Google Scholar] [CrossRef]
- Kazmi, N.; Elliott, H.R.; Burrows, K.; Tillin, T.; Hughes, A.D.; Chaturvedi, N.; Gaunt, T.R.; Relton, C.L. Associations between high blood pressure and DNA methylation. PLoS ONE 2020, 15, e0227728. [Google Scholar] [CrossRef] [Green Version]
- Breton, C.V.; Yao, J.; Millstein, J.; Gao, L.; Siegmund, K.D.; Mack, W.; Whitfield-Maxwell, L.; Lurmann, F.; Hodis, H.; Avol, E.; et al. Prenatal air pollution exposures, DNA methyl transferase genotypes, and associations with newborn LINE1 and Alu methylation and childhood blood pressure and carotid intima-media thickness in the children’s health study. Environ. Health Perspect. 2016, 124, 1905–1912. [Google Scholar] [CrossRef] [Green Version]
- Riviere, G.; Lienhard, D.; Andrieu, T.; Vieau, D.; Frey, B.M.; Frey, F.J. Epigenetic regulation of somatic angiotensin-converting enzyme by DNA methylation and histone acetylation. Epigenetics 2011, 6, 478–489. [Google Scholar] [CrossRef] [Green Version]
- Zhang, L.N.; Liu, P.P.; Wang, L.; Yuan, F.; Xu, L.; Xin, Y.; Fei, L.J.; Zhong, Q.L.; Huang, Y.; Xu, L.; et al. Lower ADD1 gene promoter DNA methylation increases the risk of essential hypertension. PLoS ONE 2013, 8, e63455. [Google Scholar] [CrossRef]
- Fan, R.; Wang, W.J.; Zhong, Q.L.; Duan, S.W.; Xu, X.T.; Hao, L.M.; Zhao, J.; Zhang, L.N. Aberrant methylation of the GCK gene body is associated with the risk of essential hypertension. Mol. Med. Rep. 2015, 12, 2390–2394. [Google Scholar] [CrossRef] [Green Version]
- Kim, M.; Long, T.I.; Arakawa, K.; Wang, R.; Yu, M.C.; Laird, P.W. DNA Methylation as a biomarker for cardiovascular disease risk. PLoS ONE 2010, 5, e9692. [Google Scholar] [CrossRef] [Green Version]
- Kumar, I.; Singh, S.P. Chapter 26: Machine learning in bioinformatics. In Bioinformatics; Singh, D.B., Pathak, R.K., Eds.; Academic Press: Cambridge, MA, USA, 2022; pp. 443–456. [Google Scholar]
- Casey, R.; Adelfio, A.; Connolly, M.; Wall, A.; Holyer, I.; Khaldi, N. Discovery through Machine Learning and Preclinical Validation of Novel Anti-Diabetic Peptides. Biomedicines 2021, 9, 276. [Google Scholar] [CrossRef]
- Tonkovic, P.; Kalajdziski, S.; Zdravevski, E.; Lameski, P.; Corizzo, R.; Pires, I.M.; Garcia, N.M.; Loncar-Turukalo, T.; Trajkovik, V. Literature on applied machine learning in metagenomic classification: A scoping review. Biology 2020, 9, 453. [Google Scholar] [CrossRef]
- Hsu, C.-W.; Tsai, S.-Y.; Wang, L.-J.; Liang, C.-S.; Carvalho, A.F.; Solmi, M.; Vieta, E.; Lin, P.-Y.; Hu, C.-A.; Kao, H.-Y. Predicting serum levels of lithium-treated patients: A supervised machine learning approach. Biomedicines 2021, 9, 1558. [Google Scholar] [CrossRef]
- Kaufmann, J.; Asalone, K.; Corizzo, R.; Saldanha, C.; Bracht, J.; Japkowicz, N. One-class ensembles for rare genomic sequences identification. In Proceedings of the 23rd International Conference on Discovery Science, Thessaloniki, Greece, 19–21 October 2020; Volume 12323, pp. 340–354. [Google Scholar] [CrossRef]
- Arslan, E.; Schulz, J.; Rai, K. Machine learning in epigenomics: Insights into cancer biology and medicine. Biochim. Biophys. Acta (BBA) 2021, 1876, 188588. [Google Scholar] [CrossRef]
- Brasil, S.; Neves, C.J.; Rijoff, T.; Falcao, M.; Valadao, G.; Videira, P.A.; Dos Reis Ferreira, V. Artificial intelligence in epigenetic studies: Shedding light on rare diseases. Front Mol. Biosci. 2021, 8, 648012. [Google Scholar] [CrossRef]
- Rauschert, S.; Raubenheimer, K.; Melton, P.E.; Huang, R.C. Machine learning and clinical epigenetics: A review of challenges for diagnosis and classification. Clin. Epigenetics 2020, 12, 51. [Google Scholar] [CrossRef] [Green Version]
- Holder, L.B.; Haque, M.M.; Skinner, M.K. Machine learning for epigenetics and future medical applications. Epigenetics 2017, 12, 505–514. [Google Scholar] [CrossRef] [Green Version]
- Fan, S.; Chen, Y.; Luo, C.; Meng, F. Machine learning methods in precision medicine targeting epigenetic diseases. Curr. Pharm. Des. 2018, 24, 3998–4006. [Google Scholar] [CrossRef]
- Iesato, A.; Nucera, C. Role of regulatory non-coding RNAs in aggressive thyroid cancer: Prospective applications of neural network analysis. Molecules 2021, 26, 3022. [Google Scholar] [CrossRef]
- Del Amor, R.; Colomer, A.; Monteagudo, C.; Naranjo, V. A deep embedded refined clustering approach for breast cancer distinction based on DNA methylation. Neural. Comput. Appl. 2021. [Google Scholar] [CrossRef]
- Si, Z.; Yu, H.; Ma, Z. Learning deep features for DNA methylation data analysis. IEEE Access 2016, 4, 2732–2737. [Google Scholar] [CrossRef]
- Duan, X.R.; Yang, Y.L.; Tan, S.J.; Wang, S.H.; Feng, X.L.; Cui, L.X.; Feng, F.F.; Yu, S.C.; Wang, W.; Wu, Y.J. Application of artificial neural network model combined with four biomarkers in auxiliary diagnosis of lung cancer. Med. Biol. Eng. Comput. 2017, 55, 1239–1248. [Google Scholar] [CrossRef]
- Bahado-Singh, R.O.; Vishweswaraiah, S.; Aydas, B.; Yilmaz, A.; Saiyed, N.M.; Mishra, N.K.; Guda, C.; Radhakrishna, U. Precision cardiovascular medicine: Artificial intelligence and epigenetics for the pathogenesis and prediction of coarctation in neonates. J. Matern. Fetal Neonatal. Med. 2022, 35, 457–464. [Google Scholar] [CrossRef]
- Bahado-Singh, R.O.; Vishweswaraiah, S.; Er, A.; Aydas, B.; Turkoglu, O.; Taskin, B.D.; Duman, M.; Yilmaz, D.; Radhakrishna, U. Artificial intelligence and the detection of pediatric concussion using epigenomic analysis. Brain Res. 2020, 1726, 146510. [Google Scholar] [CrossRef]
- Zhang, M.; Pan, C.; Liu, H.; Zhang, Q.; Li, H. An attention-based deep learning method for schizophrenia patients classification using DNA methylation data. Annu. Int. Conf. IEEE Eng. Med. Biol. Soc. 2020, 2020, 172–175. [Google Scholar] [CrossRef]
- Bae, S.; Hong, Y.C. Exposure to bisphenol A from drinking canned beverages increases blood pressure: Randomized crossover trial. Hypertension 2015, 65, 313–319. [Google Scholar] [CrossRef] [PubMed]
- Davis, S.; Du, P.; Bilke, S.; Triche, T.; Bootwalla, M., Jr. Methylumi: Handle Illumina Methylation Data. R package version 2.39.0. 2021. Available online: https://bioconductor.riken.jp/packages/3.0/bioc/html/methylumi.html (accessed on 27 February 2022).
- Du, P.; Kibbe, W.A.; Lin, S.M. Lumi: A pipeline for processing Illumina microarray. Bioinformatics 2008, 24, 1547–1548. [Google Scholar] [CrossRef] [PubMed] [Green Version]
- Dedeurwaerder, S.; Defrance, M.; Bizet, M.; Calonne, E.; Bontempi, G.; Fuks, F. A comprehensive overview of Infinium HumanMethylation450 data processing. Brief. Bioinform. 2014, 15, 929–941. [Google Scholar] [CrossRef] [PubMed] [Green Version]
- Teschendorff, A.E.; Marabita, F.; Lechner, M.; Bartlett, T.; Tegner, J.; Gomez-Cabrero, D.; Beck, S. A beta-mixture quantile normalization method for correcting probe design bias in Illumina Infinium 450 k DNA methylation data. Bioinformatics 2013, 29, 189–196. [Google Scholar] [CrossRef] [Green Version]
- Hastie, T.; Tibshirani, R.; Friedman, J. The Elements of Statistical Learning: Data Mining, Inference, and Prediction; Springer Science & Business Media: Berlin/Heidelberg, Germany, 2009. [Google Scholar]
- Nair, V.; Hinton, G.E. Rectified linear units improve restricted boltzmann machines. In Proceedings of the 27th International Conference on Machine Learning, Haifa, Israel, 21–24 June 2010; pp. 807–814. [Google Scholar]
- Narayan, S. The generalized sigmoid activation function: Competitive supervised learning. Inf. Sci. 1997, 99, 69–82. [Google Scholar] [CrossRef]
- Kingma, D.P.; Ba, J. Adam: A method for stochastic optimization. arXiv 2014, arXiv:1412.6980. [Google Scholar]
- Mahadevan, S.; Shah, S.L.; Marrie, T.J.; Slupsky, C.M. Analysis of metabolomic data using support vector machines. Anal. Chem. 2008, 80, 7562–7570. [Google Scholar] [CrossRef]
- Japkowicz, N.; Shah, M. Evaluating Learning Algorithms: A Classification Perspective; Cambridge University Press: Cambridge, UK, 2011. [Google Scholar] [CrossRef]
- World Health Organization. Ageing and Health. 2021. Available online: https://www.who.int/news-room/fact-sheets/detail/ageing-and-health (accessed on 27 February 2022).
- AlKaabi, L.A.; Ahmed, L.S.; Al Attiyah, M.F.; Abdel-Rahman, M.E. Predicting hypertension using machine learning: Findings from Qatar Biobank Study. PLoS ONE 2020, 15, e0240370. [Google Scholar] [CrossRef]
- Koshimizu, H.; Kojima, R.; Kario, K.; Okuno, Y. Prediction of blood pressure variability using deep neural networks. Int. J. Med. Inform. 2020, 136, 104067. [Google Scholar] [CrossRef]
- LaFreniere, D.; Zulkernine, F.; Barber, D.; Martin, K. Using machine learning to predict hypertension from a clinical dataset. In Proceedings of the 2016 IEEE Symposium Series on Computational Intelligence (SSCI), Athens, Greece, 6–9 December 2016; pp. 1–7. [Google Scholar]
- Ture, M.; Kurt, I.; Turhan Kurum, A.; Ozdamar, K. Comparing classification techniques for predicting essential hypertension. Expert. Syst. Appl. 2005, 29, 583–588. [Google Scholar] [CrossRef]
- López-Martínez, F.; Núñez-Valdez, E.R.; Crespo, R.G.; García-Díaz, V. An artificial neural network approach for predicting hypertension using NHANES data. Sci. Rep. 2020, 10, 10620. [Google Scholar] [CrossRef]
- Mikeska, T.; Craig, J.M. DNA methylation biomarkers: Cancer and beyond. Genes 2014, 5, 821–864. [Google Scholar] [CrossRef] [Green Version]
- Gillberg, L.; Ling, C. The potential use of DNA methylation biomarkers to identify risk and progression of type 2 diabetes. Front. Endocrinol. 2015, 6, 43. [Google Scholar] [CrossRef]
- Cancer Genome Atlas Research Network; Weinstein, J.N.; Collisson, E.A.; Mills, G.B.; Shaw, K.R.; Ozenberger, B.A.; Ellrott, K.; Shmulevich, I.; Sander, C.; Stuart, J.M. The Cancer Genome Atlas Pan-Cancer analysis project. Nat. Genet. 2013, 45, 1113–1120. [Google Scholar] [CrossRef]
- Barrett, T.; Wilhite, S.E.; Ledoux, P.; Evangelista, C.; Kim, I.F.; Tomashevsky, M.; Marshall, K.A.; Phillippy, K.H.; Sherman, P.M.; Holko, M.; et al. NCBI GEO: Archive for functional genomics data sets-update. Nucleic Acids Res. 2013, 41, D991–D995. [Google Scholar] [CrossRef] [Green Version]
- Liu, B.; Liu, Y.; Pan, X.; Li, M.; Yang, S.; Li, S.C. DNA methylation markers for pan–cancer prediction by deep learning. Genes 2019, 10, 778. [Google Scholar] [CrossRef] [Green Version]
- Xia, C.; Xiao, Y.; Wu, J.; Zhao, X.; Li, H. A convolutional neural network based ensemble method for cancer prediction using DNA methylation data. In Proceedings of the 2019 11th International Conference on Machine Learning and Computing 2019, Zhuhai, China, 22–24 February 2019; pp. 191–196. [Google Scholar]
- Soler-Botija, C.; Galvez-Monton, C.; Bayes-Genis, A. Epigenetic biomarkers in cardiovascular diseases. Front. Genet. 2019, 10, 950. [Google Scholar] [CrossRef]
- He, W.J.; Li, C.; Rao, D.C.; Hixson, J.E.; Huang, J.; Cao, J.; Rice, T.K.; Shimmin, L.C.; Gu, D.; Kelly, T.N. Associations of renin-angiotensin-aldosterone system genes with blood pressure changes and hypertension incidence. Am. J. Hypertens. 2015, 28, 1310–1315. [Google Scholar] [CrossRef] [Green Version]
- Tsioufis, C.; Kordalis, A.; Flessas, D.; Anastasopoulos, I.; Tsiachris, D.; Papademetriou, V.; Stefanadis, C. Pathophysiology of resistant hypertension: The role of sympathetic nervous system. Int. J. Hypertens. 2011, 2011, 642416. [Google Scholar] [CrossRef] [Green Version]
- Fu, Y.; Vallon, V. Mineralocorticoid-induced sodium appetite and renal salt retention: Evidence for common signaling and effector mechanisms. Nephron. Physiol. 2014, 128, 8–16. [Google Scholar] [CrossRef] [Green Version]
- Rangel, M.; dos Santos, J.C.; Ortiz, P.H.; Hirata, M.; Jasiulionis, M.G.; Araujo, R.C.; Ierardi, D.F.; Franco Mdo, C. Modification of epigenetic patterns in low birth weight children: Importance of hypomethylation of the ACE gene promoter. PLoS ONE 2014, 9, e106138. [Google Scholar] [CrossRef] [Green Version]
- Wang, F.; Demura, M.; Cheng, Y.; Zhu, A.; Karashima, S.; Yoneda, T.; Demura, Y.; Maeda, Y.; Namiki, M.; Ono, K.; et al. Dynamic CCAAT/enhancer binding protein-associated changes of DNA methylation in the angiotensinogen gene. Hypertension 2014, 63, 281–288. [Google Scholar] [CrossRef] [Green Version]
- Hughes, C.A.; Bennett, V. Adducin: A physical model with implications for function in assembly of spectrin-actin complexes. J. Biol. Chem. 1995, 270, 18990–18996. [Google Scholar] [CrossRef] [Green Version]
- Arlt, A.; Schafer, H. Role of the immediate early response 3 (IER3) gene in cellular stress response, inflammation and tumorigenesis. Eur. J. Cell Biol. 2011, 90, 545–552. [Google Scholar] [CrossRef]
- Hofmann, F.; Feil, R.; Kleppisch, T.; Schlossmann, J. Function of cGMP-dependent protein kinases as revealed by gene deletion. Physiol. Rev. 2006, 86, 1–23. [Google Scholar] [CrossRef]
- Zhao, Y.D.; Cai, L.; Mirza, M.K.; Huang, X.; Geenen, D.L.; Hofmann, F.; Yuan, J.X.J.; Zhao, Y.-Y. Protein kinase G-I deficiency induces pulmonary hypertension through Rho A/Rho kinase activation. Am. J. Pathol. 2012, 180, 2268–2275. [Google Scholar] [CrossRef] [Green Version]
- Usui, T.; Okada, M.; Mizuno, W.; Oda, M.; Ide, N.; Morita, T.; Hara, Y.; Yamawaki, H. HDAC4 mediates development of hypertension via vascular inflammation in spontaneous hypertensive rats. Am. J. Physiol. Heart Circ. Physiol. 2012, 302, H1894–H1904. [Google Scholar] [CrossRef] [Green Version]
- Qi, Y.; Zhang, K.; Wu, Y.; Xu, Z.; Yong, Q.C.; Kumar, R.; Baker, K.M.; Zhu, Q.; Chen, S.; Guo, S. Novel mechanism of blood pressure regulation by forkhead box class O1-mediated transcriptional control of hepatic angiotensinogen. Hypertension 2014, 64, 1131–1140. [Google Scholar] [CrossRef] [Green Version]
Publisher’s Note: MDPI stays neutral with regard to jurisdictional claims in published maps and institutional affiliations. |
© 2022 by the authors. Licensee MDPI, Basel, Switzerland. This article is an open access article distributed under the terms and conditions of the Creative Commons Attribution (CC BY) license (https://creativecommons.org/licenses/by/4.0/).