
Widen the Applicability of a Convolutional Neural-Network-Assisted Glaucoma Detection Algorithm of Limited Training Images across Different Datasets

 , , ,
, , , 
Abstract
:1. Introduction
2. Materials and Methods
2.1. Datasets
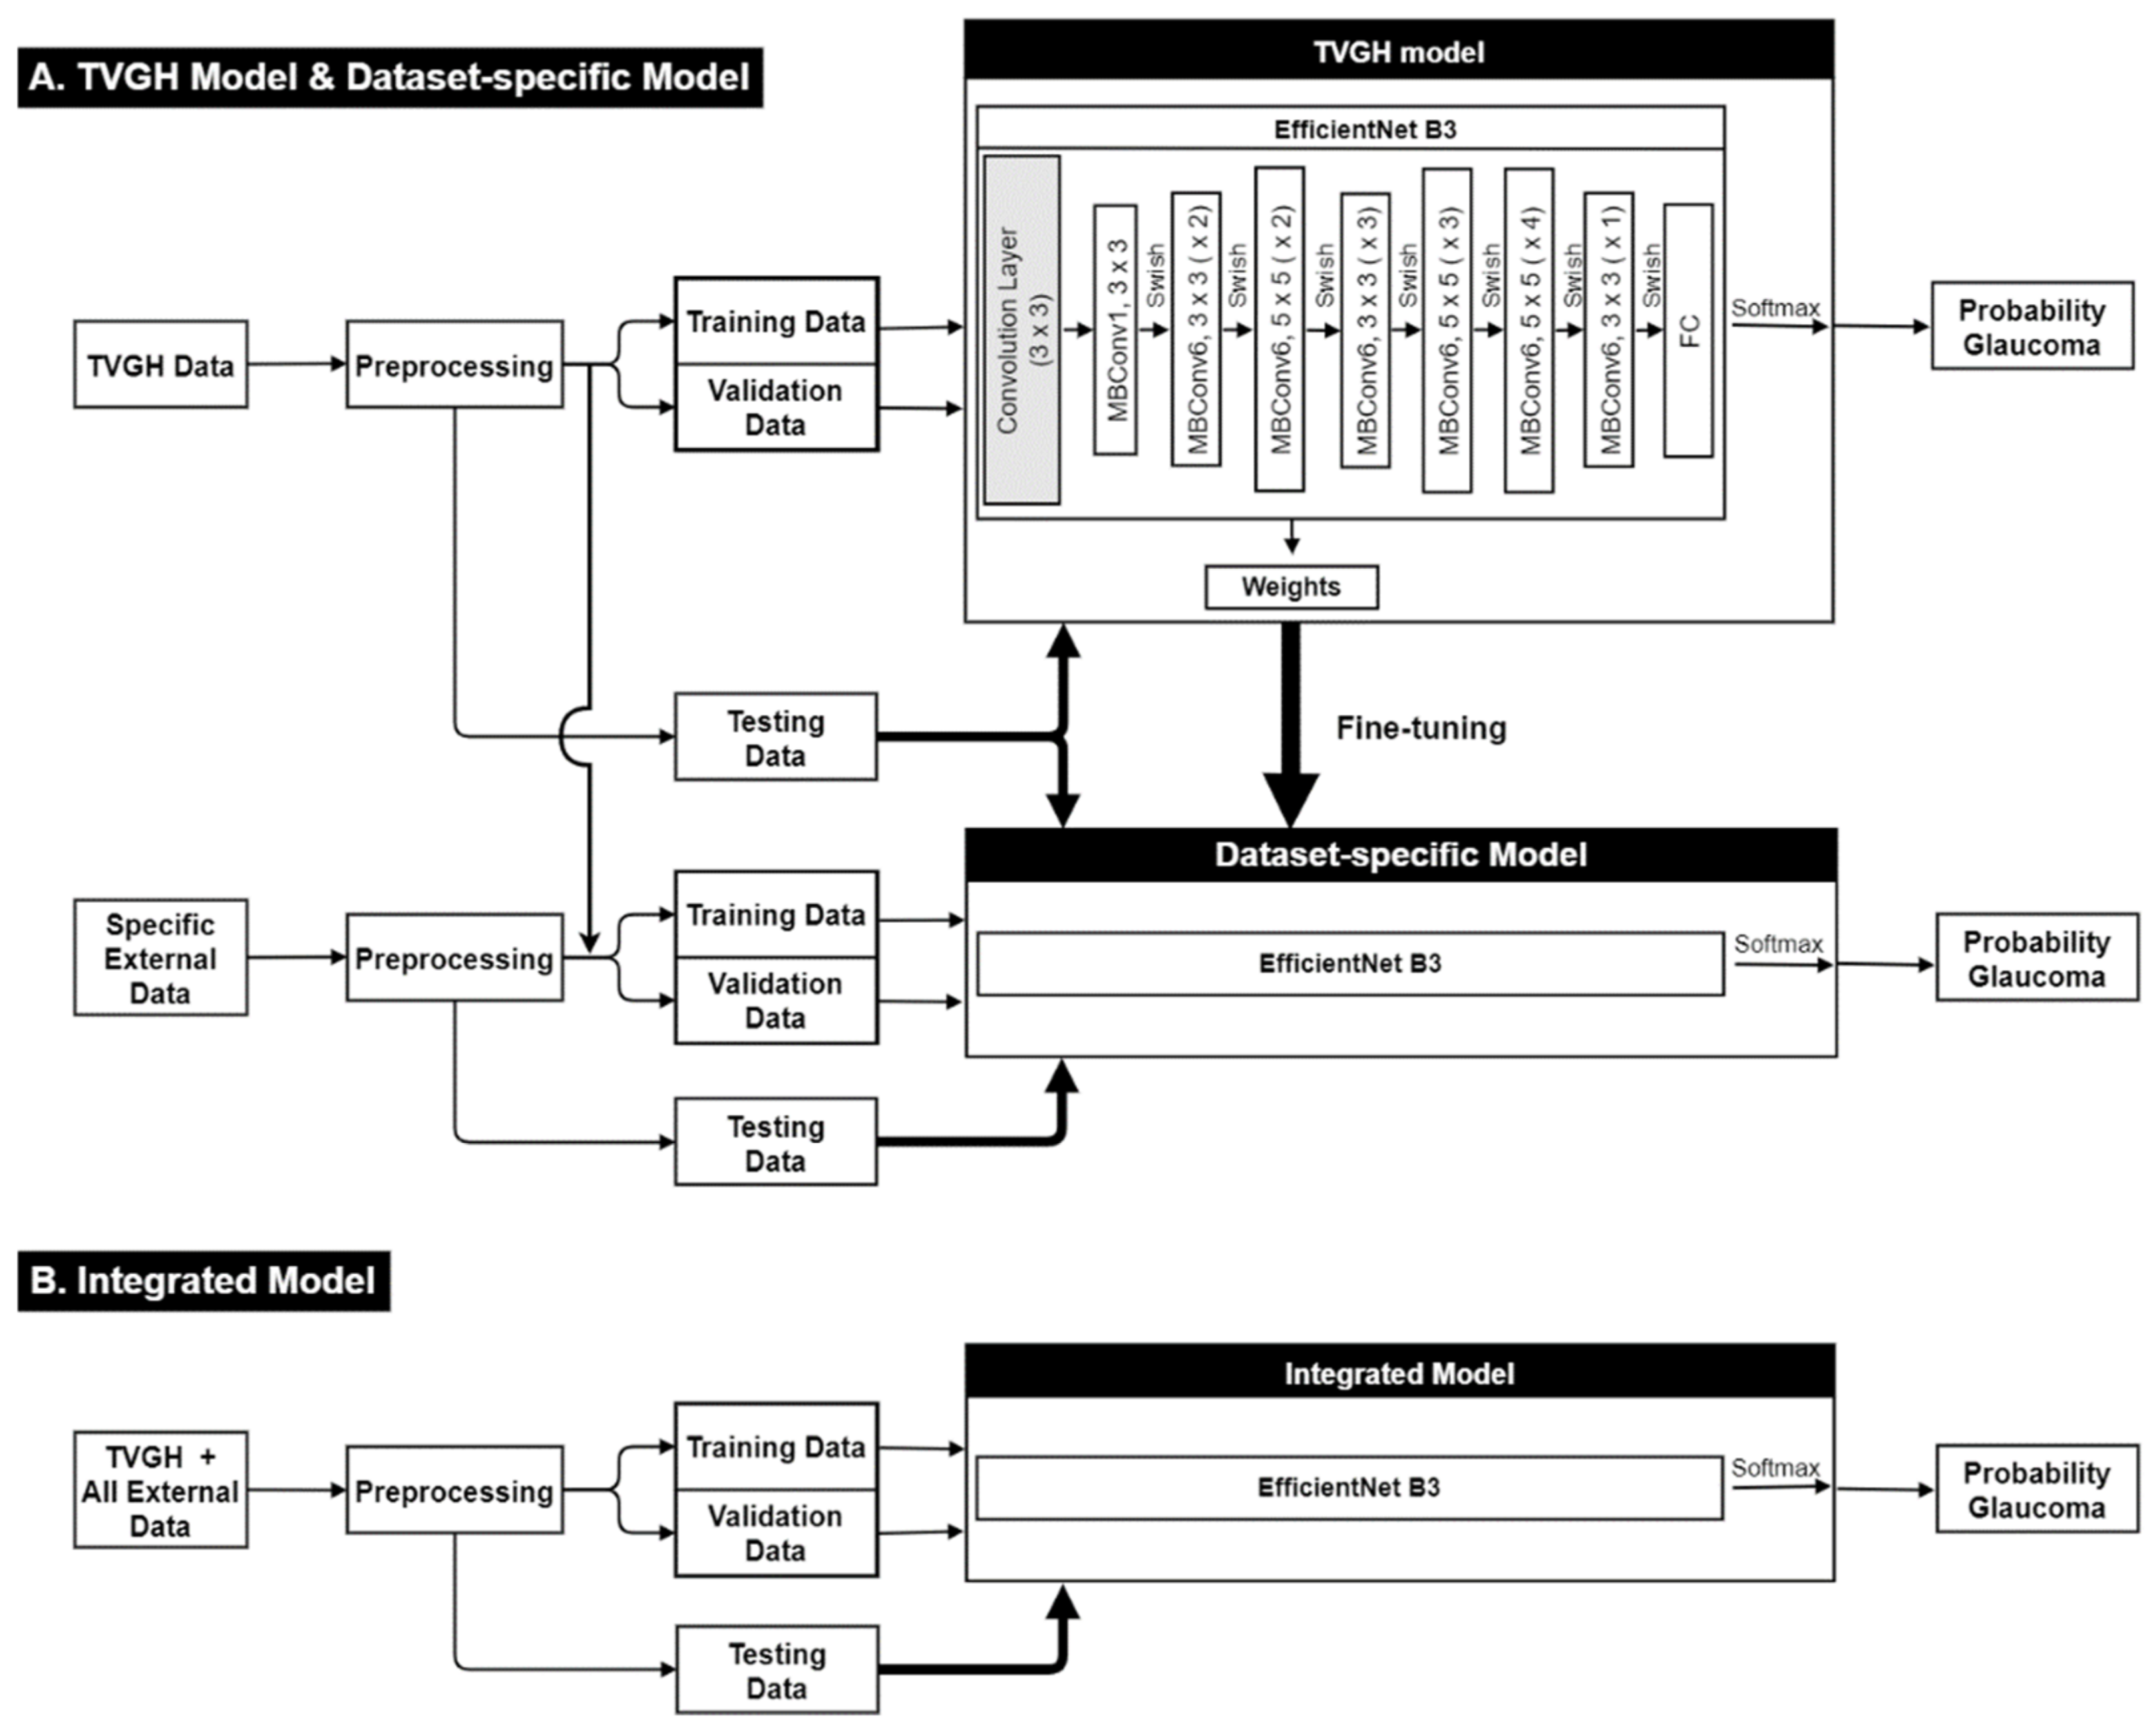
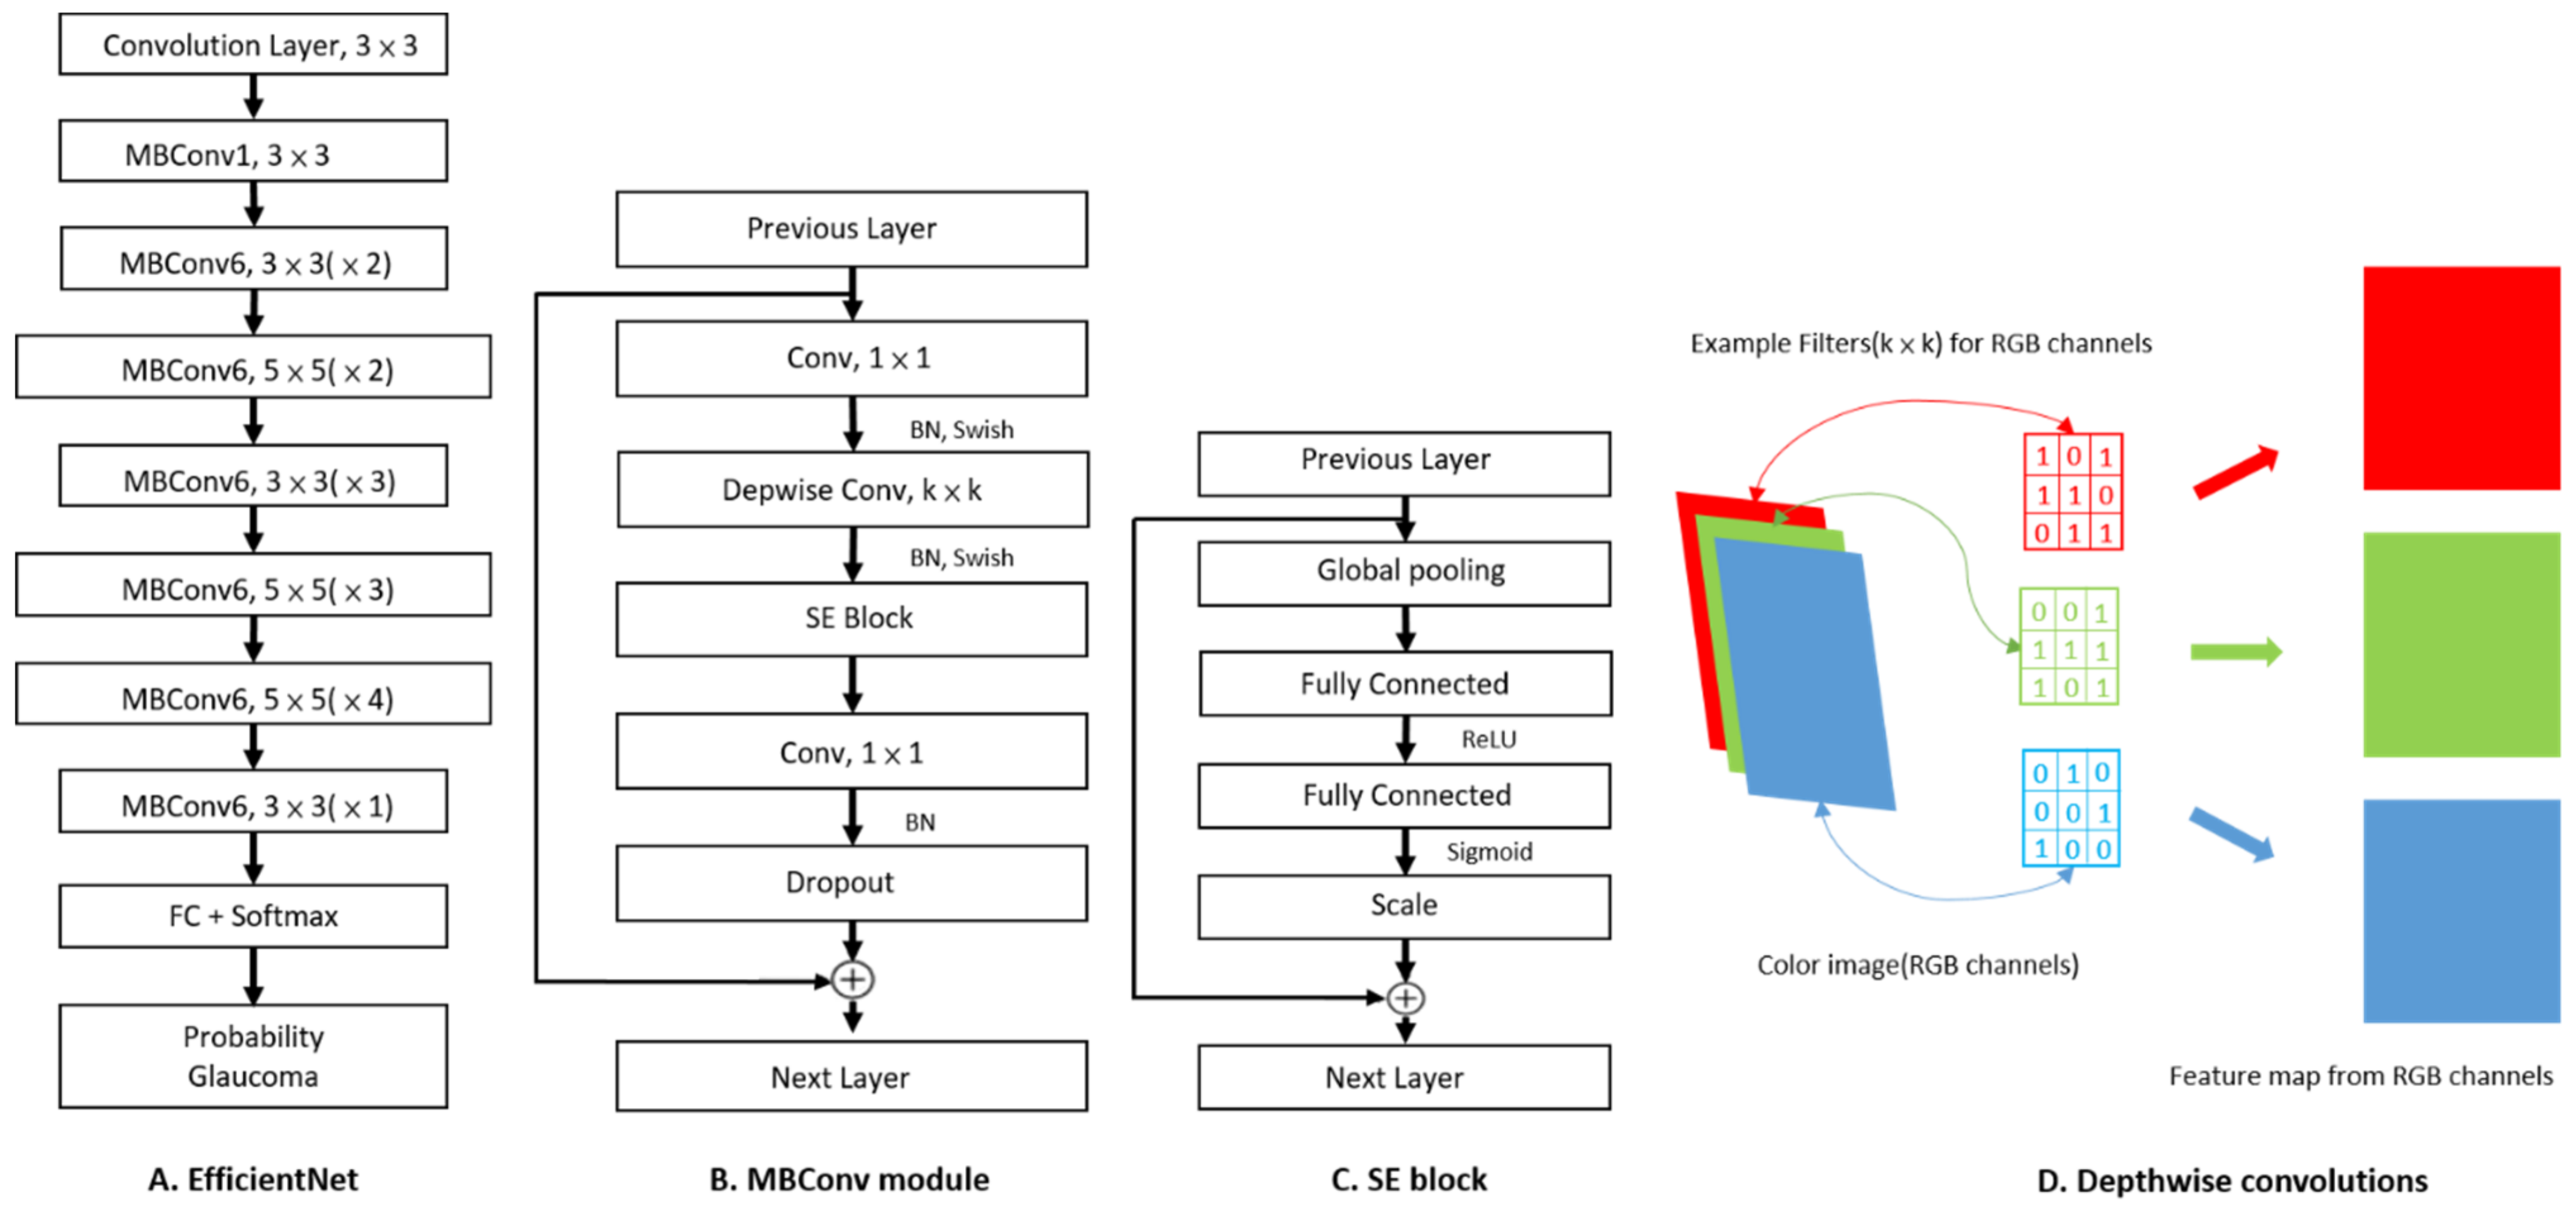
2.2. Image Classification Based on CNN and Fine-Tuning Process
2.3. Statistical Analysis
3. Results
3.1. Diagnostic Performance of the CNN Classifiers
3.2. Factors Affecting the Detection of POAG with the CNN Classifier
4. Discussion
Supplementary Materials
Author Contributions
Funding
Institutional Review Board Statement
Informed Consent Statement
Data Availability Statement
Conflicts of Interest
References
- Kingman, S. Glaucoma is second leading cause of blindness globally. Bull. World Health Organ. 2004, 82, 887–888. [Google Scholar] [PubMed]
- Flaxman, S.R.; Bourne, R.R.; Resnikoff, S.; Ackland, P.; Braithwaite, T.; Cicinelli, M.V.; Das, A.; Jonas, J.B.; Keeffe, J.; Kempen, H.; et al. Global causes of blindness and distance vision impairment 1990–2020: A systematic review and meta-analysis. Lancet Glob. Health 2017, 5, e1221–e1234. [Google Scholar] [CrossRef] [Green Version]
- Dielemans, I.; Vingerling, J.R.; Wolfs, R.C.; Hofman, A.; Grobbee, D.E.; de Jong, P.T. The prevalence of primary open-angle glaucoma in a population-based study in The Netherlands. The Rotterdam Study. Ophthalmology 1994, 101, 1851–1855. [Google Scholar] [CrossRef]
- Kuo, C.-Y.; Ko, Y.-C.; Kuang, T.-M.; Chou, P.; Chiou, S.-H.; Liu, C.J.-L. Prevalence of glaucoma in the elderly population in Taiwan: The Shihpai Eye Study. J. Chin. Med. Assoc. 2020, 83, 880–884. [Google Scholar] [CrossRef] [PubMed]
- Bastawrous, A.; Giardini, M.E.; Bolster, N.M.; Peto, T.; Shah, N.; Livingstone, I.A.; Weiss, H.A.; Hu, S.; Rono, H.; Kuper, H.; et al. Clinical validation of a smartphone-based adapter for optic disc imaging in Kenya. JAMA Ophthalmol. 2016, 134, 151–158. [Google Scholar] [CrossRef] [Green Version]
- Ting, D.S.W.; Cheung, C.Y.-L.; Lim, G.; Tan, G.S.W.; Quang, N.D.; Gan, A.; Hamzah, H.; Garcia-Franco, R.; Yeo, I.Y.S.; Lee, S.Y.; et al. Development and validation of a deep learning system for diabetic retinopathy and related eye diseases using retinal images from multiethnic populations with diabetes. JAMA 2017, 318, 2211–2223. [Google Scholar] [CrossRef] [PubMed]
- Myers, J.S.; Fudemberg, S.J.; Lee, D. Evolution of optic nerve photography for glaucoma screening: A review. Clin. Exp. Ophthalmol. 2018, 46, 169–176. [Google Scholar] [CrossRef] [Green Version]
- Burr, J.M.; Mowatt, G.; Hernández, R.; Siddiqui, M.A.R.; Cook, J.; Lourenco, T.; Ramsay, C.; Vale, L.; Fraser, C.; Azuara-Blanco, A.; et al. The clinical effectiveness and cost-effectiveness of screening for open angle glaucoma: A systematic review and economic evaluation. Health Technol. Assess 2007, 11, iii-190. [Google Scholar] [CrossRef] [Green Version]
- Thomas, S.-M.; Jeyaraman, M.; Hodge, W.G.; Hutnik, C.; Costella, J.; Malvankar-Mehta, M.S. The effectiveness of teleglaucoma versus in-patient examination for glaucoma screening: A systematic review and meta-analysis. PLoS ONE 2014, 9, e113779. [Google Scholar] [CrossRef] [Green Version]
- Litjens, G.; Kooi, T.; Bejnordi, B.E.; Setio, A.A.A.; Ciompi, F.; Ghafoorian, M.; van der Laak, J.A.W.M.; van Ginneken, B.; Sánchez, C.I. A survey on deep learning in medical image analysis. Med. Image Anal. 2017, 42, 60–88. [Google Scholar] [CrossRef] [Green Version]
- Van Der Heijden, A.A.; Abramoff, M.D.; Verbraak, F.; Van Hecke, M.V.; Liem, A.; Nijpels, G. Validation of automated screening for referable diabetic retinopathy with the IDx-DR device in the Hoorn Diabetes Care System. Acta Ophthalmol. 2018, 96, 63–68. [Google Scholar] [CrossRef] [PubMed]
- Christopher, M.; Belghith, A.; Bowd, C.; Proudfoot, J.A.; Goldbaum, M.H.; Weinreb, R.N.; Girkin, C.A.; Liebmann, J.M.; Zangwill, L.M. Performance of deep learning architectures and transfer learning for detecting glaucomatous optic neuropathy in fundus photographs. Sci. Rep. 2018, 8, 16685. [Google Scholar] [CrossRef] [PubMed] [Green Version]
- Li, Z.; He, Y.; Keel, S.; Meng, W.; Chang, R.T.; He, M. Efficacy of a deep learning system for detecting glaucomatous optic neuropathy based on color fundus photographs. Ophthalmology 2018, 125, 1199–1206. [Google Scholar] [CrossRef] [PubMed] [Green Version]
- Liu, H.; Li, L.; Wormstone, I.M.; Qiao, C.; Zhang, C.; Liu, P.; Li, S.; Wang, H.; Mou, D.; Pang, R.; et al. Development and validation of a deep learning system to detect glaucomatous optic neuropathy using fundus photographs. JAMA Ophthalmol. 2019, 137, 1353–1360. [Google Scholar] [CrossRef]
- Hertzog, L.H.; Albrecht, K.G.; LaBree, L.; Lee, P.P. Glaucoma care and conformance with preferred practice patterns. Ophthalmology 1996, 103, 1009–1013. [Google Scholar] [CrossRef]
- Jona, J.B.; Aung, T.; Bourne, R.R.; Bron, A.M.; Ritch, R.; Panda-Jonas, S. Glaucoma. Lancet 2017, 390, 2083–2193. [Google Scholar] [CrossRef]
- Kolar, R.; Tornow, R.P.; Laemmer, R.; Odstrcilik, J.; Mayer, M.A.; Gazarek, J.; Jan, J.; Kubena, T.; Cernosek, P. Analysis of visual appearance of retinal nerve fibers in high resolution fundus images: A study on normal subjects. Comput. Math. Methods Med. 2013, 2013, 1–10. [Google Scholar] [CrossRef]
- Oh, J.E.; Yang, H.K.; Kim, K.G.; Hwang, J.-M. Automatic computer-aided diagnosis of retinal nerve fiber layer defects using fundus photographs in optic neuropathy. Invest. Ophthalmol. Vis. Sci. 2015, 56, 2872–2879. [Google Scholar] [CrossRef] [Green Version]
- Pratt, L. Discriminability-based transfer between neural networks. In NIPS Conference: Advances in Neural Information Processing Systems 5; Hanson, S., Cowan, J., Giles, C., Eds.; Morgan Kaufmann Publishers Inc.: San Francisco, CA, USA, 1992; pp. 204–211. [Google Scholar]
- Tan, M.; Le, Q. EfficientNet: Rethinking model scaling for covoluational neural network. arXiv 2019, arXiv:190511946. [Google Scholar]
- Sivaswamy, J.; Krishnadas, S.; Chakravarty, A.; Joshi, G.; Tabish, A.S. A comprehensive retinal image dataset for the assessment of glaucoma from the optic nerve head analysis. JSM Biomed. Imaging Data Pap. 2015, 2, 1004. [Google Scholar]
- Fumero, F.A.S.; Sanchez, J.L.; Sigut, J.; Gonzalez-Hernandez, M. RIM-ONE: An open retinal image database for optic nerve evaluation. In Proceedings of the 24th international symposium on computer-based medical system (CBMS), Bristol, UK, 27–30 June 2011; pp. 1–6. [Google Scholar]
- Razavian, A.S.; Azizpour, H.; Sullivan, J.; Carlsson, S. CNN features off-the-shelf: An astounding baseline for recognition. In Proceedings of the 2014 IEEE Conference on Computer Vision and Pattern Recognition Workshops, Columbus, OH, USA, 23–28 June 2014; pp. 512–519. [Google Scholar]
- Yosinski, J.; Clune, J.; Bengio, Y.; Lipson, H. How transferable are features in deep neural networks? Adv. Neural Inf. Processing Syst. 2014, 27, 3320–3328. [Google Scholar]
- Zoph, B.; Vasudevan, V.; Shlens, J.; Le, Q.V. Learning transferable architectures for scalable image recognition. arXiv 2018, arXiv:1707.07012v4. [Google Scholar]
- He, K.; Zhang, X.; Ren, S.; Sun, J. Deep residual learning for image recognition. arXiv 2015, arXiv:151203385. [Google Scholar]
- Sandler, M.; Howard, A.; Zhu, M.; Zhmoginov, A.; Chen, L. Mobilenetv2: Inverted residuals and linear bottlenecks. arXiv 2018, arXiv:180104381. [Google Scholar]
- Hu, J.; Shen, L.; Albanie, S.; Sun, G.; Wu, E. Squeeze-and-Excitation Networks. arXiv 2017, arXiv:170901507. [Google Scholar]
- Selvaraju, R.R.; Cogswell, M.; Das, A.; Vedantam, R.; Parikh, D.; Batra, D. Grad-CAM: Visual explanations from deep networks via gradient-based localization. arXiv 2016, arXiv:161002391. [Google Scholar]
- Wu, J.-H.; Nishida, T.; Weinreb, R.N.; Lin, J.-W. Performances of machine learning in detecting glaucoma using fundus and retinal optical coherence tomography images: A meta-analysis. Am. J. Ophthalmol. 2022, 237, 1–12. [Google Scholar] [CrossRef]
- Zech, J.R.; Badgeley, M.A.; Liu, M.; Costa, A.B.; Titano, J.J.; Oermann, E.K. Variable generalization performance of a deep learning model to detect pneumonia in chest radiographs: A cross-sectional study. PLoS Med. 2018, 15, e1002683. [Google Scholar] [CrossRef] [Green Version]
- Ko, Y.-C.; Wey, S.-Y.; Chen, W.-T.; Chang, Y.-F.; Chen, M.-J.; Chiou, S.-H.; Liu, C.J.-L.; Lee, C.-Y. Deep learning assisted detection of glaucomatous optic neuropathy and potential designs for a generalizable model. PLoS ONE 2020, 15, e0233079. [Google Scholar] [CrossRef]
- Gulshan, V.; Peng, L.; Coram, M.; Stumpe, M.C.; Wu, D.; Narayanaswamy, A.; Venugopalan, S.; Widner, K.; Madams, T.; Cuadros, J.; et al. Development and validation of a deep learning algorithm for detection of diabetic retinopathy in retinal fundus photographs. JAMA 2016, 316, 2402–2410. [Google Scholar] [CrossRef]
- Gómez-Valverde, J.J.; Antón, A.; Fatti, G.; Liefers, B.; Herranz, A.; Santos, A.; Sánchez, C.I.; Ledesma-Carbayo, M.J. Automatic glaucoma classification using color fundus images based on convolutional neural networks and transfer learning. Biomed. Opt. Express 2019, 10, 892–913. [Google Scholar] [CrossRef] [PubMed] [Green Version]
- Diaz-Pinto, A.; Morales, S.; Naranjo, V.; Köhler, T.; Mossi, J.M.; Navea, A. CNNs for automatic glaucoma assessment using fundus images: An extensive validation. Biomed. Eng. Online 2019, 18, 29. [Google Scholar] [CrossRef] [PubMed] [Green Version]
- Gheisari, S.; Shariflou, S.; Phu, J.; Kennedy, P.J.; Agar, A.; Kalloniatis, M.; Golzan, S.M. A combined convolutional and recurrent neural network for enhanced glaucoma detection. Sci. Rep. 2021, 11, 1945. [Google Scholar] [CrossRef] [PubMed]
- Xu, X.; Guan, Y.; Li, J.; Ma, Z.; Zhang, L.; Li, L. Automatic glaucoma detection based on transfer induced attention network. BioMed. Eng. Online 2021, 20, 39. [Google Scholar] [CrossRef]
- Konečný, J.; McMahan, B.; Ramage, D. Federated Optimization: Distributed Optimization Beyond the Datacenter. arXiv 2015, arXiv:1511.03575. [Google Scholar]
- Shyu, C.R.; Putra, K.T.; Chen, H.C.; Tsai, Y.Y.; Hossain, K.S.M.; Jiang, W.; Shae, Z.Y. A Systematic Review of Federated Learning in the Healthcare Area: From the Perspective of Data Properties and Applications. Appl. Sci. 2021, 11, 11191. [Google Scholar]
- Dayan, I.; Roth, H.R.; Zhong, A.; Harouni, A.; Gentili, A.; Abidin, A.Z.; Liu, A.; Costa, A.B.; Wood, B.J.; Tsai, C.-S.; et al. Federated learning for predicting clinical outcomes in patients with COVID-19. Nat. Med. 2021, 27, 1735–1743. [Google Scholar] [CrossRef]


| Dataset | Numbers (Glaucoma) | Image Size (Pixels) | Field of View (Center) | Camera | Origin |
|---|---|---|---|---|---|
| TVGH | 944 (479) | 3888 × 2552 | 30° (macula) | Canon CX-1, CR-2, DGi | Taiwan |
| CHGH | 158 (78) | 3216 × 2136 | 30° (macula) | Topcon TRC-NW8F | Taiwan |
| DRISHTI-GS1 | 101 (70) | 2047 × 1760 | 30° (disc) | Zeiss Visucam NM/FA | India |
| RIM-ONE r2 | 455 (200) | Not fixed | Cropped (disc) | Nidek AFC-210 | Spain |
| Models 1 | Network Hyper-Parameters | ||
|---|---|---|---|
| Batch Size | Epoch | Initial Learning Rate | |
| TVGH | 20 | 20 | 0.00006 |
| Integrated | 16 | 25 | 0.00004 |
| DRISHTI-GS1-specific | 16 | 20 | 0.00001 |
| RIM-ONE r2-specific | 16 | 20 | 0.00005 |
| CHGH-specific | 20 | 20 | 0.00006 |
| Models 1 | Training Datasets | Test Datasets | Accuracy | Specificity | Sensitivity | AUC (95% CI) |
|---|---|---|---|---|---|---|
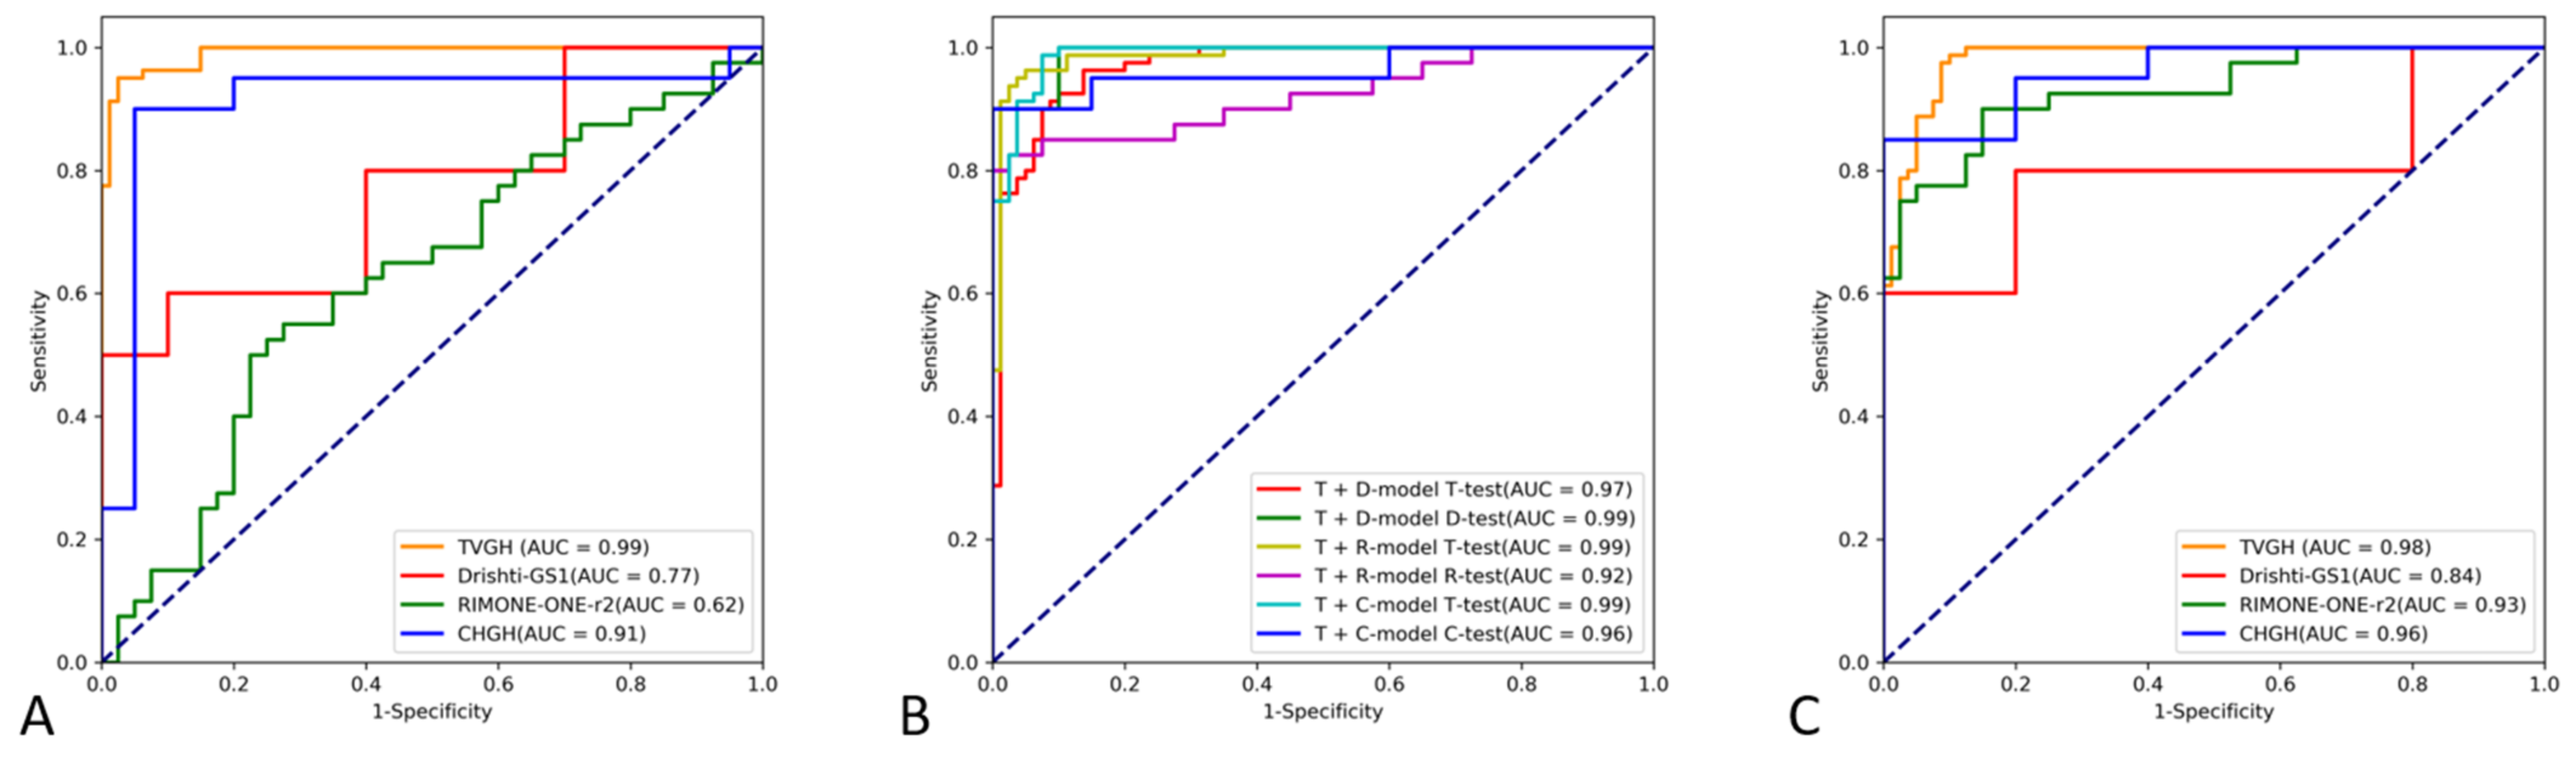
| TVGH | TVGH | TVGH | 95.62% | 97.50% | 93.75% | 0.991 (0.982–1.000) |
| TVGH | TVGH | DRISHTI-GS1 | 55.00% | 100% | 10.00% | 0.770 (0.558–0.982) |
| TVGH | TVGH | RIM-ONE r2 | 52.50% | 90.00% | 15.00% | 0.624 (0.501–0.748) |
| TVGH | TVGH | CHGH | 80.00% | 95.00% | 65.00% | 0.910 (0.798–1.000) |
| DRISHTI-GS1-specific | TVGH + DRISHTI-GS1 | TVGH | 88.75% | 92.50% | 85.00% | 0.969 (0.945–0.993) |
| DRISHTI-GS1-specific | TVGH + DRISHTI-GS1 | DRISHTI-GS1 | 95.00% | 90.00% | 100.00% | 0.990 (0.958–1.000) |
| RIM-ONE r2-specific | TVGH + RIM-ONE r2 | TVGH | 94.38% | 98.75% | 90.00% | 0.986 (0.969–1.000) |
| RIM-ONE r2-specific | TVGH + RIM-ONE r2 | RIM-ONE r2 | 87.50% | 92.50% | 82.50% | 0.922 (0.859–0.985) |
| CHGH-specific | TVGH + CHGH | TVGH | 92.50% | 93.75% | 91.25% | 0.988 (0.977–1.000) |
| CHGH-specific | TVGH + CHGH | CHGH | 92.50% | 95.00% | 90.00% | 0.963 (0.901–1.000) |
| Integrated | All | TVGH | 91.88% | 91.25% | 92.50% | 0.981 (0.965–0.998) |
| Integrated | All | DRISHTI-GS1 | 50.00% | 20.00% | 80.00% | 0.840 (0.651–1.0) |
| Integrated | All | RIM-ONE r2 | 82.50% | 87.50% | 77.50% | 0.930 (0.875–0.985) |
| Integrated | All | CHGH | 85.00% | 75.00% | 95.00% | 0.960 (0.906–1.0) |
| CNN Prediction | |||
|---|---|---|---|
| Correct (n = 75) | Incorrect (n = 5) | p Value | |
| Age (years) | 58.00 ± 14.71 | 58.00 ± 19.20 | 0.91 |
| Cup-to-disc ratio | 0.79 ± 0.12 | 0.72 ± 0.11 | 0.16 |
| Visual field | |||
| MD (dB) | −5.62 ± 5.26 | −2.43 ± 2.04 | 0.09 |
| PSD (dB) | 5.71 ± 3.59 | 3.73 ± 2.25 | 0.37 |
| Average RNFL thickness (µm) | 71.96 ± 10.86 | 85.40 ± 13.70 | 0.04 |
Publisher’s Note: MDPI stays neutral with regard to jurisdictional claims in published maps and institutional affiliations. |
© 2022 by the authors. Licensee MDPI, Basel, Switzerland. This article is an open access article distributed under the terms and conditions of the Creative Commons Attribution (CC BY) license (https://creativecommons.org/licenses/by/4.0/).
Share and Cite
Ko, Y.-C.; Chen, W.-S.; Chen, H.-H.; Hsu, T.-K.; Chen, Y.-C.; Liu, C.J.-L.; Lu, H.H.-S. Widen the Applicability of a Convolutional Neural-Network-Assisted Glaucoma Detection Algorithm of Limited Training Images across Different Datasets. Biomedicines 2022, 10, 1314. https://doi.org/10.3390/biomedicines10061314
Ko Y-C, Chen W-S, Chen H-H, Hsu T-K, Chen Y-C, Liu CJ-L, Lu HH-S. Widen the Applicability of a Convolutional Neural-Network-Assisted Glaucoma Detection Algorithm of Limited Training Images across Different Datasets. Biomedicines. 2022; 10(6):1314. https://doi.org/10.3390/biomedicines10061314
Chicago/Turabian StyleKo, Yu-Chieh, Wei-Shiang Chen, Hung-Hsun Chen, Tsui-Kang Hsu, Ying-Chi Chen, Catherine Jui-Ling Liu, and Henry Horng-Shing Lu. 2022. "Widen the Applicability of a Convolutional Neural-Network-Assisted Glaucoma Detection Algorithm of Limited Training Images across Different Datasets" Biomedicines 10, no. 6: 1314. https://doi.org/10.3390/biomedicines10061314
APA StyleKo, Y.-C., Chen, W.-S., Chen, H.-H., Hsu, T.-K., Chen, Y.-C., Liu, C. J.-L., & Lu, H. H.-S. (2022). Widen the Applicability of a Convolutional Neural-Network-Assisted Glaucoma Detection Algorithm of Limited Training Images across Different Datasets. Biomedicines, 10(6), 1314. https://doi.org/10.3390/biomedicines10061314