
Lung Cancer: Spectral and Numerical Differentiation among Benign and Malignant Pleural Effusions Based on the Surface-Enhanced Raman Spectroscopy

 , ,
, ,  ,
,  and
and
Abstract
:
1. Introduction
2. Materials and Methods
2.1. Materials
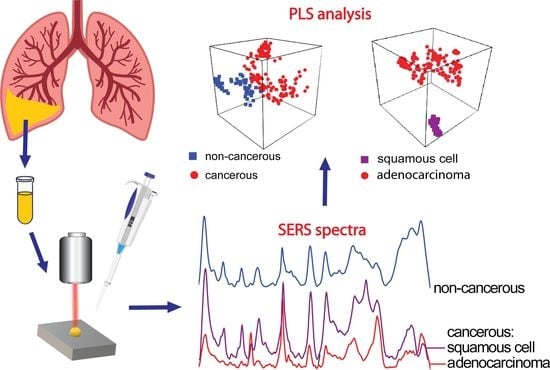
2.2. Surface-Enhanced Raman Spectroscopy (SERS)
2.3. Data Analysis
3. Results
- -
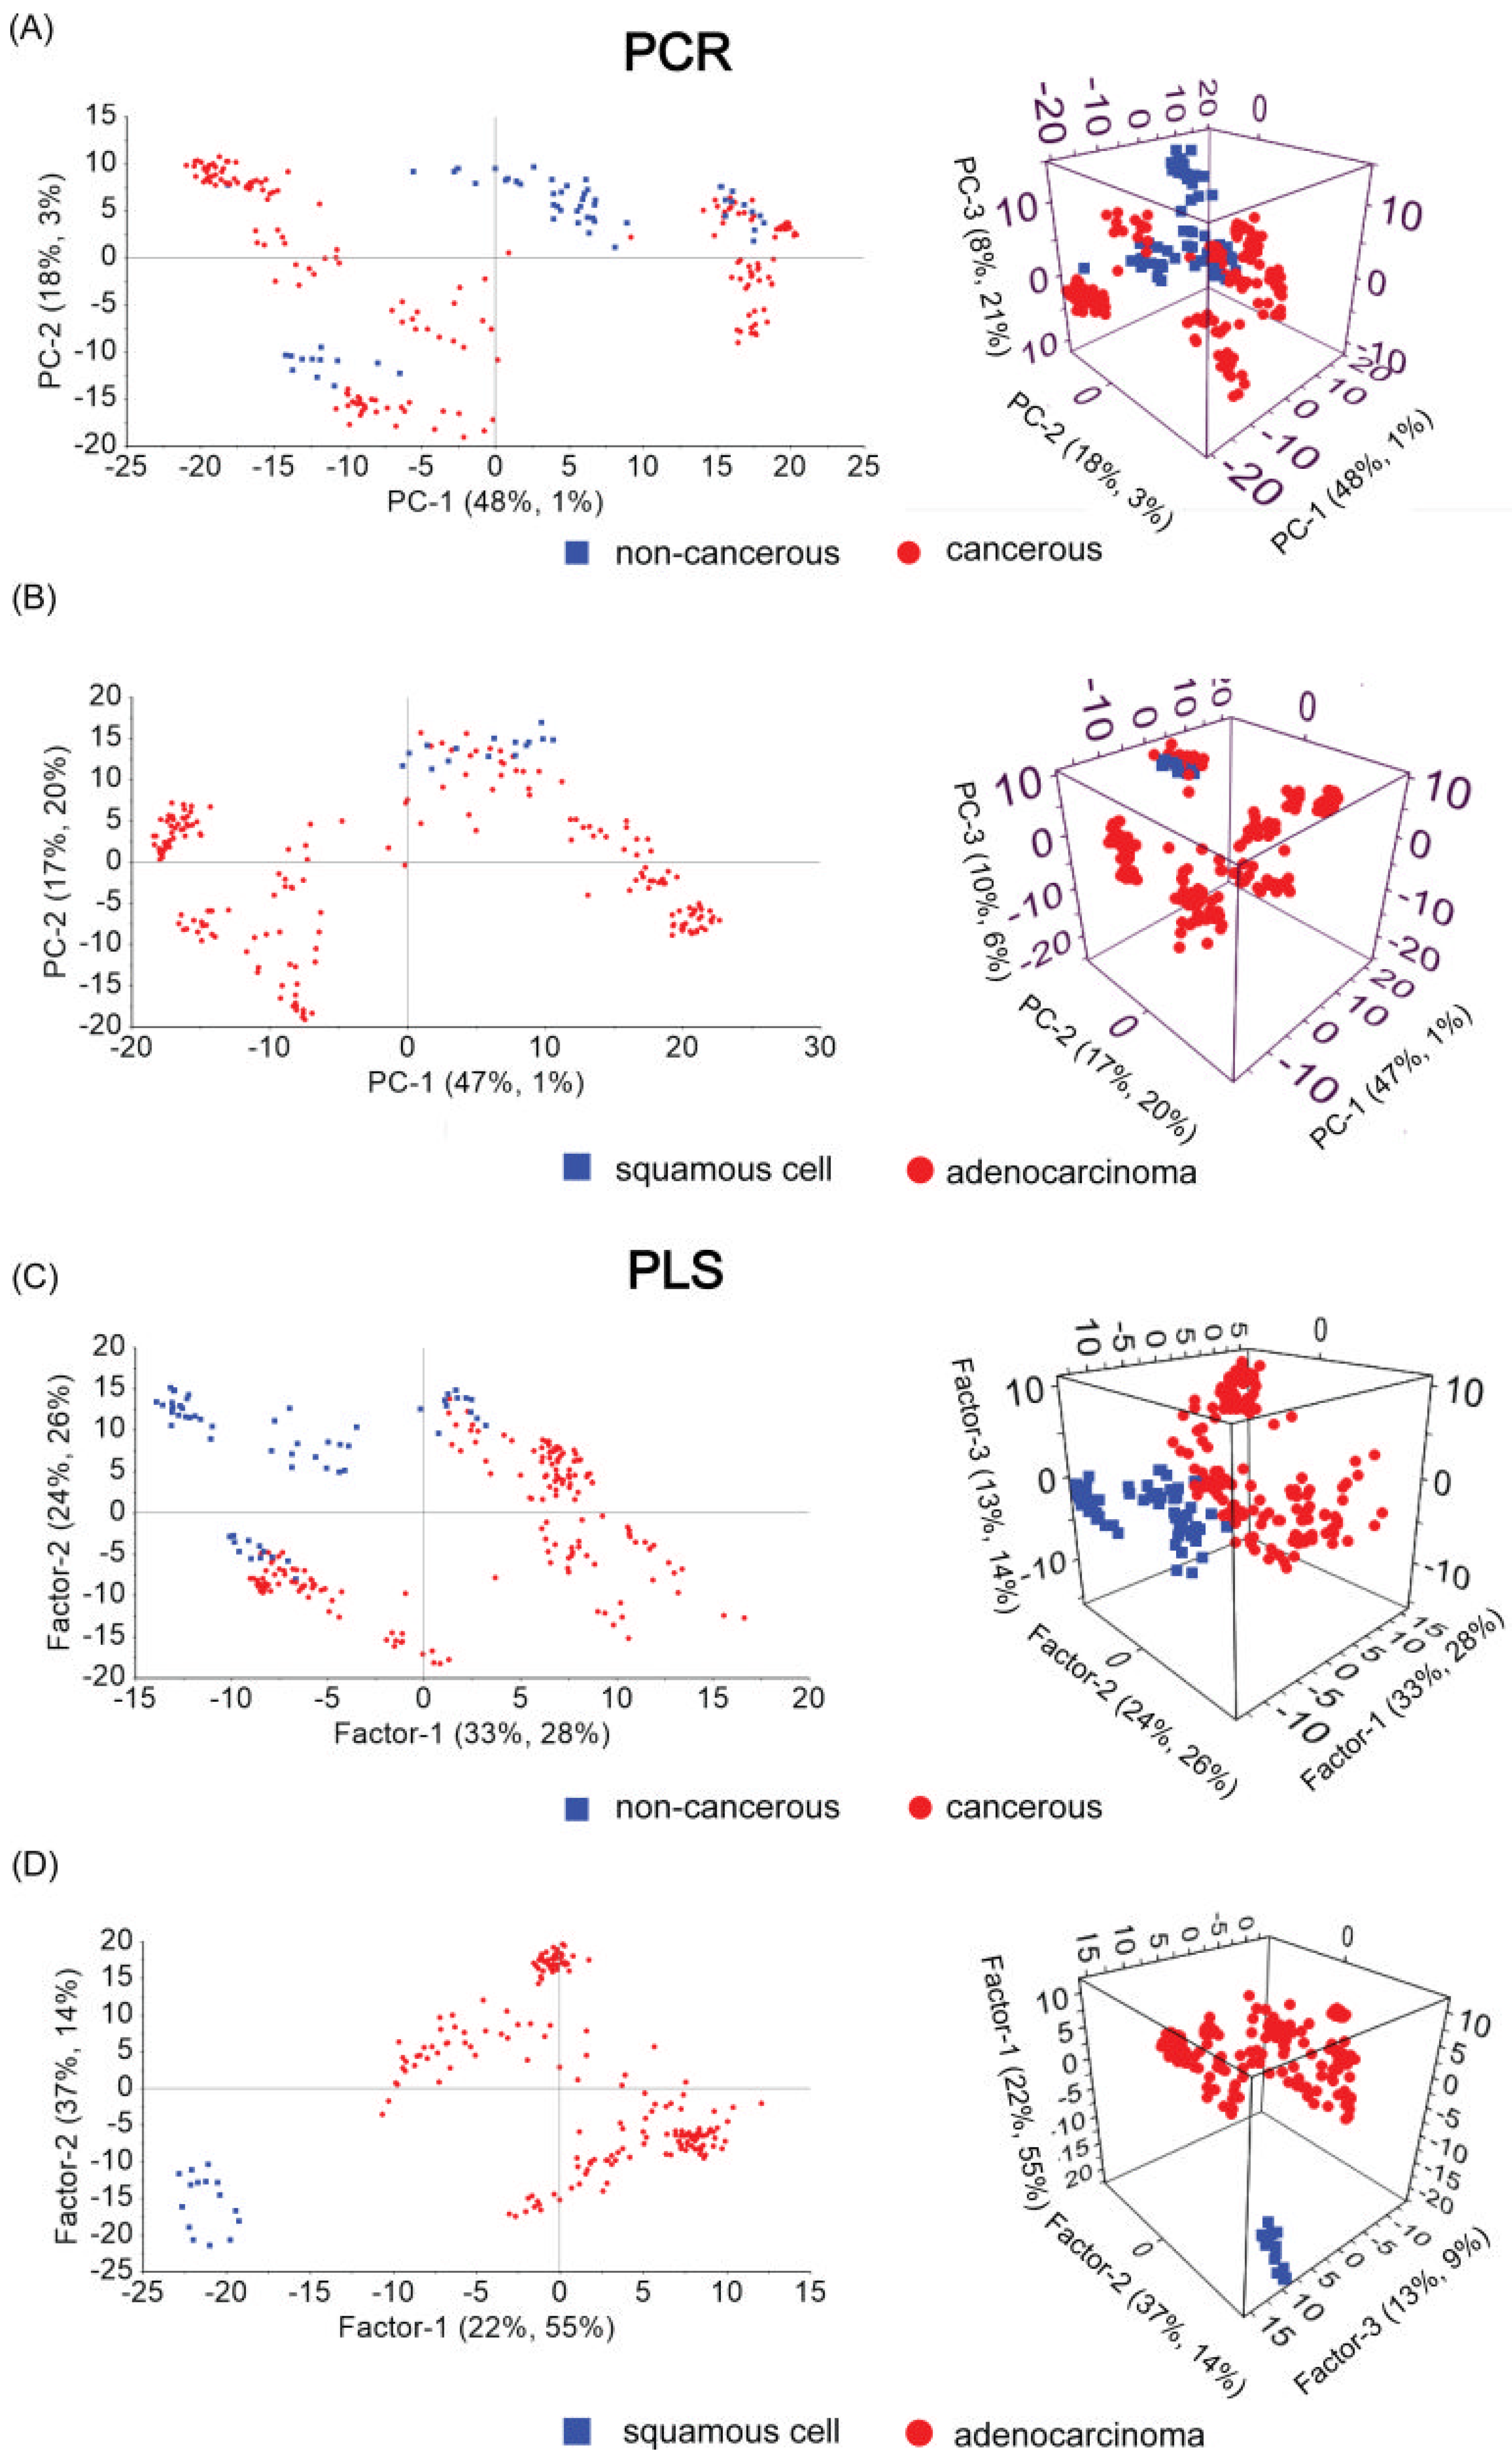
- Non-carcinoma and carcinoma samples causing pleural effusion;
- -
- Type of neoplastic illness (squamous cell and adenocarcinoma samples).
4. Conclusions
Supplementary Materials
Author Contributions
Funding
Institutional Review Board Statement
Informed Consent Statement
Data Availability Statement
Conflicts of Interest
References
- Sung, H.; Ferlay, J.; Siegel, R.L.; Laversanne, M.; Soerjomataram, I.; Jemal, A.; Bray, F. Global Cancer Statistics 2020: GLOBOCAN Estimates of Incidence and Mortality Worldwide for 36 Cancers in 185 Countries. CA. Cancer J. Clin. 2021, 71, 209–249. [Google Scholar] [CrossRef] [PubMed]
- WHO Global Health Estimates: Leading Causes of Death. Available online: https://www.who.int/data/gho/data/themes/mortality-and-global-health-estimates/ghe-leading-causes-of-death (accessed on 19 April 2022).
- Ferlay, J.; Soerjomataram, I.; Dikshit, R.; Eser, S.; Mathers, C.; Rebelo, M.; Parkin, D.M.; Forman, D.; Bray, F. Cancer Incidence and Mortality Worldwide: Sources, Methods and Major Patterns in GLOBOCAN 2012. Int. J. Cancer 2015, 136, E359–E386. [Google Scholar] [CrossRef]
- Ferlay, J.; Colombet, M.; Soerjomataram, I.; Parkin, D.M.; Piñeros, M.; Znaor, A.; Bray, F. Cancer Statistics for the Year 2020: An Overview. Int. J. Cancer 2021, 149, 778–789. [Google Scholar] [CrossRef] [PubMed]
- Karkhanis, V.S.; Joshi, J.M. Pleural Effusion: Diagnosis, Treatment, and Management. Open Access Emerg. Med. 2012, 4, 31–52. [Google Scholar] [CrossRef] [PubMed] [Green Version]
- Thomas, R.; Lee, Y.C.G. Causes and Management of Common Benign Pleural Effusions. Thorac. Surg. Clin. 2013, 23, 25–42. [Google Scholar] [CrossRef]
- Desai, N.R.; Lee, H.J. Diagnosis and Management of Malignant Pleural Effusions: State of the Art in 2017. J. Thorac. Dis. 2017, 9, S1111–S1122. [Google Scholar] [CrossRef] [Green Version]
- Nam, H.S. Malignant Pleural Effusion: Medical Approaches for Diagnosis and Management. Tuberc. Respir. Dis. 2014, 76, 211–217. [Google Scholar] [CrossRef] [PubMed] [Green Version]
- Heffner, J.E.; Klein, J.S. Recent Advances in the Diagnosis and Management of Malignant Pleural Effusions. Mayo Clin. Proc. 2008, 83, 235–250. [Google Scholar] [CrossRef]
- Motherby, H.; Nadjari, B.; Friegel, P.; Kohaus, J.; Ramp, U.; Böcking, A. Diagnostic Accuracy of Effusion Cytology. Diagn. Cytopathol. 1999, 20, 350–357. [Google Scholar] [CrossRef]
- Brun, C.; Gay, P.; Cottier, M.; Karpathiou, G.; Patoir, A.; Tiffet, O.; Barral, F.G.; Vergnon, J.M.; Froudarakis, M.E. Comparison of Cytology, Chest Computed and Positron Emission Tomography Findings in Malignant Pleural Effusion from Lung Cancer. J. Thorac. Dis. 2018, 10, 6903–6911. [Google Scholar] [CrossRef] [PubMed]
- Wang, H.P.; Wang, H.C.; Huang, Y.J. Microscopic FTIR Studies of Lung Cancer Cells in Pleural Fluid. Sci. Total Environ. 1997, 204, 283–287. [Google Scholar] [CrossRef]
- Abbas, S.; Ozek, N.S.; Emri, S.; Koksal, D.; Severcan, M.; Severcan, F. Diagnosis of Malignant Pleural Mesothelioma from Pleural Fluid by Fourier Transform-Infrared Spectroscopy Coupled with Chemometrics. J. Biomed. Opt. 2018, 23, 1. [Google Scholar] [CrossRef] [PubMed] [Green Version]
- Kneipp, K.; Kneipp, H.; Kartha, V.B.; Manoharan, R.; Deinum, G.; Itzkan, I.; Dasari, R.R.; Feld, M.S. Detection and Identification of a Single DNA Base Molecule Using Surface-Enhanced Raman Scattering (SERS). Phys. Rev. E Stat. Phys. Plasmas Fluids Relat. Interdiscip. Top. 1998, 57, 6281–6284. [Google Scholar] [CrossRef]
- Stokes, R.J.; McBride, E.; Wilson, C.G.; Girkin, J.M.; Smith, W.E.; Graham, D. Surface-Enhanced Raman Scattering Spectroscopy as a Sensitive and Selective Technique for the Detection of Folic Acid in Water and Human Serum. Appl. Spectrosc. 2008, 62, 371–376. [Google Scholar] [CrossRef] [PubMed]
- Faulds, K.; Smith, W.E.; Graham, D.; Lacey, R.J. Assessment of Silver and Gold Substrates for the Detection of Amphetamine Sulfate by Surface Enhanced Raman Scattering (SERS). Analyst 2002, 127, 282–286. [Google Scholar] [CrossRef] [PubMed]
- Sivanesan, A.; Witkowska, E.; Adamkiewicz, W.; Dziewit, Ł.; Kamińska, A.; Waluk, J. Nanostructured Silver-Gold Bimetallic SERS Substrates for Selective Identification of Bacteria in Human Blood. Analyst 2014, 139, 1037–1043. [Google Scholar] [CrossRef]
- Genova, E.; Pelin, M.; Decorti, G.; Stocco, G.; Sergo, V.; Ventura, A.; Bonifacio, A. SERS of Cells: What Can We Learn from Cell Lysates? Anal. Chim. Acta 2018, 1005, 93–100. [Google Scholar] [CrossRef]
- Beier, H.T.; Cowan, C.B.; Chou, I.H.; Pallikal, J.; Henry, J.E.; Benford, M.E.; Jackson, J.B.; Good, T.A.; Coté, G.L. Application of Surface-Enhanced Raman Spectroscopy for Detection of Beta Amyloid Using Nanoshells. Plasmonics 2007, 2, 55–64. [Google Scholar] [CrossRef]
- Petersen, D.; Naveed, P.; Ragheb, A.; Niedieker, D.; El-Mashtoly, S.F.; Brechmann, T.; Kötting, C.; Schmiegel, W.H.; Freier, E.; Pox, C.; et al. Raman Fiber-Optical Method for Colon Cancer Detection: Cross-Validation and Outlier Identification Approach. Spectrochim. Acta Part A Mol. Biomol. Spectrosc. 2017, 181, 270–275. [Google Scholar] [CrossRef]
- Almond, L.M.; Hutchings, J.; Lloyd, G.; Barr, H.; Shepherd, N.; Day, J.; Stevens, O.; Sanders, S.; Wadley, M.; Stone, N.; et al. Endoscopic Raman Spectroscopy Enables Objective Diagnosis of Dysplasia in Barrett’s Esophagus. Gastrointest. Endosc. 2014, 79, 37–45. [Google Scholar] [CrossRef]
- Hsu, C.-W.; Huang, C.-C.; Sheu, J.-H.; Lin, C.-W.; Lin, L.-F.; Jin, J.-S.; Chen, W. Differentiating Gastrointestinal Stromal Tumors from Gastric Adenocarcinomas and Normal Mucosae Using Confocal Raman Microspectroscopy. J. Biomed. Opt. 2016, 21, 075006. [Google Scholar] [CrossRef] [PubMed]
- Hsu, C.W.; Huang, C.C.; Sheu, J.H.; Lin, C.W.; Lin, L.F.; Jin, J.S.; Chau, L.K.; Chen, W. Novel Method for Differentiating Histological Types of Gastric Adenocarcinoma by Using Confocal Raman Microspectroscopy. PLoS ONE 2016, 11, e0159829. [Google Scholar] [CrossRef]
- Nijssen, A.; Schut, T.C.B.; Heule, F.; Caspers, P.J.; Hayes, D.P.; Neumann, M.H.A.; Puppels, G.J. Discriminating Basal Cell Carcinoma from Its Surrounding Tissue by Raman Spectroscopy. J. Investig. Dermatol. 2002, 119, 64–69. [Google Scholar] [CrossRef] [PubMed] [Green Version]
- Gniadecka, M.; Philipsen, P.A.; Sigurdsson, S.; Wessel, S.; Nielsen, O.F.; Christensen, D.H.; Hercogova, J.; Rossen, K.; Thomsen, H.K.; Gniadecki, R.; et al. Melanoma Diagnosis by Raman Spectroscopy and Neural Networks: Structure Alterations in Proteins and Lipids in Intact Cancer Tissue. J. Investig. Dermatol. 2004, 122, 443–449. [Google Scholar] [CrossRef] [Green Version]
- Bodanese, B.; Silveira, F.L.; Zĝngaro, R.A.; Pacheco, M.T.T.; Pasqualucci, C.A.; Silveira, L. Discrimination of Basal Cell Carcinoma and Melanoma from Normal Skin Biopsies in Vitro through Raman Spectroscopy and Principal Component Analysis. Photomed. Laser Surg. 2012, 30, 381–387. [Google Scholar] [CrossRef] [PubMed] [Green Version]
- Nijssen, A.; Maquelin, K.; Santos, L.F.; Caspers, P.J.; Schut, T.C.B.; den Hollander, J.C.; Neumann, M.H.A.; Puppels, G.J. Discriminating Basal Cell Carcinoma from Perilesional Skin Using High Wave-Number Raman Spectroscopy. J. Biomed. Opt. 2007, 12, 034004. [Google Scholar] [CrossRef]
- Haka, A.S.; Shafer-Peltier, K.E.; Fitzmaurice, M.; Crowe, J.; Dasari, R.R.; Feld, M.S. Identifying Microcalcifications in Benign and Malignant Breast Lesions by Probing Differences in Their Chemical Composition Using Raman Spectroscopy. Cancer Res. 2002, 62, 5375–5380. [Google Scholar] [PubMed]
- Frank, C.J.; McCreery, R.L.; Redd, D.C.B.; Gansler, T.S. Characterization of Human Breast Biopsy Specimens with Near-IR Raman Spectroscopy. Anal. Chem. 1994, 66, 319–326. [Google Scholar] [CrossRef] [PubMed]
- Haka, A.S.; Shafer-Peltier, K.E.; Fitzmaurice, M.; Crowe, J.; Dasari, R.R.; Feld, M.S. Diagnosing Breast Cancer by Using Raman Spectroscopy. Proc. Natl. Acad. Sci. USA 2005, 102, 12371–12376. [Google Scholar] [CrossRef] [PubMed] [Green Version]
- Lazaro-Pacheco, D.; Shaaban, A.M.; Rehman, S.; Rehman, I. Raman Spectroscopy of Breast Cancer. Appl. Spectrosc. Rev. 2020, 55, 439–475. [Google Scholar] [CrossRef]
- Magee, N.D.; Villaumie, J.S.; Marple, E.T.; Ennis, M.; Elborn, J.S.; McGarvey, J.J. Ex Vivo Diagnosis of Lung Cancer Using a Raman Miniprobe. J. Phys. Chem. B 2009, 113, 8137–8141. [Google Scholar] [CrossRef] [PubMed]
- Huang, Z.; McWilliams, A.; Lui, H.; McLean, D.I.; Lam, S.; Zeng, H. Near-Infrared Raman Spectroscopy for Optical Diagnosis of Lung Cancer. Int. J. Cancer 2003, 107, 1047–1052. [Google Scholar] [CrossRef] [PubMed]
- Zhang, K.; Hao, C.; Huo, Y.; Man, B.; Zhang, C.; Yang, C.; Liu, M.; Chen, C. Label-Free Diagnosis of Lung Cancer with Tissue-Slice Surface-Enhanced Raman Spectroscopy and Statistical Analysis. Lasers Med. Sci. 2019, 34, 1849–1855. [Google Scholar] [CrossRef]
- Chrabaszcz, K.; Kochan, K.; Fedorowicz, A.; Jasztal, A.; Buczek, E.; Leslie, L.S.; Bhargava, R.; Malek, K.; Chlopicki, S.; Marzec, K.M. FT-IR- and Raman-Based Biochemical Profiling of the Early Stage of Pulmonary Metastasis of Breast Cancer in Mice. Analyst 2018, 143, 2042–2050. [Google Scholar] [CrossRef] [PubMed]
- Li, X. Spectral Analysis of Human Saliva for Detection of Lung Cancer Using Surface-Enhanced Raman Spectroscopy. J. Biomed. Opt. 2012, 17, 037003. [Google Scholar] [CrossRef] [Green Version]
- Qian, K.; Wang, Y.; Hua, L.; Chen, A.; Zhang, Y. New Method of Lung Cancer Detection by Saliva Test Using Surface-Enhanced Raman Spectroscopy. Thorac. Cancer 2018, 9, 1556–1561. [Google Scholar] [CrossRef] [PubMed]
- Kowalska, A.A.; Berus, S.; Szleszkowski, Ł.; Kamińska, A.; Kmiecik, A.; Ratajczak-Wielgomas, K.; Jurek, T.; Zadka, Ł. Brain Tumour Homogenates Analysed by Surface-Enhanced Raman Spectroscopy: Discrimination among Healthy and Cancer Cells. Spectrochim. Acta Part A Mol. Biomol. Spectrosc. 2019, 231, 117769. [Google Scholar] [CrossRef] [PubMed]
- Koljenović, S.; Choo-Smith, L.P.; Schut, T.C.B.; Kros, J.M.; Van den Berge, H.J.; Puppels, G.J. Discriminating Vital Tumor from Necrotic Tissue in Human Glioblastoma Tissue Samples by Raman Spectroscopy. Lab. Investig. 2002, 82, 1265–1277. [Google Scholar] [CrossRef] [PubMed]
- Koljenović, S.; Schut, T.B.; Vincent, A.; Kros, J.M.; Puppels, G.J. Detection of Meningioma in Dura Mater by Raman Spectroscopy. Anal. Chem. 2005, 77, 7958–7965. [Google Scholar] [CrossRef]
- Abramczyk, H.; Brozek-Pluska, B.; Jarota, A.; Surmacki, J.; Imiela, A.; Kopec, M. A Look into the Use of Raman Spectroscopy for Brain and Breast Cancer Diagnostics: Linear and Non-Linear Optics in Cancer Research as a Gateway to Tumor Cell Identity. Expert Rev. Mol. Diagn. 2020, 20, 99–115. [Google Scholar] [CrossRef] [Green Version]
- Krafft, C.; Neudert, L.; Simat, T.; Salzer, R. Near Infrared Raman Spectra of Human Brain Lipids. Spectrochim. Acta Part A Mol. Biomol. Spectrosc. 2005, 61, 1529–1535. [Google Scholar] [CrossRef] [PubMed]
- Muñiz, R.; Pérez, M.A.; De La Torre, C.; Carleos, C.E.; Corral, N.; Baro, J.A. Comparison of Principal Component Regression (PCR) and Partial Least Square (PLS) Methods in Prediction of Raw Milk Composition by VIS-NIR Spectrometry. Application to Development of on-Line Sensors for Fat, Protein and Lactose Contents. In Proceedings of the XIX IMEKO World Congress Fundamental and Applied Metrology, Lisbon, Portugal, 6–11 September 2009; pp. 2498–2502. [Google Scholar]
- Khajehsharifi, H.; Eskandari, Z.; Sareban, N. Using Partial Least Squares and Principal Component Regression in Simultaneous Spectrophotometric Analysis of Pyrimidine Bases. Arab. J. Chem. 2017, 10, S141–S147. [Google Scholar] [CrossRef] [Green Version]
- Bergholt, M.S.; Zheng, W.; Lin, K.; Wang, J.; Xu, H.; Ren, J.L.; Ho, K.Y.; Teh, M.; Yeoh, K.G.; Huang, Z. Characterizing Variability of in Vivo Raman Spectroscopic Properties of Different Anatomical Sites of Normal Colorectal Tissue towards Cancer Diagnosis at Colonoscopy. Anal. Chem. 2015, 87, 960–966. [Google Scholar] [CrossRef] [PubMed]
- Osmani, A.; Par, M.; Škrabić, M.; Vodanović, M.; Gamulin, O. Principal Component Regression for Forensic Age Determination Using the Raman Spectra of Teeth. Appl. Spectrosc. 2020, 74, 1473–1485. [Google Scholar] [CrossRef] [PubMed]
- Hemmateenejad, B.; Akhond, M.; Samari, F. A Comparative Study between PCR and PLS in Simultaneous Spectrophotometric Determination of Diphenylamine, Aniline, and Phenol: Effect of Wavelength Selection. Spectrochim. Acta Part A Mol. Biomol. Spectrosc. 2007, 67, 958–965. [Google Scholar] [CrossRef] [PubMed]
- Thien, T.F.; Yeo, W.S. A Comparative Study between PCR, PLSR, and LW-PLS on the Predictive Performance at Different Data Splitting Ratios. Chem. Eng. Commun. 2021, 1–18. [Google Scholar] [CrossRef]
- Wentzell, P.D.; Montoto, L.V. Comparison of Principal Components Regression and Partial Least Squares Regression through Generic Simulations of Complex Mixtures. Chemom. Intell. Lab. Syst. 2003, 65, 257–279. [Google Scholar] [CrossRef]
- Khajehsharifi, H.; Pourbasheer, E.; Tavallali, H.; Sarvi, S.; Sadeghi, M. The Comparison of Partial Least Squares and Principal Component Regression in Simultaneous Spectrophotometric Determination of Ascorbic Acid, Dopamine and Uric Acid in Real Samples. Arab. J. Chem. 2017, 10, S3451–S3458. [Google Scholar] [CrossRef] [Green Version]
- Wang, L.; Guo, T.; Lu, Q.; Yan, X.; Zhong, D.; Zhang, Z.; Ni, Y.; Han, Y.; Cui, D.; Li, X.; et al. Sea-Urchin-like Au Nanocluster with Surface-Enhanced Raman Scattering in Detecting Epidermal Growth Factor Receptor (EGFR) Mutation Status of Malignant Pleural Effusion. ACS Appl. Mater. Interfaces 2015, 7, 359–369. [Google Scholar] [CrossRef]
- Liu, K.; Jin, S.; Song, Z.; Jiang, L. High Accuracy Detection of Malignant Pleural Effusion Based on Label-Free Surface-Enhanced Raman Spectroscopy and Multivariate Statistical Analysis. Spectrochim. Acta Part A Mol. Biomol. Spectrosc. 2020, 226, 117632. [Google Scholar] [CrossRef]
- Chen, X.; Li, X.; Yang, H.; Xie, J.; Liu, A. Diagnosis and Staging of Diffuse Large B-Cell Lymphoma Using Label-Free Surface-Enhanced Raman Spectroscopy. Spectrochim. Acta Part A Mol. Biomol. Spectrosc. 2022, 267, 120571. [Google Scholar] [CrossRef] [PubMed]
- Chen, X.; Li, X.; Xie, J.; Yang, H.; Liu, A. Non-Invasive Discrimination of Multiple Myeloma Using Label-Free Serum Surface-Enhanced Raman Scattering Spectroscopy in Combination with Multivariate Analysis. Anal. Chim. Acta 2022, 1191, 339296. [Google Scholar] [CrossRef] [PubMed]
- Czaplicka, M.; Kowalska, A.A.; Nowicka, A.B.; Kurzydłowski, D.; Gronkiewicz, Z.; Machulak, A.; Kukwa, W.; Kamińska, A. Raman Spectroscopy and Surface-Enhanced Raman Spectroscopy (SERS) Spectra of Salivary Glands Carcinoma, Tumor and Healthy Tissues and Their Homogenates Analyzed by Chemometry: Towards Development of the Novel Tool for Clinical Diagnosis. Anal. Chim. Acta 2021, 1177, 338784. [Google Scholar] [CrossRef] [PubMed]
- Szymborski, T.; Stepanenko, Y.; Nicinski, K.; Piecyk, P.; Berus, S.M.; Adamczyk-Poplawska, M.; Kaminska, A. Ultrasensitive SERS Platform Made via Femtosecond Laser Micromachining for Biomedical Applications. J. Mater. Res. Technol. 2021, 12, 1496–1507. [Google Scholar] [CrossRef]
- Korczy, P.; Górska, K.; Konopka, D.; Al-haj, D.; Filipiak, K.J.; Krenke, R. Significance of Congestive Heart Failure as a Cause of Pleural Effusion: Pilot Data from a Large Multidisciplinary Teaching Hospital. Cardiol. J. 2020, 27, 254–261. [Google Scholar] [CrossRef] [Green Version]
- Dixit, R.; Agarwal, K.; Gokhroo, A.; Patil, C.; Meena, M.; Shah, N.; Arora, P. Diagnosis and Management Options in Malignant Pleural Effusions. Lung India 2017, 34, 160–166. [Google Scholar] [CrossRef]
- Li, X.; Yang, T.; Li, S.; Wang, D.; Song, Y.; Zhang, S. Raman Spectroscopy Combined with Principal Component Analysis and k Nearest Neighbour Analysis for Non-Invasive Detection of Colon Cancer. Laser Phys. 2016, 26, 035702. [Google Scholar] [CrossRef] [Green Version]
- Jozkowicz, A.; Was, H.; Dulak, J. Heme Oxygenase-1 in Tumors: Is It a False Friend? Antioxid. Redox Signal. 2007, 9, 2099–2117. [Google Scholar] [CrossRef] [Green Version]
- Chen, N.; Rong, M.; Shao, X.; Zhang, H.; Liu, S.; Dong, B.; Xue, W.; Wang, T.; Li, T.; Pan, J. Surface-Enhanced Raman Spectroscopy of Serum Accurately Detects Prostate Cancer in Patients with Prostate-Specific Antigen Levels of 4–10 Ng/Ml. Int. J. Nanomed. 2017, 12, 5399–5407. [Google Scholar] [CrossRef] [Green Version]
- Chisanga, M.; Muhamadali, H.; Ellis, D.I.; Goodacre, R. Surface-Enhanced Raman Scattering (SERS) in Microbiology: Illumination and Enhancement of the Microbial World. Appl. Spectrosc. 2018, 72, 987–1000. [Google Scholar] [CrossRef]
- Westley, C.; Xu, Y.; Thilaganathan, B.; Carnell, A.J.; Turner, N.J.; Goodacre, R. Absolute Quantification of Uric Acid in Human Urine Using Surface Enhanced Raman Scattering with the Standard Addition Method. Anal. Chem. 2017, 89, 2472–2477. [Google Scholar] [CrossRef] [PubMed] [Green Version]
- El-Said, W.A.; Kim, T.H.; Kim, H.; Choi, J.W. Detection of Effect of Chemotherapeutic Agents to Cancer Cells on Gold Nanoflower Patterned Substrate Using Surface-Enhanced Raman Scattering and Cyclic Voltammetry. Biosens. Bioelectron. 2010, 26, 1486–1492. [Google Scholar] [CrossRef] [PubMed]
- Feng, S.; Huang, S.; Lin, D.; Chen, G.; Xu, Y.; Li, Y.; Huang, Z.; Pan, J.; Chen, R.; Zeng, H. Surface-Enhanced Raman Spectroscopy of Saliva Proteins for the Noninvasive Differentiation of Benign and Malignant Breast Tumors. Int. J. Nanomed. 2015, 10, 537–547. [Google Scholar] [CrossRef] [PubMed] [Green Version]
- Li, Y.; Wen, Z.N.; Li, L.J.; Li, M.L.; Gao, N.; Guo, Y.Z. Research on the Raman Spectral Character and Diagnostic Value of Squamous Cell Carcinoma of Oral Mucosa. J. Raman Spectrosc. 2010, 41, 142–147. [Google Scholar] [CrossRef]
- Kowalska, A.A.; Nowicka, A.B.; Szymborski, T.; Piecyk, P.; Kamińska, A. SERS-Based Sensor for Direct L-Selectin Level Determination in Plasma Samples as Alternative Method of Tumor Detection. J. Biophotonics 2021, 14, e202000318. [Google Scholar] [CrossRef]
- Talari, A.C.S.; Movasaghi, Z.; Rehman, S.; Rehman, I.U. Raman Spectroscopy of Biological Tissues. Appl. Spectrosc. Rev. 2015, 50, 46–111. [Google Scholar] [CrossRef]
- Sikirzhytskaya, A.; Sikirzhytski, V.; Lednev, I.K. Determining Gender by Raman Spectroscopy of a Bloodstain. Anal. Chem. 2017, 89, 1486–1492. [Google Scholar] [CrossRef]
- Kim, H.I.; Lim, H.; Moon, A. Sex Differences in Cancer: Epidemiology, Genetics and Therapy. Biomol. Ther. 2018, 26, 335–342. [Google Scholar] [CrossRef]
- Conforti, F.; Pala, L.; Pagan, E.; Corti, C.; Bagnardi, V.; Queirolo, P.; Catania, C.; De Pas, T.; Giaccone, G. Sex-Based Differences in Response to Anti-PD-1 or PD-L1 Treatment in Patients with Non-Small-Cell Lung Cancer Expressing High PD-L1 Levels. A Systematic Review and Meta-Analysis of Randomized Clinical Trials. ESMO Open 2021, 6, 100251. [Google Scholar] [CrossRef]


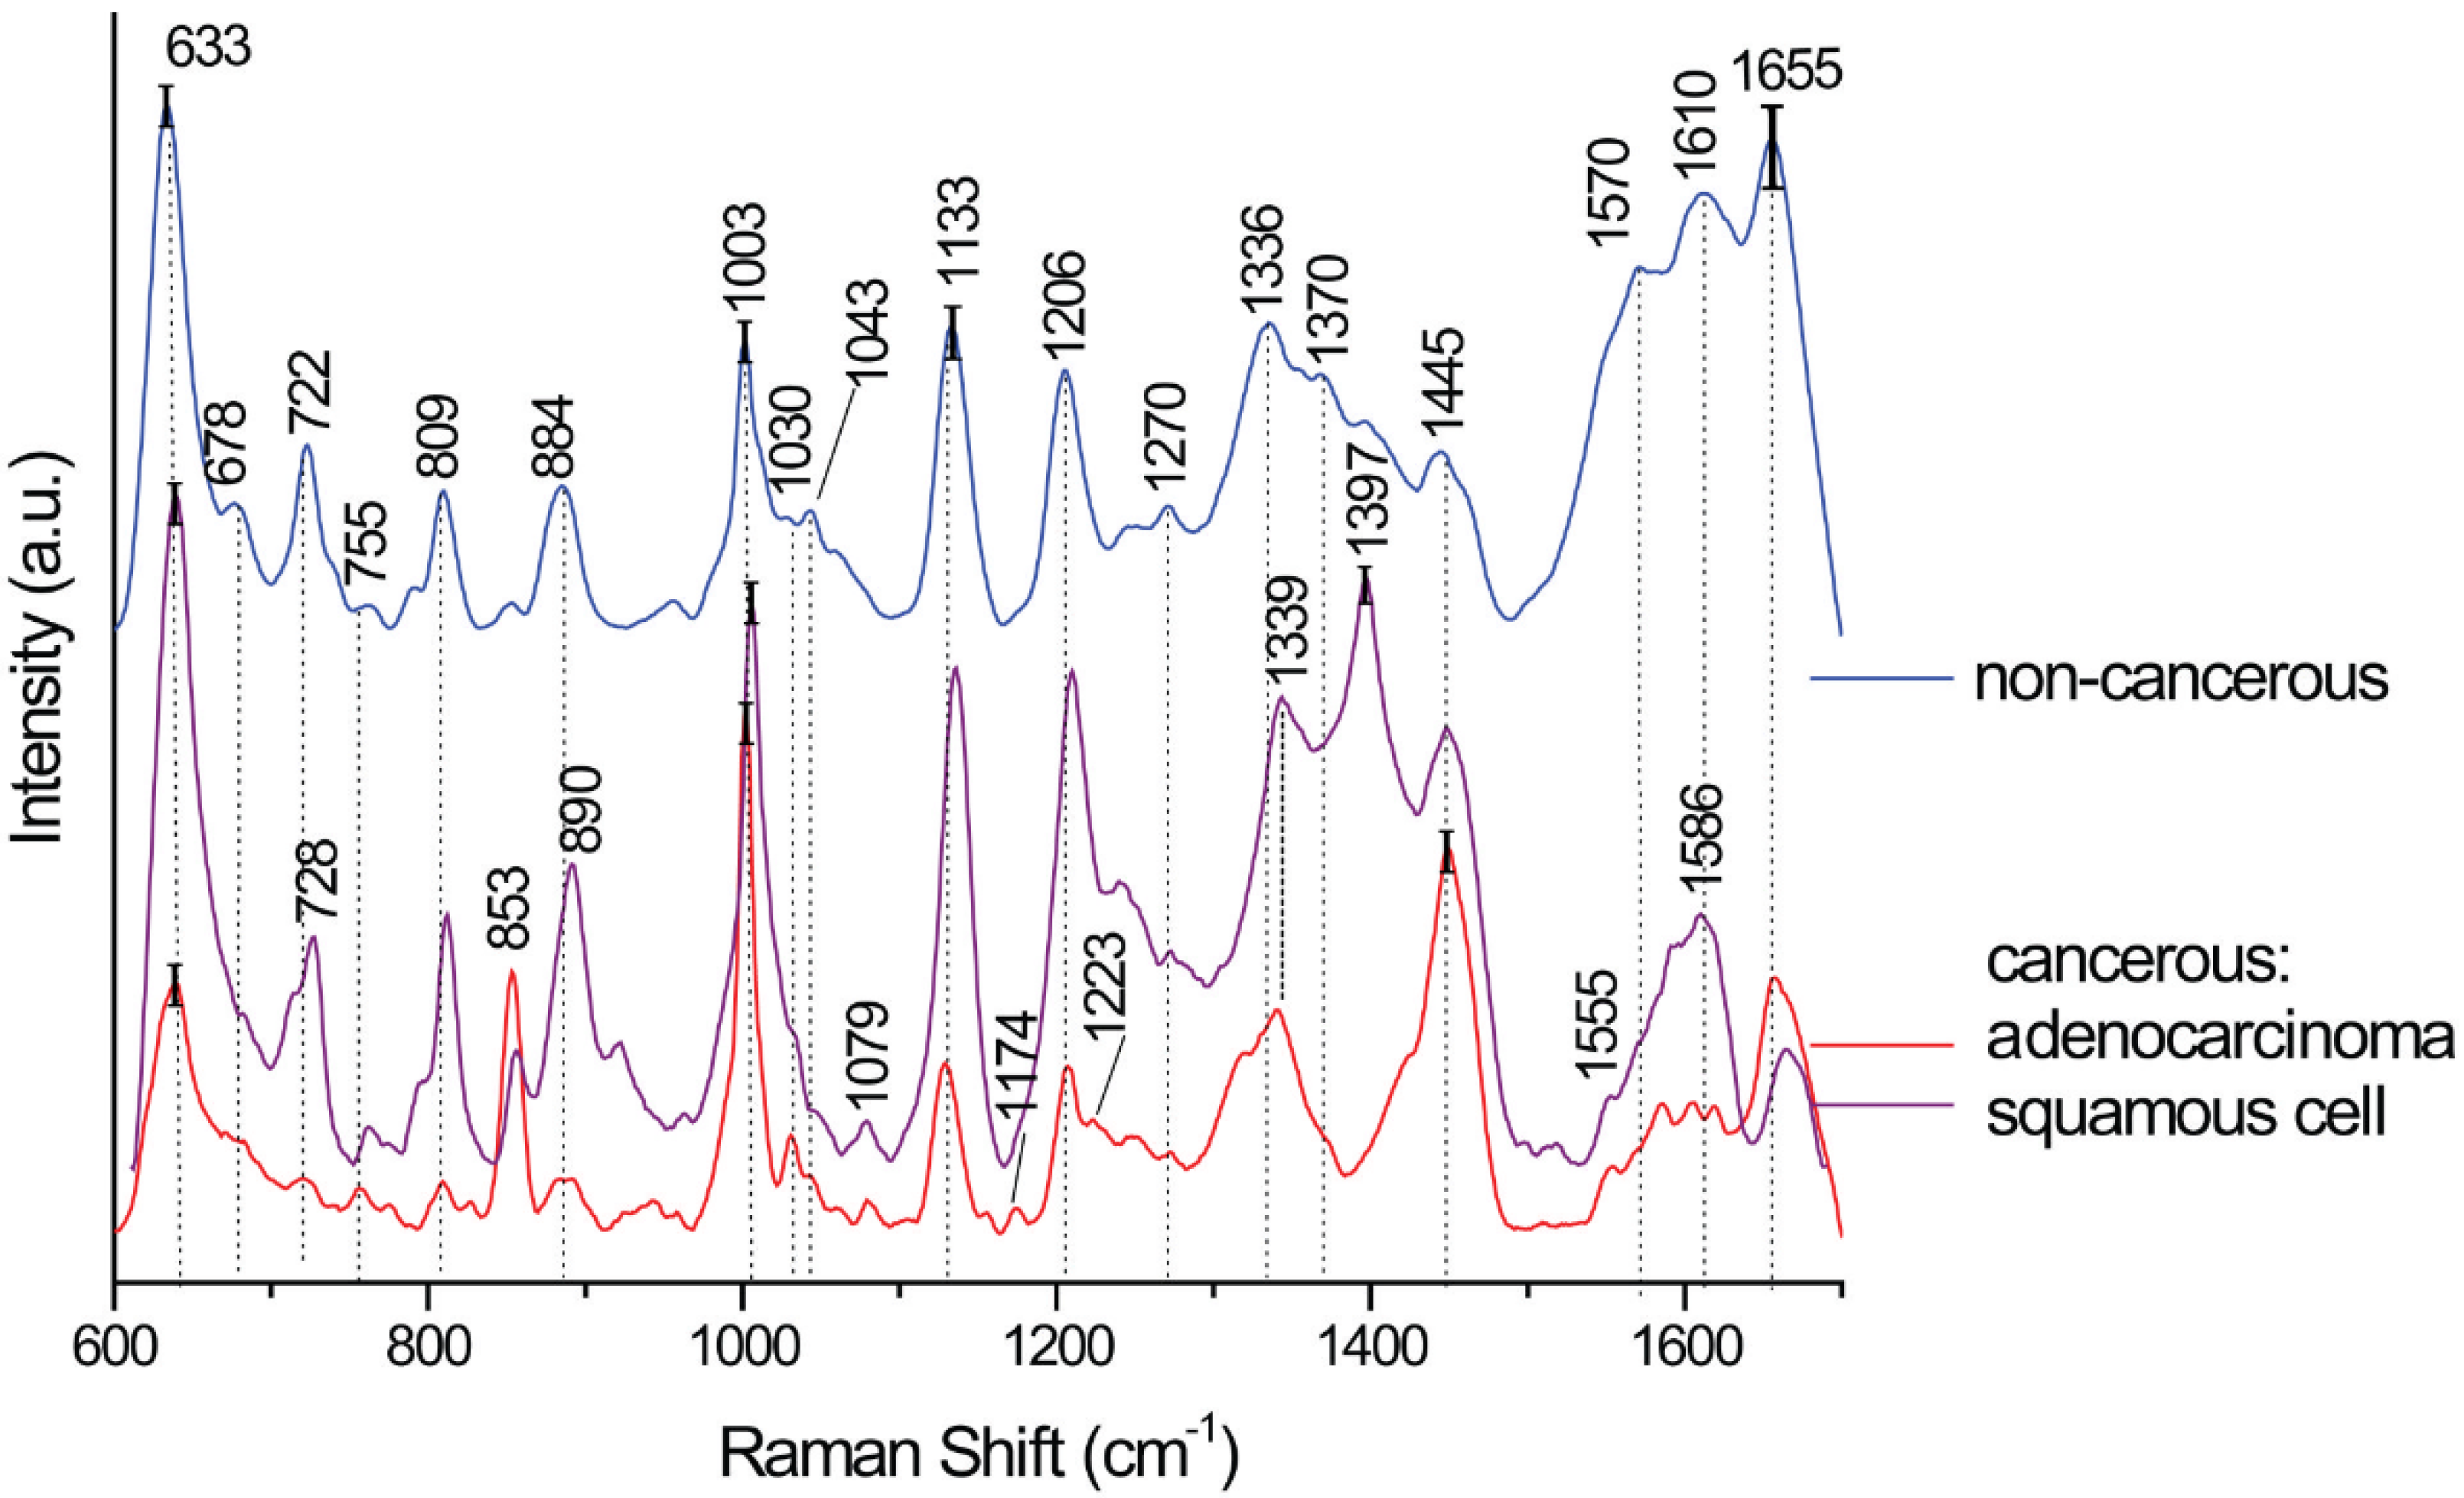
| SERS Bands | Compound/Assignments | ||
|---|---|---|---|
| Cancerous | Non-Cancerous | ||
| Adenocarcinoma | Squamous Cell | ||
| 633 | 633 | 633 | Phenylalanine (skeletal) |
| 678 | Guanine (DNA) | ||
| 722 | DNA | ||
| 728 | 728 | Tryptophan, lipids | |
| 755 | 755 | CH2 rocking, symmetric breathing, tryptophan | |
| 809 | 809 | 809 | Cytosine, uracil, tyrosine |
| 853 | 853 | Tyrosine, proteins | |
| 890 | 890 | 884 | Proteins |
| 1003 | 1003 | 1003 | Phenylalanine (ring breathing mode) |
| 1030 | 1030 | 1030 | Proteins, C-H in plane Phe, deoxyribose, str. (C-O) |
| 1043 | 1043 | Proteins, ν (C-O), ν (C-N) | |
| 1079 | 1079 | CC or PO2 stretching, phospholipids in nucleic acids | |
| 1133 | 1133 | 1133 | ν (C-N) of proteins or ν (C-C) lipids |
| 1174 | CC stretching, L-phenylalanine, proteins | ||
| 1206 | 1208 | 1206 | N-C-C stretching and bending |
| 1223 | Amide III | ||
| 1270 | 1270 | 1270 | |
| 1319 | CH3 def. in collagen | ||
| 1339 | 1339 | 1336 | Adenine ring breathing, phospholipids, or nucleic acid |
| 1370 | Guanine in DNA/TRP (protein)/lipids | ||
| 1397 | CO of the COH stretching of amino acids in proteins or COO stretching | ||
| 1445 | 1445 | 1445 | CH2 bending in proteins and lipids, keratin, fatty acids, triglycerides, CH2, CH3 deformation/lipids/proteins C–H wag. |
| 1555 | 1555 | Guanine in DNA/adenine/TRP (protein) | |
| 1570 | |||
| 1586 | |||
| 1610 | 1610 | Phenylalanine, tyrosine, cytosine, | |
| 1655 | 1660 | 1655 | Amide I/C=C lipid stretch |
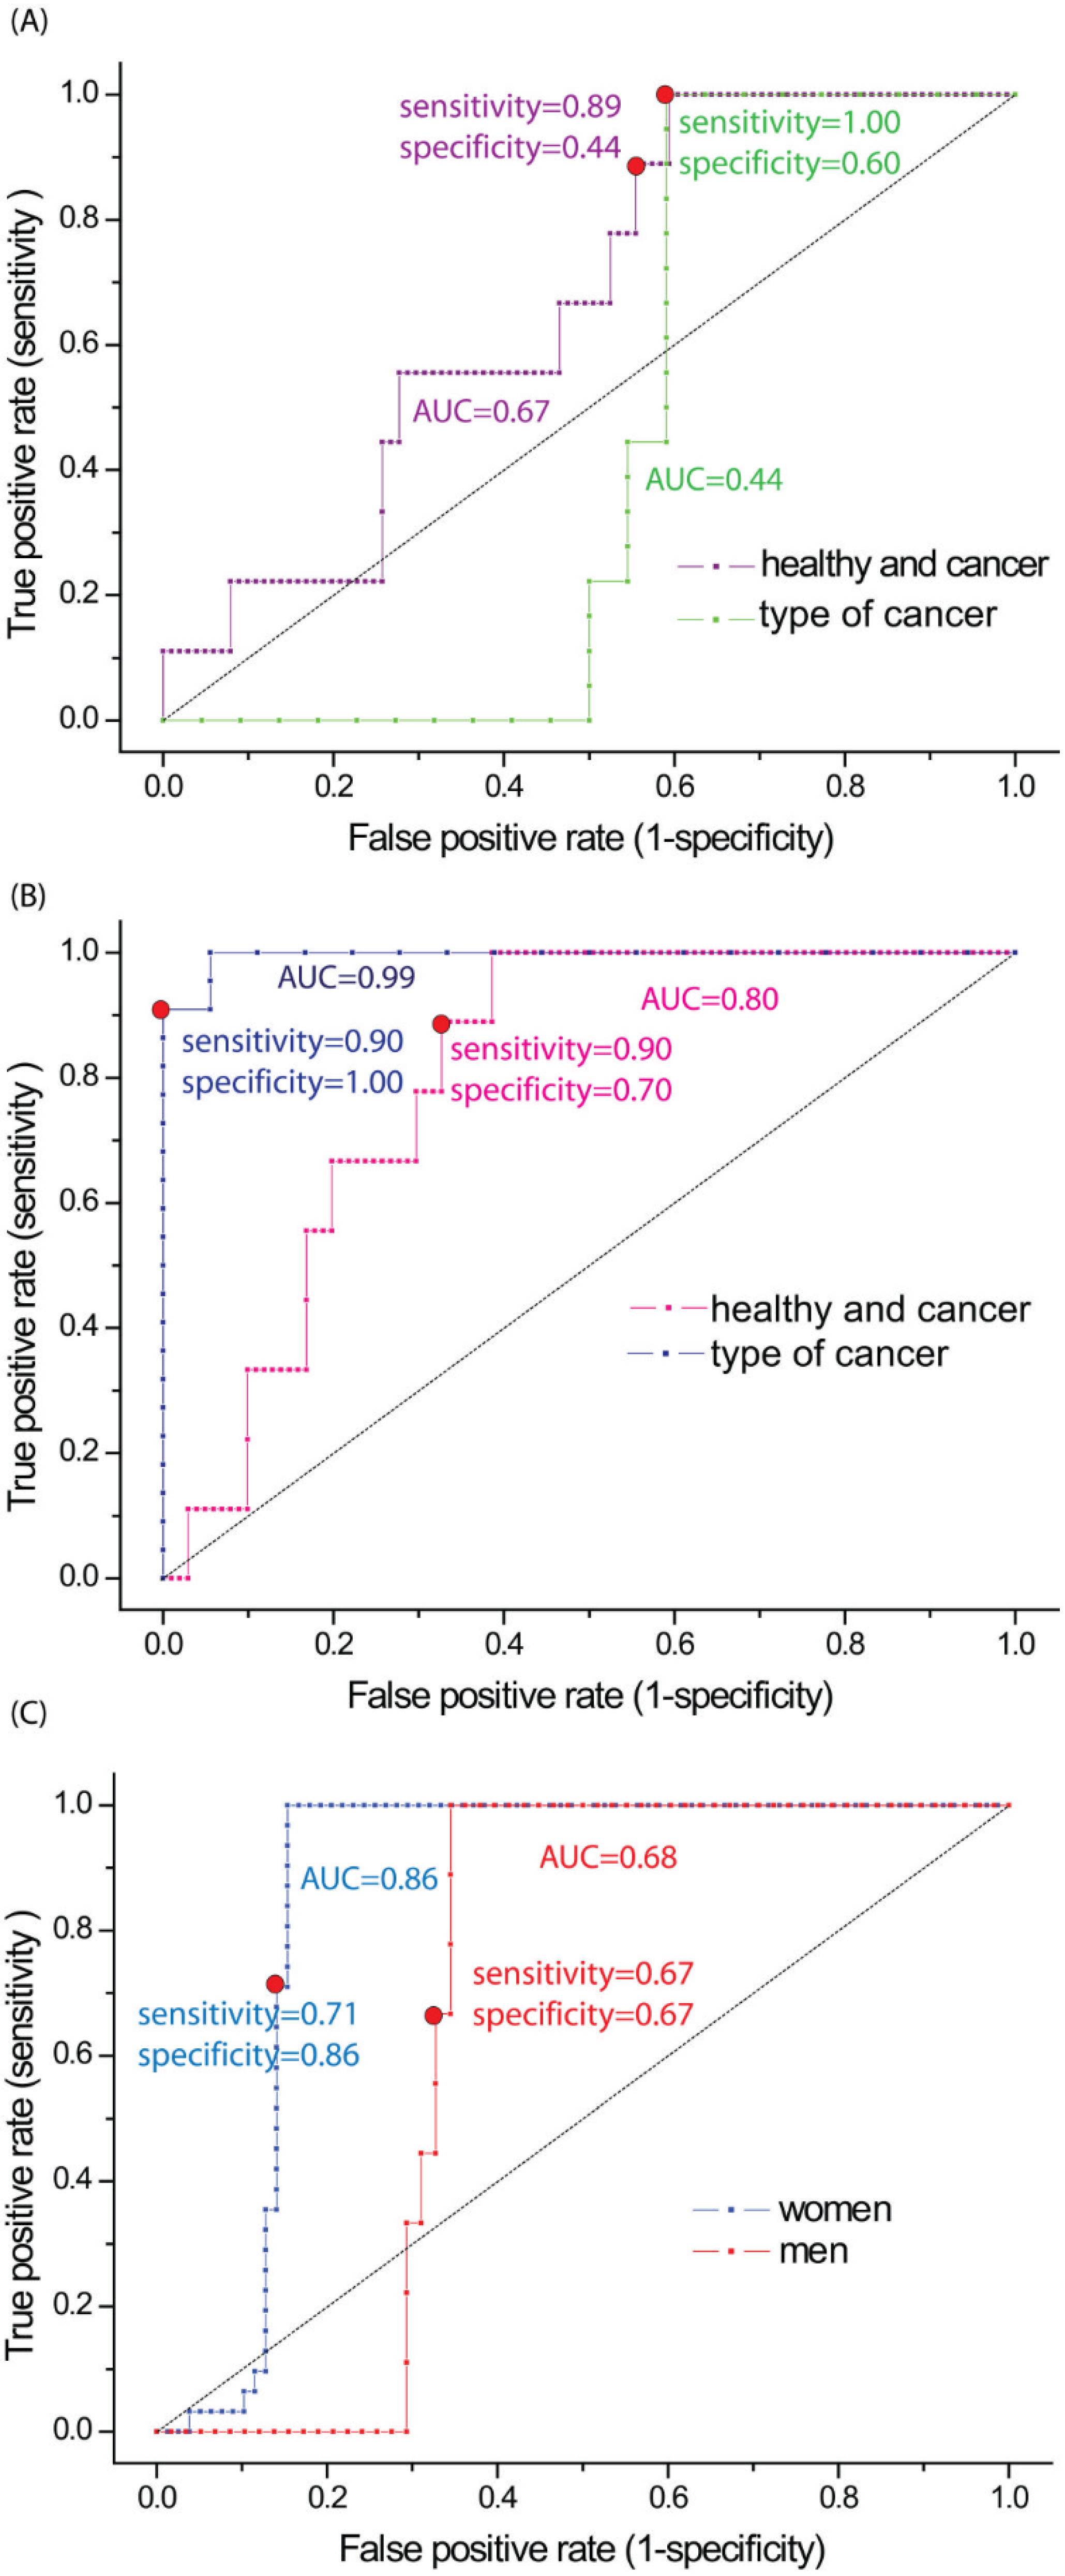
| Type of Tested Samples | Method | Sensitivity | Specificity | AUC |
|---|---|---|---|---|
| non-cancerous vs. cancerous | PCR | 0.89 | 0.44 | 0.67 |
| PLS-DA | 0.90 | 0.70 | 0.80 | |
| Women | PLS-DA | 0.71 | 0.86 | 0.86 |
| Men | PLS-DA | 0.67 | 0.67 | 0.68 |
| squamous cell vs. adenocarcinoma | PCR | 1.00 | 0.60 | 0.44 |
| PLS-DA | 0.90 | 1.00 | 0.99 |
Publisher’s Note: MDPI stays neutral with regard to jurisdictional claims in published maps and institutional affiliations. |
© 2022 by the authors. Licensee MDPI, Basel, Switzerland. This article is an open access article distributed under the terms and conditions of the Creative Commons Attribution (CC BY) license (https://creativecommons.org/licenses/by/4.0/).
Share and Cite
Kowalska, A.A.; Czaplicka, M.; Nowicka, A.B.; Chmielewska, I.; Kędra, K.; Szymborski, T.; Kamińska, A. Lung Cancer: Spectral and Numerical Differentiation among Benign and Malignant Pleural Effusions Based on the Surface-Enhanced Raman Spectroscopy. Biomedicines 2022, 10, 993. https://doi.org/10.3390/biomedicines10050993
Kowalska AA, Czaplicka M, Nowicka AB, Chmielewska I, Kędra K, Szymborski T, Kamińska A. Lung Cancer: Spectral and Numerical Differentiation among Benign and Malignant Pleural Effusions Based on the Surface-Enhanced Raman Spectroscopy. Biomedicines. 2022; 10(5):993. https://doi.org/10.3390/biomedicines10050993
Chicago/Turabian StyleKowalska, Aneta Aniela, Marta Czaplicka, Ariadna B. Nowicka, Izabela Chmielewska, Karolina Kędra, Tomasz Szymborski, and Agnieszka Kamińska. 2022. "Lung Cancer: Spectral and Numerical Differentiation among Benign and Malignant Pleural Effusions Based on the Surface-Enhanced Raman Spectroscopy" Biomedicines 10, no. 5: 993. https://doi.org/10.3390/biomedicines10050993
APA StyleKowalska, A. A., Czaplicka, M., Nowicka, A. B., Chmielewska, I., Kędra, K., Szymborski, T., & Kamińska, A. (2022). Lung Cancer: Spectral and Numerical Differentiation among Benign and Malignant Pleural Effusions Based on the Surface-Enhanced Raman Spectroscopy. Biomedicines, 10(5), 993. https://doi.org/10.3390/biomedicines10050993