
Seizure Susceptibility and Sleep Disturbance as Biomarkers of Epileptogenesis after Experimental TBI

 , , and
Abstract
:1. Introduction
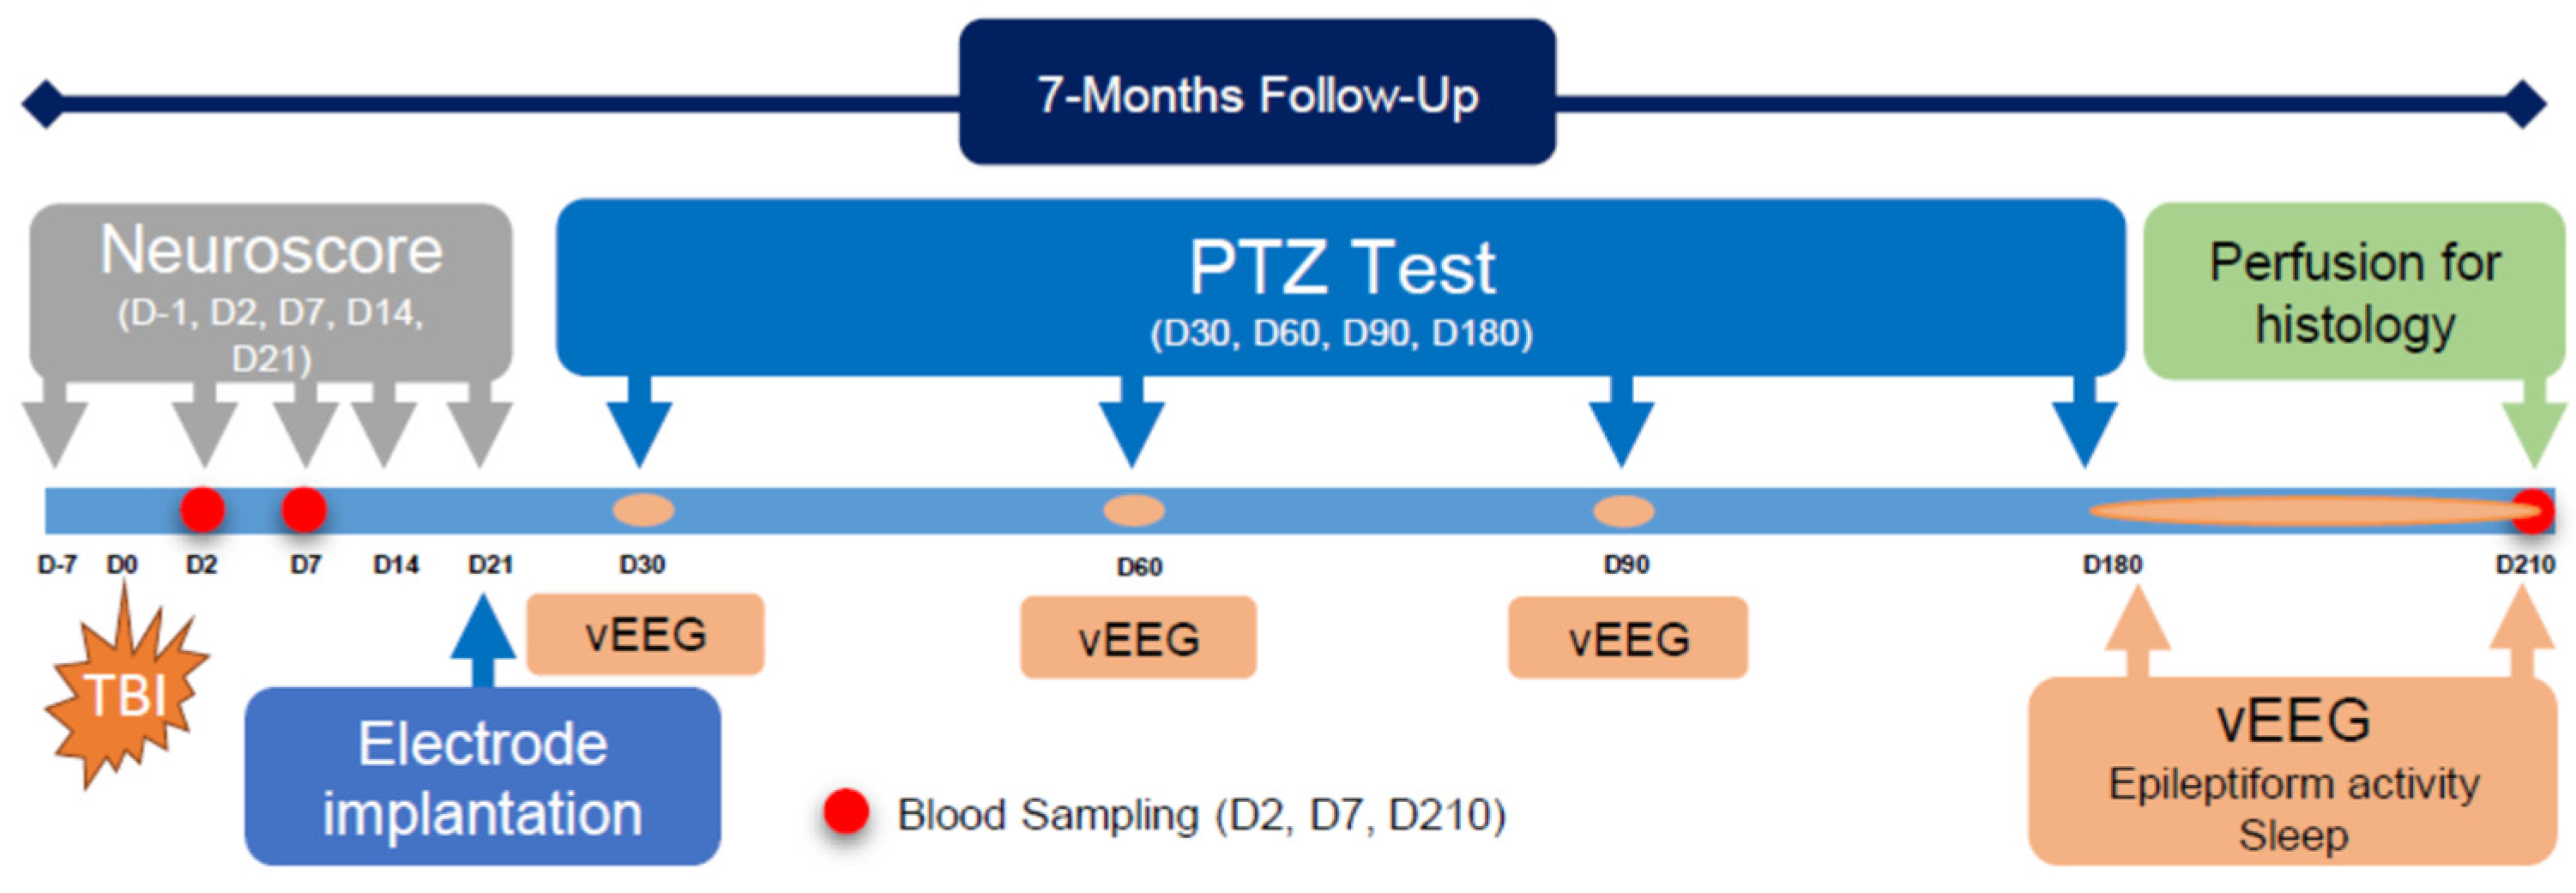
2. Methodology
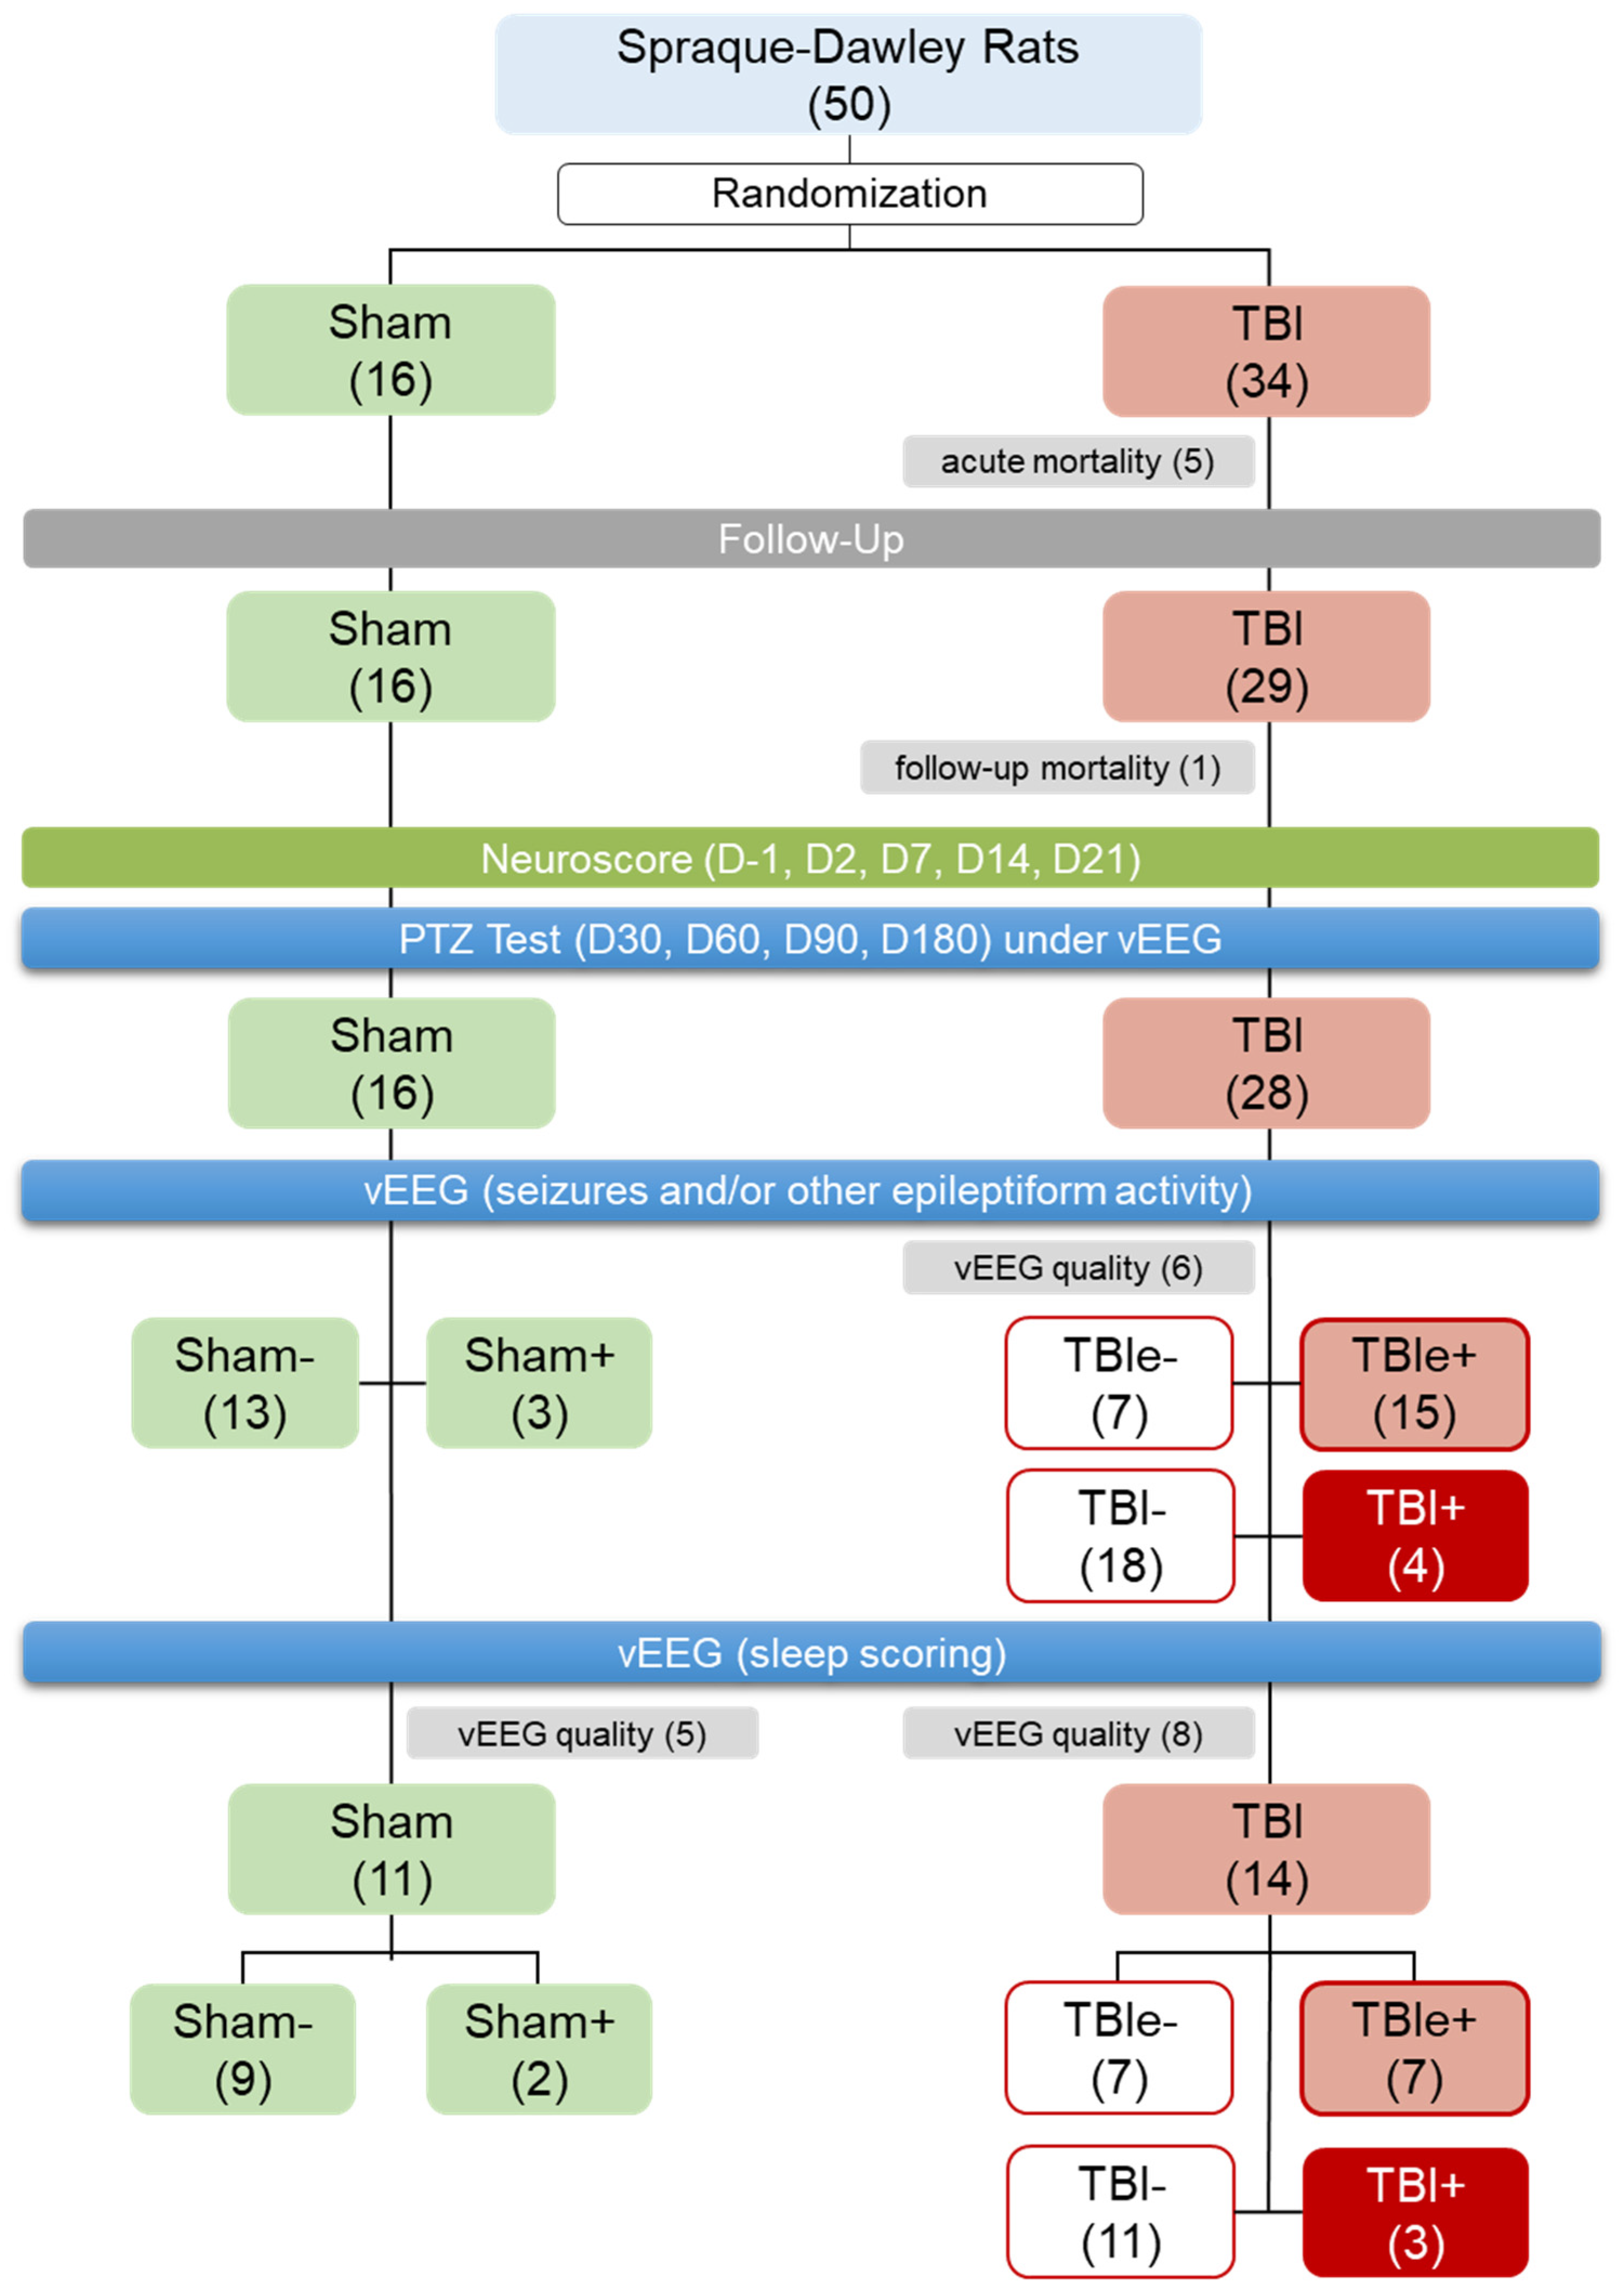
2.1. Animals
2.2. Induction of Lateral Fluid-Percussion Injury
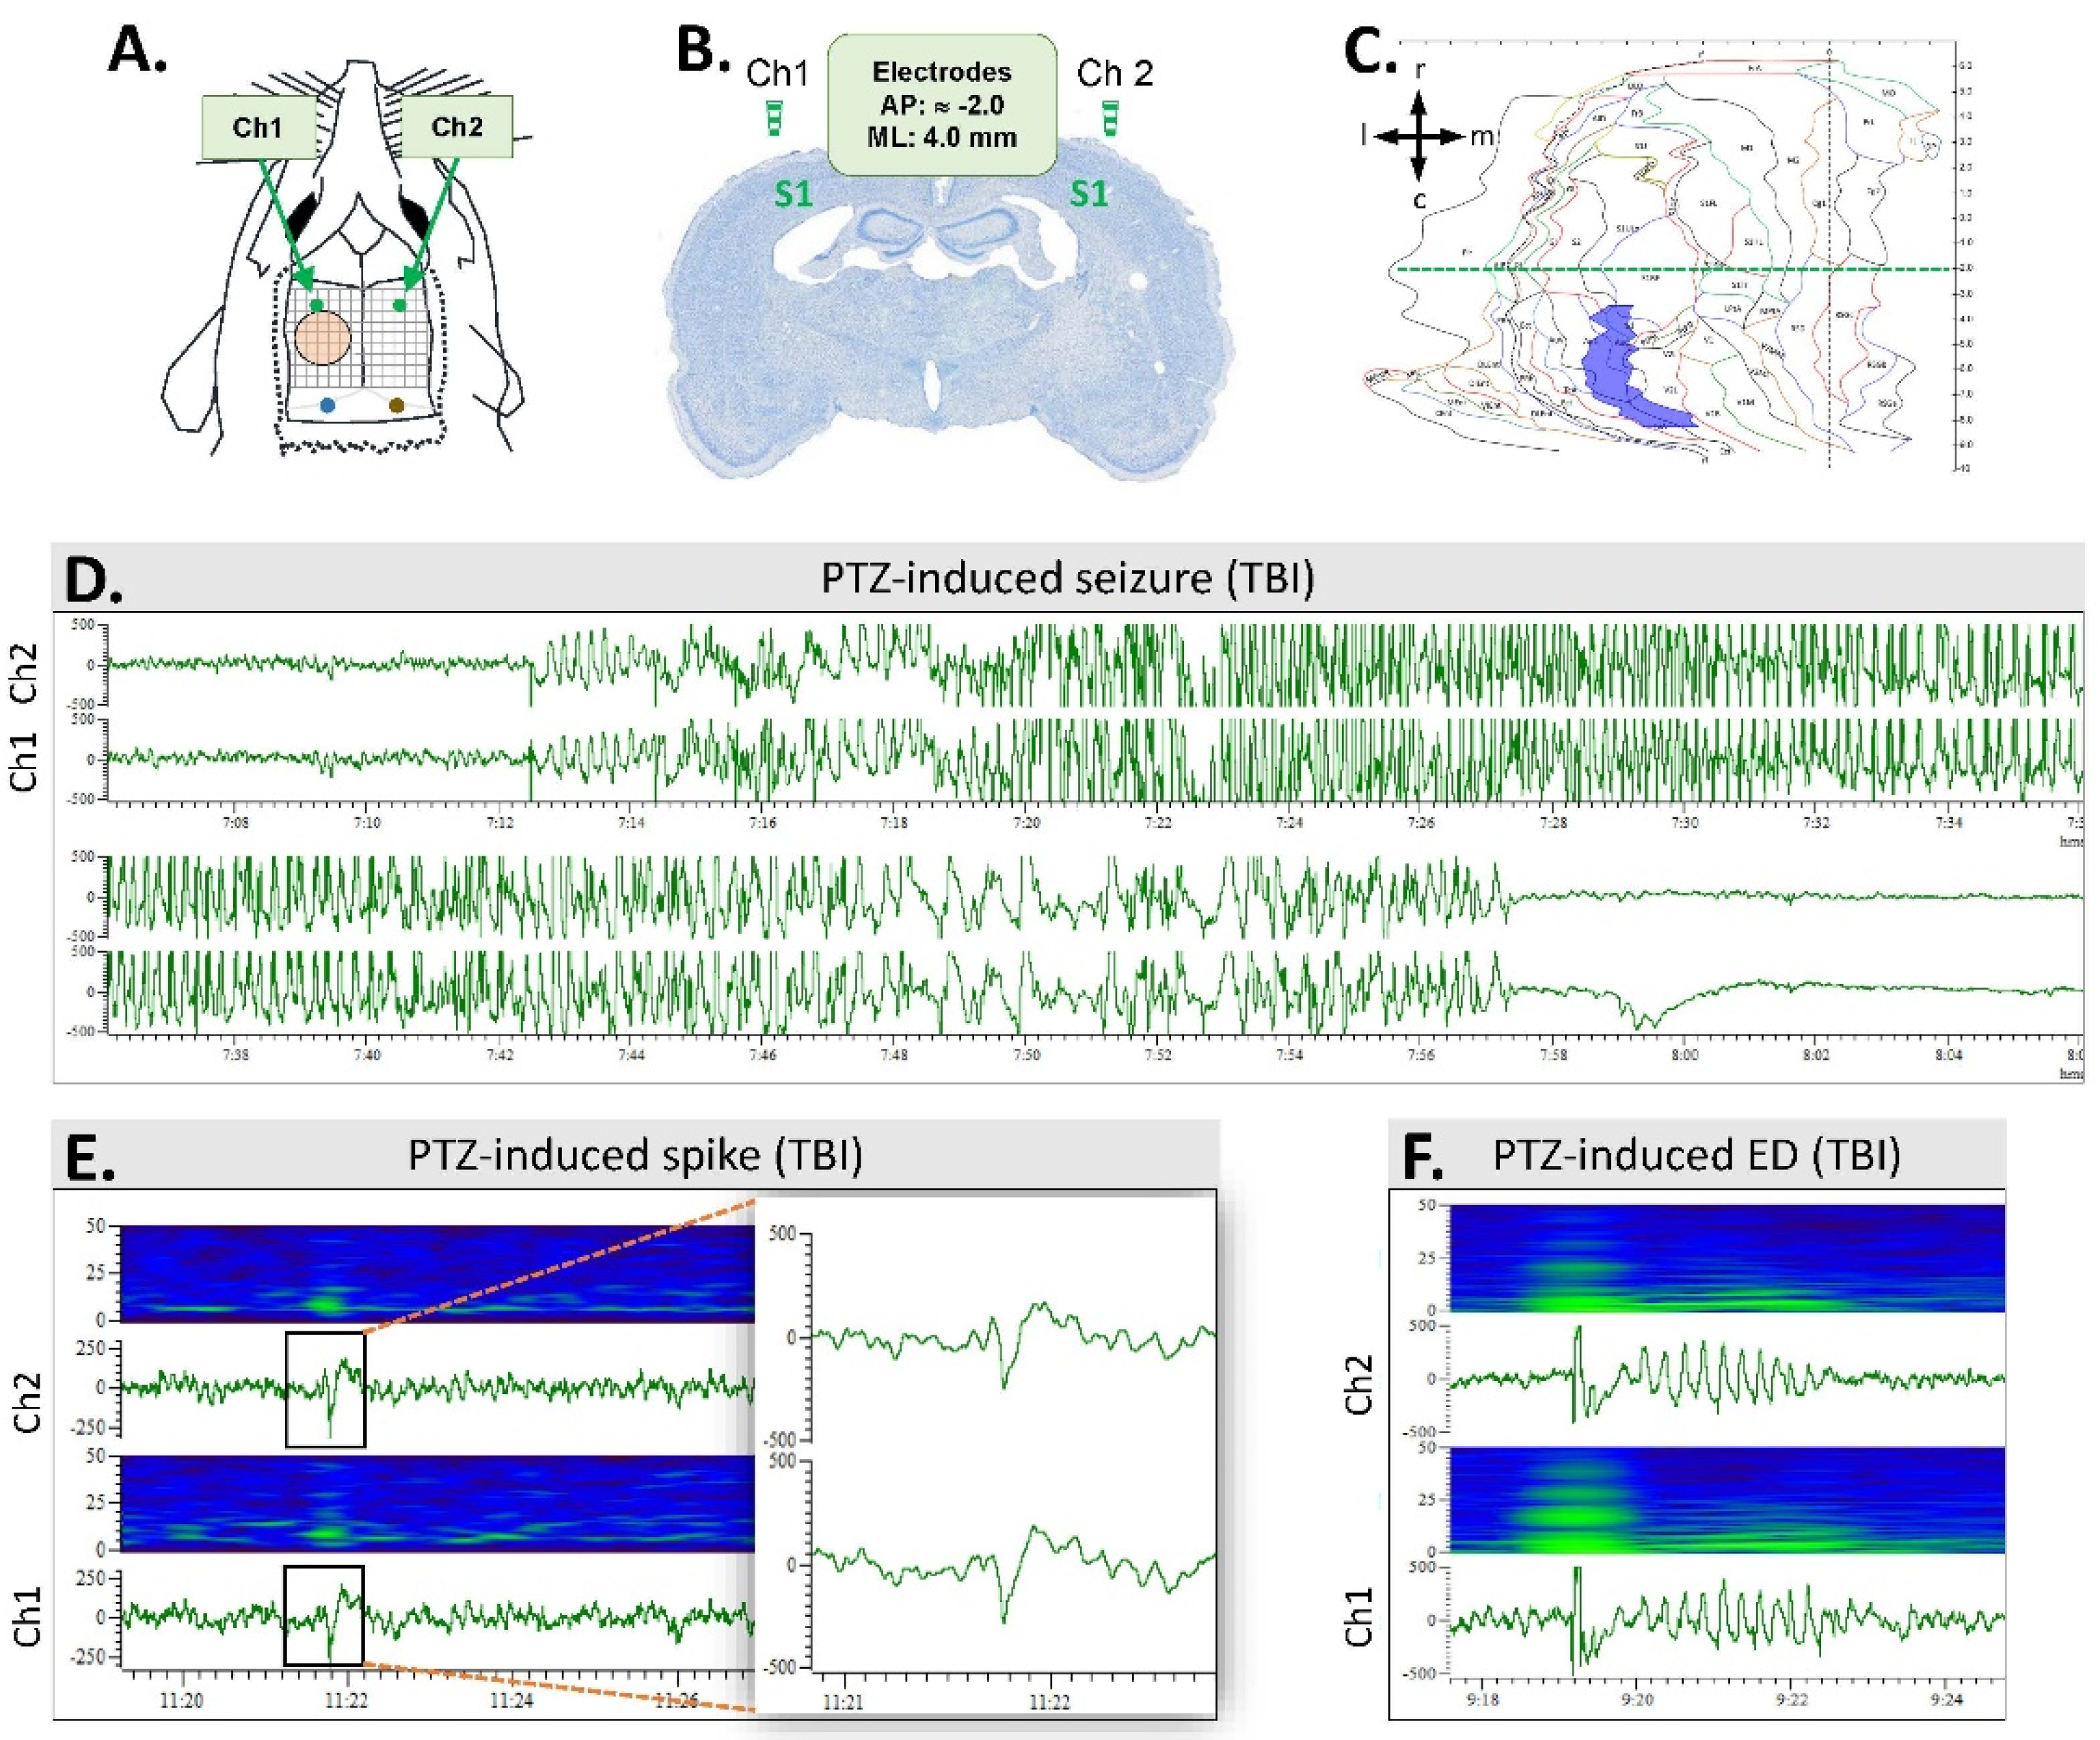
2.3. Electrode Implantation
2.4. Video Electroencephalogram (vEEG) Recording
2.5. Composite Neuroscore
2.6. Pentylenetetrazol Seizure-Susceptibility Test
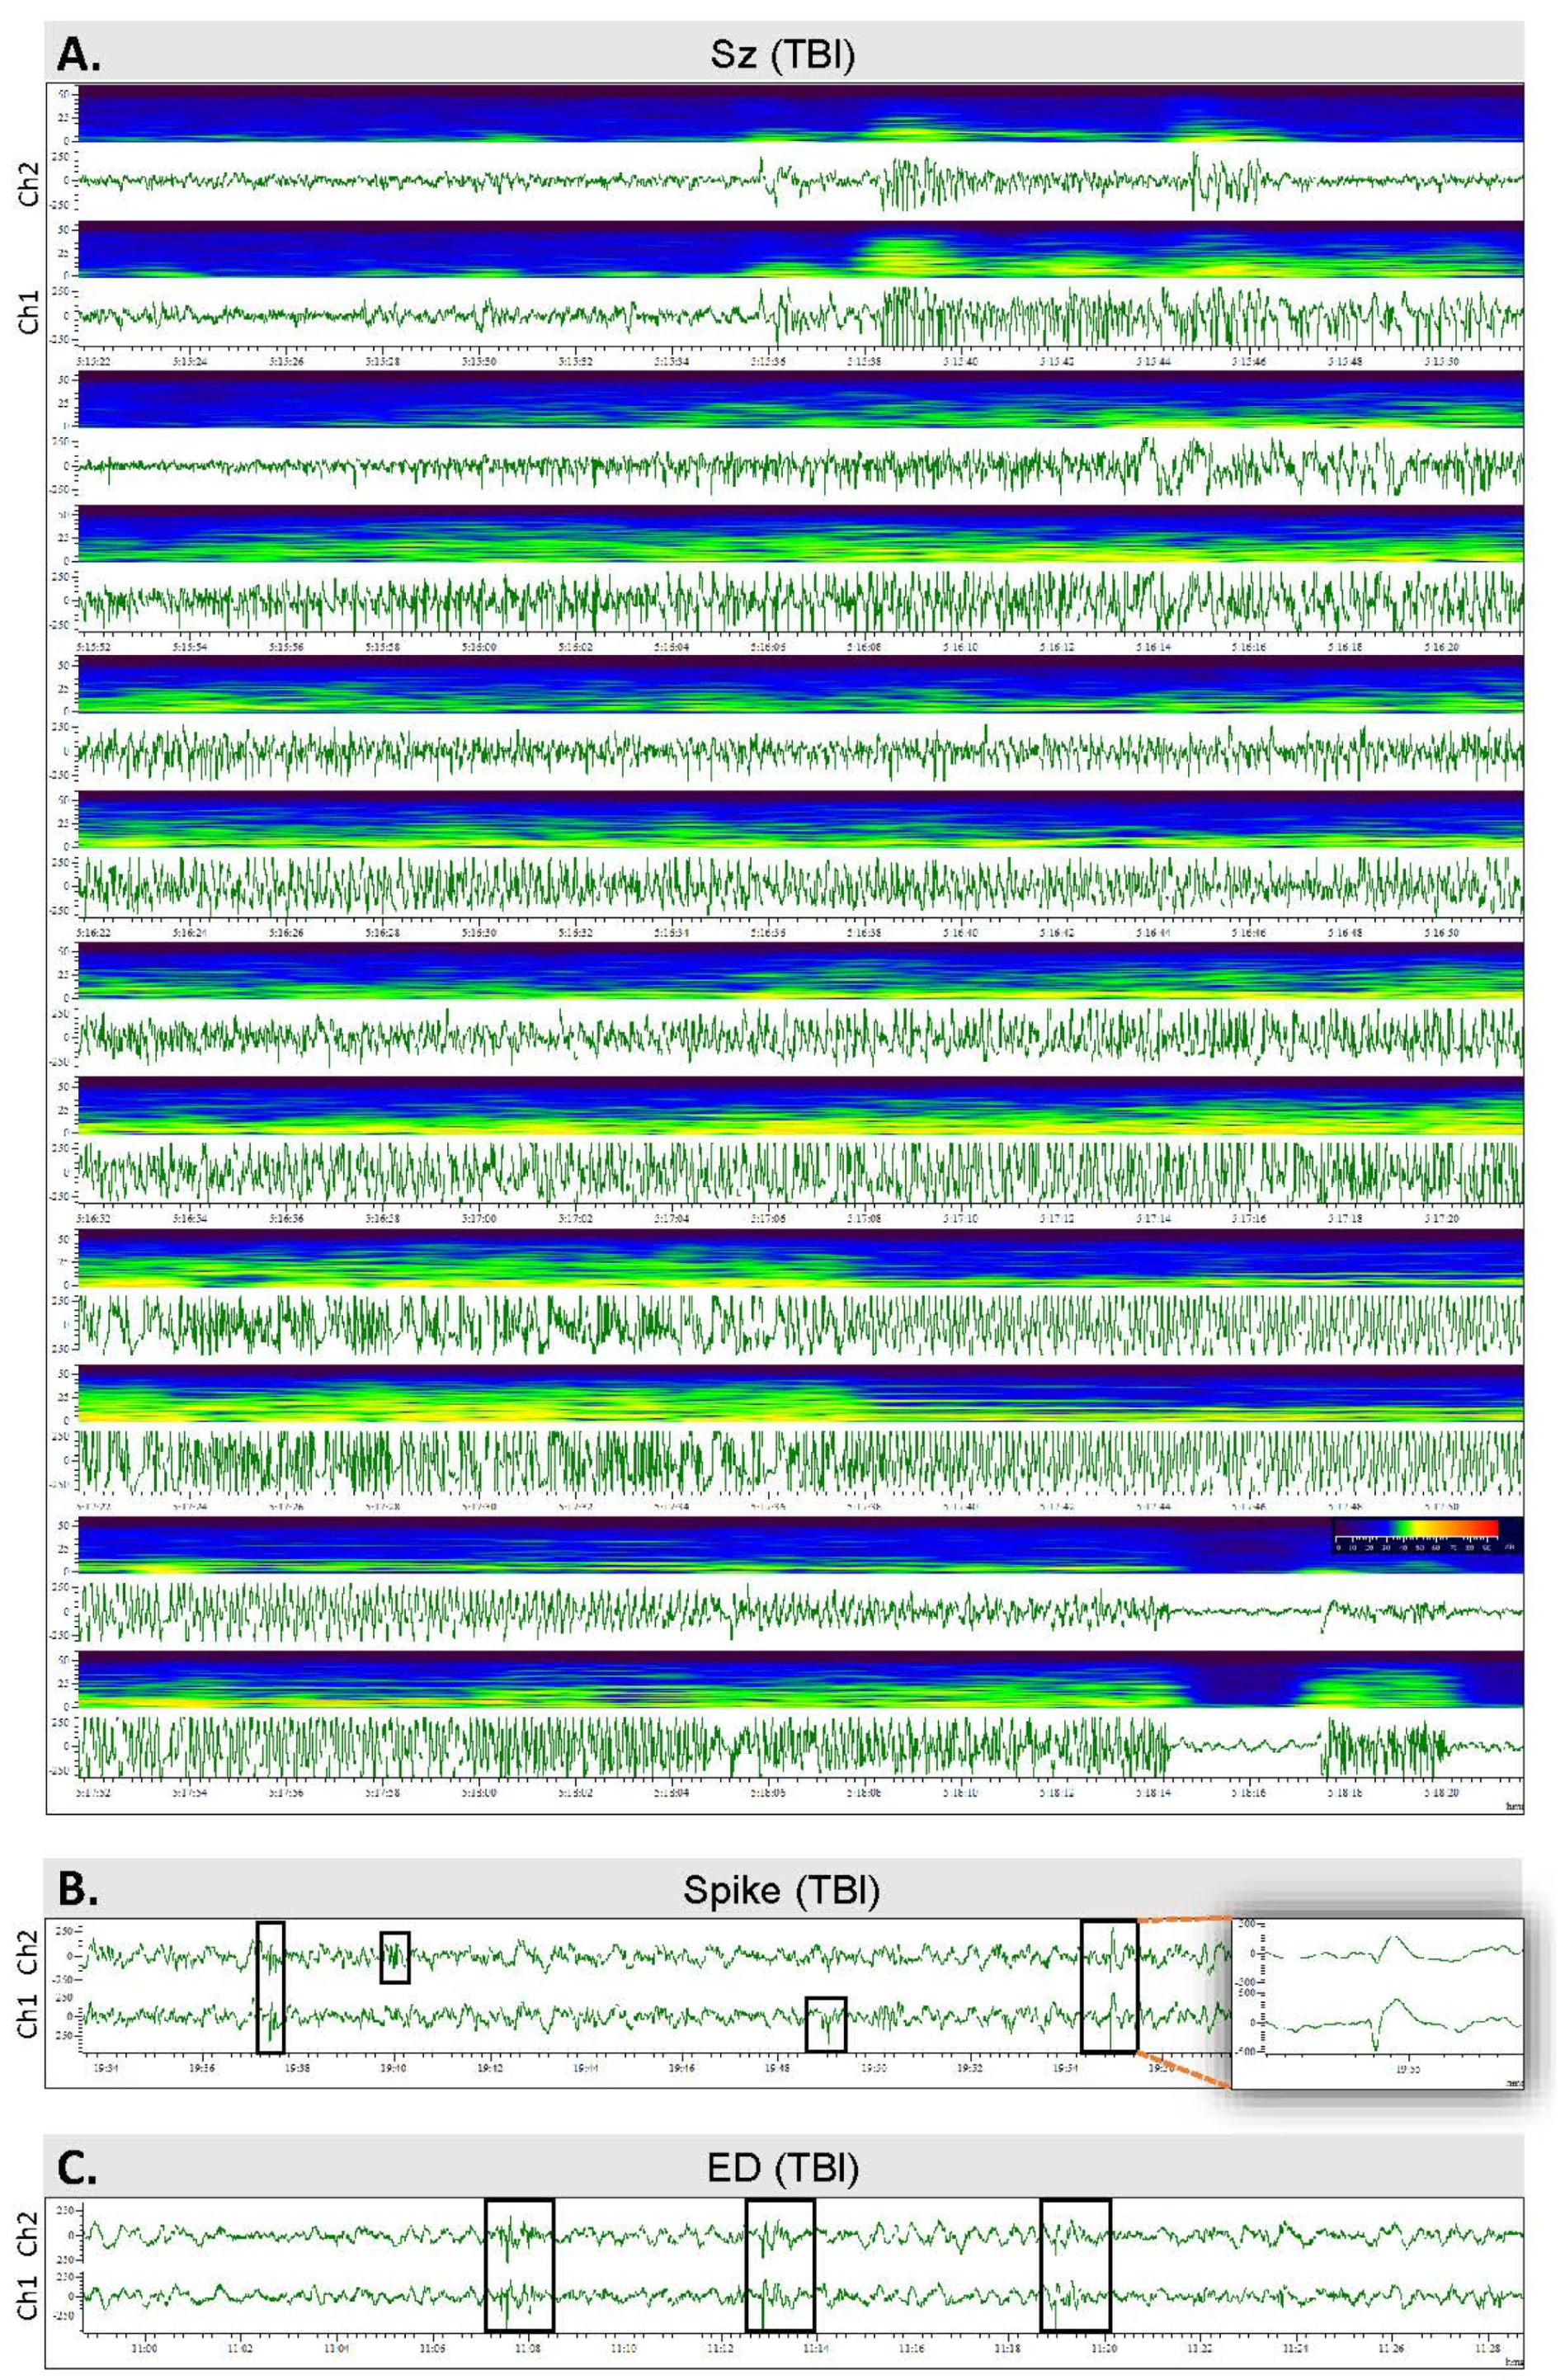
2.7. Analysis of Unprovoked Seizures and Other Epileptiform Activity
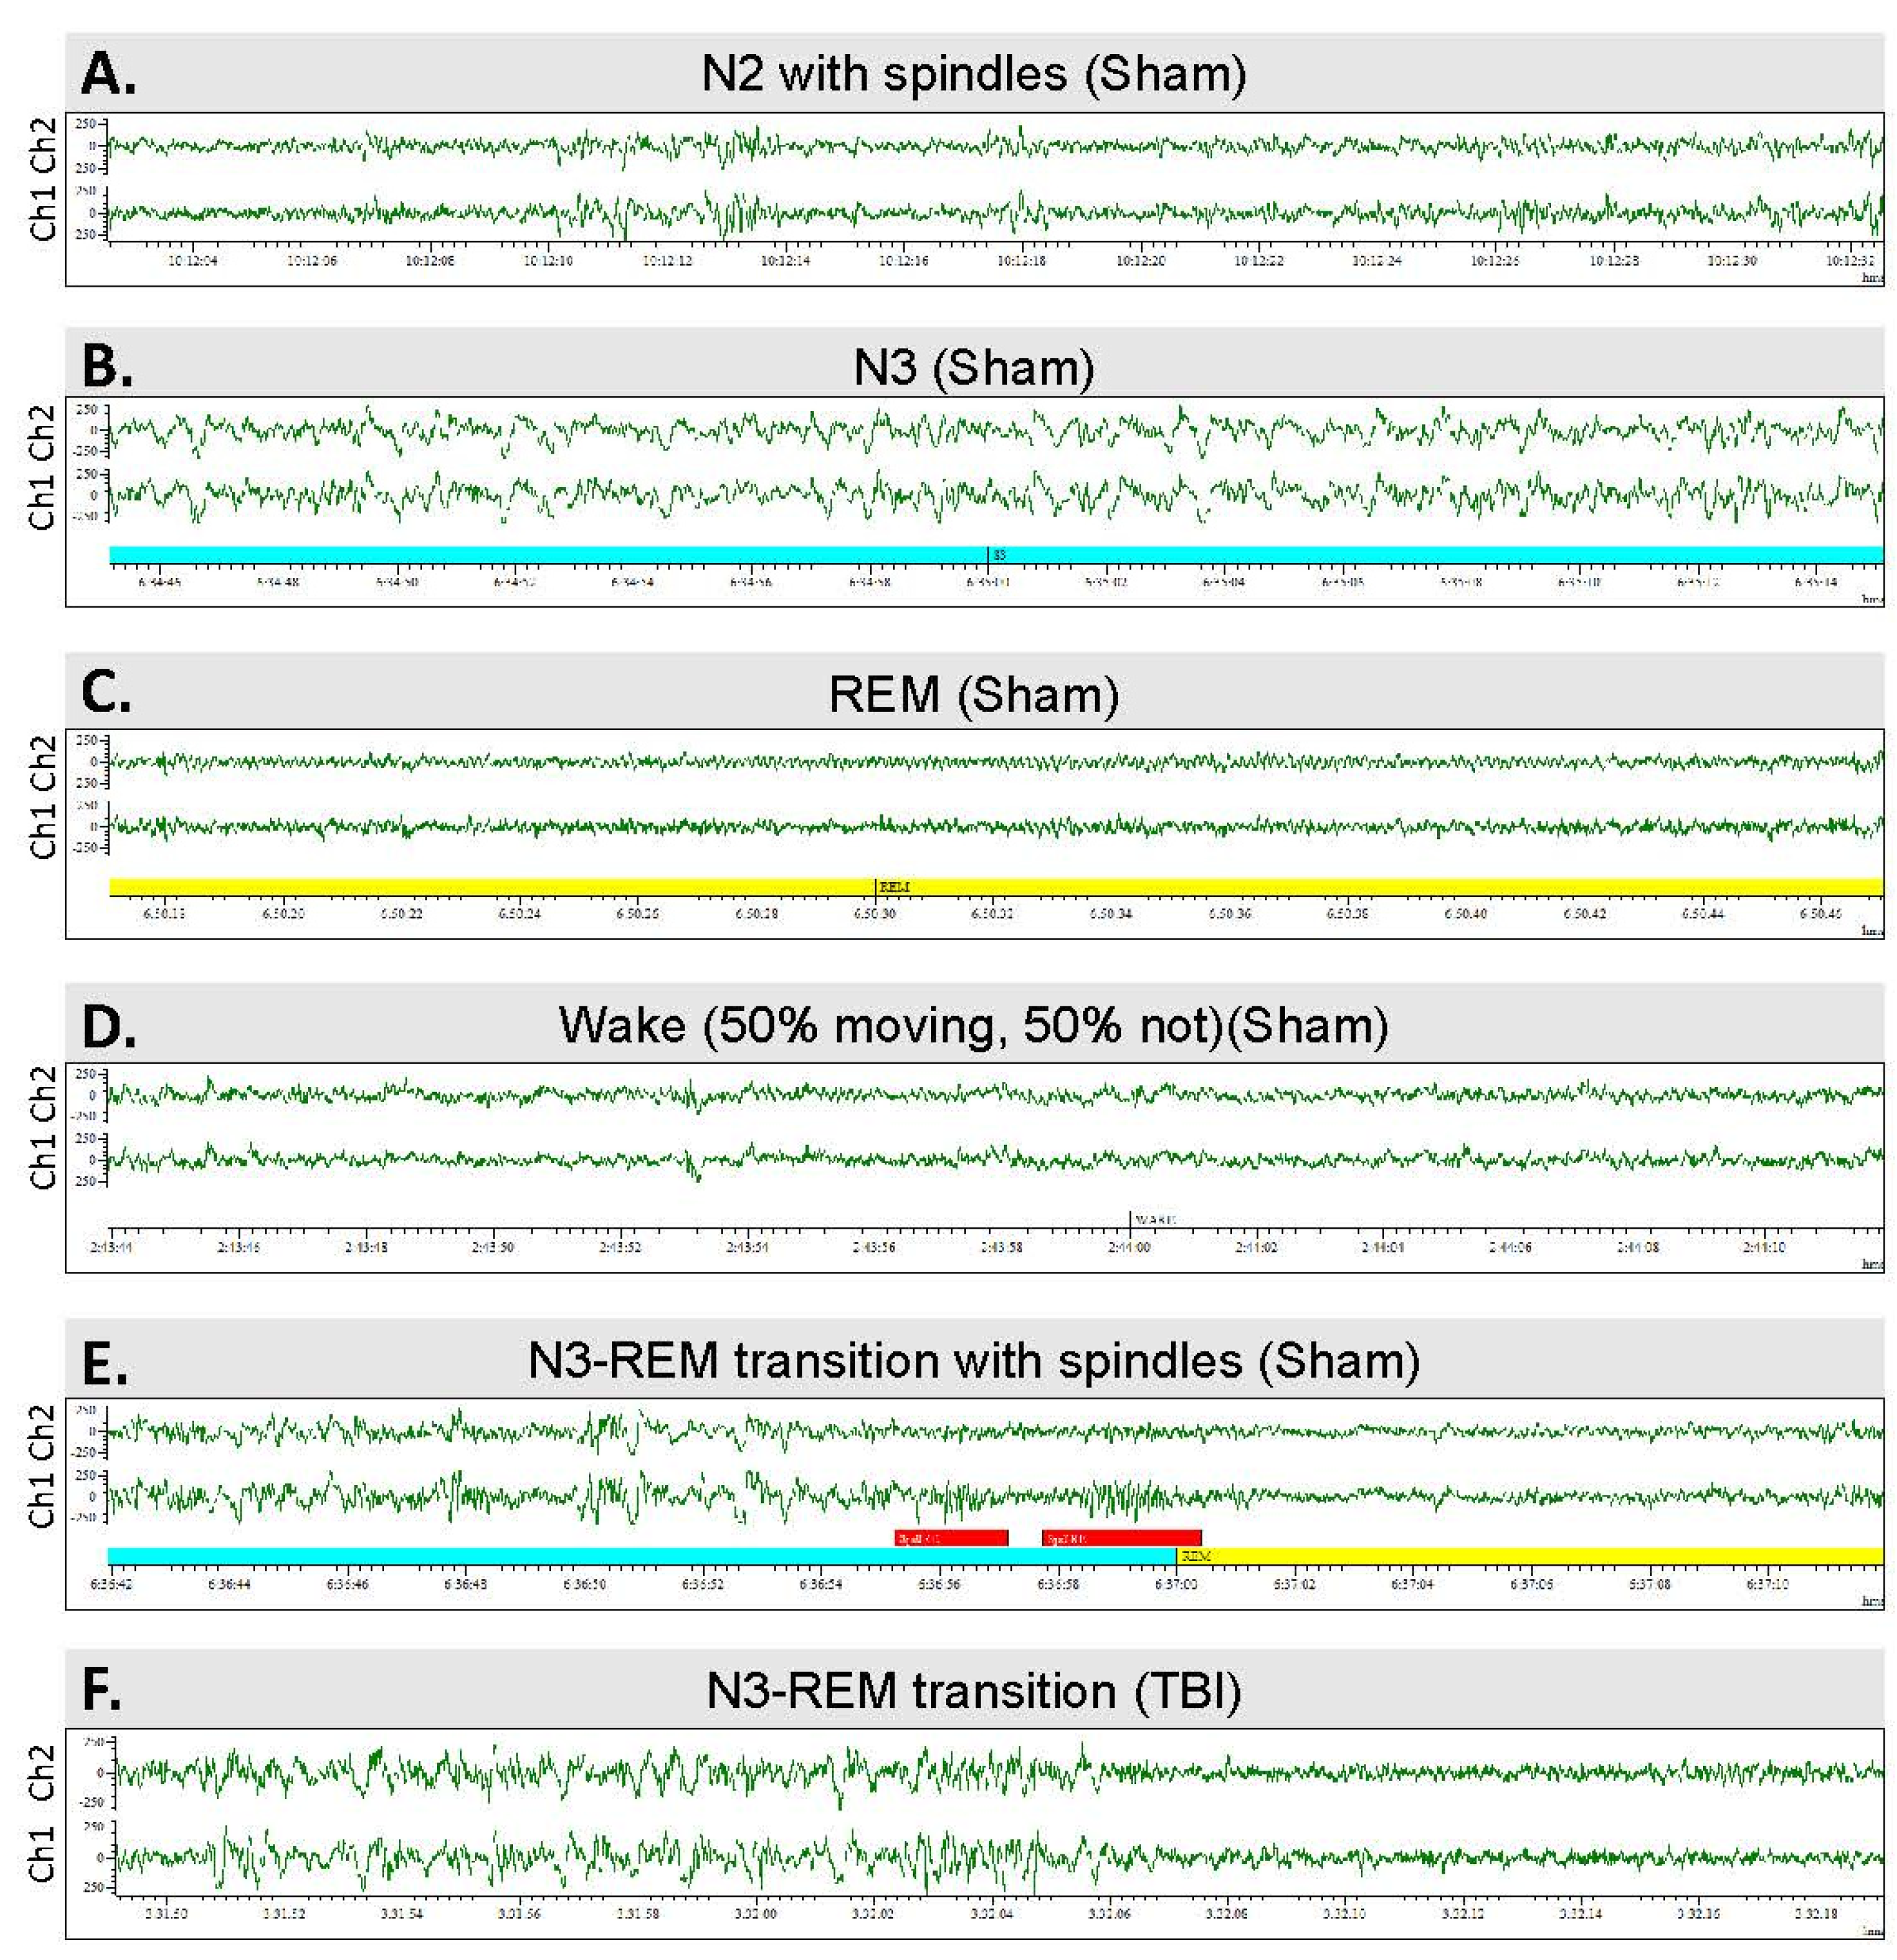
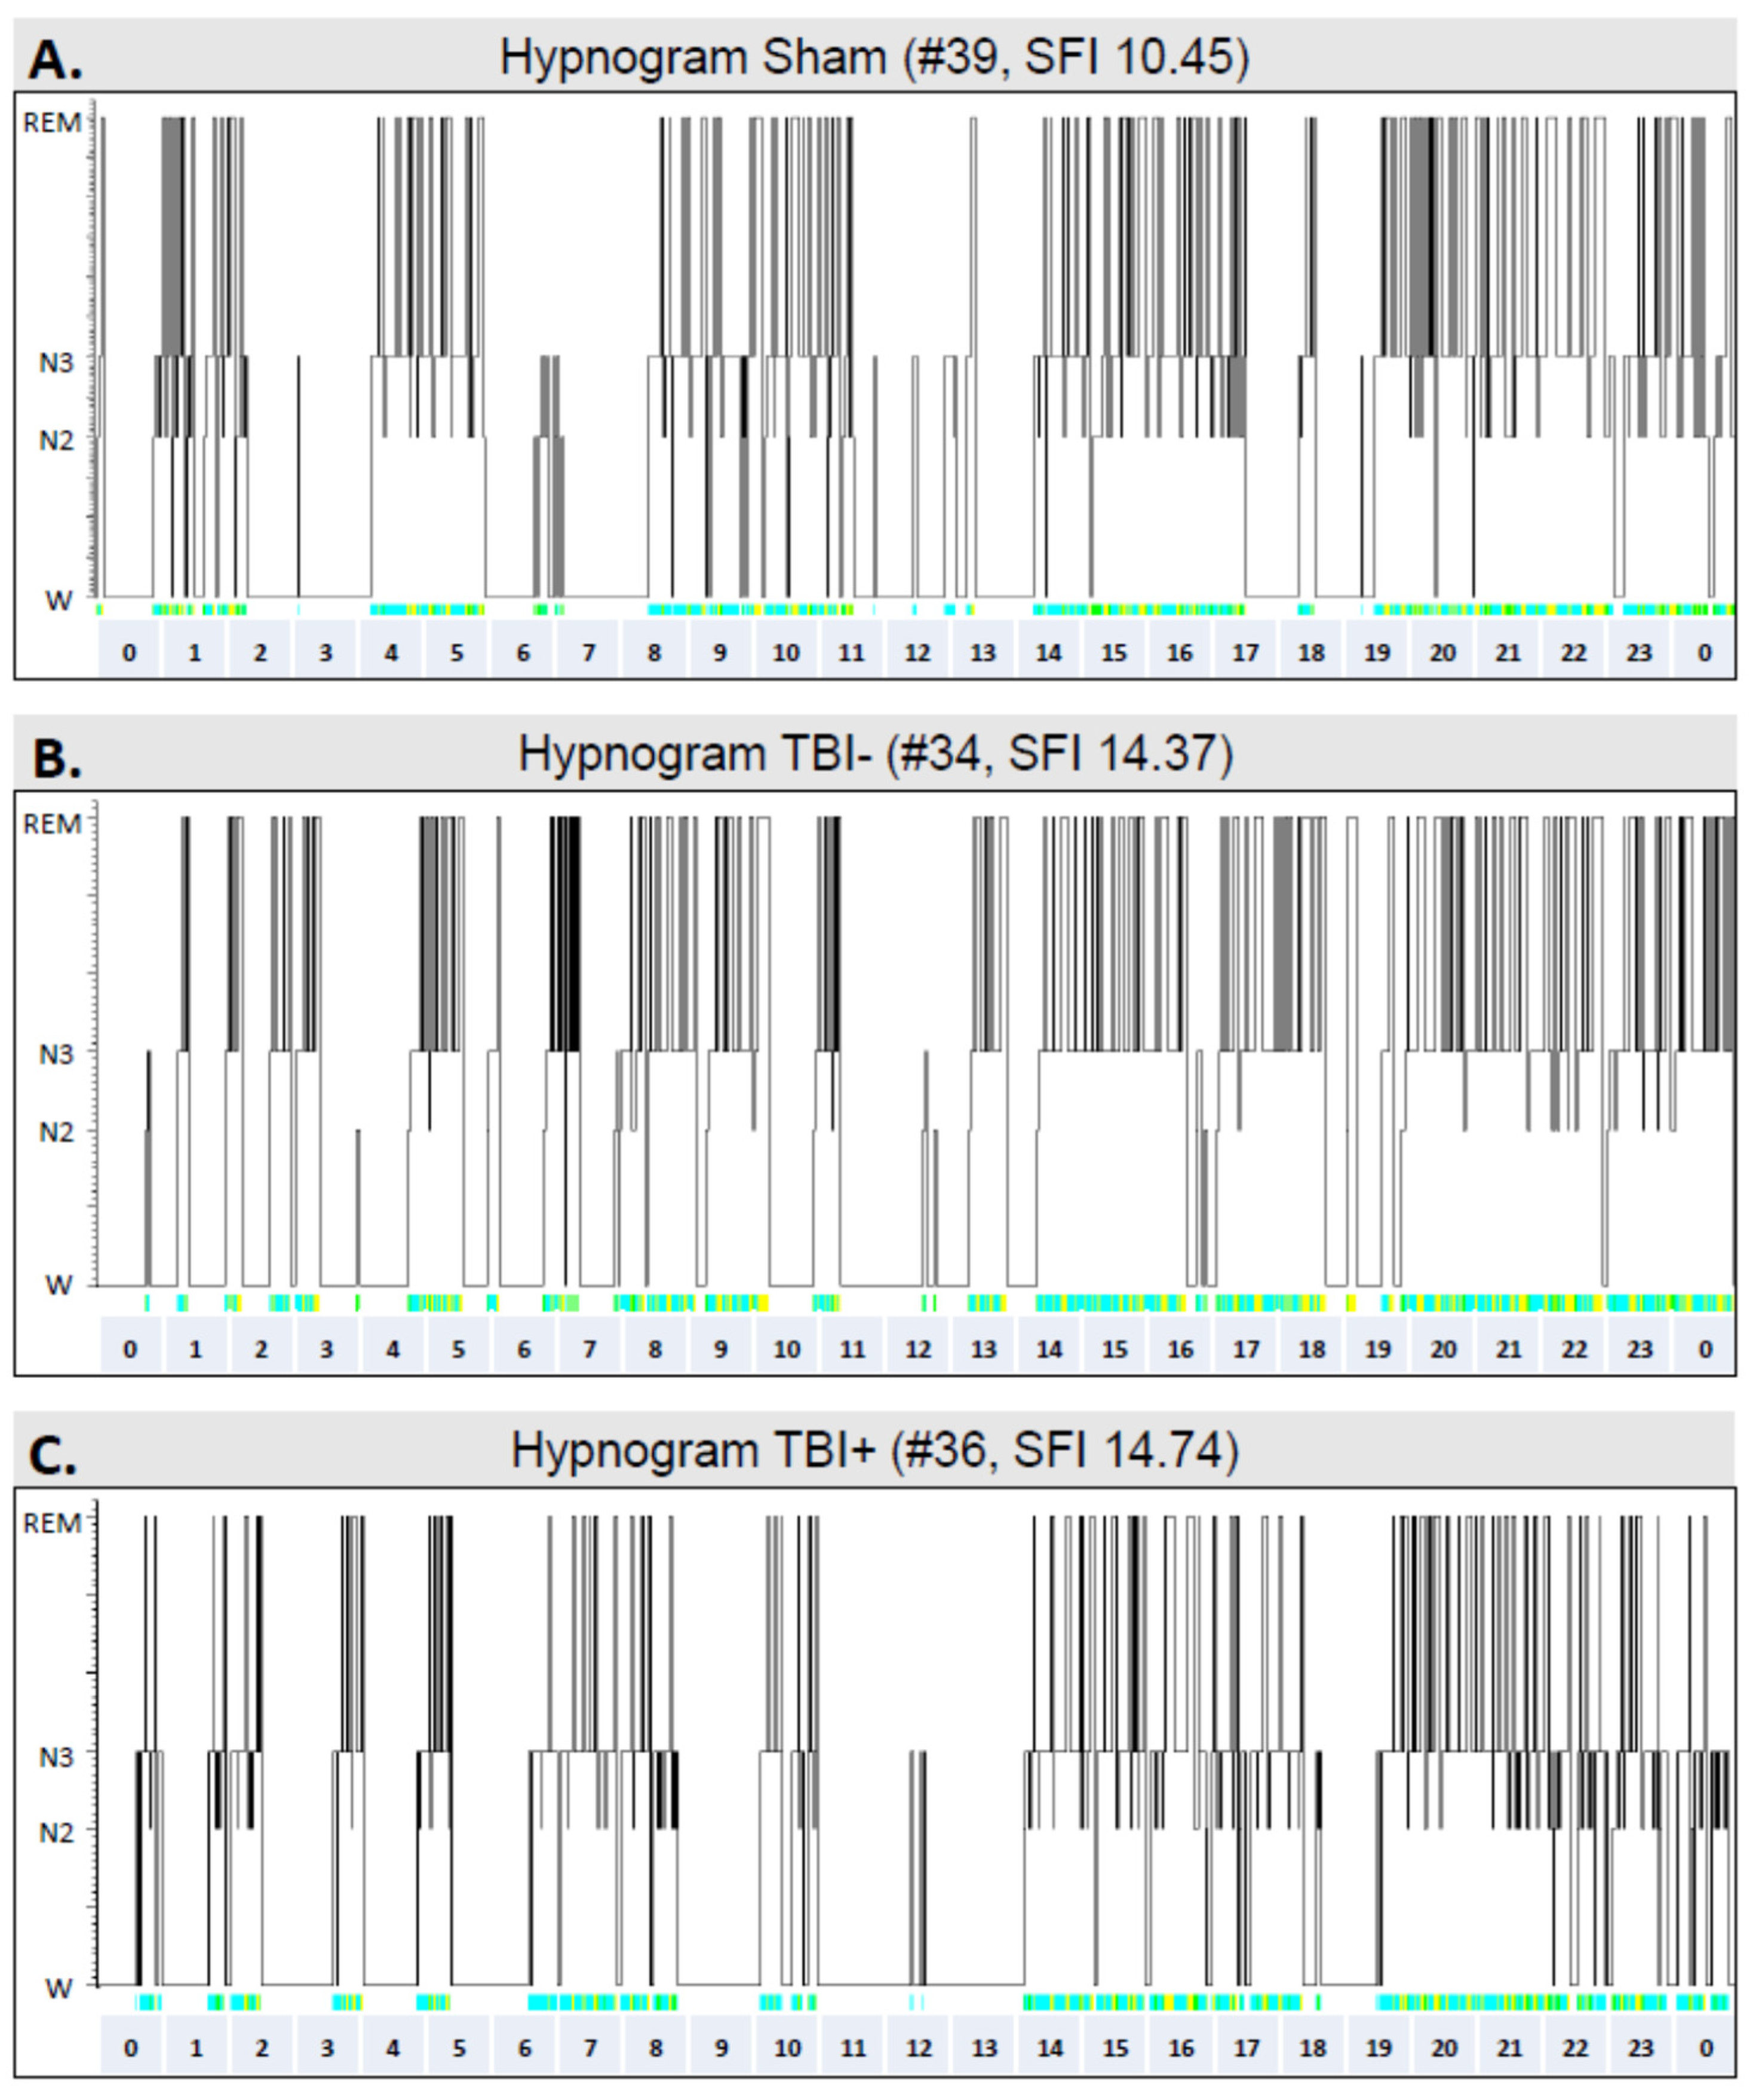
2.8. Scoring of Sleep
2.9. Histology
2.10. Statistics
3. Results
3.1. Mortality and Exclusions
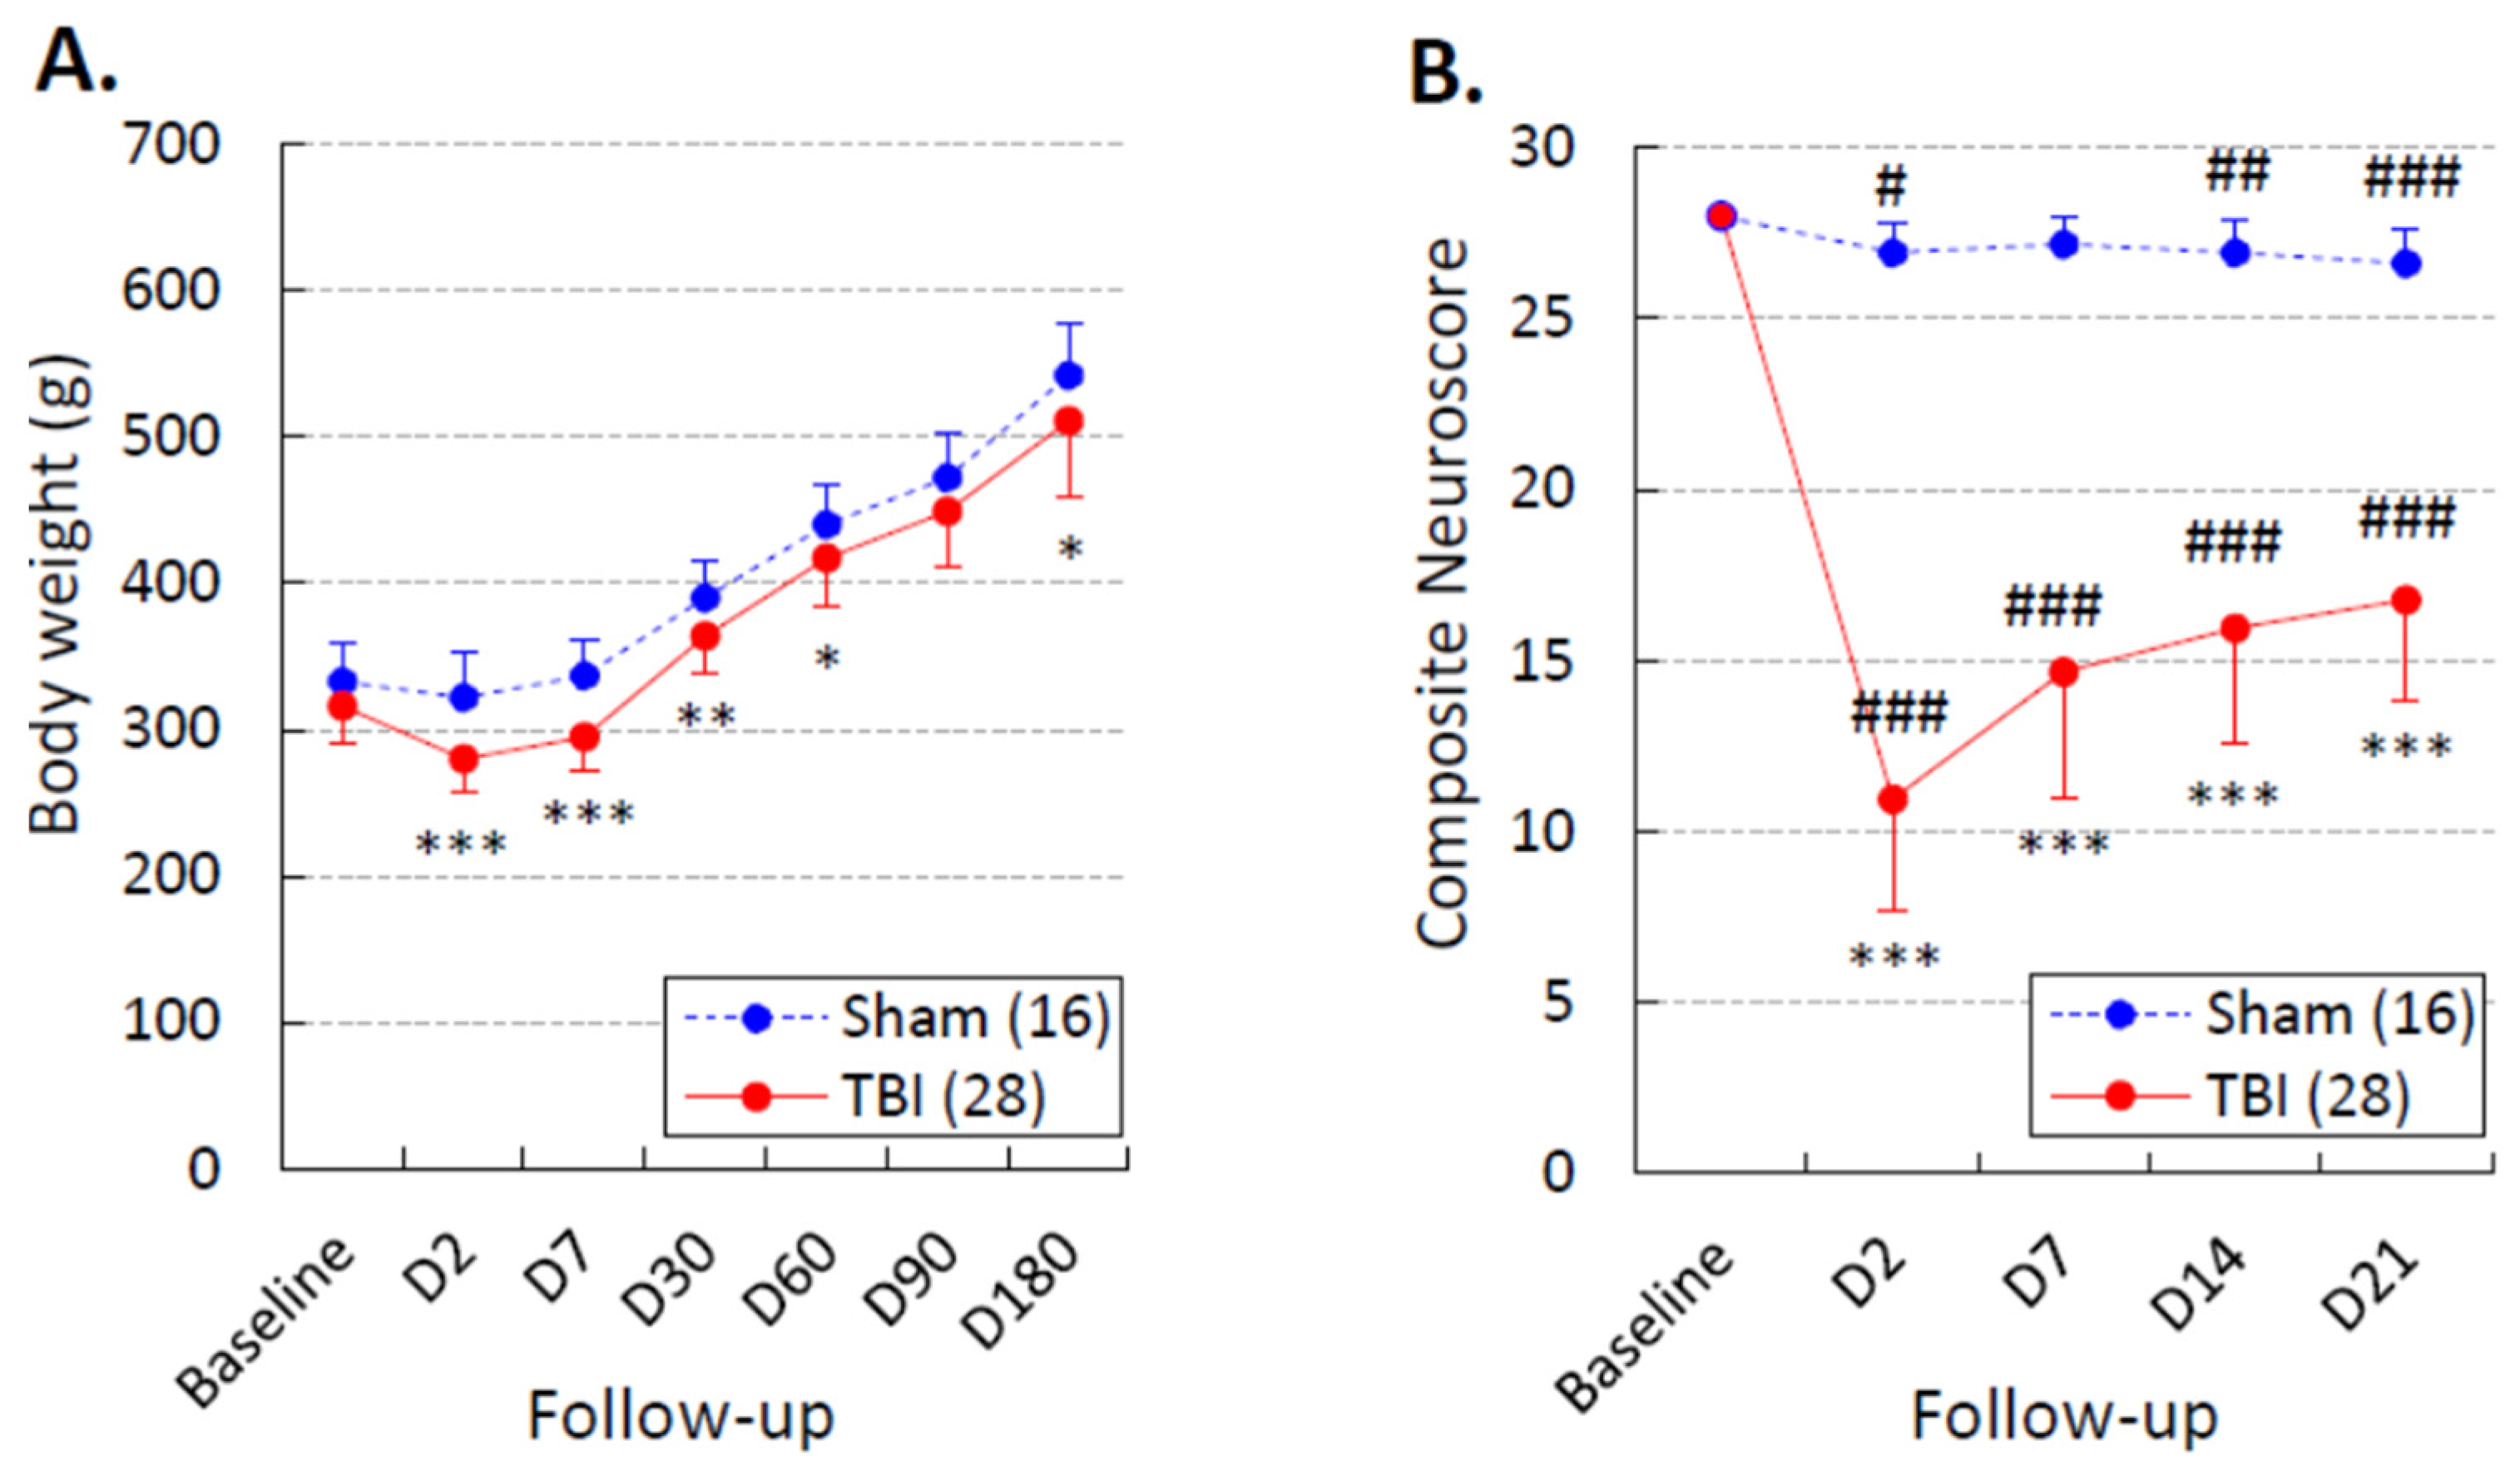
3.2. Body Weight
3.3. Composite Neuroscore
3.4. Spontaneous Epileptiform Activity
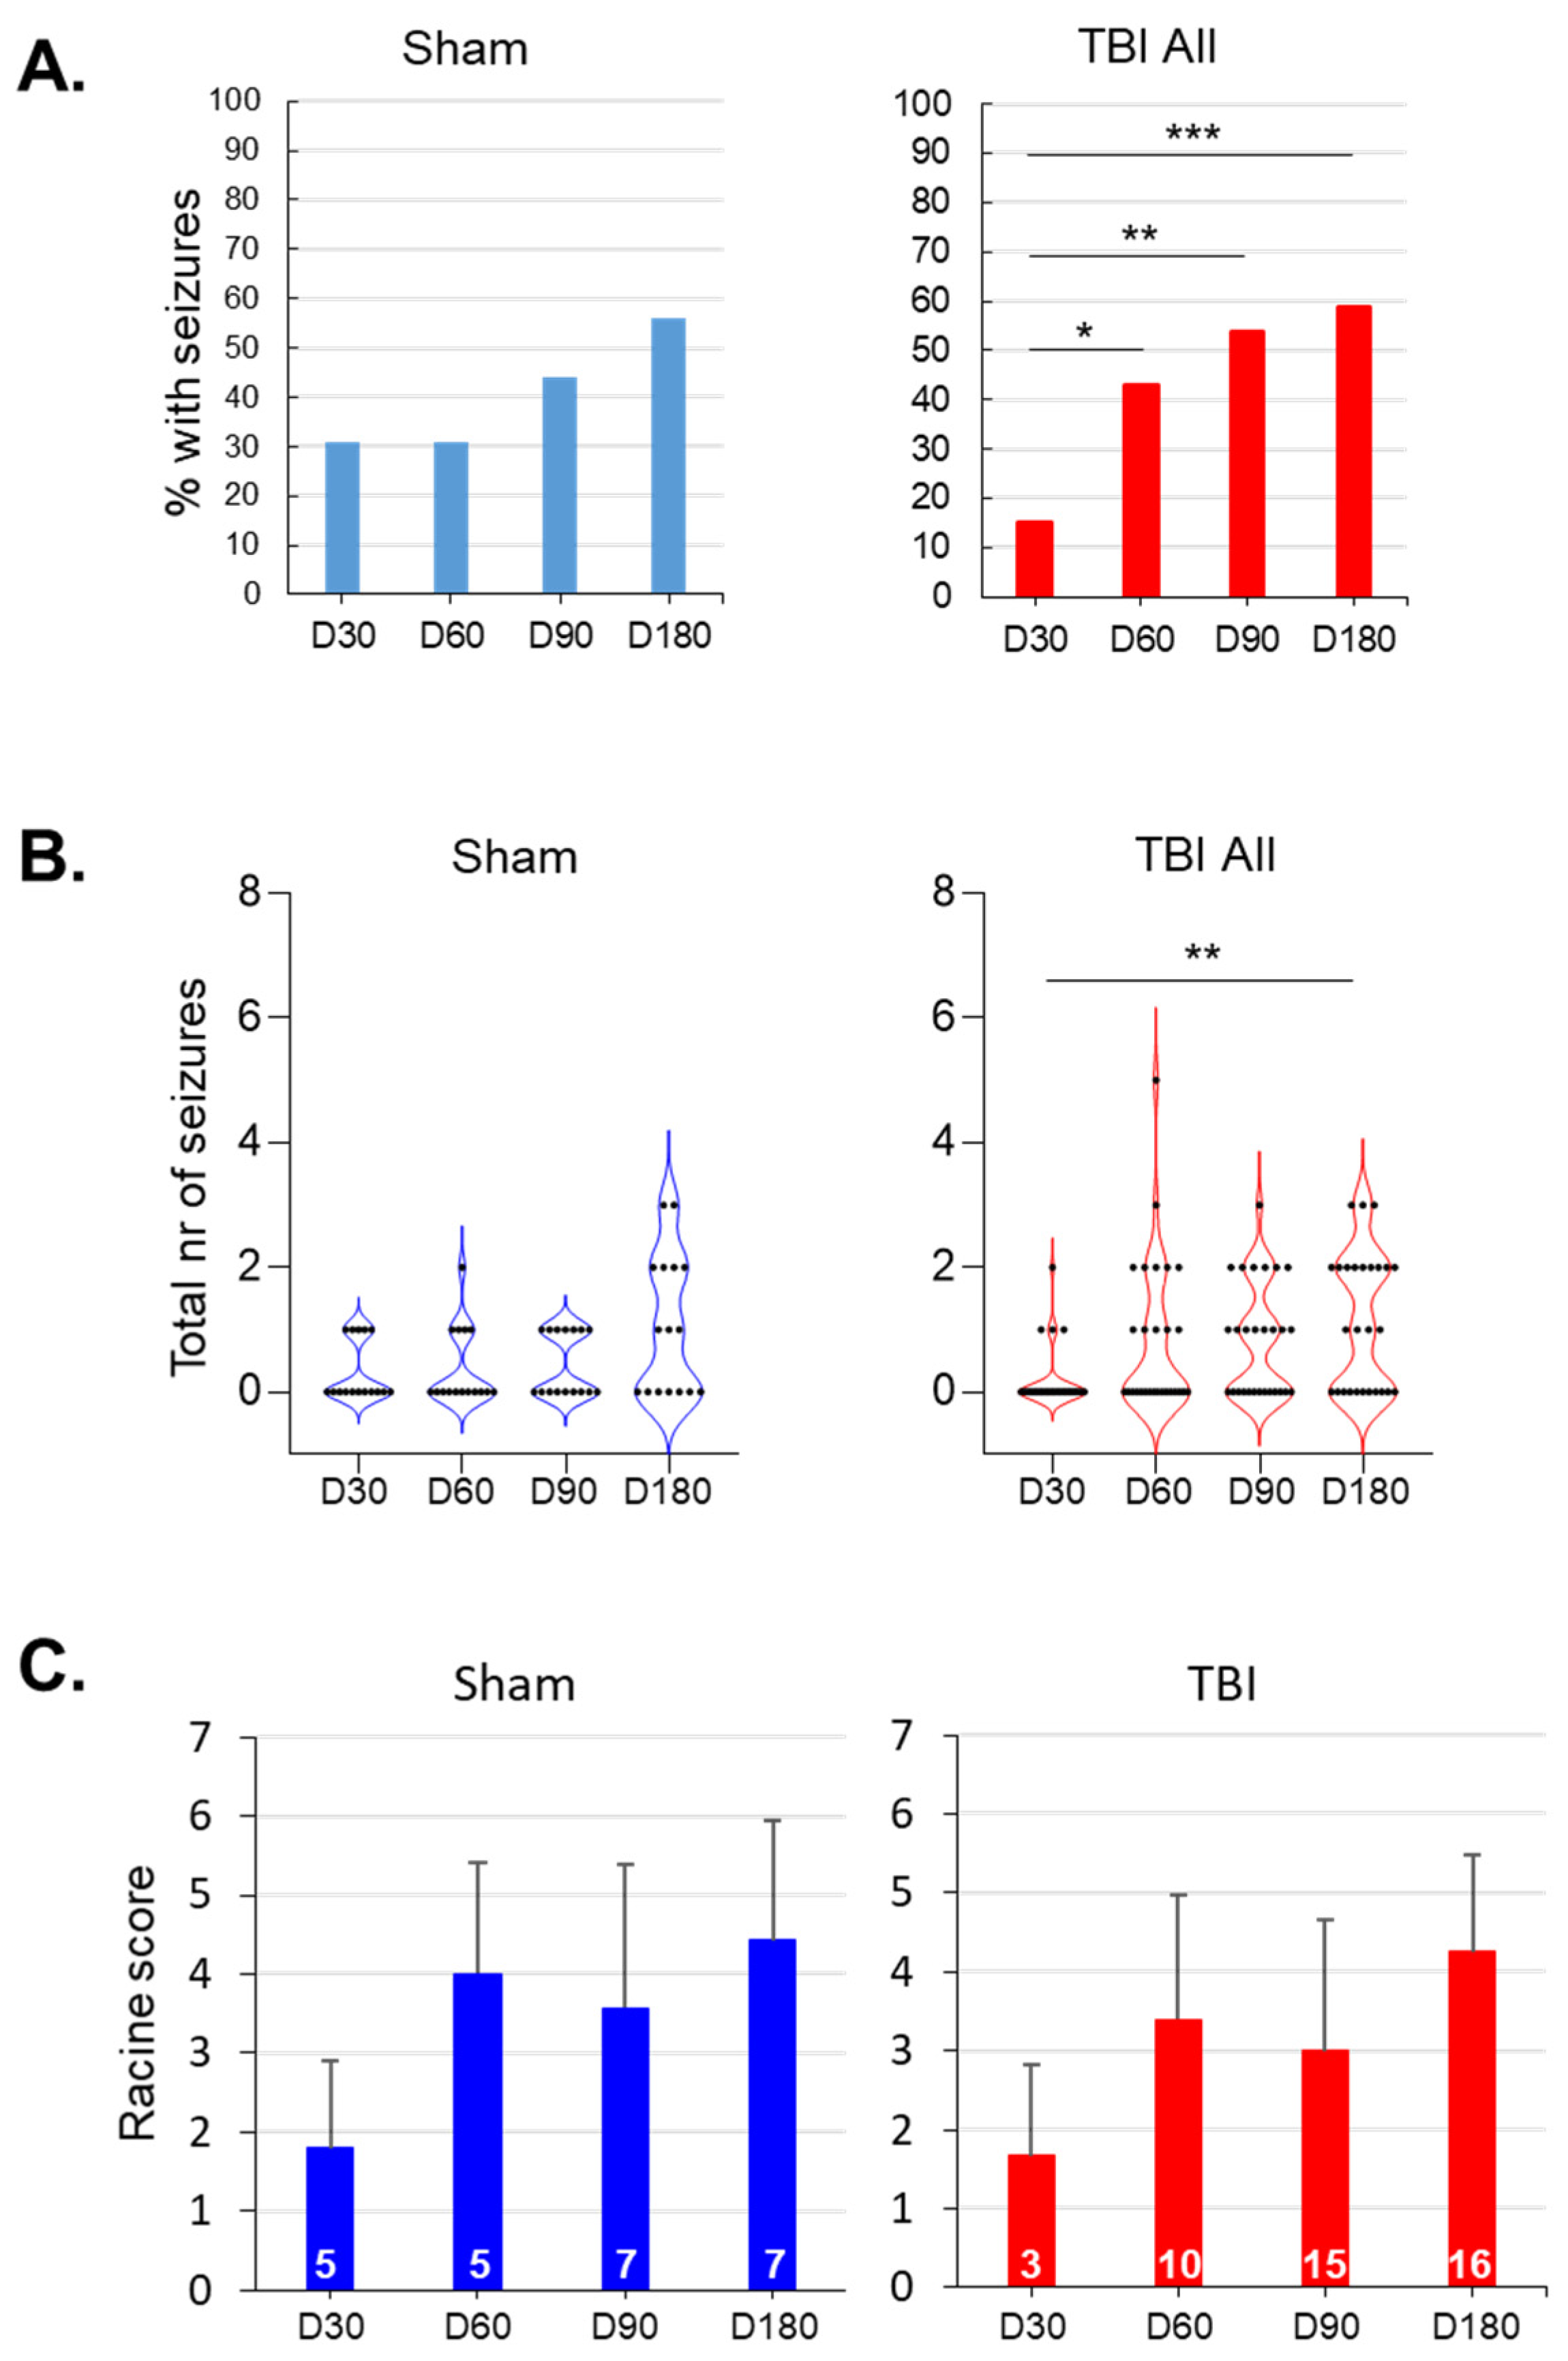
3.5. Evolution of Seizure Susceptibility in the PTZ Test
3.5.1. Sham vs. TBI
3.5.2. TBIe− vs. TBIe+
3.5.3. TBI+ vs. TBI−
3.6. Sleep
3.6.1. Sham vs. TBI
3.6.2. TBIe+ vs. TBIe−
3.6.3. TBI+ vs. TBI−
3.7. Occurrence of SWDs
3.8. Cortical Lesion Area
3.9. PTZ Test Parameters as Biomarkers of TBI and Epileptogenesis
3.9.1. PTZ Test Parameters as Diagnostic Biomarkers of TBI
3.9.2. PTZ Test Parameters as Diagnostic Biomarkers of Epileptogenesis
TBIe+ vs. TBIe−
TBI+ vs. TBI−
3.10. Sleep Disturbance Parameters as Biomarkers of TBI and Epileptogenesis
3.10.1. Sleep Disturbance Parameters as Diagnostic Biomarkers of TBI
3.10.2. Sleep Disturbance Parameters as Diagnostic Biomarkers of Epileptogenesis
TBIe+ vs. TBIe−
TBI+ vs. TBI−
4. Discussion
4.1. Rats with TBI Showed A Mild Progression in Seizure Susceptibility over the 6-Month Follow-Up
4.2. TBI Causes Chronic Sleep Disturbances
4.3. PTZ Test and Sleep Disturbance Parameters as Biomarkers of TBI and Epileptogenesis
4.4. Methodological Considerations
5. Conclusions
Supplementary Materials
Author Contributions
Funding
Institutional Review Board Statement
Informed Consent Statement
Data Availability Statement
Acknowledgments
Conflicts of Interest
References
- Dewan, M.C.; Rattani, A.; Gupta, S.; Baticulon, R.E.; Hung, Y.C.; Punchak, M.; Agrawal, A.; Adeleye, A.O.; Shrime, M.G.; Rubiano, A.M.; et al. Estimating the Global Incidence of Traumatic Brain Injury. J. Neurosurg. 2019, 130, 1080–1097. [Google Scholar] [CrossRef] [Green Version]
- Hauser, W.A.; Annegers, J.F.; Kurland, L.T. Incidence of Epilepsy and Unprovoked Seizures in Rochester, Minnesota: 1935–1984. Epilepsia 1993, 34, 453–468. [Google Scholar] [CrossRef]
- Herman, S.T. Epilepsy after Brain Insult: Targeting Epileptogenesis. Neurology 2002, 59, S21–S26. [Google Scholar] [CrossRef]
- Annegers, J.F.; Hauser, W.A.; Coan, S.P.; Rocca, W.A. A Population-Based Study of Seizures after Traumatic Brain Injuries. N. Engl. J. Med. 1998, 338, 20–24. [Google Scholar] [CrossRef]
- Dulla, C.G.; Pitkänen, A. Novel Approaches to Prevent Epileptogenesis after Traumatic Brain Injury. Neurotherapeutics 2021, 18, 1582–1601. [Google Scholar] [CrossRef]
- Engel, J.; Pitkänen, A. Biomarkers for Epileptogenesis and Its Treatment. Neuropharmacology 2020, 167, 107735. [Google Scholar] [CrossRef]
- Pitkänen, A.; Henshall, D.C.; Cross, J.H.; Guerrini, R.; Jozwiak, S.; Kokaia, M.; Simonato, M.; Sisodiya, S.; Mifsud, J. Advancing Research toward Faster Diagnosis, Better Treatment, and End of Stigma in Epilepsy. Epilepsia 2019, 60, 1281–1292. [Google Scholar] [CrossRef]
- Pitkänen, A.; Engel, J., Jr. Past and Present Definitions of Epileptogenesis and Its Biomarkers. Neurotherapeutics 2014, 11, 231–241. [Google Scholar] [CrossRef] [Green Version]
- Englander, J.; Bushnik, T.; Duong, T.T.; Cifu, D.X.; Zafonte, R.; Wright, J.; Hughes, R.; Bergman, W. Analyzing Risk Factors for Late Posttraumatic Seizures: A Prospective, Multicenter Investigation. Arch. Phys. Med. Rehabil. 2003, 84, 365–373. [Google Scholar] [CrossRef]
- Burke, J.; Gugger, J.; Ding, K.; Kim, J.A.; Foreman, B.; Yue, J.K.; Puccio, A.M.; Yuh, E.L.; Sun, X.; Rabinowitz, M.; et al. Association of Posttraumatic Epilepsy with 1-Year Outcomes after Traumatic Brain Injury. JAMA Netw. Open 2021, 4, e2140191. [Google Scholar] [CrossRef]
- Wang, Y.; Andrade, P.; Pitkänen, A. Peripheral Infection after Traumatic Brain Injury Augments Excitability in the Perilesional Cortex and Dentate Gyrus. Biomedicines 2021, 9, 1946. [Google Scholar] [CrossRef]
- Simonato, M.; Agoston, D.V.; Brooks-Kayal, A.; Dulla, C.; Fureman, B.; Henshall, D.C.; Pitkänen, A.; Theodore, W.H.; Twyman, R.E.; Kobeissy, F.H.; et al. Identification of Clinically Relevant Biomarkers of Epileptogenesis—A Strategic Roadmap. Nat. Rev. Neurol. 2021, 17, 231–242. [Google Scholar] [CrossRef]
- Löscher, W. Critical Review of Current Animal Models of Seizures and Epilepsy Used in the Discovery and Development of New Antiepileptic Drugs. Seizure 2011, 20, 359–368. [Google Scholar] [CrossRef] [Green Version]
- Cantello, R.; Civardi, C.; Varrasi, C.; Vicentini, R.; Cecchin, M.; Boccagni, C.; Monaco, F. Excitability of the Human Epileptic Cortex after Chronic Valproate: A Reappraisal. Brain Res. 2006, 1099, 160–166. [Google Scholar] [CrossRef]
- Milosevic, M.; Nakanishi, T.; Sasaki, A.; Yamaguchi, A.; Nomura, T.; Popovic, M.R.; Nakazawa, K. Cortical Re-Organization After Traumatic Brain Injury Elicited Using Functional Electrical Stimulation Therapy: A Case Report. Front. Neurosci. 2021, 15, 693861. [Google Scholar] [CrossRef]
- Alachkar, A.; Ojha, S.K.; Sadeq, A.; Adem, A.; Frank, A.; Stark, H.; Sadek, B. Experimental Models for the Discovery of Novel Anticonvulsant Drugs: Focus on Pentylenetetrazole-Induced Seizures and Associated Memory Deficits. Curr. Pharm. Des. 2020, 26, 1693–1711. [Google Scholar] [CrossRef]
- Barba, C.; Di Giuda, D.; Policicchio, D.; Bruno, I.; Papacci, F.; Colicchio, G. Correlation between Provoked Ictal SPECT and Depth Recordings in Adult Drug-Resistant Epilepsy Patients. Epilepsia 2007, 48, 278–285. [Google Scholar] [CrossRef]
- Esplin, D.W.; Woodbury, D.M. The Fate and Excretion of C14-Labeled Pentylenetetrazol in the Rat, with Comments on Analytical Methods for Pentylenetetrazol. J. Pharmacol. Exp. Ther. 1956, 118, 129–138. [Google Scholar]
- Ramzan, I.M.; Levy, G. Kinetics of Drug Action in Disease States. XIV. Effect of Infusion Rate on Pentylenetetrazol Concentrations in Serum, Brain and Cerebrospinal Fluid of Rats at Onset of Convulsions. J. Pharmacol. Exp. Ther. 1985, 234, 624–628. [Google Scholar]
- Vohland, H.W.; Zufelde, H. Factors Responsible for Reduced Pharmacological Activity in Rats of Pentetrazol Administered Orally. Naunyn. Schmiedebergs. Arch. Pharmacol. 1976, 293, 277–283. [Google Scholar] [CrossRef]
- Saraiva, A.L.L.; Ferreira, A.P.O.; Silva, L.F.A.; Hoffmann, M.S.; Dutra, F.D.; Furian, A.F.; Oliveira, M.S.; Fighera, M.R.; Royes, L.F.F. Creatine Reduces Oxidative Stress Markers but Does Not Protect against Seizure Susceptibility after Severe Traumatic Brain Injury. Brain Res. Bull. 2012, 87, 180–186. [Google Scholar] [CrossRef]
- Andrade, P.; Banuelos-Cabrera, I.; Lapinlampi, N.; Paananen, T.; Ciszek, R.; Ndode-Ekane, X.E.; Pitkänen, A. Acute Non-Convulsive Status Epilepticus after Experimental Traumatic Brain Injury in Rats. J. Neurotrauma 2019, 36, 1890–1907. [Google Scholar] [CrossRef]
- Kharatishvili, I.; Nissinen, J.P.; McIntosh, T.K.; Pitkänen, A. A Model of Posttraumatic Epilepsy Induced by Lateral Fluid-Percussion Brain Injury in Rats. Neuroscience 2006, 140, 685–697. [Google Scholar] [CrossRef]
- Nissinen, J.; Halonen, T.; Koivisto, E.; Pitkänen, A. A New Model of Chronic Temporal Lobe Epilepsy Induced by Electrical Stimulation of the Amygdala in Rat. Epilepsy Res. 2000, 38, 177–205. [Google Scholar] [CrossRef]
- McIntosh, T.K.; Vink, R.; Noble, L.; Yamakami, I.; Fernyak, S.; Soares, H.; Faden, A.L. Traumatic Brain Injury in the Rat: Characterization of a Lateral Fluid-Percussion Model. Neuroscience 1989, 28, 233–244. [Google Scholar] [CrossRef]
- Racine, R.J. Modification of Seizure Activity by Electrical Stimulation: II. Motor Seizure. Electroencephalogr. Clin. Neurophysiol. 1972, 32, 281–294. [Google Scholar] [CrossRef]
- Fisher, R.S.; Acevedo, C.; Arzimanoglou, A.; Bogacz, A.; Cross, J.H.; Elger, C.E.; Engel, J.J.; Forsgren, L.; French, J.A.; Glynn, M.; et al. ILAE Official Report: A Practical Clinical Definition of Epilepsy. Epilepsia 2014, 55, 475–482. [Google Scholar] [CrossRef] [Green Version]
- Iber, C. The AASM Manual for the Scoring of Sleep and Associated Events: Rules, Terminology, and Technical Specifications; American Academy of Sleep Medicine: Westchester, IL, USA, 2007. [Google Scholar]
- Habarubio, J.; Ibanez, V.; Sforza, E. An Alternative Measure of Sleep Fragmentation in Clinical Practice: The Sleep Fragmentation Index. Sleep Med. 2004, 5, 577–581. [Google Scholar] [CrossRef]
- Ekolle Ndode-Ekane, X.; Kharatishvili, I.; Pitkänen, A. Unfolded Maps for Quantitative Analysis of Cortical Lesion Location and Extent after Traumatic Brain Injury. J. Neurotrauma 2017, 34, 459–474. [Google Scholar] [CrossRef]
- Ciszek, R.; Andrade, P.; Tapiala, J.; Pitkänen, A.; Ndode-Ekane, X.E. Web Application for Quantification of Traumatic Brain Injury-Induced Cortical Lesions in Adult Mice. Neuroinformatics 2020, 18, 307–317. [Google Scholar] [CrossRef] [Green Version]
- Bradley, A.P. The Use of the Area under the ROC Curve in the Evaluation of Machine Learning Algorithms. Pattern Recognit. 1997, 30, 1145–1159. [Google Scholar] [CrossRef] [Green Version]
- Kadam, S.D.; D’Ambrosio, R.; Duveau, V.; Roucard, C.; Garcia-Cairasco, N.; Ikeda, A.; de Curtis, M.; Galanopoulou, A.S.; Kelly, K.M. Methodological Standards and Interpretation of Video-Electroencephalography in Adult Control Rodents. A TASK1-WG1 Report of the AES/ILAE Translational Task Force of the ILAE. Epilepsia 2017, 58, 10–27. [Google Scholar] [CrossRef] [Green Version]
- Hayward, N.M.E.A.; Ndode-Ekane, X.E.; Kutchiashvili, N.; Gröhn, O.; Pitkänen, A. Elevated Cerebral Blood Flow and Vascular Density in the Amygdala after Status Epilepticus in Rats. Neurosci. Lett. 2010, 484, 39–42. [Google Scholar] [CrossRef]
- Huttunen, J.K.; Airaksinen, A.M.; Barba, C.; Colicchio, G.; Niskanen, J.-P.; Shatillo, A.; Sierra Lopez, A.; Ndode-Ekane, X.E.; Pitkänen, A.; Gröhn, O.H. Detection of Hyperexcitability by Functional Magnetic Resonance Imaging after Experimental Traumatic Brain Injury. J. Neurotrauma 2018, 35, 2708–2717. [Google Scholar] [CrossRef]
- Huusko, N.; Römer, C.; Ndode-Ekane, X.E.; Lukasiuk, K.; Pitkänen, A. Loss of Hippocampal Interneurons and Epileptogenesis: A Comparison of Two Animal Models of Acquired Epilepsy. Brain Struct. Funct. 2015, 220, 153–191. [Google Scholar] [CrossRef]
- Kharatishvili, I.; Immonen, R.; Gröhn, O.; Pitkänen, A. Quantitative Diffusion MRI of Hippocampus as a Surrogate Marker for Post-Traumatic Epileptogenesis. Brain 2007, 130, 3155–3168. [Google Scholar] [CrossRef] [Green Version]
- Nissinen, J.; Andrade, P.; Natunen, T.; Hiltunen, M.; Malm, T.; Kanninen, K.; Soares, J.I.; Shatillo, O.; Sallinen, J.; Ndode-Ekane, X.E.; et al. Disease-Modifying Effect of Atipamezole in a Model of Post-Traumatic Epilepsy. Epilepsy Res. 2017, 136, 18–34. [Google Scholar] [CrossRef] [Green Version]
- Van Vliet, E.A.; Ndode-Ekane, X.E.; Lehto, L.J.; Gorter, J.A.; Andrade, P.; Aronica, E.; Gröhn, O.; Pitkänen, A. Long-Lasting Blood-Brain Barrier Dysfunction and Neuroinflammation after Traumatic Brain Injury. Neurobiol. Dis. 2020, 145, 105080. [Google Scholar] [CrossRef]
- Yasmin, A.; Pitkänen, A.; Andrade, P.; Paananen, T.; Gröhn, O.; Immonen, R. Post-Injury Ventricular Enlargement Associates with Iron in Choroid Plexus but Not with Seizure Susceptibility nor Lesion Atrophy—6-Month MRI Follow-up after Experimental Traumatic Brain Injury. Brain Struct. Funct. 2022, 227, 145–158. [Google Scholar] [CrossRef]
- Bao, Y.H.; Bramlett, H.M.; Atkins, C.M.; Truettner, J.S.; Lotocki, G.; Alonso, O.F.; Dietrich, W.D. Post-Traumatic Seizures Exacerbate Histopathological Damage after Fluid-Percussion Brain Injury. J. Neurotrauma 2011, 28, 35–42. [Google Scholar] [CrossRef] [Green Version]
- Gerbatin, R.R.; Silva, L.F.A.; Hoffmann, M.S.; Della-Pace, I.D.; do Nascimento, P.S.; Kegler, A.; de Zorzi, V.N.; Cunha, J.M.; Botelho, P.; Neto, J.B.T.; et al. Delayed Creatine Supplementation Counteracts Reduction of GABAergic Function and Protects against Seizures Susceptibility after Traumatic Brain Injury in Rats. Prog. Neuro-Psychopharmacol. Biol. Psychiatry 2019, 92, 328–338. [Google Scholar] [CrossRef]
- Silva, L.F.A.; Hoffmann, M.S.; Rambo, L.M.; Ribeiro, L.R.; Lima, F.D.; Furian, A.F.; Oliveira, M.S.; Fighera, M.R.; Royes, L.F.F. The Involvement of Na +, K +-ATPase Activity and Free Radical Generation in the Susceptibility to Pentylenetetrazol-Induced Seizures after Experimental Traumatic Brain Injury. J. Neurol. Sci. 2011, 308, 35–40. [Google Scholar] [CrossRef]
- Silva, L.F.A.; Hoffmann, M.S.; Gerbatin, R.D.R.; Fiorin, F.D.S.; Dobrachinski, F.; Mota, B.C.; Wouters, A.T.B.; Pavarini, S.P.; Soares, F.A.A.; Fighera, M.R.; et al. Treadmill Exercise Protects against Pentylenetetrazol-Induced Seizures and Oxidative Stress after Traumatic Brain Injury. J. Neurotrauma 2013, 30, 1278–1287. [Google Scholar] [CrossRef] [Green Version]
- Smith, D.; Rau, T.; Poulsen, A.; MacWilliams, Z.; Patterson, D.; Kelly, W.; Poulsen, D. Convulsive Seizures and EEG Spikes after Lateral Fluid-Percussion Injury in the Rat. Epilepsy Res. 2018, 147, 87–94. [Google Scholar] [CrossRef]
- Wang, X.; Wang, Y.; Zhang, C.; Liu, C.; Yang, H.-F.; Hu, W.-H.; Zhang, J.-G.; Zhang, K. Endogenous Cannabinoid System Alterations and Their Role in Epileptogenesis after Brain Injury in Rat. Epilepsy Res. 2016, 128, 35–42. [Google Scholar] [CrossRef]
- Atkins, C.M.; Truettner, J.S.; Lotocki, G.; Sanchez-Molano, J.; Kang, Y.; Alonso, O.F.; Sick, T.J.; Dietrich, W.D.; Bramlett, H.M. Post-Traumatic Seizure Susceptibility Is Attenuated by Hypothermia Therapy. Eur. J. Neurosci. 2010, 32, 1912–1920. [Google Scholar] [CrossRef] [Green Version]
- Bolkvadze, T.; Pitkänen, A. Development of Post-Traumatic Epilepsy after Controlled Cortical Impact and Lateral Fluid-Percussion-Induced Brain Injury in the Mouse. J. Neurotrauma 2012, 29, 789–812. [Google Scholar] [CrossRef]
- Mukherjee, S.; Zeitouni, S.; Cavarsan, C.F.; Shapiro, L.A. Increased Seizure Susceptibility in Mice 30 Days after Fluid Percussion Injury. Front. Neurol. 2013, 4, 28. [Google Scholar] [CrossRef] [Green Version]
- Golarai, G.; Greenwood, A.C.; Feeney, D.M.; Connor, J.A. Physiological and Structural Evidence for Hippocampal Involvement in Persistent Seizure Susceptibility after Traumatic Brain Injury. J. Neurosci. 2001, 21, 8523–8537. [Google Scholar] [CrossRef]
- Paredes, I.; Navarro, B.; Lagares, A. Sleep Disorders in Traumatic Brain Injury. Neurocirugia 2021, 32, 178–187. [Google Scholar] [CrossRef]
- Leng, Y.; Byers, A.L.; Barnes, D.E.; Peltz, C.B.; Li, Y.; Yaffe, K. Traumatic Brain Injury and Incidence Risk of Sleep Disorders in Nearly 200,000 US Veterans. Neurology 2021, 96, e1792–e1799. [Google Scholar] [CrossRef]
- Noain, D.; Büchele, F.; Schreglmann, S.R.; Valko, P.O.; Gavrilov, Y.V.; Morawska, M.M.; Imbach, L.L.; Baumann, C.R. Increased Sleep Need and Reduction of Tuberomammillary Histamine Neurons after Rodent Traumatic Brain Injury. J. Neurotrauma 2018, 35, 85–93. [Google Scholar] [CrossRef] [Green Version]
- Sabir, M.; Gaudreault, P.O.; Freyburger, M.; Massart, R.; Blanchet-Cohen, A.; Jaber, M.; Gosselin, N.; Mongrain, V. Impact of Traumatic Brain Injury on Sleep Structure, Electrocorticographic Activity and Transcriptome in Mice. Brain. Behav. Immun. 2015, 47, 118–130. [Google Scholar] [CrossRef]
- Mountney, A.; Blaze, J.; Wang, Z.; Umali, M.; Flerlage, W.J.; Dougherty, J.; Ge, Y.; Shear, D.; Haghighi, F. Penetrating Ballistic Brain Injury Produces Acute Alterations in Sleep and Circadian-Related Genes in the Rodent Cortex: A Preliminary Study. Front. Neurol. 2021, 12, 745330. [Google Scholar] [CrossRef]
- Petraglia, A.L.; Plog, B.A.; Dayawansa, S.; Chen, M.; Dashnaw, M.L.; Czerniecka, K.; Walker, C.T.; Viterise, T.; Hyrien, O.; Iliff, J.J.; et al. The Spectrum of Neurobehavioral Sequelae after Repetitive Mild Traumatic Brain Injury: A Novel Mouse Model of Chronic Traumatic Encephalopathy. J. Neurotrauma 2014, 31, 1211–1224. [Google Scholar] [CrossRef] [Green Version]
- Borniger, J.C.; Ungerleider, K.; Zhang, N.; Karelina, K.; Magalang, U.J.; Weil, Z.M. Repetitive Brain Injury of Juvenile Mice Impairs Environmental Enrichment-Induced Modulation of REM Sleep in Adulthood. Neuroscience 2018, 375, 74–83. [Google Scholar] [CrossRef]
- Andrade, P.; Nissinen, J.; Pitkänen, A. Generalized Seizures after Experimental Traumatic Brain Injury Occur at the Transition from Slow-Wave to Rapid Eye Movement Sleep. J. Neurotrauma 2017, 34, 1482–1487. [Google Scholar] [CrossRef]
- Hazra, A.; Macolino, C.; Elliott, M.B.; Chin, J. Delayed Thalamic Astrocytosis and Disrupted Sleep-Wake Patterns in a Preclinical Model of Traumatic Brain Injury. J. Neurosci. Res. 2014, 92, 1434–1445. [Google Scholar] [CrossRef]
- Konduru, S.S.; Wallace, E.P.; Pfammatter, J.A.; Rodrigues, P.V.; Jones, M.V.; Maganti, R.K. Sleep-Wake Characteristics in a Mouse Model of Severe Traumatic Brain Injury: Relation to Posttraumatic Epilepsy. Epilepsia Open 2021, 6, 181–194. [Google Scholar] [CrossRef]
- Qu, W.; Liu, N.K.; Xie, X.M.S.; Li, R.; Xu, X.M. Automated Monitoring of Early Neurobehavioral Changes in Mice Following Traumatic Brain Injury. Neural Regen. Res. 2016, 11, 248–256. [Google Scholar] [CrossRef] [Green Version]
- Thomasy, H.E.; Opp, M.R. Hypocretin Mediates Sleep and Wake Disturbances in a Mouse Model of Traumatic Brain Injury. J. Neurotrauma 2019, 36, 802–814. [Google Scholar] [CrossRef]
- Büchele, F.; Morawska, M.M.; Schreglmann, S.R.; Penner, M.; Muser, M.; Baumann, C.R.; Noain, D. Novel Rat Model of Weight Drop-Induced Closed Diffuse Traumatic Brain Injury Compatible with Electrophysiological Recordings of Vigilance States. J. Neurotrauma 2016, 33, 1171–1180. [Google Scholar] [CrossRef]
- Fabisiak, J.P.; Schwark, W.S. Aspects of the Pentylenetetrazol Kindling Model of Epileptogenesis in the Rat. Exp. Neurol. 1982, 78, 7–14. [Google Scholar] [CrossRef]
- Hamm, R.J.; Pike, B.R.; Temple, M.D.; Odell, D.M.; Lyeth, B.G. The Effect of Postinjury Kindled Seizures on Cognitive Performance of Traumatically Brain-Injured Rats. Exp. Neurol. 1995, 136, 143–148. [Google Scholar] [CrossRef]
- Lapinlampi, N.; Andrade, P.; Paananen, T.; Hämäläinen, E.; Ekolle Ndode-Ekane, X.; Puhakka, N.; Pitkänen, A. Postinjury Weight Rather than Cognitive or Behavioral Impairment Predicts Development of Posttraumatic Epilepsy after Lateral Fluid-percussion Injury in Rats. Epilepsia 2020, 61, 2035–2052. [Google Scholar] [CrossRef]
- Rattka, M.; Brandt, C.; Loscher, W. Do Proconvulsants Modify or Halt Epileptogenesis? Pentylenetetrazole Is Ineffective in Two Rat Models of Temporal Lobe Epilepsy. Eur. J. Neurosci. 2012, 36, 2505–2520. [Google Scholar] [CrossRef]
- Pitkänen, A.; Narkilahti, S.; Bezvenyuk, Z.; Haapalinna, A.; Nissinen, J. Atipamezole, an α2-Adrenoceptor Antagonist, Has Disease Modifying Effects on Epileptogenesis in Rats. Epilepsy Res. 2004, 61, 119–140. [Google Scholar] [CrossRef]
- Pitkänen, A.; McIntosh, T.K. Animal Models of Post-Traumatic Epilepsy. J. Neurotrauma 2006, 23, 241–261. [Google Scholar] [CrossRef]
- Ndode-Ekane, X.E.; Santana-Gomez, C.; Casillas-Espinosa, P.M.; Ali, I.; Brady, R.D.; Smith, G.; Andrade, P.; Immonen, R.; Puhakka, N.; Hudson, M.R.; et al. Harmonization of Lateral Fluid-Percussion Injury Model Production and Post-Injury Monitoring in a Preclinical Multicenter Biomarker Discovery Study on Post-Traumatic Epileptogenesis. Epilepsy Res. 2019, 151, 7–16. [Google Scholar] [CrossRef]
- Manninen, E.M.; Chary, K.; Lapinlampi, N.; Andrade, P.; Paananen, T.; Sierra Lopez, A.; Tohka, J.; Gröhn, O.; Pitkanen, A. Early Increase in Cortical T2 Relaxation Is a Prognostic Biomarker for the Evolution of Severe Cortical Damage, but Not for Epileptogenesis, after Experimental Traumatic Brain Injury. J. Neurotrauma 2020, 37, 2580–2594. [Google Scholar] [CrossRef]


| Parameter (General linear model) | Group | Time of PTZ Test | Intragroup Statistics (Friedman’s 2-way ANOVA) | |||
|---|---|---|---|---|---|---|
| D30 | D60 | D90 | D180 | |||
| Latency to 1st spike | Sham (16) | 220 ± 215 (16) | 191 ± 340 (16) | 278 ± 447 (16) | 149 ± 141 (16) | Friedman’s 2-way ANOVA p = 0.036 Bonferroni corrected p > 0.05 (all) |
| TBI (28) | 280 ± 432 (27) | 204 ± 296 (28) | 140 ± 85 (28) (Cohen’s d 0.50) | 173 ± 179 (27) | NS | |
| Latency to 1st ED | Sham (16) | 316 ± 388 (16) | 205 ± 341 (16) | 359 ± 546 (16) | 239 ± 230 (16) | Friedman’s 2-way ANOVA p = 0.026 D60–D90 Bonferroni-corrected p = 0.024 |
| TBI (28) | 480 ± 662 (27) | 311 ± 422 (28) | 176 ± 138 (28) (Cohen’s d 0.53) | 227 ± 180 (27) | Friedman’s 2-way ANOVA p = 0.015 D30–D90 Bonferroni-corrected p = 0.011 | |
| Latency to 1st seizure | Sham (16) | 1192 ± 1374 (5) | 197 ± 84 (5) | 658 ± 1168 (7) | 588 ± 853 (9) | NS |
| TBI (28) | 370 ± 209 (4) (Cohen’s d 0.79) | 276 ± 148 (12) | 177 ± 93 (15) (Cohen’s d 0.75) | 326 ± 287 (16) | Friedman’s 2-way ANOVA p = 0.044 D30–D90 Bonferroni-corrected p = 0.037 | |
| Number of spikes | Sham (16) | 1342 ± 1127 (16) | 1720 ± 1187 (16) | 1260 ± 1743 (16) | 1598 ± 1362 (16) | NS |
| TBI (28) | 1329 ± 812 (27) | 1447 ± 1030 (28) | 1600 ± 1404 (28) | 1467 ± 1363 (27) | NS | |
| Number of EDs | Sham (16) | 157 ± 137 (16) | 163 ±105 (16) | 161 ± 112 (16) | 139 ± 97 (16) | NS |
| TBI (28) | 176 ± 124 (27) | 170 ± 132 (28) | 175 ± 138 (28) | 119 ± 98 (27) | NS | |
| Number of seizures (Time effect 0.000) | Sham (16) | 0.31 ± 0.48 (16) | 0.38 ± 0.62 (16) | 0.44 ± 0.51 (16) | 1.06 ± 1.12 (16) | Friedman’s 2-way ANOVA p = 0.041 Bonferroni-corrected p > 0.05 (all) |
| TBI (28) | 0.19 ± 0.48 (27) | 0.82 ± 1.22 (28) | 0.82 ± 0.91 (28) | 1.15 ± 1.10 (27) | Friedman’s 2-way ANOVA p = 0.000 D30–D180 Bonferroni-corrected p = 0.006 | |
| Duration of 1st seizure | Sham (16) | 30 ± 7 (3) | 58 ± 22 (5) | 76 ± 43 (7) | 53 ± 36 (9) | NS |
| TBI (28) | 64 ± 70 (4) (Cohen’s d 0.62) | 64 ± 33 (12) | 69 ± 32 (15) | 76 ± 22 (16) (Cohen’s d 0.82) | NS | |
| Lights-Off (h) | Lights-On (h) | Lights-On and Lights-Off (h) | ||||
|---|---|---|---|---|---|---|
| Group | Sleep | Awake | Sleep | Awake | Sleep | Awake |
| Sham (11) | 5.58 ± 0.89 ## | 6.39 ± 0.92 ** | 9.04 ± 0.71 | 2.95 ± 0.71 | 14.62 ± 1.50 && | 9.34 ± 1.53 |
| TBI (14) | 5.14 ± 0.57 ## | 6.84 ± 0.57 ** | 9.00 ± 0.78 | 3.00 ± 0.78 | 14.14 ± 1.29 && | 9.85 ± 1.11 |
| TBIe− (7) | 5.11 ± 0.49 # | 6.88 ± 0.49 * | 9.11 ± 0.90 | 2.88 ± 0.90 | 14.22 ± 1.17 & | 9.76 ± 1.17 |
| TBIe+ (7) | 5.17 ± 0.68# | 6.82 ± 0.67 * | 8.88 ± 0.68 | 3.11 ± 0.69 | 14.05 ± 1.31 & | 9.93 ± 1.13 |
| TBI− (11) | 5.24 ± 0.56 ## | 6.75 ± 0.56 ** | 9.10 ± 0.79 | 2.88 ± 0.79 | 14.34 ± 1.58 && | 9.64 ± 1.16 |
| TBI+ (3) | 4.76 ± 0.52 | 7.21 ± 0.52 | 8.61 ± 0.75 | 3.39 ± 0.75 | 13.37 ± 0.42 | 10.61 ± 0.41 |
| Parameter | Lights-On | Lights-Off | All | |||
|---|---|---|---|---|---|---|
| Sham | TBI | Sham | TBI | Sham | TBI | |
| (n = 11) | (n = 14) | (n = 11) | (n = 14) | (n = 11) | (n = 14) | |
| Average duration of sleep periods (min) | Average lights-on and lights-off (min) | |||||
| Wake | 7.43 ± 4.07 | 6.53 ± 1.86 | 16.41 ± 5.03 | 15.32 ± 4.23 | 11.92 ± 3.46 | 10.93 ± 2.67 |
| N2 | 1.53 ± 0.21 | 1.64 ± 0.32 | 1.16 ± 0.19 | 1.27 ± 0.28 | 1.34 ± 0.11 | 1.46 ± 0.27 |
| N3 | 3.95 ± 0.91 | 3.53 ± 0.77 | 3.54 ± 0.64 | 3.07 ± 0.60 | 3.75 ± 0.73 | 3.31 ± 0.57 |
| REM | 2.17 ± 0.32 | 2.00 ± 0.27 | 1.91 ± 0.31 | 1.61 ± 0.21 * | 2.04 ± 0.25 | 1.81 ± 0.15 * |
| Duration of sleep stages (h) | Total duration (h) | |||||
| Wake | 2.94 ± 0.71 | 2.99 ± 0.78 | 6.39 ± 0.92 | 6.85 ± 0.57 | 9.34 ± 0.53 | 9.84 ± 0.11 |
| N2 | 1.02 ± 0.72 | 1.20 ± 0.75 | 0.48 ± 0.28 | 0.71 ± 0.45 | 1.49 ± 0.96 | 1.91 ± 1.12 |
| N3 | 5.50 ± 0.82 | 5.30 ± 0.72 | 3.62 ± 0.67 | 3.19 ± 0.48 | 9.13 ± 1.39 | 8.49 ± 1.13 |
| REM | 2.53 ± 0.46 | 2.49 ± 0.73 | 1.47 ± 0.31 | 1.24 ± 0.38 | 3.99 ± 0.71 | 3.73 ± 1.05 |
| Parameter | Lights-On | Lights-Off | TOTAL | |||
|---|---|---|---|---|---|---|
| Sham | TBI | Sham | TBI | Sham | TBI | |
| (n = 11) | (n = 14) | (n = 11) | (n = 14) | (n = 11) | (n = 14) | |
| Number of transitions from a deeper to a lighter sleep stage | ||||||
| N2–Awake | 4.09 ± 1.49 | 6.42 ± 1.82 | 5.54 ± 2.06 | 6.00 ± 1.20 | 9.63 ± 3.22 | 12.43 ± 2.76 |
| N3–Awake | 10.54 ± 1.60 | 8.07 ± 1.43 | 8.72 ± 1.09 | 10.50 ± 1.23 | 19.27 ± 2.38 | 18.57 ± 2.34 |
| REM–Awake | 11.91 ± 2.09 | 13.14 ± 1.33 | 10.09 ± 0.79 | 11.29 ± 0.74 | 22.00 ± 2.17 | 24.43 ± 1.36 |
| N3–N2 | 9.27 ± 2.05 | 11.57 ± 2.85 | 5.81 ± 1.82 | 7.92 ± 1.64 | 15.09 ± 3.52 | 19.50 ± 4.17 |
| REM–N2 | 13.18 ± 3.36 | 14.93 ± 3.33 | 4.91 ± 1.19 | 6.71 ± 1.54 | 18.09 ± 4.52 | 21.64 ± 4.71 |
| REM–N3 | 47.64 ± 4.49 | 47.43 ± 6.51 | 32.55 ± 3.27 | 28.14 ± 4.21 | 80.18 ± 7.35 | 75.57 ± 10.22 |
| Total | 96.63 ± 4.35 | 101.57 ± 3.54 | 67.64 ± 4.36 | 70.57 ± 2.71 | 164.27 ± 7.94 | 172.14 ± 4.50 |
| Deep-to-light sleep fragmentation index | 8.01 ± 0.37 | 8.39 ± 0.35 | 5.73 ± 0.37 | 5.88 ± 0.22 | 6.83 ± 0.33 | 7.14 ± 0.21 |
| Number of transitions to | ||||||
| Awake | 21.73 ± 3.07 | 26.50 ± 2.91 | 24.36 ± 1.98 | 28.36 ± 2.29 | 46.09 ± 4.30 | 54.86 ± 4.37 |
| N2 | 29.82 ± 5.47 | 42.29 ± 6.73 | 26.18 ± 5.31 | 33.00 ± 5.09 | 56.00 ± 10.42 | 75.29 ± 10.91 |
| N3 | 73.45 ± 2.66 | 86.50 ± 4.14 * | 62.27 ± 3.65 | 63.29 ± 2.51 | 135.73 ± 5.53 | 149.79 ± 4.72 |
| REM | 59.73 ± 3.28 | 70.93 ± 4.72 * | 48.55 ± 3.39 | 46.07 ± 3.56 | 108.27 ± 5.58 | 117.00 ± 7.19 |
| Total | 184.73 ± 9.88 | 226.21 ± 10.91 * | 161.40 ± 10.72 | 170.71 ± 7.83 | 346.09 ± 18.39 | 396.93 ± 13.70 * |
| Fragmentation index | 15.31 ± 0.81 | 18.67 ± 0.94 * | 13.47 ± 0.89 | 14.23 ± 0.65 | 14.40 ± 0.94 | 16.46 ± 0.59 * |
| ROC AUC (95% CI) without Cross-Validation | ROC AUC (95% CI) with Cross-Validation | Misclassification Rate | Sensitivity | Specificity | Precision | |
|---|---|---|---|---|---|---|
| PTZ seizure-susceptibility test parameters | ||||||
| Sham (16) vs. TBI (28) | ||||||
| Combination of A–C D60 (16/28) | 0.759 (0.578–0.887) ** | 0.679 (0.474–0.833)0.05 | 0.364 | 0.536 | 0.813 | 0.833 |
| Combination of A–E D60 (5/12) | 0.967 (0.750–1.000) *** | 0.500 (0.050–0.869) | 0.294 | 0.750 | 0.600 | 0.818 |
| Combination of A–C D90 (16/28) | 0.670 (0.492–0.816)0.05 | 0.526 (0.385–0.731) | 0.546 | 0.464 | 0.438 | 0.591 |
| Combination of A–E D90 (7/15) | 0.914 (0.688–0.993) *** | 0.733 (0.438–0.902) * | 0.318 | 0.733 | 0.571 | 0.786 |
| TBIe+ (7) vs. TBI− (15) | ||||||
| Combination of A–C D90 (7/15) | 0.895 (0.667–0.987) *** | 0.743 (0.472–0.922)0.05 | 0.364 | 0.667 | 0.571 | 0.769 |
| Combination of A–C D180 (7/15) | 0.895 (0.653–0.992) *** | 0.752 (0.483–0.929) * | 0.318 | 0.733 | 0.571 | 0.786 |
| Combination of A–E D180 (4/9) | 0.889 (0.541–0.950) * | 0.681 (0.350–1.000) | 0.308 | 0.778 | 0.500 | 0.778 |
| TBI+ (4) vs. TBI− (18) | ||||||
| Combination of A–C D90 (4/18) | 1.000 (0.990–1.000) ** | 0.653 (0.342–0.939) | 0.227 | 0.500 | 0.833 | 0.400 |
| Combination of A–C D180 (4/18) | 0.861 (0.569–0.982) ** | 0.625 (0.000–0.950) | 0.364 | 0.500 | 0.667 | 0.250 |
| Combination of A–E D180 (4/9) | 1.000 (0.983–1.000) *** | 0.736 (0.429–1.000) | 0.385 | 0.500 | 0.667 | 0.400 |
| Sleep disturbance parameters | ||||||
| Sham (16) vs. TBI (28) | ||||||
| Combination of F–I (11/14) | 0.896 (0.695–0.981) *** | 0.792 (0.549–0.934) ** | 0.280 | 0.714 | 0.727 | 0.769 |
| Combination of F–M (11/14) | 0.948 (0.766–0.997) *** | 0.591 (0.322–0.816) | 0.360 | 0.636 | 0.643 | 0.583 |
| TBIe+ (7) vs. TBIe− (15) | ||||||
| Combination of F–I (7/7) | 0.776 (0.411–0.979)0.07 | 0.367 (0.078–0.751) | 0.500 | 0.571 | 0.429 | 0.500 |
| Combination of F–M (7/7) | 0.939 (0.849–0.970) *** | 0.612 (0.325–0.844) | 0.429 | 0.714 | 0.429 | 0.556 |
| Combination of PTZ test and sleep: B, C, F-I D180 (7/7) | 0.939 (0.849–0.970) *** | 0.571 (0.269–0.847) | 0.500 | 0.429 | 0.571 | 0.500 |
| TBI+ (4) vs. TBI− (18) | ||||||
| Combination of F–M (3/11) | 0.970 (0.927–1.000) * | 0.439 (0.182–0.885) | 0.357 | 0.333 | 0.727 | 0.250 |
Publisher’s Note: MDPI stays neutral with regard to jurisdictional claims in published maps and institutional affiliations. |
© 2022 by the authors. Licensee MDPI, Basel, Switzerland. This article is an open access article distributed under the terms and conditions of the Creative Commons Attribution (CC BY) license (https://creativecommons.org/licenses/by/4.0/).
Share and Cite
Andrade, P.; Lara-Valderrábano, L.; Manninen, E.; Ciszek, R.; Tapiala, J.; Ndode-Ekane, X.E.; Pitkänen, A. Seizure Susceptibility and Sleep Disturbance as Biomarkers of Epileptogenesis after Experimental TBI. Biomedicines 2022, 10, 1138. https://doi.org/10.3390/biomedicines10051138
Andrade P, Lara-Valderrábano L, Manninen E, Ciszek R, Tapiala J, Ndode-Ekane XE, Pitkänen A. Seizure Susceptibility and Sleep Disturbance as Biomarkers of Epileptogenesis after Experimental TBI. Biomedicines. 2022; 10(5):1138. https://doi.org/10.3390/biomedicines10051138
Chicago/Turabian StyleAndrade, Pedro, Leonardo Lara-Valderrábano, Eppu Manninen, Robert Ciszek, Jesse Tapiala, Xavier Ekolle Ndode-Ekane, and Asla Pitkänen. 2022. "Seizure Susceptibility and Sleep Disturbance as Biomarkers of Epileptogenesis after Experimental TBI" Biomedicines 10, no. 5: 1138. https://doi.org/10.3390/biomedicines10051138
APA StyleAndrade, P., Lara-Valderrábano, L., Manninen, E., Ciszek, R., Tapiala, J., Ndode-Ekane, X. E., & Pitkänen, A. (2022). Seizure Susceptibility and Sleep Disturbance as Biomarkers of Epileptogenesis after Experimental TBI. Biomedicines, 10(5), 1138. https://doi.org/10.3390/biomedicines10051138