
Dyskerin Downregulation Can Induce ER Stress and Promote Autophagy via AKT-mTOR Signaling Deregulation


 , and
, and 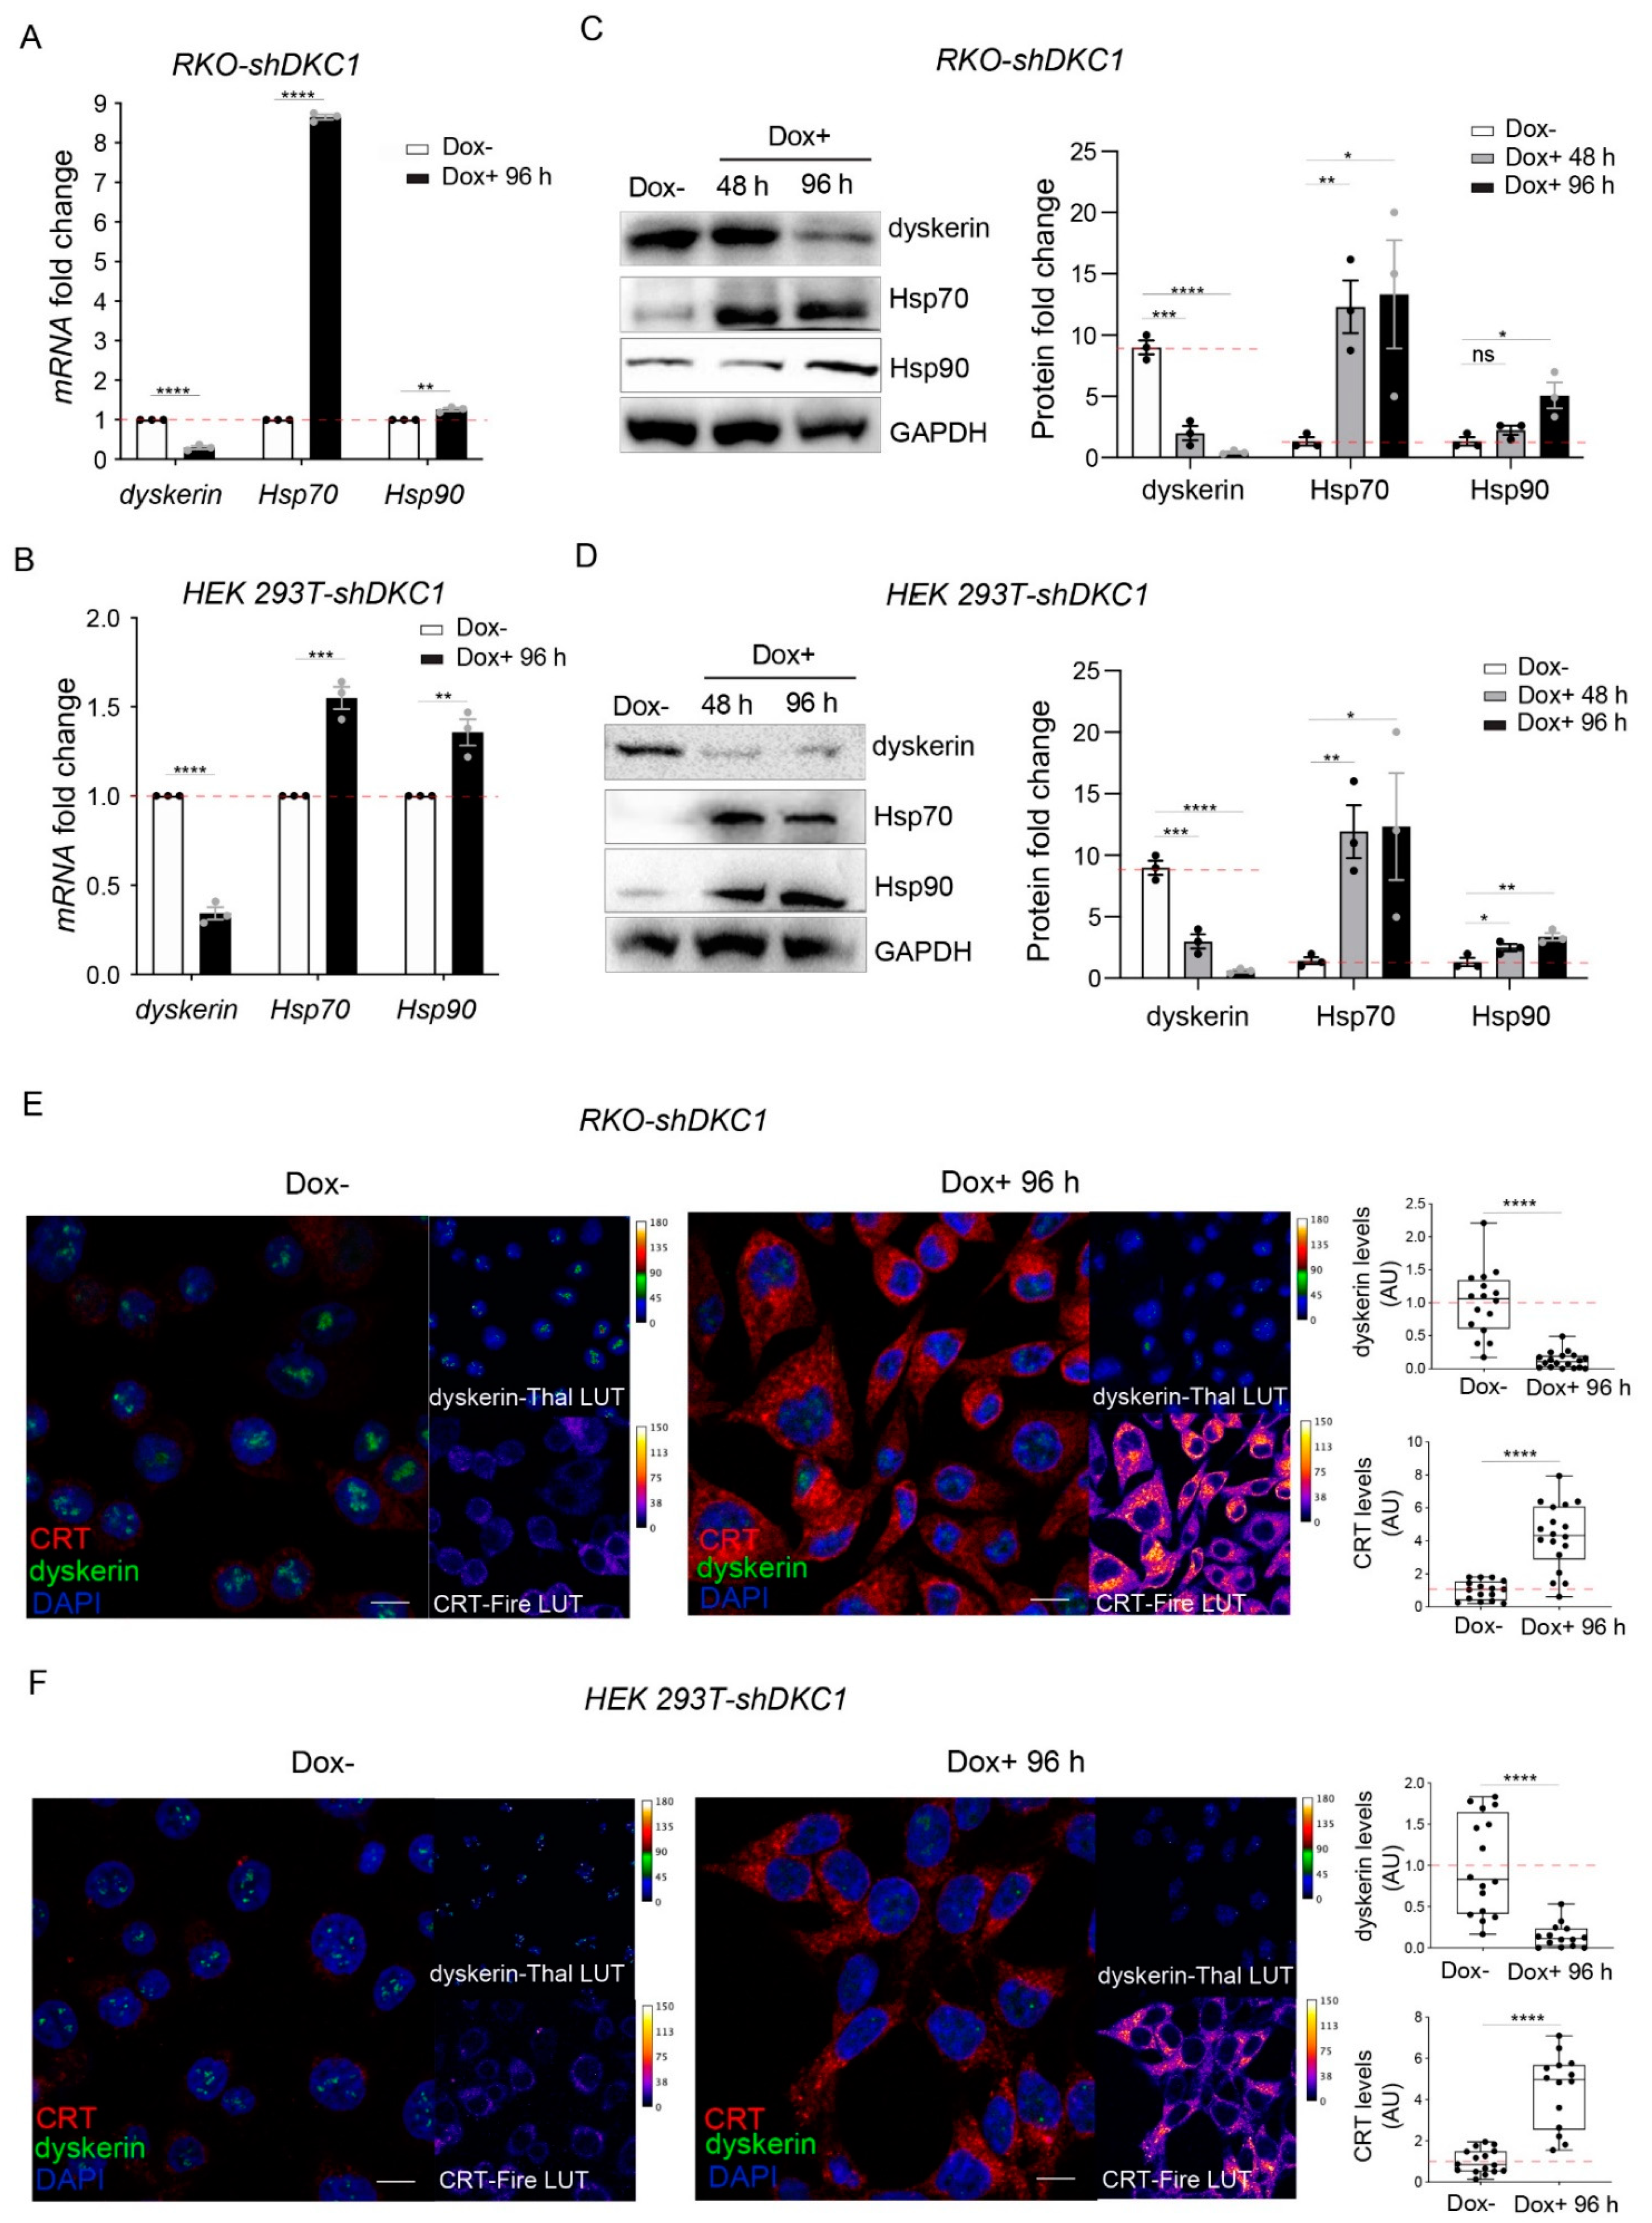
Abstract
1. Introduction
2. Materials and Methods
2.1. Generation of Stable, Dox-inducible DKC1 Silenced Cell Lines
2.2. Cell Culture and Treatments
2.3. Transfection with GFP-LC3-RFP Reporter Transgene
2.4. Reverse Transcription Quantitative PCR (RT-qPCR)
2.5. Flow Cytofluorimetric Analyses
2.6. Protein Analysis
2.7. Immunostaining and Image Capturing
2.8. Immunoreactivity Quantification
2.9. Evaluation of the Autophagic Flux Using the GFP-mRFP-Reporter
2.10. Statistical Analyses
3. Results
3.1. Dyskerin Downregulation Leads to the Accumulation of HSP90, HSP70 and Calreticulin Chaperones
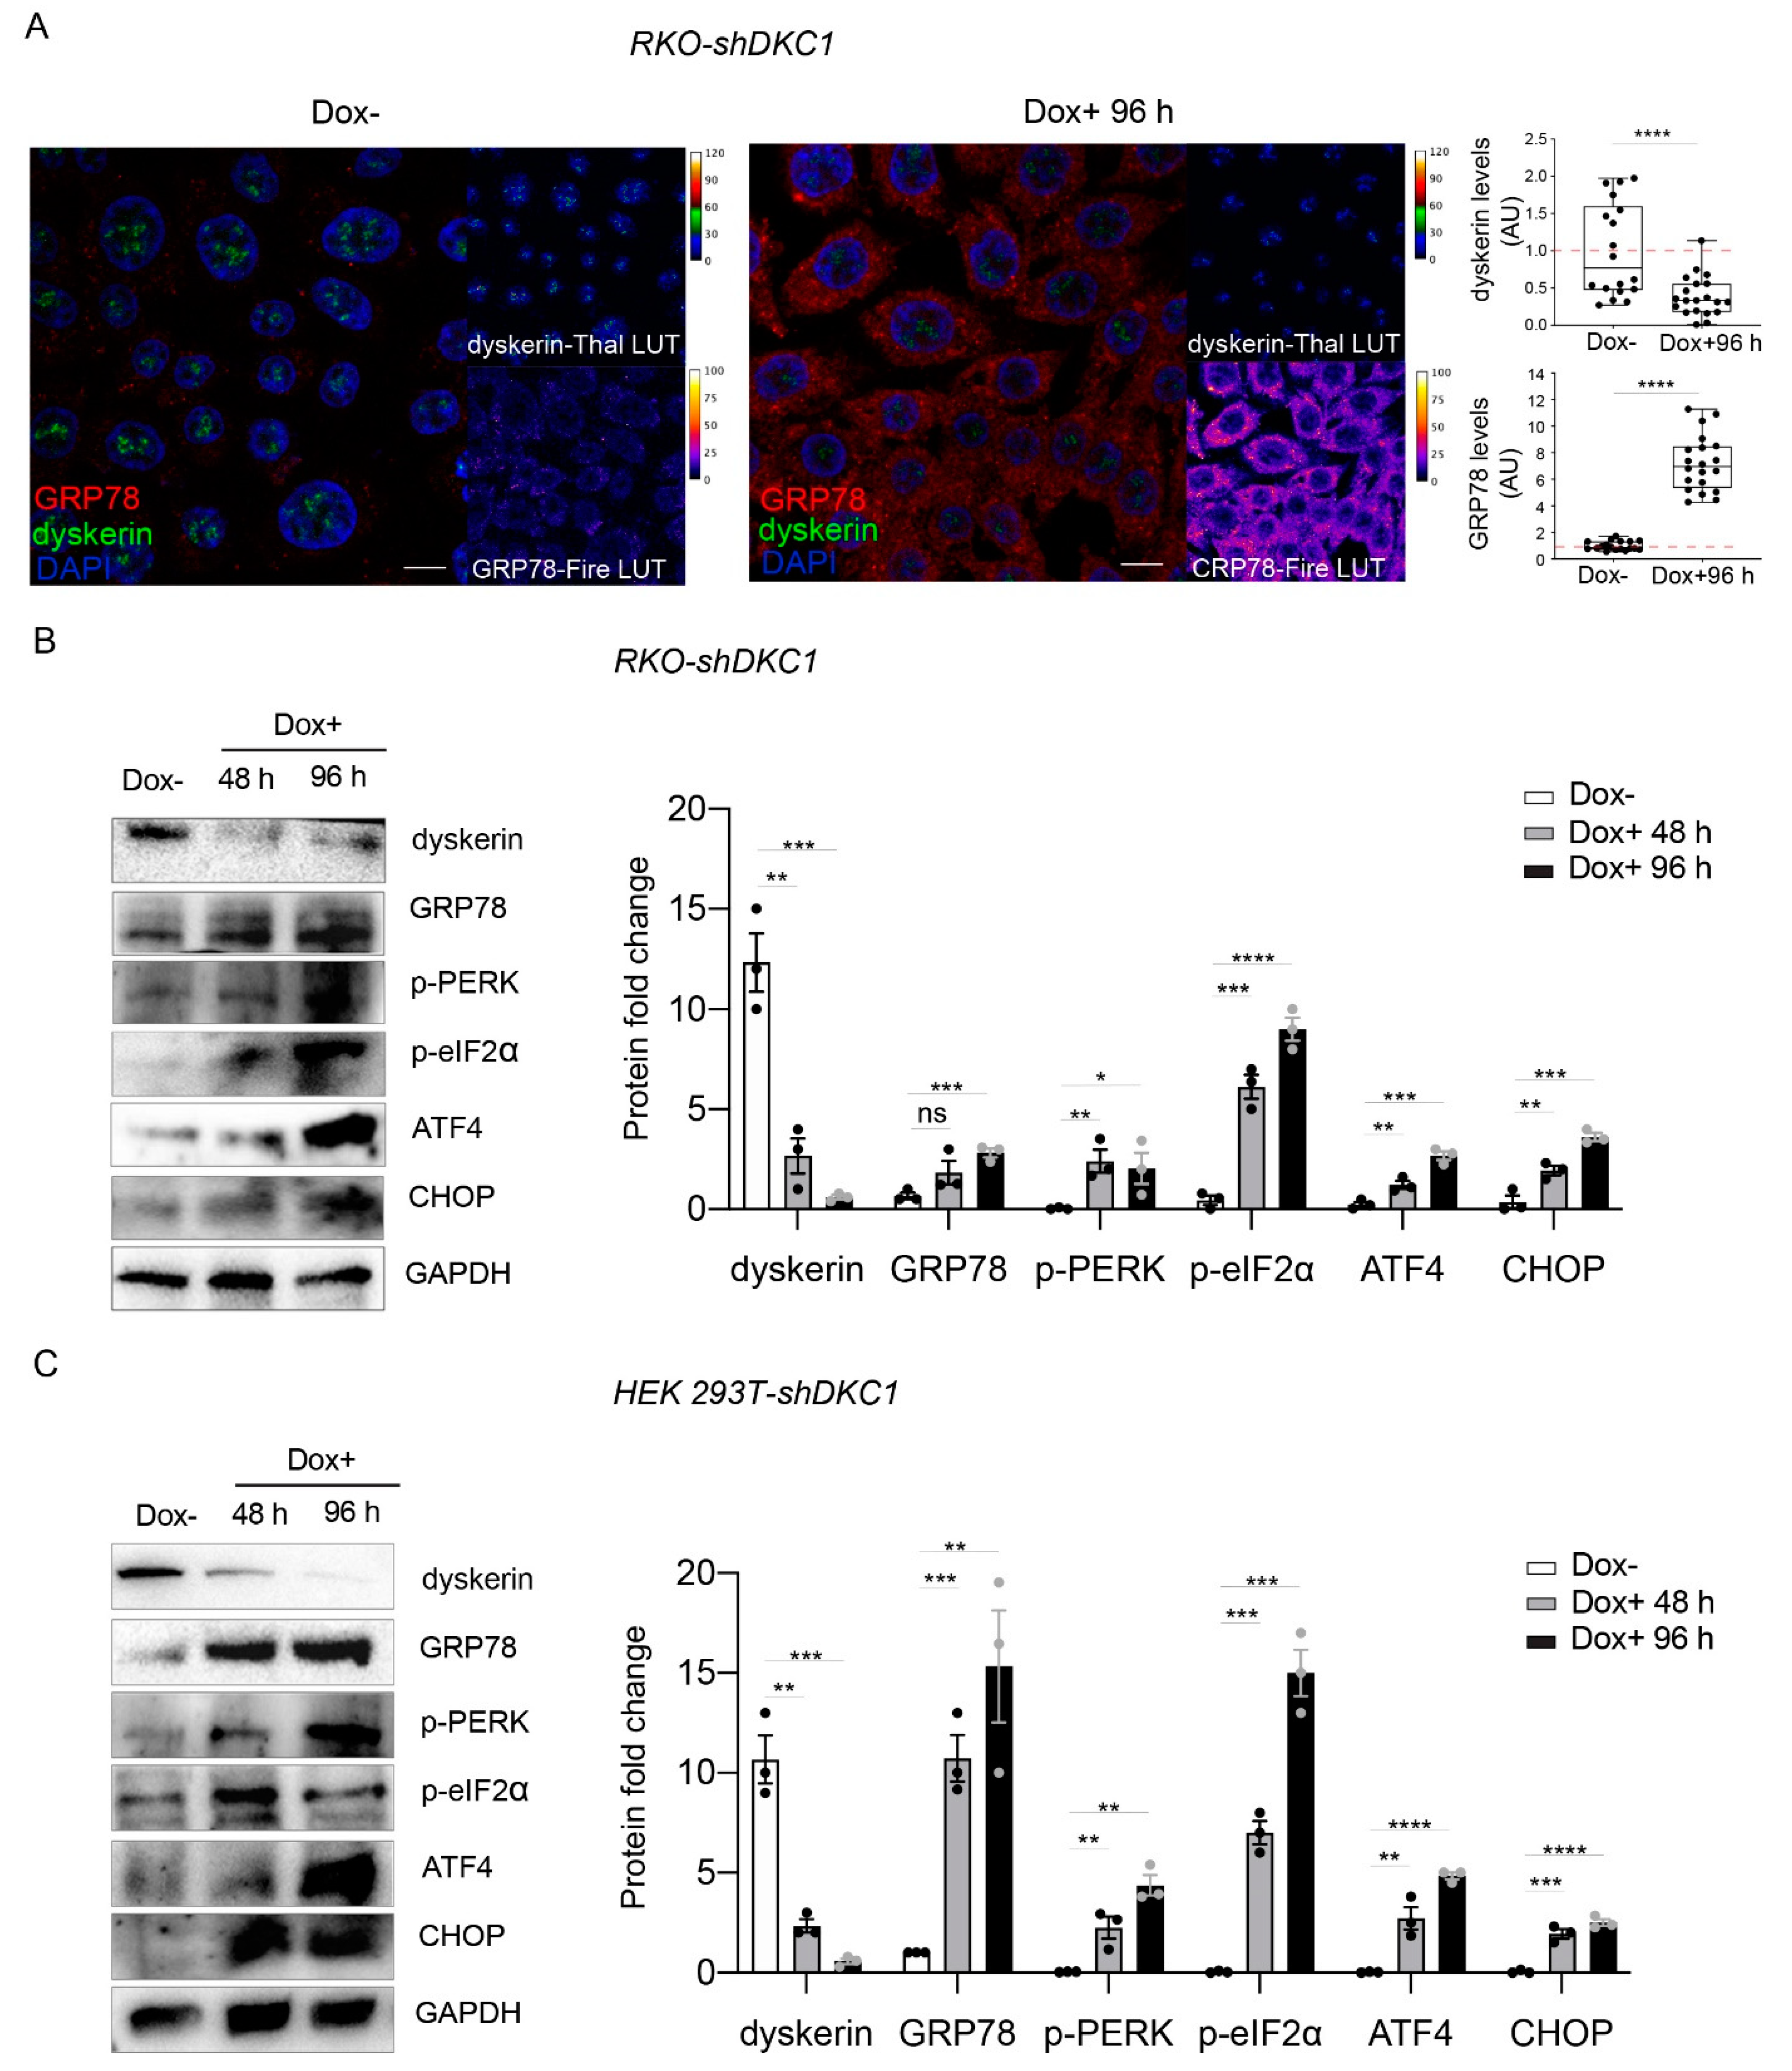
3.2. Dyskerin Depletion Triggers Unfolding Protein Response
3.3. Dyskerin Depletion Does Not Induce Apoptosis
3.4. Dyskerin Downregulation Promotes Autophagy
3.5. Dyskerin Downregulation Promotes Autophagy through the Inhibition of AKT/mTOR Signaling
4. Discussion
Supplementary Materials
Author Contributions
Funding
Institutional Review Board Statement
Informed Consent Statement
Data Availability Statement
Acknowledgments
Conflicts of Interest
References
- Schwartz, S.; Bernstein, D.A.; Mumbach, M.R.; Jovanovic, M.; Herbst, H.R.; Leon-Ricardo, B.X.; Engreitz, M.J.; Guttaman, M.; Satija, R.; Lander, E.S.; et al. Transcriptome-wide mapping reveals widespread dynamic-regulated pseudouridylation of ncRNA and mRNA. Cell 2014, 159, 148–162. [Google Scholar] [CrossRef] [PubMed]
- Angrisani, A.; Vicidomini, R.; Turano, M.; Furia, M. Human dyskerin: Beyond telomeres. Biol. Chem. 2014, 395, 593–610. [Google Scholar] [CrossRef] [PubMed]
- Yoon, A.; Peng, G.; Brandenburger, Y.; Zollo, O.; Xu, W.; Rego, E.; Ruggero, D. Impaired control of IRE-mediated translation in X-linked dyskeratosis congenita. Science 2006, 312, 902–906. [Google Scholar] [CrossRef] [PubMed]
- Montanaro, L.; Calienni, M.; Bertoni, S.; Rocchi, S.; Sansone, P.; Storci, G.; Santini, D.; Ceccarelli, C.; Taffurelli, M.; Carnicelli, D.; et al. Novel dyskerin-mediated mechanism of p53 inactivation through defective mRNA translation. Cancer Res. 2010, 70, 4767–4777. [Google Scholar] [CrossRef]
- Penzo, M.; Rocchi, L.; Brugiere, S.; Carnicelli, D.; Onofrillo, C.; Coutè, Y.; Brigotti, M.; Montanaro, L. Human ribosomes from cells with reduced dyskerin levels are intrinsically altered in translation. FASEB J. 2015, 29, 3472–3482. [Google Scholar] [CrossRef]
- Gu, B.W.; Bessler, M.; Mason, P.J. A pathogenic dyskerin mutation impairs proliferation and activates a DNA damage response independent of telomere length in mice. Proc. Natl. Acad. Sci. USA 2008, 105, 10173–10178. [Google Scholar] [CrossRef]
- Pereboeva, L.; Westin, E.; Patel, T. DNA damage responses and oxidative stress in dyskeratosis congenita. PLoS ONE 2013, 8, e76473. [Google Scholar] [CrossRef]
- Belli, V.; Matrone, N.; Sagliocchi, S.; Incarnato, R.; Conte, A.; Pizzo, E.; Turano, M.; Angrisani, A.; Furia, M. A dynamic link between H/ACA snoRNP components and cytoplasmic stress granules. Biochim. Biophys. Acta Mol. Cell Res. 2019, 1866, 118529. [Google Scholar] [CrossRef]
- Di Maio, N.; Vicidomini, R.; Angrisani, A.; Belli, V.; Furia, M.; Turano, M. A new role for human dyskerin in vesicular trafficking. FEBS Open Bio. 2017, 7, 1453–1468. [Google Scholar] [CrossRef]
- Angrisani, A.; Matrone, N.; Belli, V.; Vicidomini, R.; Di Maio, N.; Turano, M.; Scialò, F.; Netti, P.A.; Porcellini, A.; Furia, M. A functional connection between dyskerin and energy metabolism. Redox Biol. 2018, 14, 557–565. [Google Scholar] [CrossRef]
- Montanaro, L.; Brigotti, M.; Clohessy, J.; Barberi, S.; Ceccarelli, C.; Santini, D.; Taffurelli, M.; Calienni, M.; Teruya-Feldstein, J.; Trerè, D.; et al. Dyskerin expression influences the level of ribosomal RNA pseudo-uridylation and telomerase RNA component in human breast cancer. J. Pathol. 2006, 210, 10–18. [Google Scholar] [CrossRef] [PubMed]
- Sieron, P.; Hader, C.; Hatina, J.; Engers, R.; Wlazlinski, A.; Muller, M.; Schulz, W.A. DKC1 overexpression associated with prostate cancer progression. Br. J. Cancer 2009, 101, 1410–1416. [Google Scholar] [CrossRef] [PubMed]
- Turano, M.; Angrisani, A.; De Rosa, M.; Izzo, P.; Furia, M. Real-time PCR quantification of human DKC1 expression in colorectal cancer. Acta Oncol. 2008, 47, 1598–1599. [Google Scholar] [CrossRef] [PubMed]
- Liu, Z.; Lv, Y.; Zhao, N.; Guan, G.; Wang, J. Protein kinase R-like ER kinase and its role in endoplasmic reticulum stress-decided cell fate. Cell Death Dis. 2015, 6, e1822. [Google Scholar] [CrossRef]
- Heiss, N.S.; Knight, S.W.; Vulliamy, T.J.; Klauck, S.M.; Wiemann, S.; Mason, P.J.; Poustka, A.; Dokal, I. X-linked dyskeratosis congenita is caused by mutations in a highly conserved gene with putative nucleolar functions. Nat. Genet. 1998, 19, 32–38. [Google Scholar] [CrossRef]
- Alter, B.P.; Giri, N.; Savage, S.A.; Rosenberg, P.S. Cancer in dyskeratosis congenita. Blood 2009, 113, 6549–6557. [Google Scholar] [CrossRef]
- Ruggero, D.; Grisendi, S.; Piazza, F.; Rego, E.; Mari, F.; Rao, P.H.; Cordon-Cardo, C.; Pandolfi, P.P. Dyskeratosis congenita and cancer in mice deficient in ribosomal RNA modification. Science 2003, 299, 259–262. [Google Scholar] [CrossRef]
- Venturi, G.; Montanaro, L. How Altered Ribosome Production Can Cause or Contribute to Human Disease: The Spectrum of Ribosomopathies. Cells 2020, 9, 2300. [Google Scholar] [CrossRef]
- MacNeil, D.E.; Lambert-Lanteigne, P.; Autexier, C. N-terminal residues of human dyskerin are required for interactions with telomerase RNA that prevent RNA degradation. Nucleic Acids Res. 2019, 47, 5368–5380. [Google Scholar] [CrossRef]
- Vicidomini, R.; Petrizzo, A.; Di Giovanni, A.; Cassese, L.; Lombardi, A.A.; Pragliola, C.; Furia, M. Drosophila dyskerin is required for somatic stem cell homeostasis. Sci. Rep. 2017, 7, 347. [Google Scholar] [CrossRef]
- Vicidomini, R.; Di Giovanni, A.; Petrizzo, A.; Iannucci, L.F.; Benvenuto, G.; Nagel, A.C.; Preiss, A.; Furia, M. Loss of Drosophila pseudouridine synthase triggers apoptosis-induced proliferation and promotes cell-nonautonomous EMT. Cell Death Dis. 2015, 6, e1705. [Google Scholar] [CrossRef] [PubMed]
- Angrisani, A.; Turano, M.; Paparo, L.; Di Mauro, C.; Furia, M. A new human dyskerin isoform with cytoplasmic localization. Biochim. Biophys. Acta 2011, 1810, 1361–1368. [Google Scholar] [CrossRef] [PubMed]
- Sannino, S.; Brodsky, J.L. Targeting protein quality control pathways in breast cancer. BMC Biol. 2017, 15, 109. [Google Scholar] [CrossRef] [PubMed]
- Wegele, H.; Wandinger, S.K.; Schmid, A.B.; Reinstein, J.; Buchner, J. Substrate transfer from the chaperone Hsp70 to Hsp90. J. Mol. Biol. 2006, 356, 802–811. [Google Scholar] [CrossRef]
- Higuchi-Sanabria, R.; Paul, J.W., 3rd; Durieux, J.; Benitez, C.; Frankino, P.A.; Tronnes, S.U.; Garcia, G.; Daniele, J.R.; Monshietehadi, S.; Dillin, A. Spatial regulation of the actin cytoskeleton by HSF-1 during aging. Mol. Biol. Cell 2018, 29, 2522–2527. [Google Scholar] [CrossRef] [PubMed]
- Yang, Y.; Ma, F.; Liu, Z.; Su, Q.; Liu, Y.; Liu, Z.; Li, Y. The ER-localized Ca2+-binding protein calreticulin couples ER stress to autophagy by associating with microtubule-associated protein 1A/1B light chain 3. J. Biol. Chem. 2019, 294, 772–782. [Google Scholar] [CrossRef] [PubMed]
- Schardt, J.A.; Eyholzer, M.; Timchenko, N.A.; Muelle, B.U.; Pabst, T. Unfolded protein response suppresses CEBPA by induction of calreticulin in acute myeloid leukaemia. J. Cell Mol. Med. 2010, 14, 1509–1519. [Google Scholar] [CrossRef]
- Kozutsumi, Y.; Segal, M.; Normington, K.; Gething, M.J.; Sambrook, J. The presence of malfolded proteins in the endoplasmic reticulum signals the induction of glucose-regulated proteins. Nature 1988, 332, 462–464. [Google Scholar] [CrossRef]
- Rashid, H.O.; Yadav, R.K.; Kim, H.R.; Chae, H.J. ER stress: Autophagy induction, inhibition and selection. Autophagy 2015, 11, 1956–1977. [Google Scholar] [CrossRef]
- Adams, C.J.; Kopp, M.C.; Larburu, N.; Nowak, P.R.; Ali, M.M.U. Structure and Molecular Mechanism of ER Stress Signaling by the Unfolded Protein Response Signal Activator IRE1. Front. Mol. Biosci. 2019, 6, 11. [Google Scholar] [CrossRef]
- Ariyasu, D.; Yoshida, H.; Hasegawa, Y. Endoplasmic Reticulum (ER) Stress and Endocrine Disorders. Int. J. Mol. Sci. 2017, 18, 382. [Google Scholar] [CrossRef] [PubMed]
- Ron, D.; Walter, P. Signal integration in the endoplasmic reticulum unfolded protein response. Nat. Rev. Mol. Cell Biol. 2007, 8, 519–529. [Google Scholar] [CrossRef] [PubMed]
- Wu, J.; Kaufman, R.J. From acute ER stress to physiological roles of the Unfolded Protein Response. Cell Death Differ. 2006, 13, 374–384. [Google Scholar] [CrossRef] [PubMed]
- Tabas, I.; Ron, D. Integrating the mechanisms of apoptosis induced by endoplasmic reticulum stress. Nat. Cell Biol. 2011, 13, 184–190. [Google Scholar] [CrossRef]
- Yao, R.; Sun, X.; Xie, Y.; Liu, L.; Han, D.; Yao, Y.; Li, H.; Li, Z.; Xu, K. Lithium chloride inhibits cell survival, overcomes drug resistance, and triggers apoptosis in multiple myeloma via activation of the Wnt/β-catenin pathway. Am. J. Transl. Res. 2018, 10, 2610–2618. [Google Scholar] [PubMed]
- Cammarota, F.; Conte, A.; Aversano, A.; Muto, P.; Ametrano, G.; Riccio, P.; Turano, M.; Valente, V.; Delrio, P.; Izzo, P.; et al. Lithium chloride increases sensitivity to photon irradiation treatment in primary mesenchymal colon cancer cells. Mol. Med. Rep. 2020, 21, 1501–1508. [Google Scholar] [CrossRef]
- Zhang, W.V.; Jüllig, M.; Connolly, A.R.; Stott, N.S. Early gene response in lithium chloride induced apoptosis. Apoptosis 2005, 10, 75–90. [Google Scholar] [CrossRef]
- Mizushima, N.; Yoshimori, T. How to Interpret LC3 Immunoblotting. Autophagy 2007, 3, 542–545. [Google Scholar] [CrossRef]
- Otomo, C.; Metlagel, Z.; Takaesu, G.; Otomo, T. Structure of the human ATG12~ATG5 conjugate for LC3 lipidation in autophagy. Nat. Struct. Mol. Biol. 2013, 20, 59–66. [Google Scholar] [CrossRef]
- Klionsky, D.J.; Abdelmohsen, K.; Abe, A.; Abedin, M.J.; Abeliovich, H.; Arozena, A.A.; Adachi, H.; Adams, C.M.; Adams, P.D.; Adeli, K.; et al. Guidelines for the use and interpretation of assays for monitoring autophagy (3rd edition). Autophagy 2016, 12, 1–222. [Google Scholar] [CrossRef]
- Rubinsztein, D. Autophagy: Where next? EMBO Rep. 2010, 11, 3. [Google Scholar] [CrossRef] [PubMed]
- Kaizuka, T.; Morishita, H.; Hama, Y.; Tsukaoto, S.; Matsui, T.; Toyota, Y.; Kodama, A.; Ishihara, T.; Mizushima, T.; Mizushima, N. An Autophagic Flux Probe that Releases an Internal Control. Mol. Cell 2016, 64, 835–849. [Google Scholar] [CrossRef] [PubMed]
- Rabanal Ruiz, Y.; Otten, E.G.; Korolchuk, V.I. mTORC1 as the main gateway to autophagy. Essays Biochem. 2017, 61, 565–584. [Google Scholar] [CrossRef] [PubMed]
- Marton, M.; Kurucz, A.; Lizak, B.; Margittai, E.; Banhegyi, G.; Kapuy, O. A Systems Biological View of Life-and-Death Decision with Respect to Endoplasmic Reticulum Stress-The Role of PERK Pathway. Int. J. Mol. Sci. 2017, 18, 58. [Google Scholar] [CrossRef] [PubMed]
- Qin, L.; Wang, Z.; Tao, L.; Wang, Y. ER stress negatively regulates AKT/TSC/mTOR pathway to enhance autophagy. Autophagy 2010, 6, 239–247. [Google Scholar] [CrossRef]
- Gosselin, P.; Oulhen, N.; Jam, M.; Ronzca, J.; Cormier, P.; Czjzek, M.; Cosson, B. The translational repressor 4E-BP called to order by eIF4E: New structural insights by SAXS. Nucleic Acids Res. 2011, 39, 3496–3503. [Google Scholar] [CrossRef] [PubMed]
- Datan, E.; Shirazian, A.; Benjamin, S.; Matassov, D.; Tinari, A.; Malorni, W.; Lockshin, R.A.; Garcia-Sastre, A.; Zakeri, Z. mTOR/p70S6K signaling distinguishes routine, maintenance-level autophagy from autophagic cell death during influenza A infection. Virology 2014, 452–453, 175–190. [Google Scholar] [CrossRef]
- Chambers, J.E.; Marciniak, S.J. Cellular mechanisms of endoplasmic reticulum stress signaling in health and disease. 2. Protein misfolding and ER stress. Am. J. Physiol. Cell Physiol. 2014, 307, C657–C670. [Google Scholar] [CrossRef]
- Bakunts, A.; Orsi, A.; Vitale, M.; Cattaneo, A.; Lari, F.; Tadè, L.; Sitia, R.; Raimondi, A.; Bachi, A.; Anken, E. Ratiometric sensing of BiP-client versus BiP levels by the unfolded protein response determines its signaling amplitude. Elife 2017, 6, e27518. [Google Scholar] [CrossRef]
- Patil, A.; Chan, C.T.; Dyavaiah, M.; Rooney, J.P.; Dedon, P.C.; Begley, T.J. Translational infidelity-induced protein stress results from a deficiency in Trm9-catalyzed tRNA modifications. RNA Biol. 2012, 9, 990–1001. [Google Scholar] [CrossRef]
- Rozpedek-Kaminska, W.; Siwecka, N.; Wawrzynkiewicz, A.; Wojtczak, R.; Pytel, D.; Diehl, J.A.; Majsterek, I. The PERK-Dependent Molecular Mechanisms as a Novel Therapeutic Target for Neurodegenerative Diseases. Int. J. Mol. Sci. 2020, 21, 2108. [Google Scholar] [CrossRef] [PubMed]
- Liu, B.; Zhang, J.; Huang, C.; Liu, H. Dyskerin overexpression in human hepatocellular carcinoma is associated with advanced clinical stage and poor patient prognosis. PLoS ONE 2012, 7, e43147. [Google Scholar] [CrossRef] [PubMed]
- Bertolotti, A.; Zhang, Y.; Hendershot, L.M.; Harding, H.P.; Ron, D. Dynamic interaction of BiP and ER stress transducers in the unfolded-protein response. Nat. Cell Biol. 2000, 2, 326–332. [Google Scholar] [CrossRef] [PubMed]
- Wang, P.; Li, J.; Sha, B. The ER stress sensor PERK luminal domain functions as a molecular chaperone to interact with misfolded proteins. Acta Crystallogr. D Struct. Biol. 2016, 72, 1290–1297. [Google Scholar] [CrossRef] [PubMed]
- Pytel, D.; Majsterek, I.; Diehl, J.A. Tumor progression and the different faces of the PERK kinase. Oncogene 2016, 35, 1207–1215. [Google Scholar] [CrossRef]
- DuRose, J.B.; Scheuner, D.; Kaufman, R.J.; Rothblum, L.I.; Niwa, M. Phosphorylation of Eukaryotic Translation Initiation Factor 2 Coordinates rRNA Transcription and Translation Inhibition during Endoplasmic Reticulum Stress. Mol. Cell Biol. 2009, 29, 4295–4307. [Google Scholar] [CrossRef]
- Rozpedek, W.; Pytel, D.; Mucha, B.; Leszcynska, H.; Diehl, J.A.; Majsterek, I. The Role of the PERK/eIF2α/ATF4/CHOP Signaling Pathway in Tumor Progression during Endoplasmic Reticulum Stress. Curr. Mol. Med. 2016, 16, 533–544. [Google Scholar] [CrossRef]
- Harding, H.P.; Novoa, I.; Zhang, Y.; Zeng, H.; Wek, R.; Schapira, M.; Ron, D. Regulated translation initiation controls stress-induced gene expression in mammalian cells. Mol. Cell 2000, 6, 1099–1108. [Google Scholar] [CrossRef]
- Wong, W.L.; Brostrom, M.A.; Kuznetsov, G.; Gmitter-Yelle, D. Inhibition of protein synthesis and early protein processing by thapsigargin in cultured cells. Biochem. J. 1993, 289, 71–79. [Google Scholar] [CrossRef]
- Fawcett, T.W.; Martindale, J.L.; Guyton, K.Z.; Hai, T.; Holbrook, N.J. Complexes containing activating transcription factor (ATF)/cAMP-responsive element-binding protein (CREB) interact with the CCAAT/enhancer-binding protein (C/EBP)-ATF compoite site to regulate Gadd153 expression during the stress response. Biochem. J. 1999, 339, 135–141. [Google Scholar] [CrossRef]
- Rocchi, L.; Pacilli, A.; Sethi, R.; Penzo, M.; Scheider, R.J.; Trerè, D.; Brigotti, M.; Montanaro, L. Dyskerin depletion increase VEGF mRNA internal ribosome entry site-mediated translation. Nucleic Acids Res. 2013, 41, 8308–8318. [Google Scholar] [CrossRef] [PubMed]
- Humeau, J.; Marion, L.; Cerrato, G.; Loos, F.; Kepp, O.; Kroemer, G. Phosphorylation of eukaryotic initiation factor-2α (eIF2α) in autophagy. Cell Death Dis. 2020, 11, 433. [Google Scholar] [CrossRef] [PubMed]
- Szegezdi, E.; Logue, S.E.; Gorman, A.M.; Samali, A. Mediators of endoplasmic reticulum stress-induced apoptosis. EMBO Rep. 2006, 7, 880–885. [Google Scholar] [CrossRef] [PubMed]
- Alawi, F.; Lin, P. Dyskerin Localizes to the Mitotic Apparatus and Is Required for Orderly Mitosis in Human Cells. PLoS ONE 2013, 8, e80805. [Google Scholar] [CrossRef]
- Lin, P.; Mobasher, M.E.; Alawi, F. Acute dyskerin depletion triggers cellular senescence and renders osteosarcoma cells resistant to genotoxic stress-induced apoptosis. Biochem. Biophys. Res. Commun. 2014, 446, 1268–1275. [Google Scholar] [CrossRef][Green Version]
- Appenzeller-Herzog, C.; Hall, M.N. Bidirectional crosstalk between endoplasmic reticulum stress and mTOR signaling. Trends Cell Biol. 2012, 22, 274–282. [Google Scholar] [CrossRef]
- Di Nardo, A.; Kramvis, I.; Cho, N.; Sadowski, A.; Meikle, L.; Kwiatkowki, D.J.; Sahin, M. Tuberous sclerosis complex activity is required to control neuronal stress responses in an mTOR-dependent manner. J. Neurosci. 2009, 29, 5926–5937. [Google Scholar] [CrossRef]
- Yamazaki, H.; Hiramatsu, N.; Hayakawa, K.; Tagawa, Y.; Okamura, M.; Ogata, R.; Huang, T.; Nakajima, S.; Yao, J.; Paton, A.W.; et al. Activation of the Akt-NF-kappaB pathway by subtilase cytotoxin through the ATF6 branch of the unfolded protein response. J. Immunol. 2009, 183, 1480–1487. [Google Scholar] [CrossRef]
- Hosoi, T.; Hyoda, K.; Okuma, Y.; Nomura, Y.; Ozawa, K. Akt up- and down-regulation in response to endoplasmic reticulum stress. Brain Res. 2007, 1152, 27–31. [Google Scholar] [CrossRef]
- Nakajima, S.; Hiramatsu, N.; Hayakawa, K.; Saito, Y.; Kato, H.; Huang, T.; Yao, J.; Paton, A.W.; Paton, J.C.; Kitamora, M. Selective abrogation of BiP/GRP78 blunts activation of NF-κB through the ATF6 branch of the UPR: Involvement of C/EBPβ and mTOR-dependent dephosphorylation of Akt. Mol. Cell Biol. 2011, 31, 1710–1718. [Google Scholar] [CrossRef]
- Deldicque, L.; Bertrand, L.; Patton, A.; Francaux, M.; Baar, K. ER stress induces anabolic resistance in muscle cells through PKB-induced blockade of mTORC1. PLoS ONE 2011, 6, e20993. [Google Scholar] [CrossRef] [PubMed]
- Kato, H.; Nakajima, S.; Saito, Y.; Takahashi, S.; Katoh, R.; Kitamora, M. mTORC1 serves ER stress-triggered apoptosis via selective activation of the IRE1-JNK pathway. Cell Death Differ. 2012, 19, 310–320. [Google Scholar] [CrossRef] [PubMed]
- Tremblay, F.; Brulé, S.; Um Hee, S.; Masuda, K.; Roden, M.; Sun, X.J.; Krebs, M.; Polakiewicz, R.D.; Thomas, G.; Marette, A. Identification of IRS-1 Ser-1101 as a target of S6K1 in nutrient- and obesity-induced insulin resistance. Proc. Natl. Acad. Sci. USA 2007, 104, 14056–14061. [Google Scholar] [CrossRef] [PubMed]
- Pozzi, C.; Cuomo, A.; Spadoni, I.; Magni, E.; Silvola, A.; Conte, A.; Sigismund, S.; Ravenda, P.S.; Bonaldi, T.; Zampino, M.G.; et al. The EGFR-specific antibody cetuximab combined with chemotherapy triggers immunogenic cell death. Nat. Med. 2016, 22, 624–631. [Google Scholar] [CrossRef] [PubMed]
- Okuyama, K.; Suzuki, K.; Naruse, T.; Tsuchihashi, H.; Yanamoto, S.; Kaida, A.; Miura, M.; Umeda, M.; Yamashita, S. Prolonged cetuximab treatment promotes p27 Kip1-mediated G1 arrest and autophagy in head and neck squamous cell carcinoma. Sci. Rep. 2021, 11, 5259. [Google Scholar] [CrossRef] [PubMed]
- Du, K.; Herzig, S.; Kulkarni, R.N.; Montminy, M. TRB3: A tribbles homolog that inhibits Akt/PKB activation by insulin in liver. Science 2003, 300, 1574–1577. [Google Scholar] [CrossRef]
- Ohoka, N.; Yoshii, S.; Hattori, T.; Onozaki, K. TRB3, a novel ER stress-inducible gene, is induced via ATF4-CHOP pathway and is involved in cell death. EMBO J. 2005, 24, 1243–1255. [Google Scholar] [CrossRef]
- Ozcan, U.; Ozcan, L.; Yilmaz, E.; Duvel, K.; Sahin, M.; Manning, B.D.; Hotamisligil, G.S. Loss 567 of the tuberous sclerosis complex tumor suppressors triggers the unfolded protein response to regulate insulin signaling and apoptosis. Mol. Cell 2008, 29, 541–551. [Google Scholar] [CrossRef]
- Ito, N.; Nishibori, Y.; Ito, Y.; Takagi, H.; Akimoto, Y.; Kudo, A.; Asanuma, K.; Sai, Y.; Miyamoto, K.; Takenaka, H.; et al. mTORC1 activation triggers the unfolded protein response in podocytes and leads to nephrotic syndrome. Lab. Investig. 2011, 91, 1584–1595. [Google Scholar] [CrossRef]
- Inoki, K.; Mori, H.; Wang, J.; Suzuki, T.; Hong, S.; Yoshida, S.; Blattner, S.M.; Ikenoue, T.; Ruegg, M.A.; Hall, M.N.; et al. mTORC1 activation in podocytes is a critical step in the development of diabetic nephropathy in mice. J. Clin. Investig. 2011, 12, 2181–2196. [Google Scholar] [CrossRef]
- Bachar, E.; Ariav, Y.; Ketzinel-Gilad, M.; Cerasi, E.; Kaiser, N.; Leibowitz, G. Glucose amplifies fatty acid-induced endoplasmic reticulum stress in pancreatic beta-cells via activation of mTORC1. PLoS ONE 2009, 4, e4954. [Google Scholar] [CrossRef] [PubMed]
- Benjamin, D.; Colombi, M.; Moroni, C.; Hall, M.N. Rapamycin passes the torch: A new generation of mTOR inhibitors. Nat. Rev. Drug Discov. 2011, 10, 868–880. [Google Scholar] [CrossRef] [PubMed]
- Knight, S.; Vulliamy, T.; Copplestone, A.; Gluckman, E.; Mason, P.; Dokal, I. Dyskeratosis Congenita (DC) Registry: Identification of new features of DC. Br. J. Haematol. 1998, 103, 990–996. [Google Scholar] [CrossRef] [PubMed]
- Powell, J.B.; Dokal, I.; Carr, R.; Taibjee, S.; Cave, B.; Moss, C. X-linked dyskeratosis congenita presenting in adulthood with photodamaged skin and epiphora. Clin. Exp. Dermatol. 2014, 39, 310–314. [Google Scholar] [CrossRef]


Publisher’s Note: MDPI stays neutral with regard to jurisdictional claims in published maps and institutional affiliations. |
© 2022 by the authors. Licensee MDPI, Basel, Switzerland. This article is an open access article distributed under the terms and conditions of the Creative Commons Attribution (CC BY) license (https://creativecommons.org/licenses/by/4.0/).
Share and Cite
Maiello, D.; Varone, M.; Vicidomini, R.; Belli, V.; De Rosa, M.; Dama, P.; Furia, M.; Turano, M. Dyskerin Downregulation Can Induce ER Stress and Promote Autophagy via AKT-mTOR Signaling Deregulation. Biomedicines 2022, 10, 1092. https://doi.org/10.3390/biomedicines10051092
Maiello D, Varone M, Vicidomini R, Belli V, De Rosa M, Dama P, Furia M, Turano M. Dyskerin Downregulation Can Induce ER Stress and Promote Autophagy via AKT-mTOR Signaling Deregulation. Biomedicines. 2022; 10(5):1092. https://doi.org/10.3390/biomedicines10051092
Chicago/Turabian StyleMaiello, Daniela, Marianna Varone, Rosario Vicidomini, Valentina Belli, Marina De Rosa, Paola Dama, Maria Furia, and Mimmo Turano. 2022. "Dyskerin Downregulation Can Induce ER Stress and Promote Autophagy via AKT-mTOR Signaling Deregulation" Biomedicines 10, no. 5: 1092. https://doi.org/10.3390/biomedicines10051092
APA StyleMaiello, D., Varone, M., Vicidomini, R., Belli, V., De Rosa, M., Dama, P., Furia, M., & Turano, M. (2022). Dyskerin Downregulation Can Induce ER Stress and Promote Autophagy via AKT-mTOR Signaling Deregulation. Biomedicines, 10(5), 1092. https://doi.org/10.3390/biomedicines10051092