Article

EGFR Amplification Is a Phenomenon of IDH Wildtype and TERT Mutated High-Grade Glioma: An Integrated Analysis Using Fluorescence In Situ Hybridization and DNA Methylome Profiling

1
Institute of Pathology, University Hospital Salzburg, Paracelsus Medical University, Müllner Hauptstr. 48, A-5020 Salzburg, Austria
2
Department of Neurosurgery, University Hospital Salzburg, Paracelsus Medical University, Ignaz-Harrer-Str. 79, A-5020 Salzburg, Austria
*
Author to whom correspondence should be addressed.
Biomedicines 2022, 10(4), 794; https://doi.org/10.3390/biomedicines10040794
Submission received: 16 February 2022 / Revised: 24 March 2022 / Accepted: 25 March 2022 / Published: 29 March 2022
(This article belongs to the Special Issue Glioma Metabolism, Epigenetics, and Microenvironment)

Abstract

:
Gliomas are the most common intrinsic brain tumors in adults, and in accordance with their clinical behavior and patients’ outcome, they are graded by the World Health Organization (WHO) classification of brain tumors. One very interesting candidate for targeted tumor therapy may be epidermal growth factor receptor (EGFR) amplification. Here, we performed an integrated comparative analysis of EGFR amplification in 34 glioma samples using standard fluorescence in situ hybridization (FISH) and Illumina EPIC Infinium Methylation Bead Chip and correlated results with molecular glioma hallmarks. We found that the EPIC analysis showed the same power of detecting EGFR amplification compared with FISH. EGFR amplification was detectable in high-grade gliomas (25%). Moreover, EGFR amplification was found to be present solely in IDH wildtype gliomas (26%) and TERT mutated gliomas (27%), occurring independently of MGMT promoter methylation status and being mutually exclusive with 1p/19q codeletion (LOH). In summary, EPIC Bead Chip analysis is a reliable tool for detecting EGFR amplification and is comparable with the standard method FISH. EGFR amplification is a phenomenon of IDH wildtype TERT mutated high-grade gliomas.

1. Introduction

Gliomas are the most frequent intrinsic brain tumor of adults. According to the guidelines of the World Health Organization (WHO) classification of central nervous system (CNS) tumors, gliomas are assigned to CNS WHO Grades 1 to 4 depending on the clinical behavior and patients’ outcome [1,2]. Whilst CNS WHO Grade 1 pilocytic astrocytomas show a relatively benign course and 10-year survival of approximately 95% [3], CNS WHO Grade 4 glioblastoma show a devastating outcome with a 5-year survival rate of only 4–5% [1,4].
Since the publication of the 2021 WHO classification of tumors of the CNS, an integrated diagnosis and a layered report combining morphology and genetic findings were suggested as an integrated part of glioma classification [1]. Thus, the analysis of genomic alterations such as the isocitrate dehydrogenase 1 and 2 (IDH1, IDH2) and the histone H3 family 3A (H3F3A), HIST1H3B, and HIST1H3C genes as well as analysis of 1p and 19q status are now integrated aspects of glioma classification. Furthermore, the analysis of O(6)-methylguanine-DNA methyltransferase (MGMT) promoter methylation, mutation analysis of the telomerase reverse transcriptase (TERT) promoter, and CDKN2A/B testing are essential for evaluation of glioma [1]. Despite intensive research, survival of glioma patients often remains limited, and curative therapy is still lacking for the most common tumor entities (i.e., high-grade astrocytomas) [5,6,7,8,9,10].
A molecular target for individualized patient care is epidermal growth factor receptor (EGFR) amplification [11]. EGFR, also termed ErbB1 and HER1, is a receptor tyrosine kinase and is part of the ErbB receptor family [12], playing an important role in cell proliferation, differentiation, and motility [12,13]. EGFR binds the epidermal growth factor (EGF) and other growth factors such as growth factor-α (TGF-α), heparin-binding EGF (HB-EGF), and amphiregulin. Ligand binding activates the receptor couples to downstream signaling pathways controlling cell proliferation, growth, differentiation, migration, and inhibition of apoptosis [14,15]. Pathogenic EGFR mutations and truncations result in ligand-independent signaling, subsequently leading to upregulation of various pro-oncogenic processes, including chronic cell cycle proliferation [15]. EGFR gene amplification directly correlated with protein overexpression and activated signaling [16].
Epigenomic DNA-methylation profiling is an emerging approach in tumor classification [1,17,18]. DNA-methylation acts as control of gene transcription enabling on/off switching of transcription by demethylation/methylation of CpG dinucleotide sequences in the gene promoter [17,18]. The Illumina Infinium EPIC (850 k) Bead Chip is an advanced tool for profiling approximately 850,000 CpGs in parallel throughout the human genome with a highly streamlined protocol [17,18]. This information is subsequently analyzed in bioinformatical pipelines enabling the deduction of copy number variation profiles and similarity calculations, e.g., random forest trees and principal component analysis [17,18,19,20].
Here, we analyzed 34 glioma specimens of WHO Grades I to IV with regard to EGFR amplification status using fluorescence in situ hybridization (FISH) and Illumina Infinium EPIC Bead Chip Arrays. Furthermore, we performed an integrated analysis of EGFR amplification in the context of other established molecular hallmarks.

2. Materials and Methods

2.1. Tissue Collection

In this study, we analyzed 34 anonymized tissue samples, entailing 2 pilocytic astrocytomas CNS WHO Grade 1, 2 oligodendrogliomas CNS WHO Grade 2, 2 astrocytomas CNS WHO Grade 2, 3 astrocytomas CNS WHO Grade 4, and 23 glioblastomas CNS WHO Grade 4, and 2 diffuse midline gliomas H3 K27 altered WHO Grade 4.
The gliomas were assigned to CNS WHO Grades 1 to 4, and integrated molecular profiling was performed according to the 2021 WHO classification of CNS tumors [1]. All tumor samples were provided by the University Institute of Pathology of the University Hospital Salzburg. The samples used in this study were formalin-fixed and paraffin embedded (FFPE). Prior to study inclusion, samples were anonymized according to the ethics guidelines. Details about glioma samples are listed in Table 1.
Routine immunohistochemical (IHC) analysis was performed on a Ventana BenchMark Ultra device (Roche) using Ventana ready-to-use antibodies against GFAP (760-4345), Ki67 (790-4286), PHH3 (760-4591), and EGFR (3C6) according to the manufacturer’s protocols. EGFR protein expression levels were scored according to Avilés-Salas et al. within a scale of 0 to 3 [21].

2.2. Molecular Genetic Characterization of Gliomas

Molecular genetic analysis of glioma samples was performed as previously described [22]. Representative tumor tissues with at least 90% of viable tumor cells were microscopically identified. DNA extraction was conducted applying the Maxwell system (Promega) according to the manufacturer’s instructions. Mutational analysis of IDH1 and IDH2 genes were performed with the AmpliSeq for Illumina Cancer Hotspot Panel v2 (Illumina) or the AmpliSeq for Illumina Focus Panel (Illumina), respectively, on an Illumina MiniSeq next-generation sequencing device following the manufacturer’s protocols. Identification of mutations within the hot spot loci of TERT promoter, H3F3A, HIST1H3B, and HIST1H3C genes were analyzed by Sanger sequencing as described previously [22,23,24]. Homozygous losses of cyclin-dependent kinase inhibitor 2A/B (CDKN2A/B) were assessed by EPIC copy number variation (CNV) analysis according to Capper et al. [18] and in concordance with the guidelines of the 2021 WHO classification [1].
ZytoLight 1p/1q and 19q/19p probe sets (ZytoVision) were applied according to the manufacturer’s protocols to evaluate the 1p/19q codeletion status of IDH mutant gliomas. Deletions of 1p and 19q were double-checked applying EPIC CNV profiles to avoid false positive results that may be due to partial 1p and 19q losses. According to the guidelines of the 2021 WHO classification, 1p/19q status was assessed for all IDH mutated gliomas, as loss of 1p and 19q is only occurring in IDH mutant gliomas [1].

2.3. Fluorescence In Situ Hybridization (FISH) Analysis

To evaluate the EGFR amplification status, we applied the ZytoLight SPEC EGFR/CEN 7 Dual Color Probe set (ZytoVision). Slides were reviewed using fluorescence microscopy, and FISH signals for individual probes were recorded. To assess EGFR amplification, we calculated the ratio of green (EGFR) and red (CEN7) signals. In accordance with French et al., we set the cut-off value for amplification to equal or greater than 2 [25]. Tumors with polysomy for chromosome 7 but without focal amplification of the EGFR gene were considered to be EGFR non-amplified.

2.4. Infinium Methylation EPIC Array Analysis

Methylation analysis of glioma samples was performed using the Infinium Methylation EPIC Bead Chip (Illumina) according to manufacturer’s protocol. Raw data (idat-files) were analyzed using the molecularneuropathology.org bioinformatics pipeline of the German Cancer Research Center (DKFZ) and the current brain tumor classifier [17]. Copy-number variation (CNV) analysis is an integrated part of the molecularneuropatholgy.org bioinformatics pipeline. EGFR amplifications were assessed using the generated CNV plots and ImageJ. EGFR status was interpreted in accordance to Stichel et al. as being considered amplified if the respective probes showed an intensity of more than 0.6 on the log2-scale from the CNV after baseline correction (relative probe intensity) [26].

2.5. Computational Data Analysis

Statistical analysis was performed using Prism 9 (GraphPad) software suite and Microsoft Excel applying Student’s t-test. Statistical significance was assumed for p-values < 0.05. Regression analysis was performed using Prism 9 and Microsoft Excel.

3. Results

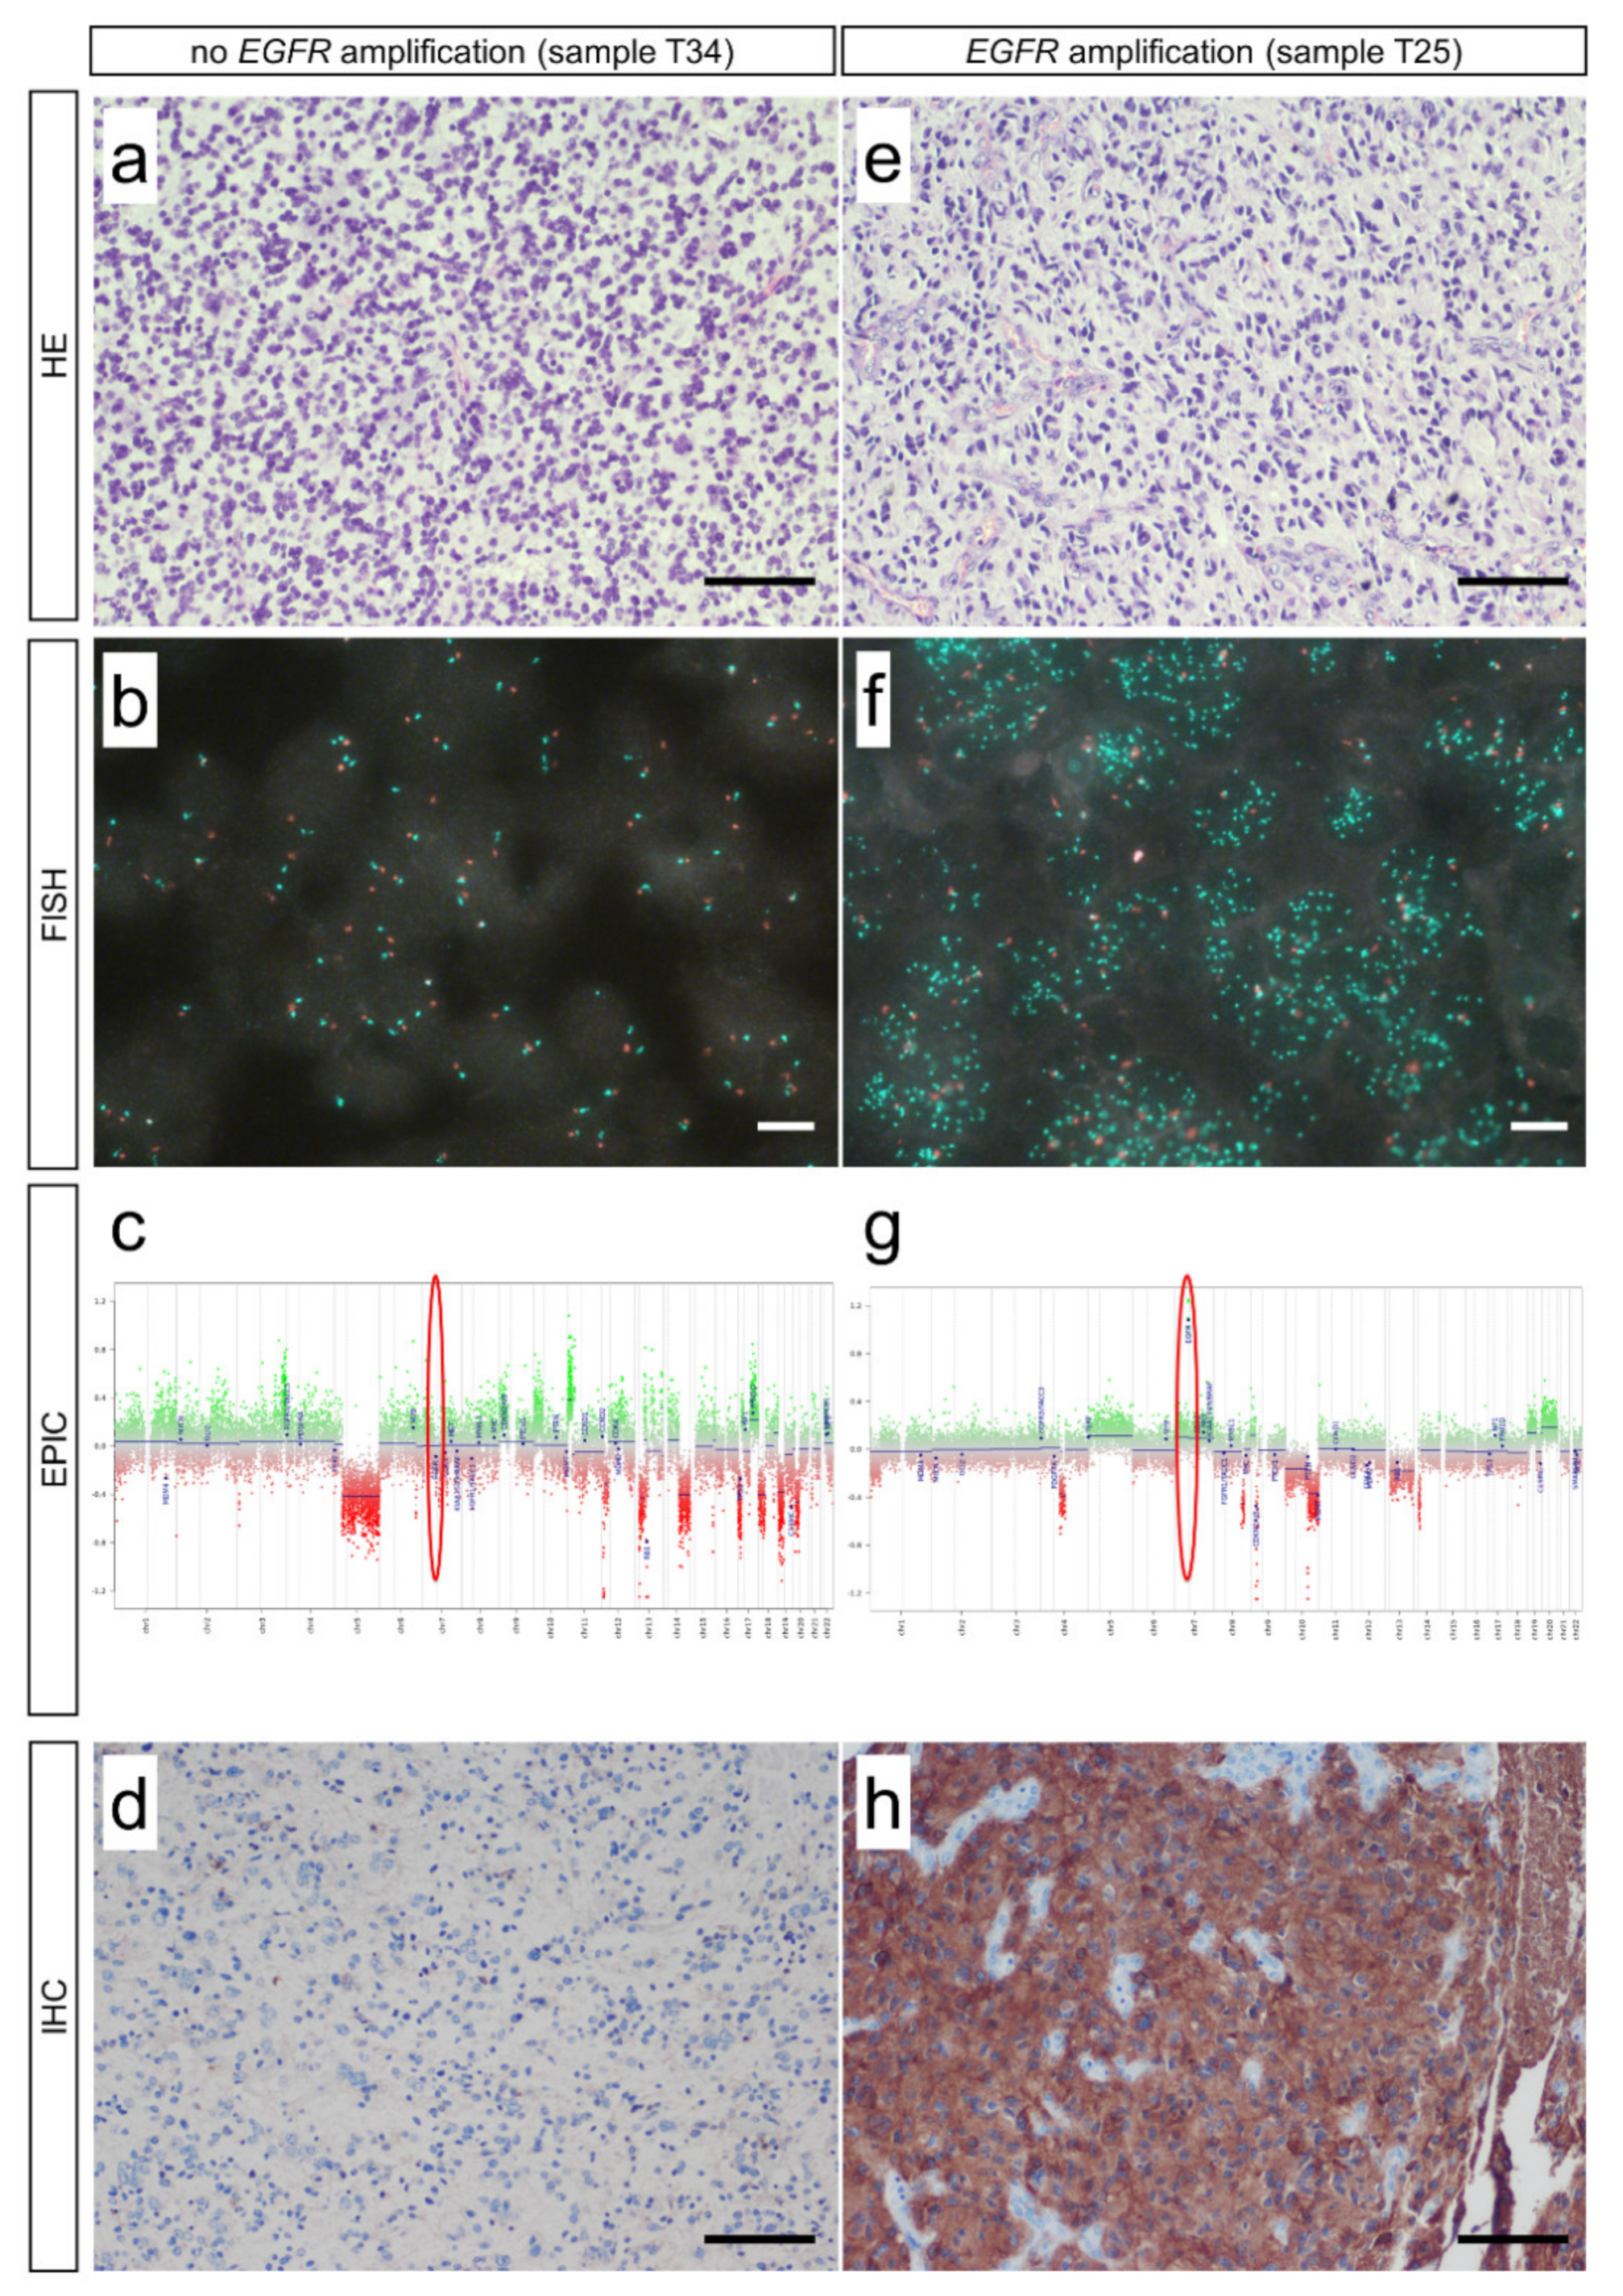
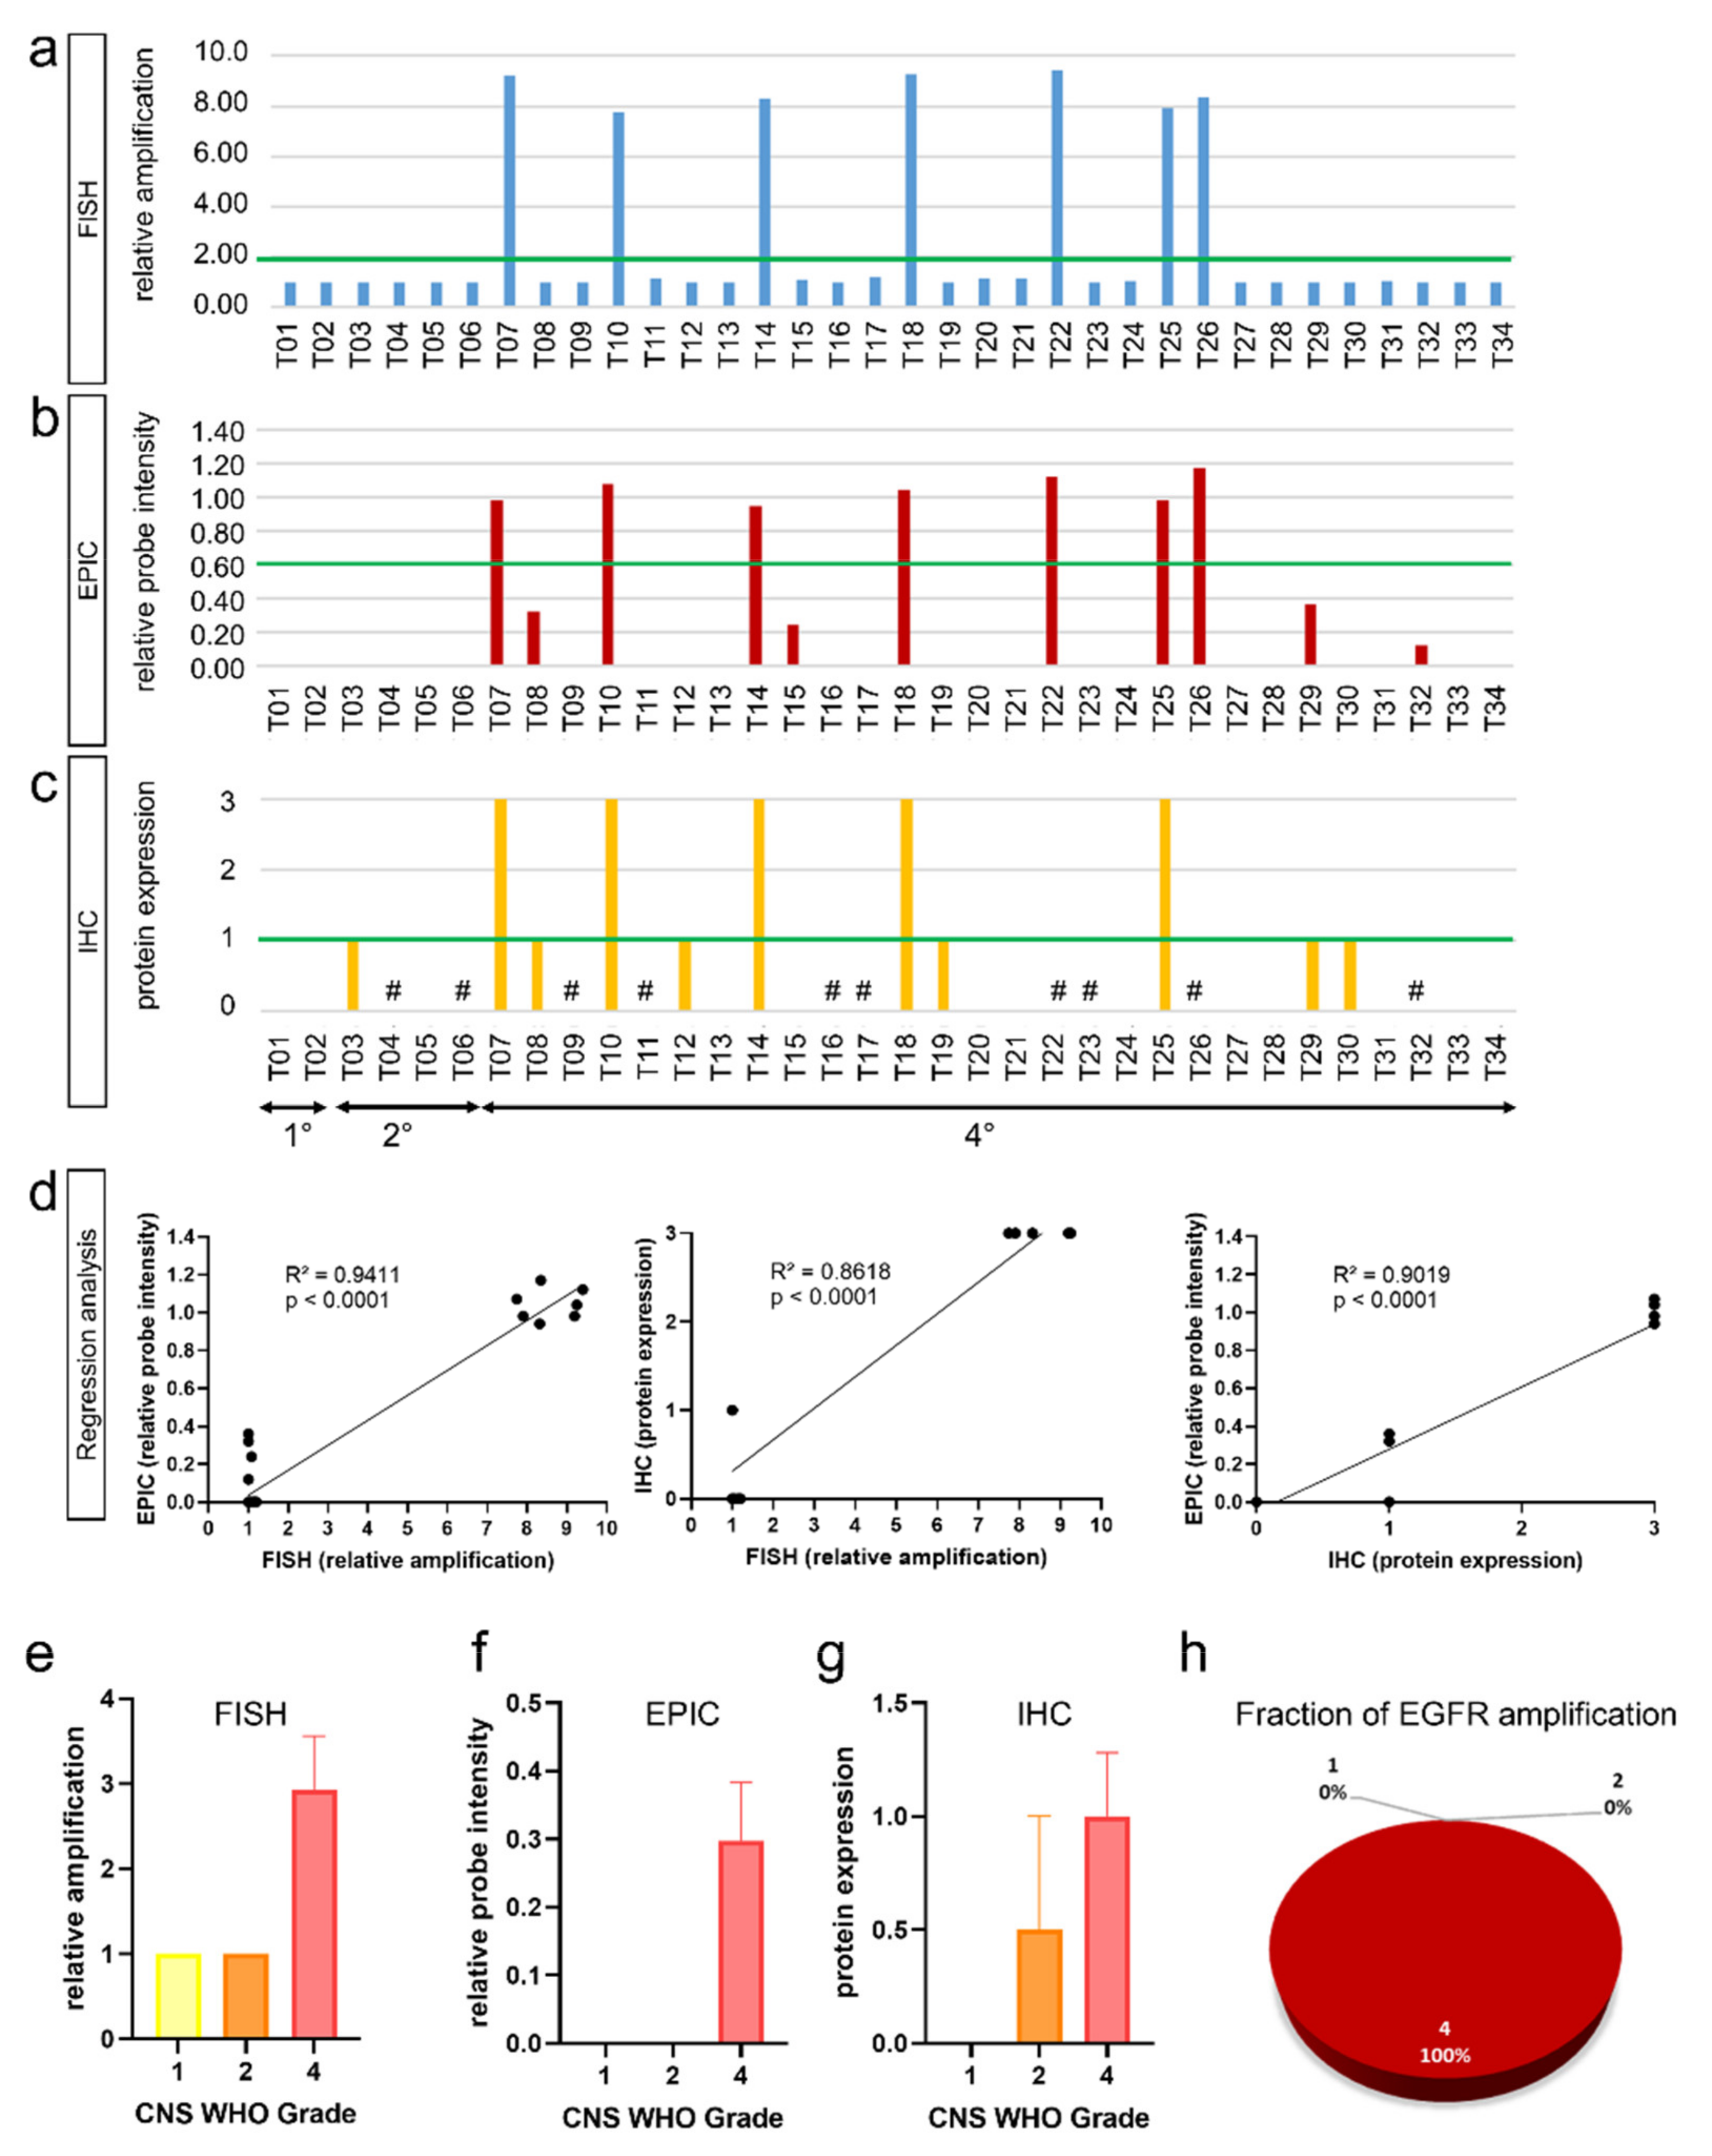
3.1. Fluorescence In Situ Hybridization (FISH) and Infinium EPIC Methylation Bead Chip Analysis Are Equally Valid Methods in Detection of EGFR Amplifications

In this study, we investigated the validity of EGFR detection using conventional FISH analysis and epigenome-wide methylation analysis using the Illumina EPIC Methylation Bead Chip with integrated CNV profiling. DNA methylome analysis by EPIC arrays is a reliable approach in molecular glioma classification [17]. Thus, we performed both FISH and EPIC analysis on all 34 histologically well-characterized gliomas. We found that both FISH and EPIC analysis enabled discrimination of EGFR non-amplification and amplification status and that the results are consistent with EGFR protein levels assessed by immunohistochemistry (Figure 1a–h). Using FISH, we detected seven gliomas with EGFR amplification (Figure 2a). This is in perfect concordance with EPIC analysis that revealed the same seven gliomas being EGFR amplified (Figure 2b). Results also correlate with protein expression detected by immunohistochemistry (Figure 2c). Cut-off values were defined as suggested by French et al. (FISH) [25] and Stichel et al. (EPIC) [26]. Protein expression was scored according to Avilés-Salas et al. [21]. Regression analysis showed perfect match of FISH and EPIC analysis (R2 = 0.9411, p < 0.0001) as well as of FISH and IHC (R2 = 0.8618, p < 0.0001) and EPIC and IHC (R2 = 0.9019, p < 0.0001) (Figure 2d).

3.2. EGFR Amplifications Predominantly Occur in High-Grade Glioma

Detailed analysis showed that EGFR amplification is unevenly distributed across gliomas. Of all 34 gliomas, we found 7 gliomas (21%) with EGFR amplification: While we did not find EGFR amplification in low-grade gliomas (0%)—i.e., CNS WHO Grade 1 (0%) and CNS WHO Grade 2 (0%)—25% of high-grade astrocytomas and glioblastomas CNS WHO Grade 4 gliomas showed EGFR amplification (Figure 2a–c). Mean EGFR gene amplification was 3 in CNS WHO Grade 4 gliomas using FISH (Figure 2e). These results are in concordance with EPIC analysis: We did not find EGFR amplification in WHO Grade 1 and 2 gliomas but found mean EGFR relative probe intensities of 0.3 in CNS WHO Grade 4 gliomas (Figure 2f). Immunohistochemistry showed mean EGFR protein expression of 1 in CNS WHO Grade 4 gliomas (Figure 2g). All identified gliomas with EGFR amplification were of CNS WHO Grade 4 (seven cases) (Figure 2h).

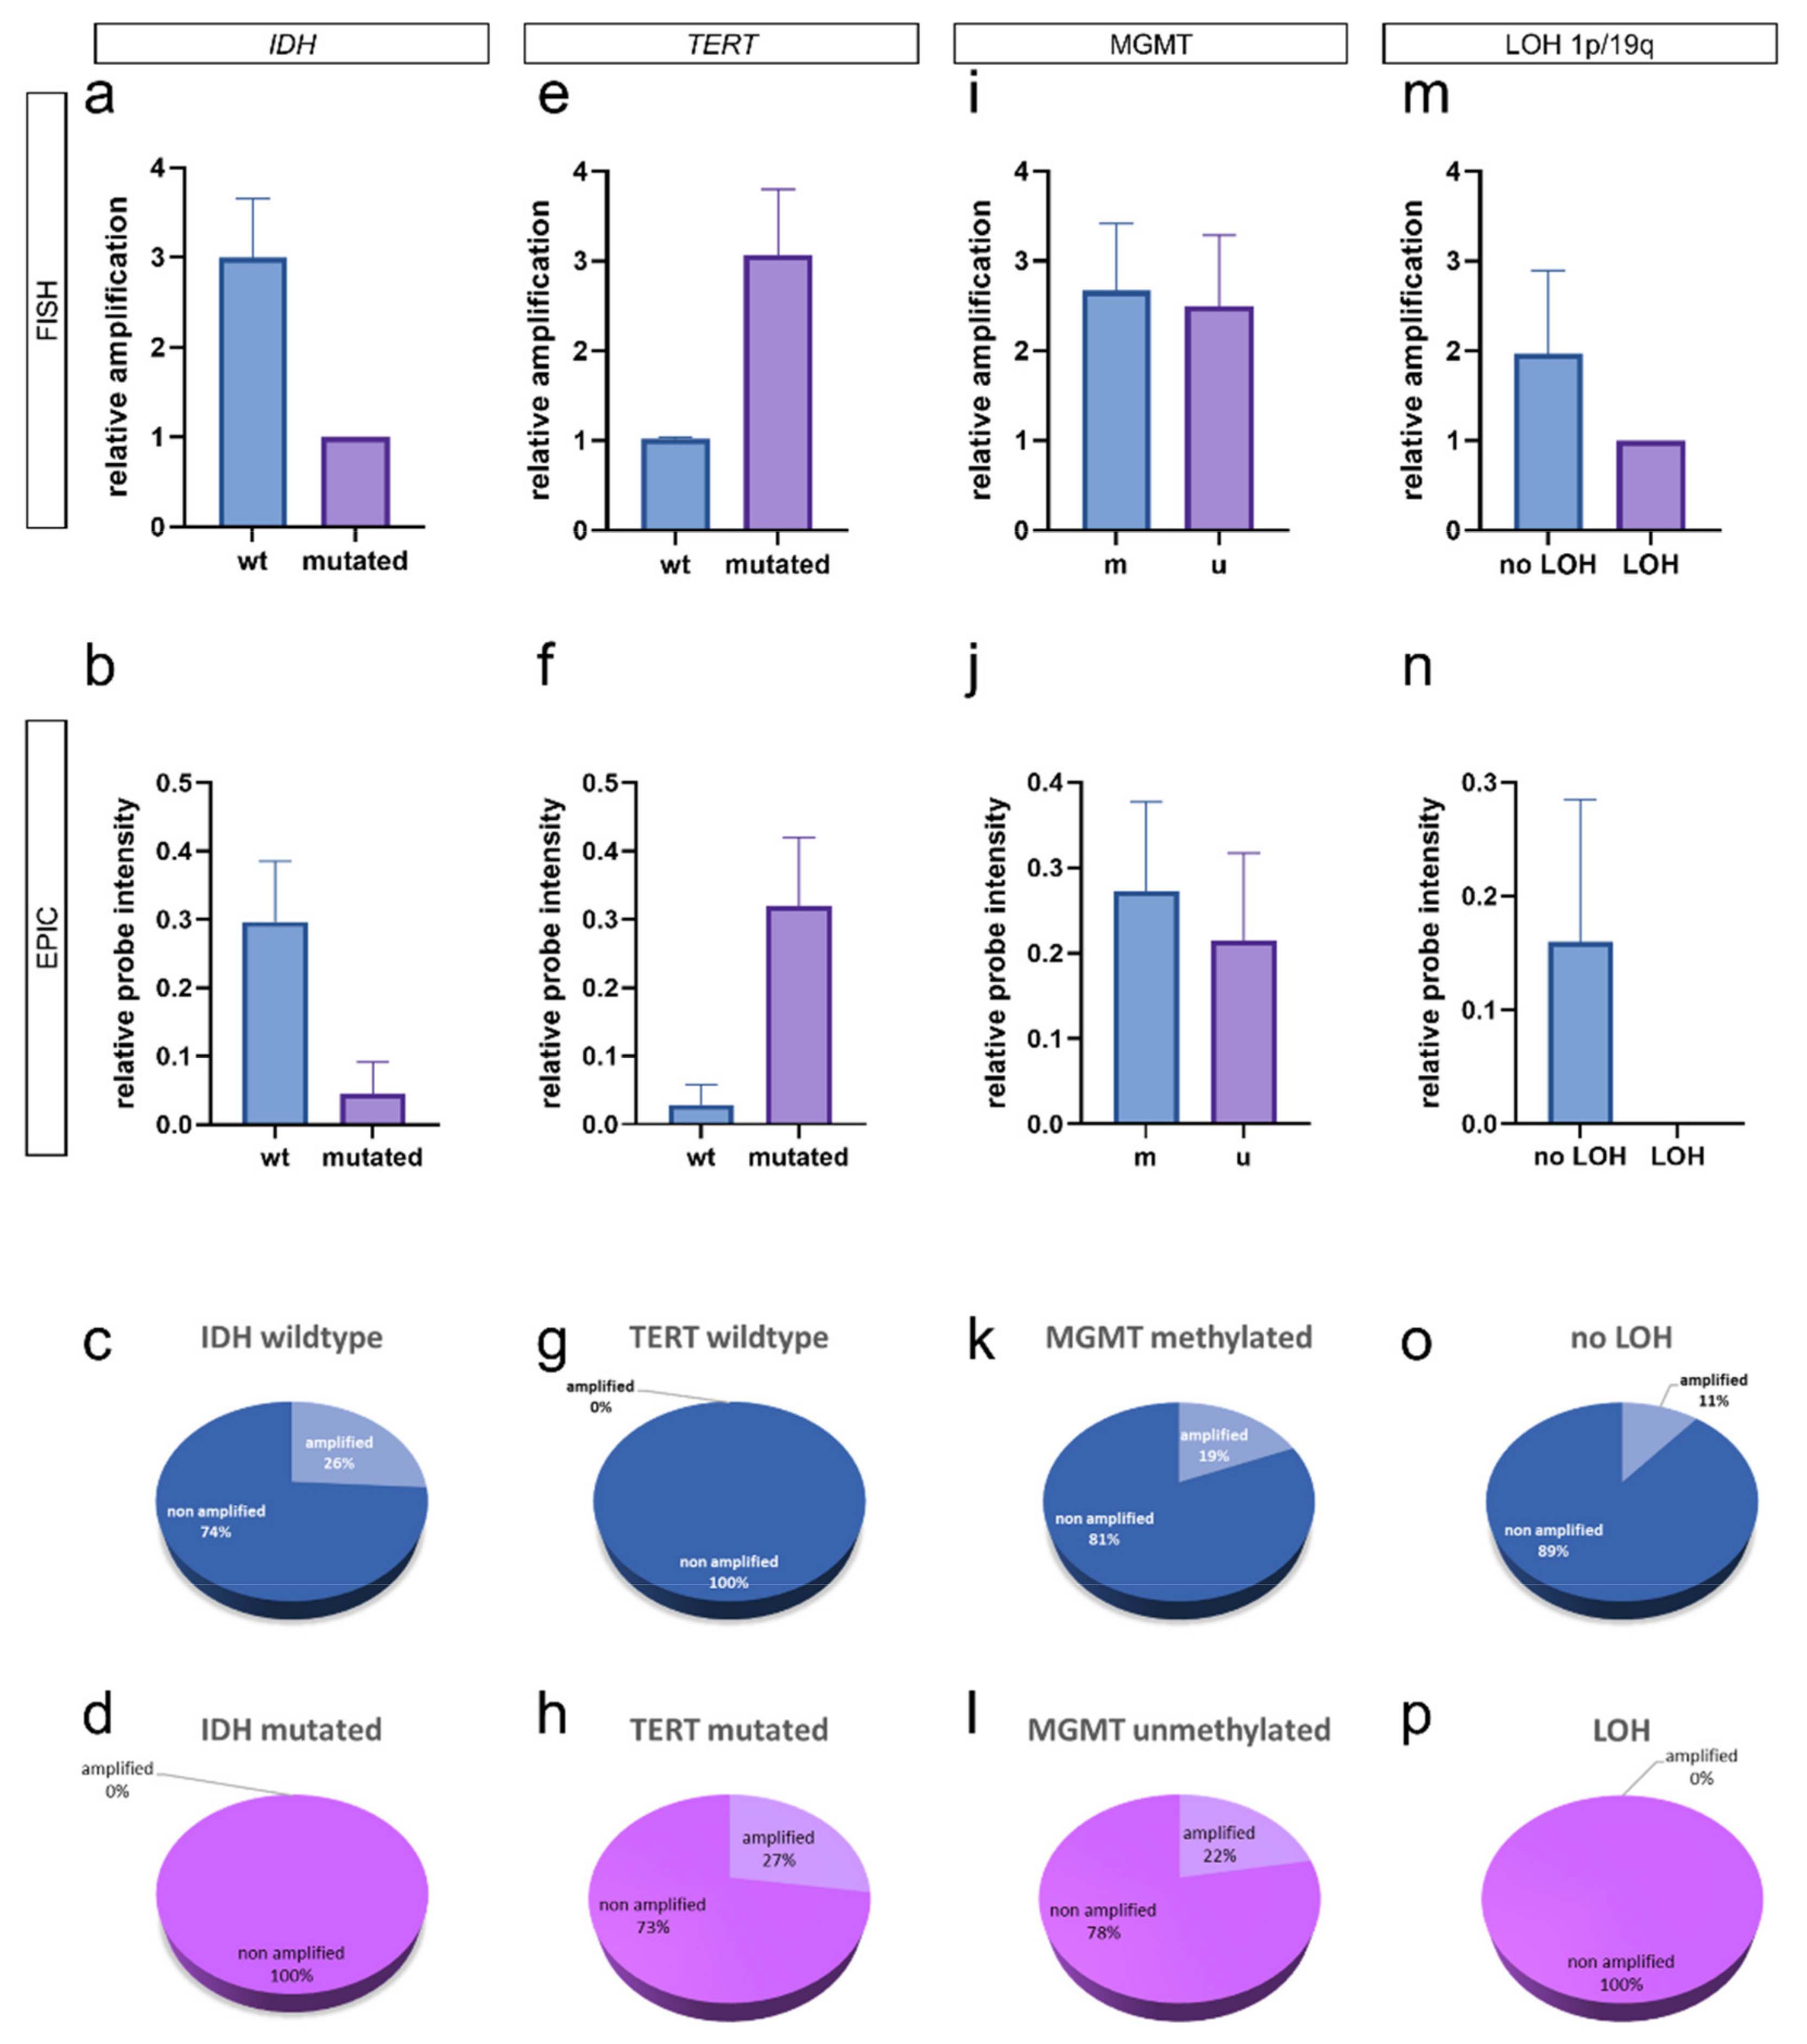
3.3. Integrated Analysis of EGFR Amplification and Molecular Glioma Hallmarks

Next, we performed an integrated analysis of EGFR amplification and molecular glioma hallmarks: IDH1/2 mutations, TERT promoter mutations, MGMT promoter methylation, and LOH 1p/19q.
An analysis of EGFR amplification and IDH mutation status revealed that IDH mutated glioma showed fewer copies of EGFR using FISH (Figure 3a) and EPIC (Figure 3b) without this being statistically significant (p > 0.05, Student’s t-test). Of all analyzed IDH wildtype gliomas, 26% showed EGFR amplification (Figure 3c), and among IDH mutated gliomas, none showed an EGFR amplification (Figure 3d).
Analysis of TERT promoter mutation status and EGFR amplification showed that TERT mutated glioma show increased copies of EGFR using FISH (Figure 3e) and EPIC (Figure 3f) without statistical significance (p > 0.05, Student’s t-test). Of all analyzed TERT wildtype gliomas, none show an EGFR amplification (Figure 3g). Of all TERT mutated gliomas, 27% showed EGFR amplifications (Figure 3h).
An analysis of EGFR amplification and MGMT promoter methylation revealed that there is no association between EGFR copy numbers and MGMT methylation status using FISH (Figure 3i) and EPIC (Figure 3j) (p > 0.05, Student’s t-test). Of all analyzed MGMT methylated gliomas, 19% showed EGFR amplification (Figure 3k), and 22% of MGMT unmethylated gliomas showed an EGFR amplification (Figure 3l).
Analysis of LOH 1p/19q status and EGFR amplification showed increased copies of EGFR in gliomas without LOH 1p/19q using FISH (Figure 3m) and EPIC (Figure 3n) without being statistically significant (p > 0.05, Student’s t-test). Of all gliomas without LOH 1p/19q, 11% showed EGFR amplification (Figure 3o). Of all gliomas with LOH 1p/19q, none showed an EGFR amplification (Figure 3p).

4. Discussion

Glioblastomas are the most frequent and most aggressive brain tumors in adults, with a 5-year overall relative survival of only 6.8% [1,27]. One hallmark in glioblastoma therapy was the identification of MGMT promoter methylation that is associated with good therapy response using the alkylating agent temozolomide [8,28,29] and with better outcome [7].
A promising target in glioblastoma therapy may be EGFR overexpression. EGFR inhibition by monoclonal antibodies or small-molecule tyrosine kinase inhibitors (TKIs) has been approved for the treatment of tumor entities such as RAS wildtype colorectal cancers, squamous cell carcinoma of the head and neck (HNSCC), and EGFR mutated non-small-cell lung cancer (NSCLC) [11].
Here, we assessed EGFR gene amplification using FISH and Infinium Methylation EPIC Bead Chip analysis—a technique that is routinely used for molecular brain tumor classifications [17]. We were able to demonstrate, that both FISH and EPIC Bead Chip analysis are equally valid in identifying EGFR amplifications: Regression analysis of FISH and EPIC Array revealed very high concordance of both methods for the analysis of EGFR amplification (Figure 2d).
Detailed workup showed that EGFR amplification is a phenomenon of high-grade CNS WHO Grade 4 gliomas (Figure 2e–g). Integrated analysis of molecular key hallmarks in glioma (IDH, TERT, MGMT methylation, and LOH 1p/19q) and EGFR amplification showed that EGFR amplification is a phenomenon that can be predominantly found in IDH wildtype (Figure 3a–d) and TERT mutated (Figure 3e–h) gliomas, as well in gliomas without LOH 1p/19q (Figure 3m–p).
Since the importance of EGFR amplification has already been established as a precision medicine target in other cancers, such as colorectal cancers, HNSCC, and NSCLC [11], our findings may also open new therapeutic approaches in future brain tumor therapy [30,31]. Thereby, our results are well in line with published data: Bale et al. found that IDH wildtype gliomas have a higher prevalence of EGFR gene amplification and overexpression than IDH mutated gliomas [32]. In terms of EGFR amplification and TERT promoter mutation, our findings confirm published results: Jaunmuktane et al. found that 82.88% of IDH and TERT wildtype gliomas were EGFR non-amplified, while only 17.12% were EGFR amplified. Of IDH wildtype and TERT mutant gliomas, 58.13% were EGFR non-amplified and 41.87% were EGFR amplified [33]. In terms of MGMT promoter methylation, Bale et al. found that EGFR amplification occurred independently of MGMT promoter methylation status [32]. Our data also support the finding that EGFR amplification occurs independently of MGMT promoter methylation. Furthermore, Bale et al. stated that EGFR amplification was mutually exclusive of codeletion of chromosomes 1p and 19q (LOH) [32]. Our data also support the finding that EGFR amplification is mutually exclusive of codeletions of 1p and 19q.
The detection of combined loss of 1p and 19q in IDH mutated astrocytoma is an essential aspect in integrated diagnosis according to the 2021 WHO classification [1]. Thereby, it is important to detect whole arm losses of 1p and 19q [1]. Since FISH probes cover only distinct genomic regions, the use of FISH as the only method is a limitation that may lead to false-positive results [1]. Thus, we additionally double-checked 1p/19q losses detected by FISH in CNV profiles of the EPIC results.
In summary, our findings demonstrate that Infinium EPIC Bead Chip analysis that is routinely applied in molecular brain tumor classification [17] is a reliable technique for detecting EGFR amplifications compared with standard FISH analysis. We found that EGFR amplification is a phenomenon that predominantly occurs in high-grade glioma.

5. Conclusions

In conclusion, we demonstrated that EPIC Bead Chip analysis is a reliable tool in detecting EGFR amplification that is comparable with the standard FISH method. We found that EGFR amplification is a phenomenon of IDH wildtype TERT mutated high-grade gliomas.

Author Contributions

Conceptualization, T.F.J.K., G.H. and K.S.; methodology, T.F.J.K.; software, T.F.J.K. and D.H.; validation, D.H.; formal analysis, D.H.; investigation, T.F.J.K. and D.H.; resources, K.S.; data curation, T.F.J.K., G.H. and K.S.; writing—original draft preparation, D.H. and T.F.J.K.; writing—review and editing, G.H., B.Z., B.A.-S., H.U.S., C.S., K.S. and T.F.J.K.; visualization, T.F.J.K. and D.H.; supervision, T.F.J.K. and K.S.; project administration, T.F.J.K. and K.S.; funding acquisition, not applicable. All authors have read and agreed to the published version of the manuscript.

Funding

This research received no external funding.

Institutional Review Board Statement

The study was conducted in accordance with the Declaration of Helsinki, and the study was approved by the Institutional Review Board and/or the local Ethics Committee (415-E/2509/2-2019, 24.04.2019).

Informed Consent Statement

Not applicable, all samples were anonymized prior to study inclusion.

Data Availability Statement

Not applicable.

Acknowledgments

We would like to thank the members of the histology, immunohistochemistry, and molecular pathology facilities at the Institute of Pathology, University Hospital Salzburg, for their support in conducting this study.

Conflicts of Interest

The authors declare no conflict of interest.

References

  1. Louis, D.N.; Perry, A.; Wesseling, P.; Brat, D.J.; Cree, I.A.; Figarella-Branger, D.; Hawkins, C.; Ng, H.K.; Pfister, S.M.; Reifenberger, G.; et al. The 2021 who classification of tumors of the central nervous system: A summary. Neuro-Oncology 2021, 23, 1231–1251. [Google Scholar] [CrossRef] [PubMed]
  2. Ameratunga, M.; Pavlakis, N.; Wheeler, H.; Grant, R.; Simes, J.; Khasraw, M. Anti-angiogenic therapy for high-grade glioma. Cochrane Database Syst. Rev. 2018, 11, Cd008218. [Google Scholar] [CrossRef] [PubMed]
  3. Gregory, T.A.; Chumbley, L.B.; Henson, J.W.; Theeler, B.J. Adult pilocytic astrocytoma in the molecular era: A comprehensive review. CNS Oncol. 2021, 10, CNS68. [Google Scholar] [CrossRef] [PubMed]
  4. Carlsson, S.K.; Brothers, S.P.; Wahlestedt, C. Emerging treatment strategies for glioblastoma multiforme. EMBO Mol. Med. 2014, 6, 1359–1370. [Google Scholar] [CrossRef]
  5. Aldape, K.; Brindle, K.M.; Chesler, L.; Chopra, R.; Gajjar, A.; Gilbert, M.R.; Gottardo, N.; Gutmann, D.H.; Hargrave, D.; Holland, E.C.; et al. Challenges to curing primary brain tumours. Nat. Rev. Clin. Oncol. 2019, 16, 509–520. [Google Scholar] [CrossRef] [Green Version]
  6. Hegi, M.E.; Diserens, A.C.; Godard, S.; Dietrich, P.Y.; Regli, L.; Ostermann, S.; Otten, P.; Van Melle, G.; de Tribolet, N.; Stupp, R. Clinical trial substantiates the predictive value of o-6-methylguanine-DNA methyltransferase promoter methylation in glioblastoma patients treated with temozolomide. Clin. Cancer Res. Off. J. Am. Assoc. Cancer Res. 2004, 10, 1871–1874. [Google Scholar] [CrossRef] [Green Version]
  7. Hegi, M.E.; Diserens, A.C.; Gorlia, T.; Hamou, M.F.; de Tribolet, N.; Weller, M.; Kros, J.M.; Hainfellner, J.A.; Mason, W.; Mariani, L.; et al. Mgmt gene silencing and benefit from temozolomide in glioblastoma. N. Engl. J. Med. 2005, 352, 997–1003. [Google Scholar] [CrossRef] [Green Version]
  8. Hegi, M.E.; Liu, L.; Herman, J.G.; Stupp, R.; Wick, W.; Weller, M.; Mehta, M.P.; Gilbert, M.R. Correlation of o6-methylguanine methyltransferase (mgmt) promoter methylation with clinical outcomes in glioblastoma and clinical strategies to modulate mgmt activity. J. Clin. Oncol. Off. J. Am. Soc. Clin. Oncol. 2008, 26, 4189–4199. [Google Scholar] [CrossRef] [Green Version]
  9. Hegi, M.E.; Janzer, R.C.; Lambiv, W.L.; Gorlia, T.; Kouwenhoven, M.C.; Hartmann, C.; von Deimling, A.; Martinet, D.; Besuchet Schmutz, N.; Diserens, A.C.; et al. Presence of an oligodendroglioma-like component in newly diagnosed glioblastoma identifies a pathogenetically heterogeneous subgroup and lacks prognostic value: Central pathology review of the eortc_26981/ncic_ce.3 trial. Acta Neuropathol. 2012, 123, 841–852. [Google Scholar] [CrossRef] [Green Version]
  10. Hau, P.; Stupp, R.; Hegi, M.E. Mgmt methylation status: The advent of stratified therapy in glioblastoma? Dis. Markers 2007, 23, 97–104. [Google Scholar] [CrossRef] [Green Version]
  11. Rose, M.; Maurer, A.; Wirtz, J.; Bleilevens, A.; Waldmann, T.; Wenz, M.; Eyll, M.; Geelvink, M.; Gereitzig, M.; Rüchel, N.; et al. Egfr activity addiction facilitates anti-erbb based combination treatment of squamous bladder cancer. Oncogene 2020, 39, 6856–6870. [Google Scholar] [CrossRef]
  12. Slanina, H.; Mündlein, S.; Hebling, S.; Schubert-Unkmeir, A. Role of epidermal growth factor receptor signaling in the interaction of neisseria meningitidis with endothelial cells. Infect. Immun. 2014, 82, 1243–1255. [Google Scholar] [CrossRef] [PubMed] [Green Version]
  13. Van den Bent, M.J.; Gao, Y.; Kerkhof, M.; Kros, J.M.; Gorlia, T.; van Zwieten, K.; Prince, J.; van Duinen, S.; Sillevis Smitt, P.A.; Taphoorn, M.; et al. Changes in the egfr amplification and egfrviii expression between paired primary and recurrent glioblastomas. Neuro-Oncology 2015, 17, 935–941. [Google Scholar] [CrossRef] [PubMed] [Green Version]
  14. Zeng, F.; Harris, R.C. Epidermal growth factor, from gene organization to bedside. Semin. Cell Dev. Biol. 2014, 28, 2–11. [Google Scholar] [CrossRef] [PubMed] [Green Version]
  15. Wee, P.; Wang, Z. Epidermal growth factor receptor cell proliferation signaling pathways. Cancers 2017, 9, 52. [Google Scholar] [CrossRef] [Green Version]
  16. Schaff, L.R.; Yan, D.; Thyparambil, S.; Tian, Y.; Cecchi, F.; Rosenblum, M.; Reiner, A.S.; Panageas, K.S.; Hembrough, T.; Lin, A.L. Characterization of mgmt and egfr protein expression in glioblastoma and association with survival. J. Neuro-Oncol. 2020, 146, 163–170. [Google Scholar] [CrossRef]
  17. Capper, D.; Jones, D.T.W.; Sill, M.; Hovestadt, V.; Schrimpf, D.; Sturm, D.; Koelsche, C.; Sahm, F.; Chavez, L.; Reuss, D.E.; et al. DNA methylation-based classification of central nervous system tumours. Nature 2018, 555, 469–474. [Google Scholar] [CrossRef]
  18. Capper, D.; Stichel, D.; Sahm, F.; Jones, D.T.W.; Schrimpf, D.; Sill, M.; Schmid, S.; Hovestadt, V.; Reuss, D.E.; Koelsche, C.; et al. Practical implementation of DNA methylation and copy-number-based cns tumor diagnostics: The heidelberg experience. Acta Neuropathol. 2018, 136, 181–210. [Google Scholar] [CrossRef] [Green Version]
  19. Assenov, Y.; Muller, F.; Lutsik, P.; Walter, J.; Lengauer, T.; Bock, C. Comprehensive analysis of DNA methylation data with rnbeads. Nat. Methods 2014, 11, 1138–1140. [Google Scholar] [CrossRef] [Green Version]
  20. Muller, F.; Scherer, M.; Assenov, Y.; Lutsik, P.; Walter, J.; Lengauer, T.; Bock, C. Rnbeads 2.0: Comprehensive analysis of DNA methylation data. Genome Biol. 2019, 20, 55. [Google Scholar] [CrossRef] [Green Version]
  21. Aviles-Salas, A.; Muniz-Hernandez, S.; Maldonado-Martinez, H.A.; Chanona-Vilchis, J.G.; Ramirez-Tirado, L.A.; HernaNdez-Pedro, N.; Dorantes-Heredia, R.; Rui, Z.M.J.M.; Motola-Kuba, D.; Arrieta, O. Reproducibility of the egfr immunohistochemistry scores for tumor samples from patients with advanced non-small cell lung cancer. Oncol. Lett. 2017, 13, 912–920. [Google Scholar] [CrossRef] [PubMed] [Green Version]
  22. Kraus, T.F.J.; Machegger, L.; Poppe, J.; Zellinger, B.; Dovjak, E.; Schlicker, H.U.; Schwartz, C.; Ladisich, B.; Spendel, M.; Kral, M.; et al. Diffuse midline glioma of the cervical spinal cord with h3 k27m genotype phenotypically mimicking anaplastic ganglioglioma: A case report and review of the literature. Brain Tumor Pathol. 2020, 37, 89–94. [Google Scholar] [CrossRef] [PubMed]
  23. Holzl, D.; Hutarew, G.; Zellinger, B.; Schlicker, H.U.; Schwartz, C.; Winkler, P.A.; Sotlar, K.; Kraus, T.F.J. Integrated analysis of programmed cell death ligand 1 expression reveals increased levels in high-grade glioma. J. Cancer Res. Clin. Oncol. 2021, 147, 2271–2280. [Google Scholar] [CrossRef] [PubMed]
  24. Kraus, T.F.J.; Schwartz, C.; Machegger, L.; Zellinger, B.; Holzl, D.; Schlicker, H.U.; Poppe, J.; Ladisich, B.; Spendel, M.; Kral, M.; et al. A patient with two gliomas with independent oligodendroglioma and glioblastoma biology proved by DNA-methylation profiling: A case report and review of the literature. Brain Tumor Pathol. 2022. [Google Scholar] [CrossRef]
  25. French, P.J.; Eoli, M.; Sepulveda, J.M.; de Heer, I.; Kros, J.M.; Walenkamp, A.; Frenel, J.S.; Franceschi, E.; Clement, P.M.; Weller, M.; et al. Defining egfr amplification status for clinical trial inclusion. Neuro-Oncology 2019, 21, 1263–1272. [Google Scholar] [CrossRef] [Green Version]
  26. Stichel, D.; Ebrahimi, A.; Reuss, D.; Schrimpf, D.; Ono, T.; Shirahata, M.; Reifenberger, G.; Weller, M.; Hänggi, D.; Wick, W.; et al. Distribution of egfr amplification, combined chromosome 7 gain and chromosome 10 loss, and tert promoter mutation in brain tumors and their potential for the reclassification of idhwt astrocytoma to glioblastoma. Acta Neuropathol. 2018, 136, 793–803. [Google Scholar] [CrossRef] [Green Version]
  27. Wen, P.Y.; Weller, M.; Lee, E.Q.; Alexander, B.M.; Barnholtz-Sloan, J.S.; Barthel, F.P.; Batchelor, T.T.; Bindra, R.S.; Chang, S.M.; Chiocca, E.A.; et al. Glioblastoma in adults: A society for neuro-oncology (sno) and european society of neuro-oncology (eano) consensus review on current management and future directions. Neuro-Oncology 2020, 22, 1073–1113. [Google Scholar] [CrossRef]
  28. Hegi, M.E.; Sciuscio, D.; Murat, A.; Levivier, M.; Stupp, R. Epigenetic deregulation of DNA repair and its potential for therapy. Clin. Cancer Res. Off. J. Am. Assoc. Cancer Res. 2009, 15, 5026–5031. [Google Scholar] [CrossRef] [Green Version]
  29. Kaina, B.; Christmann, M.; Naumann, S.; Roos, W.P. Mgmt: Key node in the battle against genotoxicity, carcinogenicity and apoptosis induced by alkylating agents. DNA Repair 2007, 6, 1079–1099. [Google Scholar] [CrossRef]
  30. Aquilanti, E.; Miller, J.; Santagata, S.; Cahill, D.P.; Brastianos, P.K. Updates in prognostic markers for gliomas. Neuro-Oncology 2018, 20, vii17–vii26. [Google Scholar] [CrossRef] [Green Version]
  31. De Witt Hamer, P.C. Small molecule kinase inhibitors in glioblastoma: A systematic review of clinical studies. Neuro-Oncology 2010, 12, 304–316. [Google Scholar] [CrossRef] [PubMed]
  32. Bale, T.A.; Jordan, J.T.; Rapalino, O.; Ramamurthy, N.; Jessop, N.; DeWitt, J.C.; Nardi, V.; Alvarez, M.M.; Frosch, M.; Batchelor, T.T.; et al. Financially effective test algorithm to identify an aggressive, egfr-amplified variant of idh-wildtype, lower-grade diffuse glioma. Neuro-Oncology 2019, 21, 596–605. [Google Scholar] [CrossRef] [PubMed]
  33. Jaunmuktane, Z.; Capper, D.; Jones, D.T.W.; Schrimpf, D.; Sill, M.; Dutt, M.; Suraweera, N.; Pfister, S.M.; von Deimling, A.; Brandner, S. Methylation array profiling of adult brain tumours: Diagnostic outcomes in a large, single centre. Acta Neuropathol. Commun. 2019, 7, 24. [Google Scholar] [CrossRef] [PubMed] [Green Version]
Figure 1. Detection of EGFR copy numbers in gliomas. Analysis of 34 glioma samples showed that it is possible to distinguish between EGFR non-amplification (e.g., sample T34) (ad) and EGFR amplification (e.g., sample T25) (eh) using FISH (b,f) and EPIC analysis (c,g). These findings also correlate with protein expression levels using IHC (d,h). HE: Hematoxylin–Eosin; FISH: fluorescence in situ hybridization; EPIC: Illumina Infinium EPIC Bead Chip; IHC: immunohistochemistry. Scale bars: 50 µm (a,d,e,h), 10 µm (b,f).
Biomedicines 10 00794 g001
Figure 2. Comparison of two different methodologies for EGFR amplification detection. Using both FISH (a) and EPIC analysis (b), we found seven samples with EGFR amplification. Cut-off values for EGFR amplification are indicated by a green line and were set according to French et al. to equal or greater than 2 for FISH [25] and according to Stichel et al. to a relative probe intensity of more than 0.6 for EPIC analysis [26]. The results are well in line with protein expression levels detected by immunohistochemistry (c) scored according to Avilés-Salas et al. [21]. Regression analysis showed good correlation of EGFR amplification using FISH and EPIC analysis as well as FISH and IHC and EPIC and IHC (d). Analysis of WHO Grade and EGFR status showed that EGFR amplification is a hallmark of high-grade CNS WHO Grade 4 gliomas using both FISH (e) and EPIC analysis (f) as well as IHC (g). All gliomas with EGFR amplification were of CNS WHO Grade 4 (h). #: not performed due to tissue limitation.
Biomedicines 10 00794 g002
Figure 3. Integrated analysis of EGFR amplification and molecular genetic hallmarks of glioma. Correlation of EGFR amplification and IDH status showed EGFR amplification in IDH wildtype gliomas using both FISH (a) and EPIC analysis (b) (p > 0.05, Student’s t-test), with 26% of IDH wildtype gliomas being EGFR amplified (c) and no EGFR amplified case in IDH mutated gliomas (d). In the case of TERT mutation status, we found that EGFR amplification occurs in TERT mutated cases using FISH (e) and EPIC analysis (f) (p > 0.05, Student’s t-test), with no EGFR amplified case in TERT wildtype gliomas (g) and 27% of EGFR amplified cases in TERT mutated gliomas (h). Analysis of EGFR amplification and MGMT methylation status showed no differences in EGFR amplification in MGMT methylated and unmethylated gliomas using FISH (i) and EPIC analysis (j) (p > 0.05, Student’s t-test), 19% of MGMT methylated cases (k), and 22% of MGMT unmethylated cases showing EGFR amplification (l). In terms of LOH 1p/19q EGFR amplification was found in gliomas without LOH 1p/19q using FISH (m) and EPIC analysis (n) (p > 0.05, Student’s t-test), with 11% of cases without LOH 1p/19q (o) and no case with LOH 1p/19q being EGFR amplified (p). wt: wildtype; m: methylated; u: unmethylated; LOH: loss of heterozygosity.
Biomedicines 10 00794 g003
Table 1. Details on glioma samples. Indicated are details on analyzed samples including age, sex, EGFR analysis, and molecular genetic hallmarks. n.a.: not available, wt: wildtype, u unmethylated, m: methylated, d: deleted, n: not deleted.
IDDiagnosisGradeAge (y)SexFISHEPICIHCIDH1IDH21p/19qTERTH3F3AMGMTCDKN2A/B
T01Pilocytic astrocytoma138f1.000.000wtwtn.a.wtn.a.un
T02Pilocytic astrocytoma116m1.000.000wtwtn.a.wtn.a.un
T03Oligod. IDH mut. 1p/19q codel227m1.000.001R132Hwt1p/19qC228Tn.a.mn
T04Oligod. IDH mut. 1p/19q codel.263f1.000.00n.a.R132Hwt1p/19qC250Tn.a.mn
T05Astrocytoma IDH mutant247m1.000.000R132Swtwtwtn.a.un
T06Astrocytoma IDH mutant222m1.000.00n.a.R132Cwtwtwtn.a.un
T07Glioblastoma IDH wildtype447m9.200.983wtwtn.a.n.a.n.a.ud
T08Astrocytoma IDH mutant437f1.000.321R132Hwtwtwtn.a.md
T09Glioblastoma IDH wildtype470f1.000.00n.a.wtwtn.a.C250Tn.a.md
T10Glioblastoma IDH wildtype466m7.741.073wtwtn.a.C228Tn.a.md
T11Glioblastoma IDH wildtype462m1.130.00n.a.wtwtn.a.C250Tn.a.mn
T12Astrocytoma IDH mutant445f1.000.001R132Hwtwtwtn.a.mn
T13Glioblastoma IDH wildtype477m1.000.000wtwtn.a.C228Tn.a.un
T14Glioblastoma IDH wildtype474m8.320.943wtwtn.a.C250Tn.a.mn
T15Glioblastoma IDH wildtype443f1.080.24n.a.wtwtn.a.C250Tn.a.un
T16Astrocytoma IDH mutant438m1.000.00n.a.R132Hwtwtwtn.a.mn
T17Glioblastoma IDH wildtype426m1.200.000wtwtn.a.wtn.a.un
T18Glioblastoma IDH wildtype469m9.251.043wtwtn.a.C228Tn.a.md
T19Glioblastoma IDH wildtype463f1.000.001wtwtn.a.C250Tn.a.md
T20Glioblastoma IDH wildtype432m1.150.000wtwt1pC228Tn.a.un
T21Glioblastoma IDH wildtype472m1.150.000wtwtwtC228Tn.a.md
T22Glioblastoma IDH wildtype479f9.41.12n.a.wtwtwtC228Tn.a.ud
T23Glioblastoma IDH wildtype475f1.000.00n.a.wtwt1pC250Tn.a.ud
T24Glioblastoma IDH wildtype445f1.050.000wtwtn.a.C228Twtmn
T25Glioblastoma IDH wildtype477f7.900.983wtwtn.a.C228Tn.a.ud
T26Glioblastoma IDH wildtype449m8.351.17n.a.wtwtn.a.C250Tn.a.md
T27Glioblastoma IDH wildtype425m1.000.000wtwtn.a.wtwtun
T28Glioblastoma IDH wildtype451m1.000.000wtwtn.a.C250Tn.a.md
T29Glioblastoma IDH wildtype463f1.000.361wtwtn.a.C250Tn.a.md
T30Glioblastoma IDH wildtype465f1.000.001wtwtn.a.C228Tn.a.md
T31Glioblastoma IDH wildtype476f1.050.000wtwtn.a.wtn.a.mn
T32Glioblastoma IDH wildtype472f1.000.12n.a.wtwtn.a.C250Tn.a.ud
T33Dif. midline glioma H3 K27 alt.438m1.000.000wtwtn.a.C228TK27Mun
T34Dif. midline glioma H3 K27 alt.433f1.000.000wtwtn.a.wtK27Mun
Publisher’s Note: MDPI stays neutral with regard to jurisdictional claims in published maps and institutional affiliations.

