Evaluation of Different Normalization and Analysis Procedures for Illumina Gene Expression Microarray Data Involving Small Changes

 ,
,
Abstract
:1. Introduction
1.1. Generating Bead Summary Data
1.2. Transformation and Normalization
1.3. Analysis of Differential Expression
2. Experimental Section
2.1. Animals
2.2. Microarray Experiments
2.3. Microarray Data Analysis
2.3.1. Normalization and Differential Expression Analysis
- (1)
- GenomeStudio v2010.3—The Illumina Custom algorithm in the GenomeStudio software assesses three components of variation (sequence specific biological variation, non-specific biological variation and technical error). Probes returning a p value < 0.05 in comparisons of the control and test classes were considered to be detecting differential expression. A more detailed description is given in the GenomeStudio Gene Expression Module User Guide [31].
- (2)
- GeneSpring GX 11.0 Software—The usual default settings of the GeneSpring program apply further transformation and normalization steps; however, this can introduce substantial artefacts when applied to data already normalized by other approaches. For these reasons, these additional normalization steps were not applied. Differential expression was determined by an unpaired t test (p < 0.05).
- (3)
- Max Cover (α,β)-k Feature Set Approach—Max Cover (α,β)-FS is a multivariate method that selects a set of probes that, as a collective, can discriminate well between the experimental test and control groups [27]. This algorithm consists of a two-stage filter process. Firstly, Fayyad and Irani’s algorithm [32] is used to discretise the data. For each probe, the algorithm orders the samples based on signal intensity and converts continuous data to binary data based on different intensity thresholds. It then selects the threshold that minimizes the class-information entropy of the samples, creating a binary dataset and discards the probes that are not discriminative enough, according to the minimum description length principle (filtering) [27]. Secondly, the algorithm finds a solution for the Max Cover (α,β)-k Feature Set problem [24]. This is achieved by comparing, for each probe, all possible pairs of samples, whether controls or tests, in order to extract an optimal set (solution) of probes (“features”) with both strong inter-class differentiation and strong intra-class similarity [25,26,27]. This approach differs from statistical methods, such as GenomeStudio and GeneSpring, in that instead of only considering means and variance measures, it preserves information about the individual samples within each class. It also identifies solutions involving sets of probes. These solutions reflect interrelationships between different probes—information which is often lost when considering each probe individually.
2.3.2. Filtering of Non-Specific Probe Signals

2.3.3. Assessment of Probe Set Concordance
2.3.4. Summary of Analysis and Evaluation
2.4. Pathway Analysis
3. Results
3.1. Comparison of Normalization Methods
3.1.1. Probe Set Generation

| No Normalization | Average | Cubic Spline | Quantile | Rank Invariant | |
|---|---|---|---|---|---|
| Heart Dataset | |||||
| GenomeStudio | 503 (88.2) | 760 (80.4) | 738 (83.3) | 787 (78.8) | 791 (74.5) |
| GeneSpring | 724 (73.6) | 1,235 (78.0) | 1,374 (78.1) | 1,375 (78.3) | 1,324 (77.3) |
| Max Cover (α,β)-FS | 781 (71.3) | 1,181 (76.8) | 1,282 (78.0) | 1,278 (78.0) | 1,231 (77.1) |
| Brain Dataset | |||||
| GenomeStudio | * | 44 (82.4) | 93 (70.2) | 95 (56.9) | 85 (67.2) |
| GeneSpring | * | 134 (57.9) | 248 (71.5) | 248 (70.0) | 209 (64.8) |
| Max Cover (α,β)-FS | * | 190 (43.8) | 402 (66.3) | 401 (66.4) | 320 (58.6) |
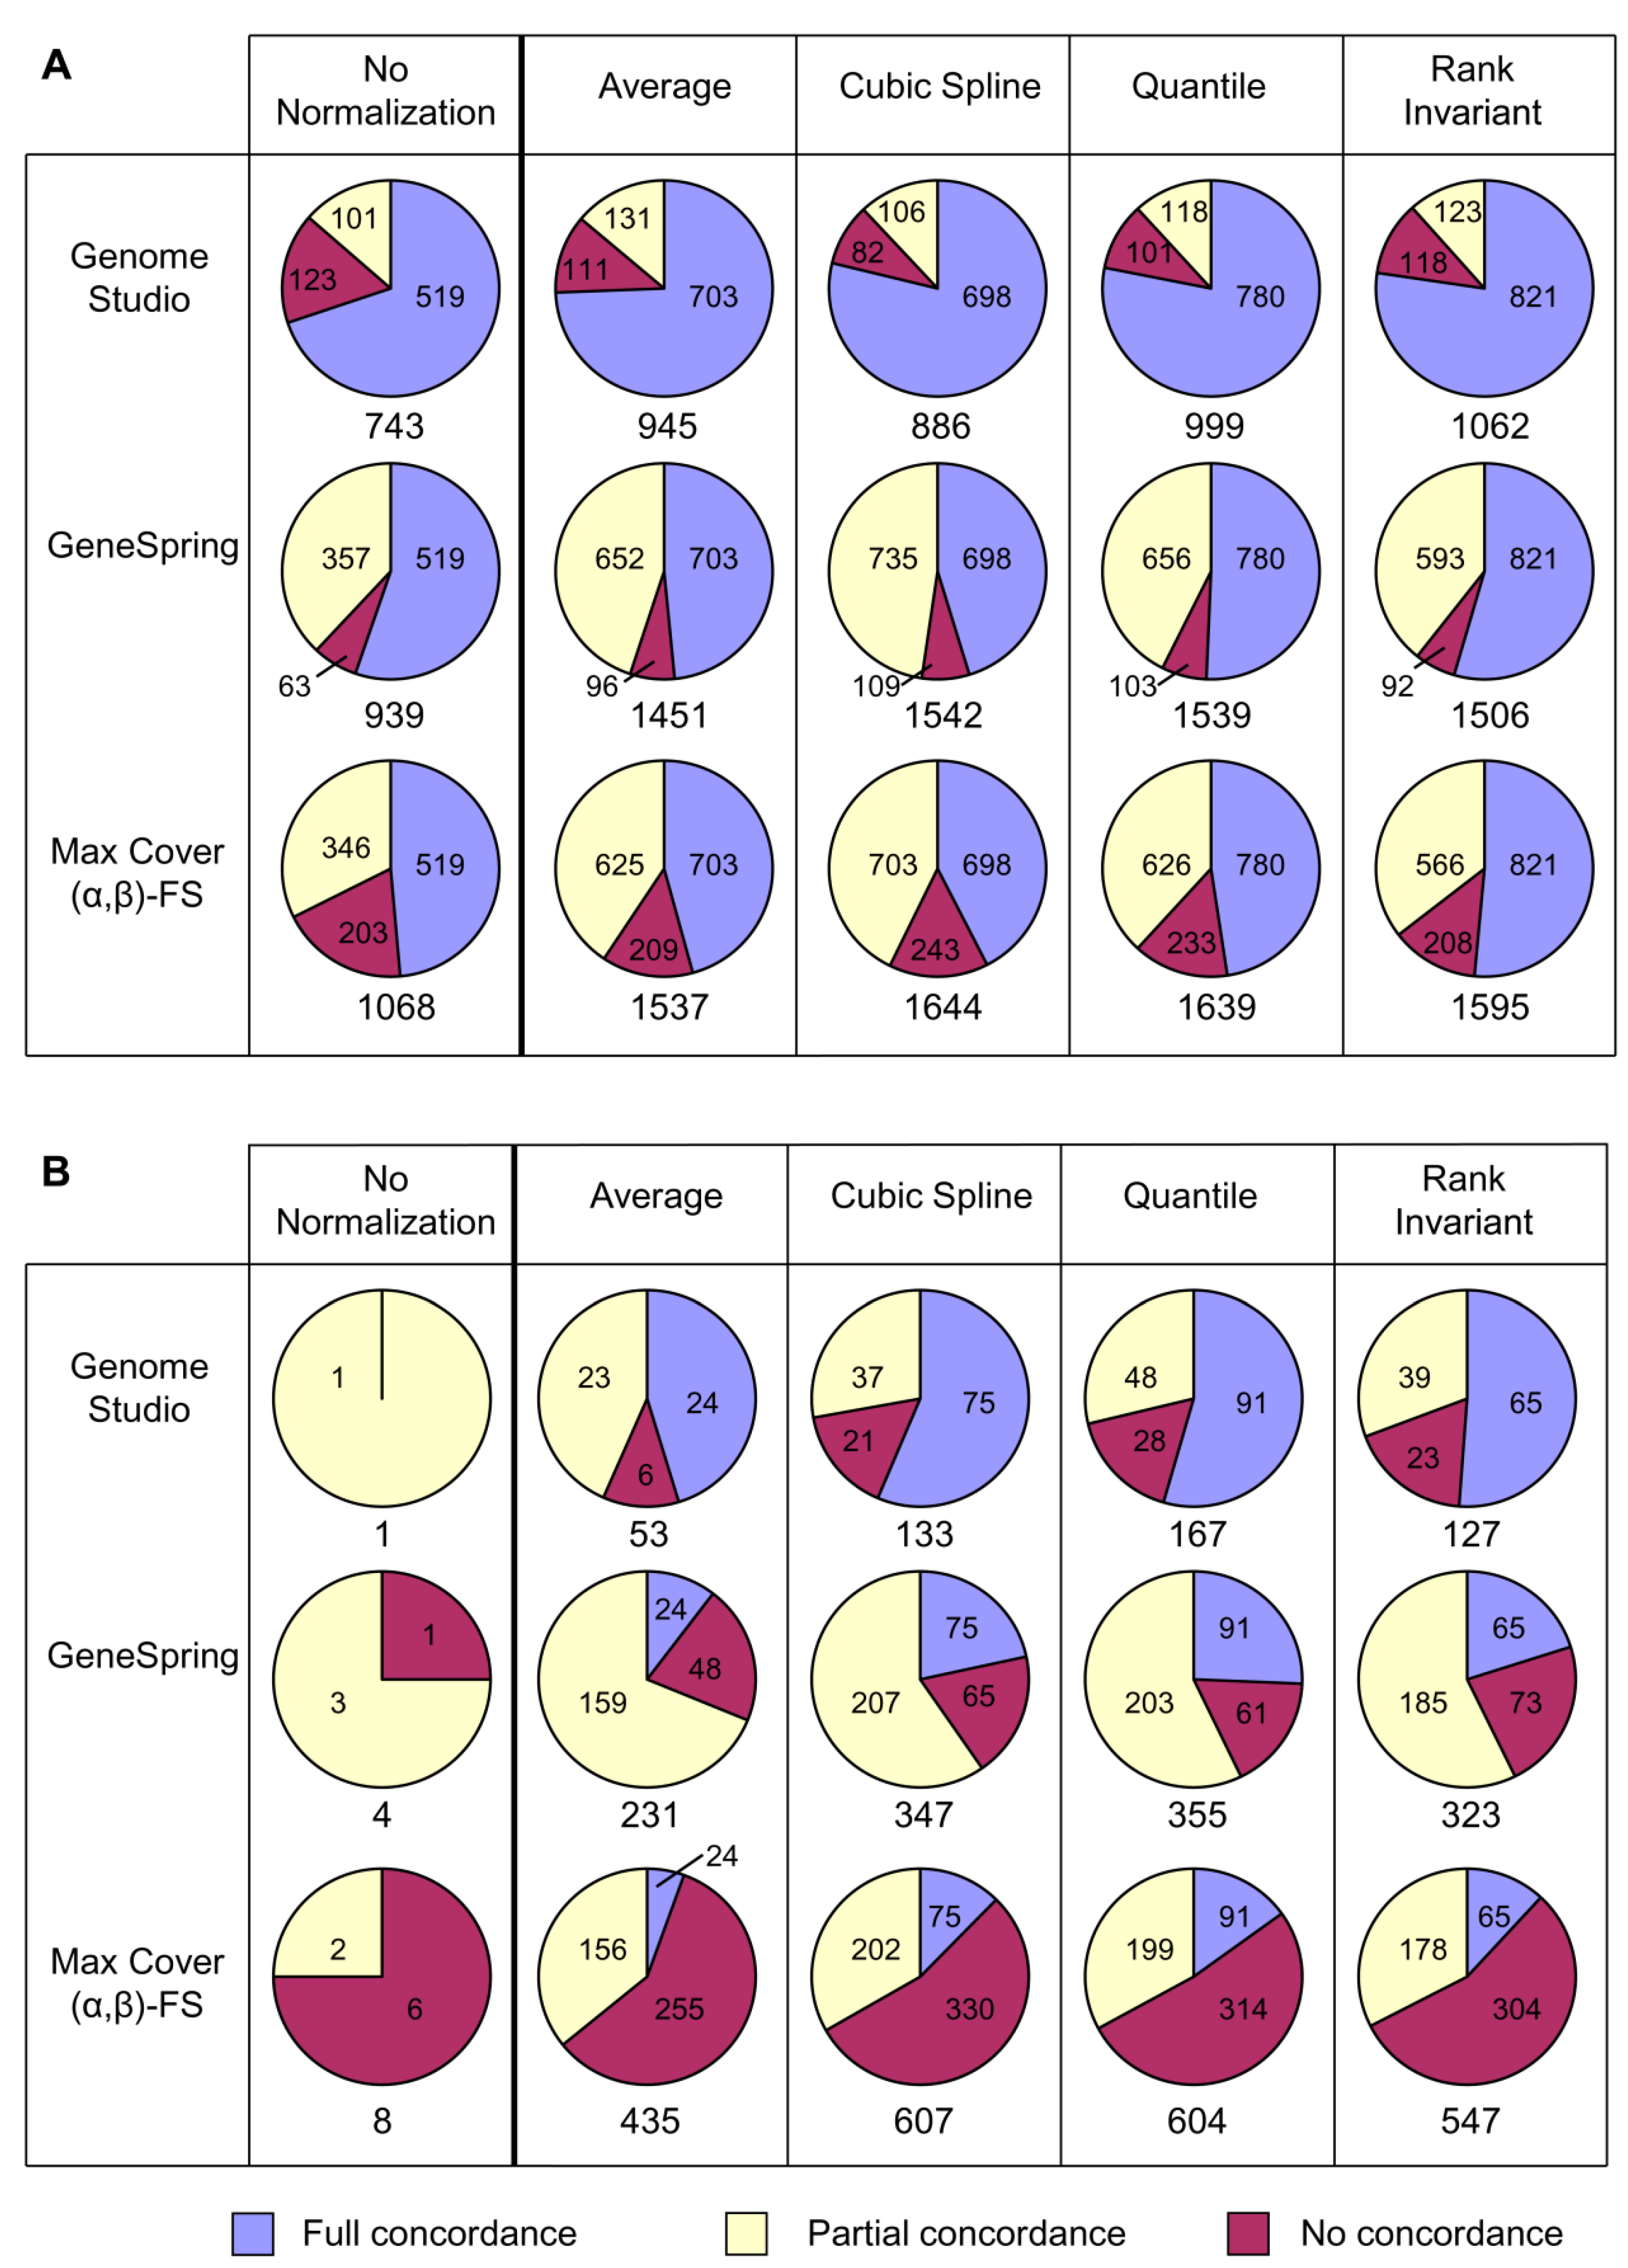
3.1.2. Effects of the Different Normalization Strategies on Probe Set Concordance
3.2. Comparison of Analytical Approaches
3.2.1. Definition of Concordance for Comparisons of Analytical Approaches
3.2.2. Effects of the Different Analytical Approaches on Probe Set Concordance
3.3. Comparison with Bioconductor Packages
3.4. Comparison of Pathway Analysis Outcomes
3.4.1. Definition of Concordance for Comparisons of Enriched Pathways
| Heart Dataset | ||||
|---|---|---|---|---|
| Average | Cubic Spline | Quantile | Rank Invariant | |
| GenomeStudio | 14 (12) | 11 (8) | 16 (10) | 18 (11) |
| GeneSpring | 24 (22) | 18 (16) | 16 (13) | 18 (17) |
| Max Cover (α,β)-FS | 18 (18) | 20 (16) | 19 (15) | 19 (18) |
| Brain Dataset | ||||
| Average | Cubic Spline | Quantile | Rank Invariant | |
| GenomeStudio | 0 (0) | 2 (2) | 3 (2) | 3 (3) |
| GeneSpring | 2 (0) | 2 (2) | 2 (2) | 3 (2) |
| Max Cover (α,β)-FS | 4 (0) | 4 (2) | 5 (2) | 6 (3) |
3.4.2. Effects of Different Normalization and Analytical Approaches on Pathway Analysis
3.4.3. Probe Set Concordance and Outcomes of Pathway Analysis
4. Discussion
- -
- The No Normalization strategy may be poorly suited to discovery-driven research.
- -
- Background correction in GenomeStudio generally led to a reduction in the size of probe sets, but did not affect percentage concordance.
- -
- Of the four Illumina GenomeStudio normalization strategies, Cubic Spline, Quantile and Rank Invariant generally gave comparable outcomes for a particular analytical approach, although performance sometimes varied between the datasets. (Average did not perform as well, particularly in the brain dataset.)
- -
- Different analytical approaches (GenomeStudio, GeneSpring, Max Cover (α,β)-FS) often generated quite different probe sets that were enriched for different pathways, even when using the same normalization strategy.
- -
- Most combinations of normalization strategy and analytical approach compared favourably with the Bioconductor tools lumi and limma.
5. Conclusions
Acknowledgments
Conflict of Interest
References
- Michael, K.L.; Taylor, L.C.; Schultz, S.L.; Walt, D.R. Randomly ordered addressable high-density optical sensor arrays. Anal. Chem. 1998, 70, 1242–1248. [Google Scholar] [CrossRef]
- Oliphant, A.; Barker, D.L.; Stuelpnagel, J.R.; Chee, M.S. BeadArray technology: Enabling an accurate, cost-effective approach to high-throughput genotyping. Biotechniques 2002, 56–58, 60–61. [Google Scholar]
- Fan, J.B.; Yeakley, J.M.; Bibikova, M.; Chudin, E.; Wickham, E.; Chen, J.; Doucet, D.; Rigault, P.; Zhang, B.; Shen, R.; et al. A versatile assay for high-throughput gene expression profiling on universal array matrices. Genome Res. 2004, 14, 878–885. [Google Scholar] [CrossRef]
- Gunderson, K.L.; Kruglyak, S.; Graige, M.S.; Garcia, F.; Kermani, B.G.; Zhao, C.; Che, D.; Dickinson, T.; Wickham, E.; Bierle, J.; et al. Decoding randomly ordered DNA arrays. Genome Res. 2004, 14, 870–877. [Google Scholar] [CrossRef]
- Kuhn, K.; Baker, S.C.; Chudin, E.; Lieu, M.H.; Oeser, S.; Bennett, H.; Rigault, P.; Barker, D.; McDaniel, T.K.; Chee, M.S. A novel, high-performance random array platform for quantitative gene expression profiling. Genome Res. 2004, 14, 2347–2356. [Google Scholar] [CrossRef]
- Stokes, T.H.; Han, X.; Moffitt, R.A.; Wang, M.D. Extending Microarray Quality Control and Analysis Algorithms to Illumina Chip Platform. In Proceedings of the IEEE 29th Annual International Conference, Lyon, France, 22–26 August 2007; pp. 4637–4640.
- Shi, L.; Reid, L.H.; Jones, W.D.; Shippy, R.; Warrington, J.A.; Baker, S.C.; Collins, P.J.; de Longueville, F.; Kawasaki, E.S.; Lee, K.Y.; et al. The MicroArray Quality Control (MAQC) project shows inter- and intraplatform reproducibility of gene expression measurements. Nat. Biotechnol. 2006, 24, 1151–1161. [Google Scholar]
- Shippy, R.; Fulmer-Smentek, S.; Jensen, R.V.; Jones, W.D.; Wolber, P.K.; Johnson, C.D.; Pine, P.S.; Boysen, C.; Guo, X.; Chudin, E.; et al. Using RNA sample titrations to assess microarray platform performance and normalization techniques. Nat. Biotechnol. 2006, 24, 1123–1131. [Google Scholar]
- Chen, J.J.; Hsueh, H.M.; Delongchamp, R.R.; Lin, C.J.; Tsai, C.A. Reproducibility of microarray data: A further analysis of Microarray Quality Control (MAQC) data. BMC Bioinform. 2007, 8, 412. [Google Scholar] [CrossRef]
- Maouche, S.; Poirier, O.; Godefroy, T.; Olaso, R.; Gut, I.; Collet, J.P.; Montalescot, G.; Cambien, F. Performance comparison of two microarray platforms to assess differential gene expression in human monocyte and macrophage cells. BMC Genomics 2008, 9, 302. [Google Scholar] [CrossRef]
- Asare, A.L.; Gao, Z.; Carey, V.J.; Wang, R.; Seyfert-Margolis, V. Power enhancement via multivariate outlier testing with gene expression arrays. Bioinformatics 2009, 25, 48–53. [Google Scholar]
- Du, P.; Kibbe, W.A.; Lin, S.M. Lumi: A pipeline for processing Illumina microarray. Bioinformatics 2008, 24, 1547–1548. [Google Scholar]
- Smyth, G.K. Linear models and empirical bayes methods for assessing differential expression in microarray experiments. Stat. Appl. Genet. Mol. Biol. 2004, 3. [Google Scholar] [CrossRef]
- Bioconductor. Available online: http://www.bioconductor.org (accessed on 13 May 2013).
- Schmid, R.; Baum, P.; Ittrich, C.; Fundel-Clemens, K.; Huber, W.; Brors, B.; Eils, R.; Weith, A.; Mennerich, D.; Quast, K. Comparison of normalization methods for Illumina BeadChip HumanHT-12 v3. BMC Genomics 2010, 11, 349. [Google Scholar] [CrossRef]
- Dunning, M.J.; Smith, M.L.; Ritchie, M.E.; Tavare, S. Beadarray: R classes and methods for Illumina bead-based data. Bioinformatics 2007, 23, 2183–2184. [Google Scholar]
- Dunning, M.J.; Barbosa-Morais, N.L.; Lynch, A.G.; Tavare, S.; Ritchie, M.E. Statistical issues in the analysis of Illumina data. BMC Bioinform. 2008, 9, 85. [Google Scholar] [CrossRef]
- Dunning, M.J.; Ritchie, M.E.; Barbosa-Morais, N.L.; Tavare, S.; Lynch, A.G. Spike-in validation of an Illumina-specific variance-stabilizing transformation. BMC Res. Notes 2008, 18. [Google Scholar] [CrossRef]
- Workman, C.; Jensen, L.J.; Jarmer, H.; Berka, R.; Gautier, L.; Nielser, H.B.; Saxild, H.H.; Nielsen, C.; Brunak, S.; Knudsen, S. A new non-linear normalization method for reducing variability in DNA microarray experiments. Genome Biol. 2002, 3. [Google Scholar] [CrossRef]
- Bolstad, B.M.; Irizarry, R.A.; Astrand, M.; Speed, T.P. A comparison of normalization methods for high density oligonucleotide array data based on variance and bias. Bioinformatics 2003, 19, 185–193. [Google Scholar]
- Reiner, A.; Yekutieli, D.; Benjamini, Y. Identifying differentially expressed genes using false discovery rate controlling procedures. Bioinformatics 2003, 19, 368–375. [Google Scholar]
- Rothman, K.J. No adjustments are needed for multiple comparisons. Epidemiology 1990, 1, 43–46. [Google Scholar] [CrossRef]
- Bender, R.; Lange, S. Adjusting for multiple testing—When and how? J. Clin. Epidemiol. 2001, 54, 343–349. [Google Scholar] [CrossRef]
- Cotta, C.; Sloper, C.; Moscato, P. Evolutionary search of thresholds for robust feature set selection: Application to the analysis of microarray data. In Applications of Evolutionary Computing; Raidl, G.R., Ed.; Springer: Berlin, Germany, 2004; pp. 21–30. [Google Scholar]
- Cotta, C.; Langston, M.A.; Moscato, P. Combinatorial and algorithmic issues for microarray analysis. In Handbook of Approximation Algorithms and Metaheuristics; Gonzalez, T.F., Ed.; Chapman & Hall/CRC: London, UK, 2007; pp. 74:1–74:14. [Google Scholar]
- Gomez Ravetti, M.; Moscato, P. Identification of a 5-protein biomarker molecular signature for predicting Alzheimer’s disease. PLoS One 2008, 3, e3111. [Google Scholar] [CrossRef]
- Berretta, R.; Costa, W.; Moscato, P. Combinatorial optimization models for finding genetic signatures from gene expression datasets. Methods Mol. Biol. 2008, 453, 363–377. [Google Scholar] [CrossRef]
- Rodriguez, A.; Hilvo, M.; Kytomaki, L.; Fleming, R.E.; Britton, R.S.; Bacon, B.R.; Parkkila, S. Effects of iron loading on muscle: Genome-wide mRNA expression profiling in the mouse. BMC Genomics 2007, 8, 379. [Google Scholar] [CrossRef]
- Johnstone, D.; Milward, E.A. Genome-wide microarray analysis of brain gene expression in mice on a short-term high iron diet. Neurochem. Int. 2010, 56, 856–863. [Google Scholar] [CrossRef]
- Drake, S.F.; Morgan, E.H.; Herbison, C.E.; Delima, R.; Graham, R.M.; Chua, A.C.; Leedman, P.J.; Fleming, R.E.; Bacon, B.R.; Olynyk, J.K.; et al. Iron absorption and hepatic iron uptake are increased in a transferrin receptor 2 (Y245X) mutant mouse model of hemochromatosis type 3. Am. J. Physiol. Gastrointest. Liver Physiol. 2007, 292, G323–G328. [Google Scholar]
- Illumina (2008) GenomeStudio Gene Expression Module v1.0 User Guide. Available online: http://support.illumina.com/documents/MyIllumina/c94519f7-9348-4308-a32f-b66ff3959e99/GenomeStudio_GX_Module_v1.0_UG_11319121_RevA.pdf (accessed on 15 May 2013).
- Fayyad, U.M.; Irani, K.B. Multi-Interval Discretization of Continuous-Valued Attributes for Classification Learning. In Proceedings of the 13th International Joint Conference on Artificial Intelligence, Chambery, France, 28 August–3 September 1993; Bajcsw, R., Ed.; Morgan Kaufmann: San Francisco, CA, USA, 1993; pp. 1022–1029. [Google Scholar]
- Ritchie, M.E.; Dunning, M.J.; Smith, M.L.; Shi, W.; Lynch, A.G. BeadArray expression analysis using bioconductor. PLoS Comput. Biol. 2011, 7, e1002276. [Google Scholar] [CrossRef]
- Barbacioru, C.C.; Wang, Y.; Canales, R.D.; Sun, Y.A.; Keys, D.N.; Chan, F.; Poulter, K.A.; Samaha, R.R. Effect of various normalization methods on applied biosystems expression array system data. BMC Bioinform. 2006, 7, 533. [Google Scholar] [CrossRef]
- DAVID: Functional Annotation Result Summary. Available online: http://david.abcc.ncifcrf.gov/ (accessed on 13 May 2013).
- Dennis, G., Jr.; Sherman, B.T.; Hosack, D.A.; Yang, J.; Gao, W.; Lane, H.C.; Lempicki, R.A. DAVID: Database for annotation, visualization, and integrated discovery. Genome Biol. 2003, 4. [Google Scholar] [CrossRef]
- Huang, D.W.; Sherman, B.T.; Lempicki, R.A. Systematic and integrative analysis of large gene lists using DAVID bioinformatics resources. Nat. Protoc. 2009, 4, 44–57. [Google Scholar]
- Swaminathan, S.; Fonseca, V.A.; Alam, M.G.; Shah, S.V. The role of iron in diabetes and its complications. Diabetes Care 2007, 30, 1926–1933. [Google Scholar] [CrossRef]
- Rajpathak, S.N.; Crandall, J.P.; Wylie-Rosett, J.; Kabat, G.C.; Rohan, T.E.; Hu, F.B. The role of iron in type 2 diabetes in humans. Biochim. Biophys. Acta 2009, 1790, 671–681. [Google Scholar] [CrossRef]
- Cooksey, R.C.; Jouihan, H.A.; Ajioka, R.S.; Hazel, M.W.; Jones, D.L.; Kushner, J.P.; McClain, D.A. Oxidative stress, beta-cell apoptosis, and decreased insulin secretory capacity in mouse models of hemochromatosis. Endocrinology 2004, 145, 5305–5312. [Google Scholar]
- Huang, J.; Gabrielsen, J.S.; Cooksey, R.C.; Luo, B.; Boros, L.G.; Jones, D.L.; Jouihan, H.A.; Soesanto, Y.; Knecht, L.; Hazel, M.W.; et al. Increased glucose disposal and AMP-dependent kinase signaling in a mouse model of hemochromatosis. J. Biol. Chem. 2007, 282, 37501–37507. [Google Scholar]
- Viola, A.; Pagano, L.; Laudati, D.; D’Elia, R.; D’Amico, M.R.; Ammirabile, M.; Palmieri, S.; Prossomariti, L.; Ferrara, F. HFE gene mutations in patients with acute leukemia. Leuk Lymphoma 2006, 47, 2331–2334. [Google Scholar]
- Morey, J.S.; Ryan, J.C.; van Dolah, F.M. Microarray validation: Factors influencing correlation between oligonucleotide microarrays and real-time PCR. Biol. Proced. Online 2006, 8, 175–193. [Google Scholar] [CrossRef]
- Tefferi, A.; Bolander, M.E.; Ansell, S.M.; Wieben, E.D.; Spelsberg, T.C. Primer on medical genomics. Part III: Microarray experiments and data analysis. Mayo Clin. Proc. 2002, 77, 927–940. [Google Scholar]
Appendix
| Heart–GenomeStudio | ||||||||
| No Norm | Average | Cubic Spline | Quantile | Rank Invariant | ||||
| No Norm | X | 548 (58.0) | 468 (52.8) | 486 (48.6) | 510 (48.0) | |||
| Average | 548 (96.1) | X | 775 (87.5) | 845 (84.6) | 872 (82.1) | |||
| Cubic Spline | 468 (82.1) | 775 (82.0) | X | 873 (87.4) | 836 (78.7) | |||
| Quantile | 486 (85.3) | 845 (89.4) | 873 (98.5) | X | 945 (89.0) | |||
| Rank Invariant | 510 (89.5) | 872 (92.3) | 836 (94.4) | 945 (74.2) | X | |||
| Heart–GeneSpring | ||||||||
| No Norm | Average | Cubic Spline | Quantile | Rank Invariant | ||||
| No Norm | X | 821 (56.6) | 696 (45.1) | 694 (45.1) | 685 (45.5) | |||
| Average | 821 (83.4) | X | 1,241 (80.5) | 1,241 (80.6) | 1,224 (81.3) | |||
| Cubic Spline | 696 (70.7) | 1,241 (85.5) | X | 1,509 (98.1) | 1,373 (91.2) | |||
| Quantile | 694 (70.5) | 1,241 (85.5) | 1,509 (97.9) | X | 1,374 (91.2) | |||
| Rank Invariant | 685 (69.6) | 1,224 (84.4) | 1,373 (89.0) | 1,374 (89.3) | X | |||
| Heart–Max Cover (α,β)-FS | ||||||||
| No Norm | Average | Cubic Spline | Quantile | Rank Invariant | ||||
| No Norm | X | 870 (56.6) | 759 (46.2) | 752 (45.9) | 742 (46.5) | |||
| Average | 870 (79.5) | X | 1,297 (78.9) | 1,288 (78.6) | 1,268 (79.5) | |||
| Cubic Spline | 759 (69.3) | 1,297 (84.4) | X | 1,616 (98.6) | 1,456 (91.3) | |||
| Quantile | 752 (68.7) | 1,288 (83.8) | 1,616 (98.3) | X | 1,456 (91.3) | |||
| Rank Invariant | 742 (67.8) | 1,268 (82.5) | 1,456 (88.6) | 1,456 (88.8) | X | |||
| Brain–GenomeStudio | ||||||||
| Average | Cubic Spline | Quantile | Rank Invariant | |||||
| Average | X | 44 (33.1) | 44 (26.3) | 43 (33.9) | ||||
| Cubic Spline | 44 (83.0) | X | 132 (79.0) | 104 (81.9) | ||||
| Quantile | 44 (83.0) | 132 (99.2) | X | 109 (85.8) | ||||
| Rank Invariant | 43 (81.1) | 104 (78.2) | 109 (65.3) | X | ||||
| Brain–GeneSpring | ||||||||
| Average | Cubic Spline | Quantile | Rank Invariant | |||||
| Average | X | 145 (41.8) | 145 (40.8) | 111 (34.4) | ||||
| Cubic Spline | 145 (62.8) | X | 341 (96.1) | 258 (79.9) | ||||
| Quantile | 145 (62.8) | 341 (98.3) | X | 259 (80.2) | ||||
| Rank Invariant | 111 (48.1) | 258 (74.4) | 259 (73.0) | X | ||||
| Brain–Max Cover (α,β)-FS | ||||||||
| Average | Average | Cubic Spline | Quantile | Rank Invariant | ||||
| Cubic Spline | X | 213 (35.1) | 209 (34.6) | 149 (27.2) | ||||
| Quantile | 213 (49.0) | X | 588 (97.4) | 406 (74.2) | ||||
| Rank Invariant | 209 (48.0) | 588 (96.9) | X | 406 (74.2) | ||||
| Average | 149 (34.3) | 406 (66.9) | 406 (67.2) | X | ||||
| Heart–GenomeStudio | |||||
|---|---|---|---|---|---|
| No Norm | Average | Cubic Spline | Quantile | Rank Invariant | |
| No Norm | X | 17 (34.0) | 16 (28.1) | 16 (26.2) | 17 (21.5) |
| Average | 17 (100) | X | 47 (82.5) | 48 (78.7) | 49 (62.0) |
| Cubic Spline | 16 (94.1) | 47 (94.0) | X | 57 (93.4) | 57 (72.2) |
| Quantile | 16 (94.1) | 48 (96.0) | 57 (100) | X | 60 (75.9) |
| Rank Invariant | 17 (100) | 49 (98.0) | 57 (100) | 60 (98.4) | X |
| Heart–GenomeStudio | ||||||||
| No Norm | Average | Cubic Spline | Quantile | Rank Invariant | ||||
| No Norm | X | 689 (50.6) | 621 (48.6) | 626 (47.9) | 648 (43.2) | |||
| Average | 689 (92.7) | X | 1,146 (89.7) | 1,183 (90.4) | 1,242 (82.9) | |||
| Cubic Spline | 621 (83.6) | 1,146 (80.2) | X | 1,249 (95.5) | 1,185 (79.1) | |||
| Quantile | 626 (84.3) | 1,183 (86.9) | 1,249 (97.7) | X | 1,225 (81.7) | |||
| Rank Invariant | 648 (87.2) | 1,242 (91.3) | 1,185 (92.7) | 1,225 (93.7) | X | |||
| Brain–GenomeStudio | ||||||||
| Average | Cubic Spline | Quantile | Rank Invariant | |||||
| Average | X | 61 (33.0) | 61 (30.3) | 56 (45.2) | ||||
| Cubic Spline | 61 (82.4) | X | 181 (90.0) | 113 (91.1) | ||||
| Quantile | 61 (82.4) | 181 (97.8) | X | 114 (91.9) | ||||
| Rank Invariant | 56 (75.7) | 113 (61.1) | 114 (56.7) | X | ||||
| Heart Dataset | vs. Lumi (2,239 probes) | vs. Limma (2,107 probes) | ||||
|---|---|---|---|---|---|---|
| Number Concordant | Number Discordant | % Concord | Number Concordant | Number Discordant | % Concord | |
| GenomeStudio | ||||||
| No Norm | 551 | 19 | 96.7 | 535 | 35 | 93.9 |
| Average | 935 | 10 | 98.9 | 922 | 23 | 97.6 |
| Cubic Spline | 884 | 2 | 99.8 | 876 | 10 | 98.9 |
| Quantile | 997 | 2 | 99.8 | 989 | 10 | 99.0 |
| Rank Invariant | 1,060 | 2 | 99.8 | 1,051 | 11 | 99.0 |
| GeneSpring | ||||||
| No Norm | 828 | 156 | 84.1 | 820 | 164 | 83.3 |
| Average | 1,371 | 80 | 94.5 | 1,366 | 85 | 94.1 |
| Cubic Spline | 1,512 | 30 | 98.1 | 1,508 | 34 | 97.8 |
| Quantile | 1,507 | 32 | 97.9 | 1,507 | 32 | 97.9 |
| Rank Invariant | 1,460 | 46 | 96.9 | 1,458 | 48 | 96.8 |
| Max Cover (α,β)-FS | ||||||
| No Norm | 900 | 195 | 82.2 | 885 | 210 | 80.8 |
| Average | 1,382 | 155 | 89.9 | 1,365 | 172 | 88.8 |
| Cubic Spline | 1,532 | 112 | 93.2 | 1,522 | 122 | 92.6 |
| Quantile | 1,530 | 109 | 93.3 | 1,517 | 122 | 92.6 |
| Rank Invariant | 1,480 | 115 | 92.8 | 1,464 | 131 | 91.8 |
| Brain Dataset | vs. Lumi (488 probes) | vs. Limma (420 probes) | ||||
| Number Concordant | Number Discordant | % Concord | Number Concordant | Number Discordant | % Concord | |
| GenomeStudio | ||||||
| No Norm | 1 | 0 | 100 | 1 | 0 | 100 |
| Average | 47 | 6 | 88.7 | 43 | 10 | 81.1 |
| Cubic Spline | 128 | 5 | 96.2 | 116 | 17 | 87.2 |
| Quantile | 157 | 10 | 94.0 | 142 | 25 | 85.0 |
| Rank Invariant | 118 | 9 | 92.9 | 107 | 20 | 84.3 |
| GeneSpring | ||||||
| No Norm | 1 | 3 | 25.0 | 1 | 3 | 25.0 |
| Average | 161 | 70 | 69.7 | 151 | 80 | 65.4 |
| Cubic Spline | 313 | 34 | 90.2 | 309 | 38 | 89.0 |
| Quantile | 316 | 39 | 89.0 | 311 | 44 | 87.6 |
| Rank Invariant | 271 | 52 | 83.9 | 261 | 62 | 80.8 |
| Max Cover (α,β)-FS | ||||||
| No Norm | 1 | 11 | 8.3 | 1 | 11 | 8.3 |
| Average | 168 | 267 | 38.6 | 160 | 275 | 36.8 |
| Cubic Spline | 298 | 309 | 49.1 | 280 | 327 | 46.1 |
| Quantile | 299 | 305 | 49.5 | 283 | 321 | 46.9 |
| Rank Invariant | 249 | 298 | 45.5 | 240 | 307 | 43.9 |
© 2013 by the authors; licensee MDPI, Basel, Switzerland. This article is an open access article distributed under the terms and conditions of the Creative Commons Attribution license (http://creativecommons.org/licenses/by/3.0/).
Share and Cite
Johnstone, D.M.; Riveros, C.; Heidari, M.; Graham, R.M.; Trinder, D.; Berretta, R.; Olynyk, J.K.; Scott, R.J.; Moscato, P.; Milward, E.A. Evaluation of Different Normalization and Analysis Procedures for Illumina Gene Expression Microarray Data Involving Small Changes. Microarrays 2013, 2, 131-152. https://doi.org/10.3390/microarrays2020131
Johnstone DM, Riveros C, Heidari M, Graham RM, Trinder D, Berretta R, Olynyk JK, Scott RJ, Moscato P, Milward EA. Evaluation of Different Normalization and Analysis Procedures for Illumina Gene Expression Microarray Data Involving Small Changes. Microarrays. 2013; 2(2):131-152. https://doi.org/10.3390/microarrays2020131
Chicago/Turabian StyleJohnstone, Daniel M., Carlos Riveros, Moones Heidari, Ross M. Graham, Debbie Trinder, Regina Berretta, John K. Olynyk, Rodney J. Scott, Pablo Moscato, and Elizabeth A. Milward. 2013. "Evaluation of Different Normalization and Analysis Procedures for Illumina Gene Expression Microarray Data Involving Small Changes" Microarrays 2, no. 2: 131-152. https://doi.org/10.3390/microarrays2020131
APA StyleJohnstone, D. M., Riveros, C., Heidari, M., Graham, R. M., Trinder, D., Berretta, R., Olynyk, J. K., Scott, R. J., Moscato, P., & Milward, E. A. (2013). Evaluation of Different Normalization and Analysis Procedures for Illumina Gene Expression Microarray Data Involving Small Changes. Microarrays, 2(2), 131-152. https://doi.org/10.3390/microarrays2020131