Impact of Canopy Gap Ecology on the Diversity and Dynamics of Natural Regeneration in a Tropical Moist Semi-Deciduous Forest, Ghana †

Department of Silviculture, Faculty of Forestry and Wood Technology, Mendel University in Brno, Zemědělská 3, 61300 Brno, Czech Republic
*
Author to whom correspondence should be addressed.
†
Presented at the 1st International Electronic Conference on Biological Diversity, Ecology and Evolution, 15–31 March 2021; Available online: https://bdee2021.sciforum.net/ .
Biol. Life Sci. Forum 2021, 2(1), 10; https://doi.org/10.3390/BDEE2021-09455
Published: 15 March 2021
(This article belongs to the Proceedings of The 1st International Electronic Conference on Biological Diversity, Ecology and Evolution)
Abstract
:The study evaluated species diversity, including regeneration and growth dynamics of different naturally regenerated tree species in gaps of different sizes in a tropical moist semi-deciduous forest, Ghana. Twenty-three randomly selected gaps categorized as small (≤300 m2), medium (301–1000 m2), large (1001–2000 m2), and very large (>2000 m2) sizes were defined. Forty-one subsampling circular 1 m2 plots at 2 m intervals were delineated within each gap. In total, 1468 individuals belonging to 85 species from 25 families and 65 genera were enumerated. Malvaceae (13 species) was the most diverse family, while Bignoniaceae, Clusiaceae, Lecythidaceae, Melastomataceae, Mimosaceae, Myristicaceae, Ochnaceae, Rutaceae, Santalaceae, and Urticaceae families were scarcely represented by only 1 species, respectively. Non-pioneer light demanding (NPLD) recorded the highest number of 38 species, followed by pioneers with 30 species, whereas shade-tolerant attained the lowest representatives of 17 species in regenerated species composition. All estimated diversity indices revealed improvements of species diversity in all gaps significantly. Though the small gaps showed no regeneration shift between pioneers and shade-tolerant, the other gap sizes did it at 62–82%. Medium and large gaps promoted natural regeneration at all distinguished diameter classes, however, pioneers and NPLD at 71–100 mm and pioneers at 51–70 mm were absent in small and very large gaps, respectively. Similarly, pioneers of height 0–20 cm in very large gaps were missing. Conclusively, species biodiversity differed significantly among gaps while regeneration dynamics differed significantly among gap sizes.
1. Introduction
Canopy gaps are indispensable growing sites for the sustainable succession of different natural regeneration tree species. Generally, canopy gaps influence forest regeneration cycles by offering local resource-rich niches for understory tree species [1]. Differences among tree species in establishment, germination, development, survival, growth, and canopy recruitment within gap sites explain the crucial role of canopy gaps in shaping forest composition [1,2]. This very important role of canopy gaps had been well documented in numerous gap regeneration studies conducted in temperate [3] and tropical [4] forest ecosystems. Studies primarily focus on the effects of canopy gaps on species diversity [4,5], leaving only a few researching into the ecological positive effects of canopy gaps on natural regeneration dynamics [6]. Moreover, papers contributing to the widening knowledge on regeneration dynamics of naturally regenerated tree species with different shade tolerance mechanisms in gaps generally are quite common [6,7]. However, the role of gap size on ecological regeneration dynamics of natural regeneration has so far received little attention. Thus, the study evaluated species diversity, including regeneration and growth dynamics of different naturally regenerated tree species in gaps of different sizes (Figure 1) in a tropical moist semi-deciduous forest, Ghana.
2. Methods
The study was conducted in 84-year-old Bia Tano forest reserve, a tropical moist semi-deciduous forest in Ghana. The study area under prevailing tropical humid climate is located between latitude 6°52′–7°05′ N and longitude 2°30′–2°42′ W at 213 m–274 m a.s.l elevation with an area coverage of over 18,000 ha. The mean annual air temperature and precipitation range between 26 °C and 29 °C and 1250 and 1750 mm, respectively. Schist and phyllites are the predominant underlying bedrocks with forest ochrosols as the most prevailing soil type according to Ghana soil classification system. The study area represents a hallmark of rich-species forest region in Ghana [4], a home of predominantly rich Celtis-Triplochiton (Cannabaceae-Malvaceae) association [4]. Twenty-three randomly selected gaps categorized as small (n = 2; ≤300 m2), medium (n = 7; 301–1000 m2), large (n = 11; 1001–2000 m2), and very large (n = 3; >2000 m2) sizes (Figure 1) were defined (see Table 1). Forty-one subsampling circular 1 m2 plots at 2 m intervals were delineated within each gap. Every naturally regenerated tree species of height 0–350 cm and diameter 0–100 mm within subsampling plots were identified by species and recorded.
Paleontological statistics software (3.24) [8] was used to estimate various assessed biodiversity indices. ANOVA and post hoc Tukey’s HSD test were carried out to show significance of means at p < 0.05 level using STATISTICA (13.4.0.14). Simpson’s index (1-D) measured species dominance, Shannon diversity index (H) measured species diversity, Berger–Parker index (B-P) measured most abundant species; Pielou’s evenness (J) measured species evenness, Menhinick’s index (Mk); Fisher’s alpha (α) and Chao1 diversity index (C-1) measured species richness from different perspectives (Figure 2). Formulas for different analyzed biodiversity indices based on adopted Equations (1), (2), (4)–(7) [9] and (3) [10] are displayed in Figure 2.
3. Results and Discussion
3.1. Impact of Gap Ecology on Species Composition and Diversity
In total, 1468 individuals belonging to 85 species from 25 families and 65 genera were enumerated. Malvaceae (13 species) was the most diverse family, while Bignoniaceae, Clusiaceae, Lecythidaceae, Melastomataceae, Mimosaceae, Myristicaceae, Ochnaceae, Rutaceae, Santalaceae, and Urticaceae families were scarcely represented by only 1 species, respectively. This result firstly demonstrates the species-rich diversified nature of tropical forests and further validates the importance contribution of tropical forests towards the maintenance of global tree biodiversity [11]. Secondly, this observation clearly depicts that gaps remain the conducive habitats for rich species composition of natural regeneration [1,7]. Non-pioneer light demanding (NPLD) recorded the highest number of 38 species, followed by pioneers with 30 species, whereas shade-tolerant attained the lowest representatives of 17 species in regenerated species composition. This finding supports the long-standing notion that light-tolerant species prefer open space environments for optimum regeneration [5] while those environments normally impede regeneration of shade-adapted species [2]. Pioneers—Terminalia superba (frequency, regeneration density, relative density = 97, 774 trees/ha, 6.61%) and Daniella ogea (85, 678 trees/ha, 5.79%), NPLD—Mansonia altissima (75, 598 trees/ha, 5.11%), and Blighia sapida (70, 558 trees/ha, 4.77%), and shade-tolerant—Nesogordonia papaverifer (340, 2711 trees/ha, 23.16%), Celtis mildbraedii (188, 1499 trees/ha, 12.81%) and Baphia nitida (185, 1475 trees/ha, 12.60%) were the predominant tree species found almost in all gaps. In another tropical moist semi-deciduous forest in Ghana, Albizia zygia (0.50–52.96%), Ceiba pentandra (0.67–75.67%), Celtis mildbraedii (0.74–22.16%) and Turreanthus africanus (0.67–33.16%) among 37 encountered natural regeneration species were the four predominant species that significantly influenced high seedling densities during 0.5, 10 and 33 months in gaps following selective logging [6].
Furthermore, all estimated biodiversity indices revealed improvements of species diversity in all gaps significantly (Table 1). Nonetheless, biodiversity did not vary greatly from gap to gap (287–2728 m2). Thus, our finding is consistent with Schnitzer and Carson [5] that gaps play a similar role in maintaining tree species diversity in many tropical forests. By contrast, disprove gap size as a significant variable on naturally regenerated tree species composition and diversity according to Hammond et al. [3]. Generally, this observation solidly corroborates a view that gap-based silviculture plays a vital role in forests by promoting ecological species assemblage mechanisms that enable species coexistence which significantly relates to the positive impacts of species diversity on forest ecosystem’s stability and functions [3].
3.2. Impact of Gap Ecology on Regeneration Dynamics of Species with Different Shade Tolerance Mechanisms
Our analysis investigating the ecological regeneration shift of pioneers to shade-tolerant species in gaps of different sizes. There, from small to medium, large and very large gaps, the abundance proportions among pioneers (%): non-pioneer light demanding species (%): shade-tolerant tree species (%) roughly varied as: 39:18:43, 13:19:68, 19:20:61, and 10:24:66, respectively. Trends showed that the rate of sequential replacement of pioneers by shade-tolerant species within very large gaps (+4.94) was highly rapid compared to medium gaps (+5.86) and large gaps (+13.12) whereas no ecological species replacement was found within small gaps (+33.70). In addition, a stronger replacement relationship between concerned species within very large gaps (82%) and medium gaps (72%) areas were observed, while a less weak ecological association was detected within large gaps (62%). Still, our results substantiate the long-established knowledge about regeneration shift between pioneers and shade-tolerant species in gaps under tropical forests [4,6,7] due to species biological growth characters and physiological light tolerance ability; in addition, the colossal size of very large (average size 2430 m2) and large (1401 m2) gaps, and higher light levels in medium gaps made this natural process more rapid and effective.
Again, from Figure 3, no significant difference (p > 0.05) was found between species with different shade mechanisms in small and very large gaps. However, there were significant differences among tree species at p < 0.001 level in medium and large gaps. However, then, no significant difference (p > 0.05) was observed between the two light-tolerant species. In addition, higher proportions of shade-tolerant species in all gap sizes were observed. Hence, the imbalance proportions of 2:1:2, 1:2:5, 1:1:3, and 1:2:6 were observed among pioneers: NPLD: shade-tolerant species in small, medium, large, and very large gaps, respectively. Gaps maintaining dominated shade-tolerant species originated from either ecological regeneration replacement or were present as advance regeneration prior to gap creation. Therefore, our findings are consistent with those of [4] and [5] specifically, that gaps play a neutral role in maintaining tree species with different lifelong light demanding histories, however, abundance proportions for only shade-tolerant species are usually high. Small gaps showing similar proportions between pioneers (1459 trees/ha) and shade-tolerant (1573 trees/ha) species suggest that gaps of relatively smaller sizes (<300 m2) are essential growing areas for preserving balanced proportions of natural regeneration of different suites of tree species.
3.3. Impact of Gap Ecology on Growth Dynamics of Different Naturally Regenerated Tree Species
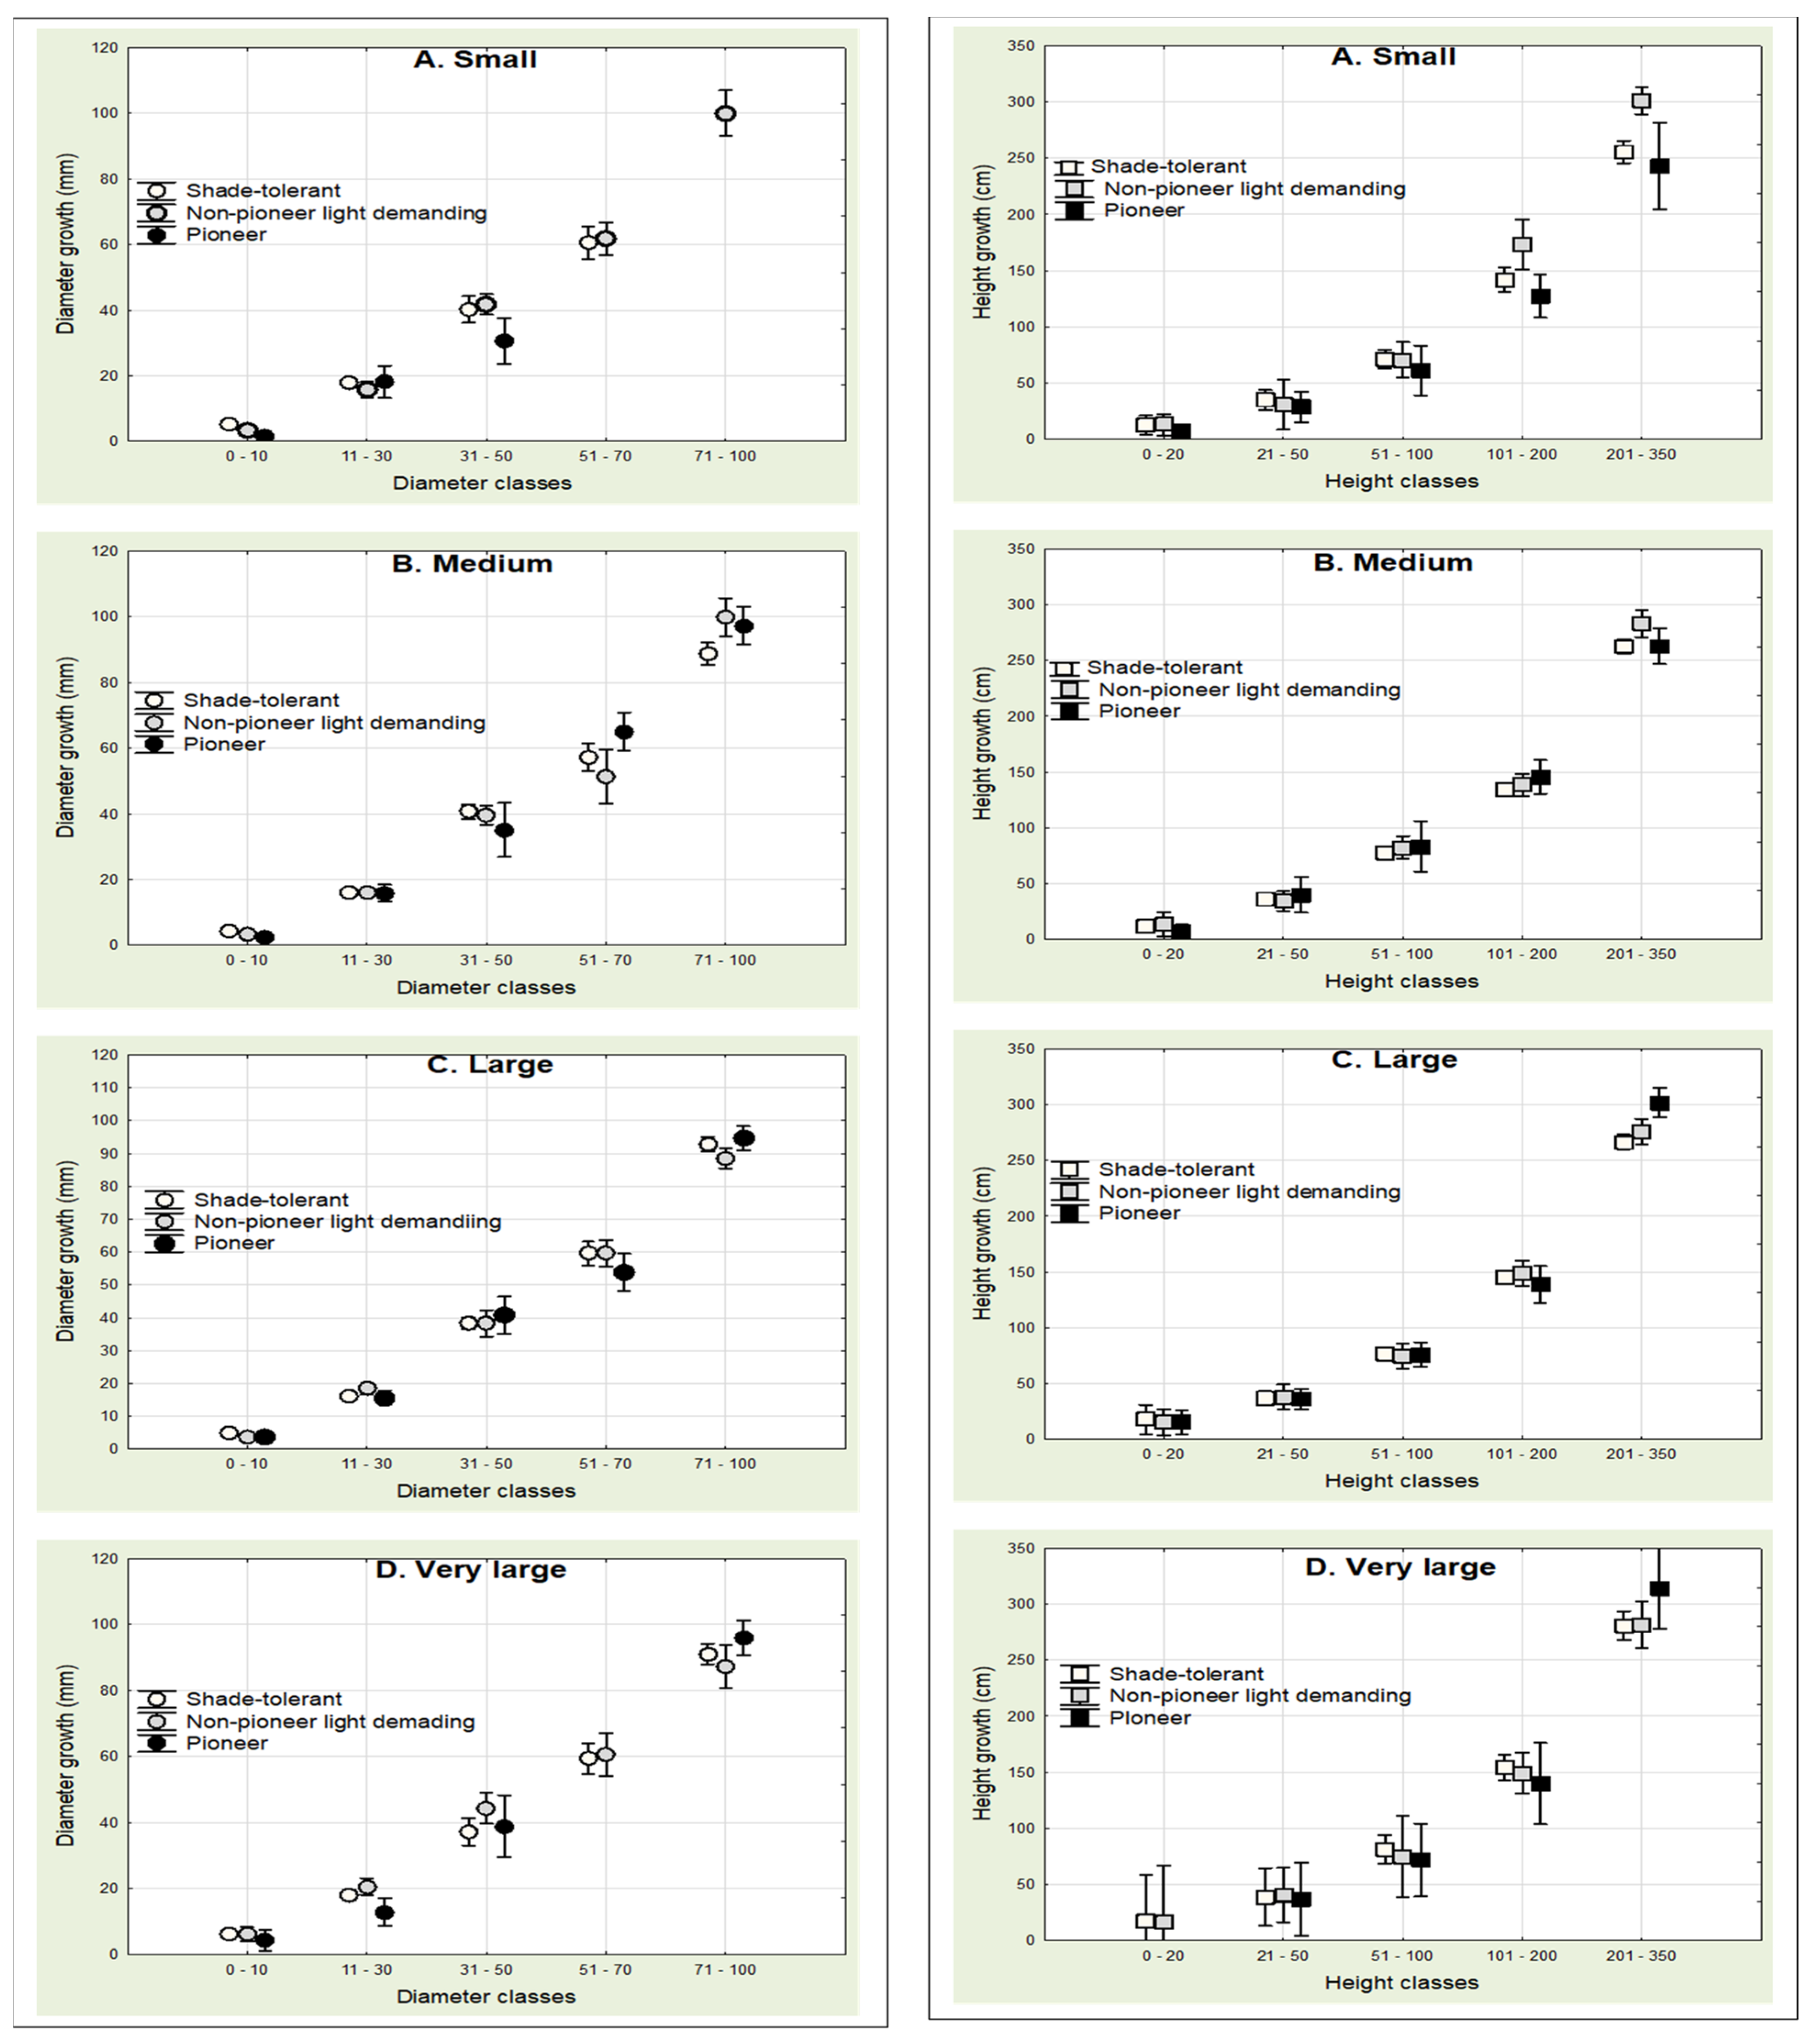
From Figure 4 (left plate), it was observed that medium and large gaps promoted natural regeneration at all diameter classes (0–10, 11–30, 31–50, 51–70, and 71–100 mm), however, pioneers and NPLD at 71–100 mm and pioneers at 51–70 mm were absent in small gaps, and pioneers at 51–70 mm were again absent within very large gaps. Similarly, pioneers at 0–20 cm in very large gaps were missing in regeneration height growth dynamics in Figure 4 (right plate).
The missing light-tolerant representative species at the two sapling classes (51–70 and 71–100 mm) of diameter growth dynamics justifies notion that small gaps are unyielding grounds for optimum growth of light dependent tree species. The full appearance of all height classes (0–20, 21–50, 51–100, 101–200, and 201–350 cm) for categorized tree species groups in almost all gap sizes under height growth dynamics in comparison to absent diameter classes of diameter growth dynamics strongly attests to the finding in several studies that in tree growth under prevailing light environments, height growth is often maintained over diameter growth, e.g., [12]. However, then again, our result disputes the assumption that differences in the light environments of trees growing under various levels of canopy cover would be expressed sooner in diameter growth than they would in height growth [13,14].
4. Conclusions
Conclusively, the present study demonstrates some beneficial effects of canopy gap ecology on the diversity and dynamics of natural regeneration in a moist tropical forest and adds a valuable contribution to tropical forestry, especially in Ghana and tropical African regions. Species diversity differed significantly among gaps but not among gap sizes. Expansive size of canopy gaps and higher light levels in gaps were the explanatory factors for the rapid ecological regeneration shift of pioneers to shade-tolerant species in medium to very large gaps at 62–82%. Higher proportions of shade-tolerant species (43–68%) in all gap sizes were observed. Gap size was a significant variable that affected species dynamics of natural regeneration in gaps. Small gaps were found to be unyielding grounds for light dependent species in sapling classes (51–70 and 71–100 mm) of diameter growth dynamics. Gaps as growing sites promoted the full appearance of all height classes (0–20, 21–50, 51–100, 101 -200, and 201–350 cm) for all categorized gap regeneration tree species.
Supplementary Materials
The poster presentation is available online at https://www.mdpi.com/article/10.3390/BDEE2021-09455/s1, the video presentation is available online at https://sciforum.net/event/BDEE2021/keynote/18b10370eef19d753c40b3e7054bc450/presentation_video/sciforum-043659.mp4.
Informed Consent Statement
Informed consent was obtained from all subjects involved in the study.
Data Availability Statement
The data presented in this study are available on request from the corresponding author.
Acknowledgments
We are profoundly grateful to IGA project no. LDF_VP_2019015 and the Framework of Bilateral Mobility Program for Traineeship of Doctoral Students, MENDELU for funding this research.
References
- Sherman, R.E.; Fahey, T.J.; Battles, J.J. Small-scale disturbance and regeneration dynamics in a neotropical mangrove forest. J. Ecol. 2000, 88, 165–178. [Google Scholar] [CrossRef]
- Feldmann, E.; Glatthorn, J.; Ammer, C.; Leuschner, C. Regeneration Dynamics Following the Formation of Understory Gaps in a Slovakian Beech Virgin Forest. Forests 2020, 11, 585. [Google Scholar] [CrossRef]
- Hammond, M.E.; Pokorny, R.; Dobrovolný, L.; Friedl, M.; Hiitola, N. Effect of gap size on tree species diversity of natural regeneration–case study from Masaryk Training Forest Enterprise Křtiny. J. For. Sci. 2020, 66, 407–419. [Google Scholar] [CrossRef]
- Hammond, M.E.; Pokorný, R. Diversity of Tree Species in Gap Regeneration under Tropical Moist Semi-Deciduous Forest: An Example from Bia Tano Forest Reserve. Diversity 2020, 12, 301. [Google Scholar] [CrossRef]
- Schnitzer, S.A.; Carson, W.P. Treefall gaps and the maintenance of species diversity in a tropical forest. Ecology 2001, 82, 913–919. [Google Scholar] [CrossRef]
- Duah-Gyamfi, A.; Kyereh, B.; Adam, K.A.; Agyeman, V.K.; Swaine, M.D. Natural regeneration dynamics of tree seedlings on skid trails and tree gaps following selective logging in a tropical moist semi-deciduous forest in Ghana. Open J. For. 2014, 4, 49. [Google Scholar] [CrossRef] [Green Version]
- De Carvalho, A.L.; D’Oliveira, M.V.N.; Putz, F.E.; De Oliveira, L.C. Natural regeneration of trees in selectively logged forest in western Amazonia. For. Ecol. Manag. 2017, 392, 36–44. [Google Scholar] [CrossRef] [Green Version]
- Hammer, Ø.; Harper, D.A.; Ryan, P.D. PAST: Paleontological statistics software package for education and data analysis. Palaeontol. Electron. 2001, 4, 9. [Google Scholar]
- Harper, D.A. Numerical Palaeobiology: Computer-Based Modelling and Analysis of Fossils and Their Distributions; John Wiley and Sons Inc.: Chichester, UK, 1999. [Google Scholar]
- Berger, W.H.; Parker, F.L. Diversity of Planktonic Foraminifera in Deep-Sea Sediments. Science 1970, 168, 1345–1347. [Google Scholar] [CrossRef] [PubMed]
- Rozendaal, D.M.A.; Bongers, F.; Aide, T.M.; Alvarez-Dávila, E.; Ascarrunz, N.; Balvanera, P.; Becknell, J.M.; Bentos, T.V.; Brancalion, P.H.S.; Cabral, G.A.L.; et al. Biodiversity recovery of Neotropical secondary forests. Sci. Adv. 2019, 5, eaau3114. [Google Scholar] [CrossRef] [PubMed] [Green Version]
- Rozendaal, D.M.; During, H.J.; Sterck, F.J.; Asscheman, D.; Wiegeraad, J.; Zuidema, P.A. Long-term growth patterns of juvenile trees from a Bolivian tropical moist forest: Shifting investments in diameter growth and height growth. J. Trop. Ecol. 2015, 31, 519–529. [Google Scholar] [CrossRef]
- Coopersmith, D.J.; Hall, E. Experimental Project 1077: The Siphon Creek Mixedwood Trial: The Use of a Simple Height-to-Diameter Ratio to Predict the Growth Success of Planted White Spruce Seedlings Beneath Aspen Canopies; Prince George Forest Region, Forest Resources and Practices Team: Prince George, BC, Canada, 1999. [Google Scholar]
- Noyer, E.; Ningre, F.; Dlouhá, J.; Fournier, M.; Collet, C. Time shifts in height and diameter growth allocation in understory European beech (Fagus sylvatica L.) following canopy release. Trees 2018, 33, 333–344. [Google Scholar] [CrossRef]
Figure 1.
Canopy gaps of different sizes in a tropical moist semi-deciduous forest. Source: authors’ own construct (2021).
Figure 1.
Canopy gaps of different sizes in a tropical moist semi-deciduous forest. Source: authors’ own construct (2021).
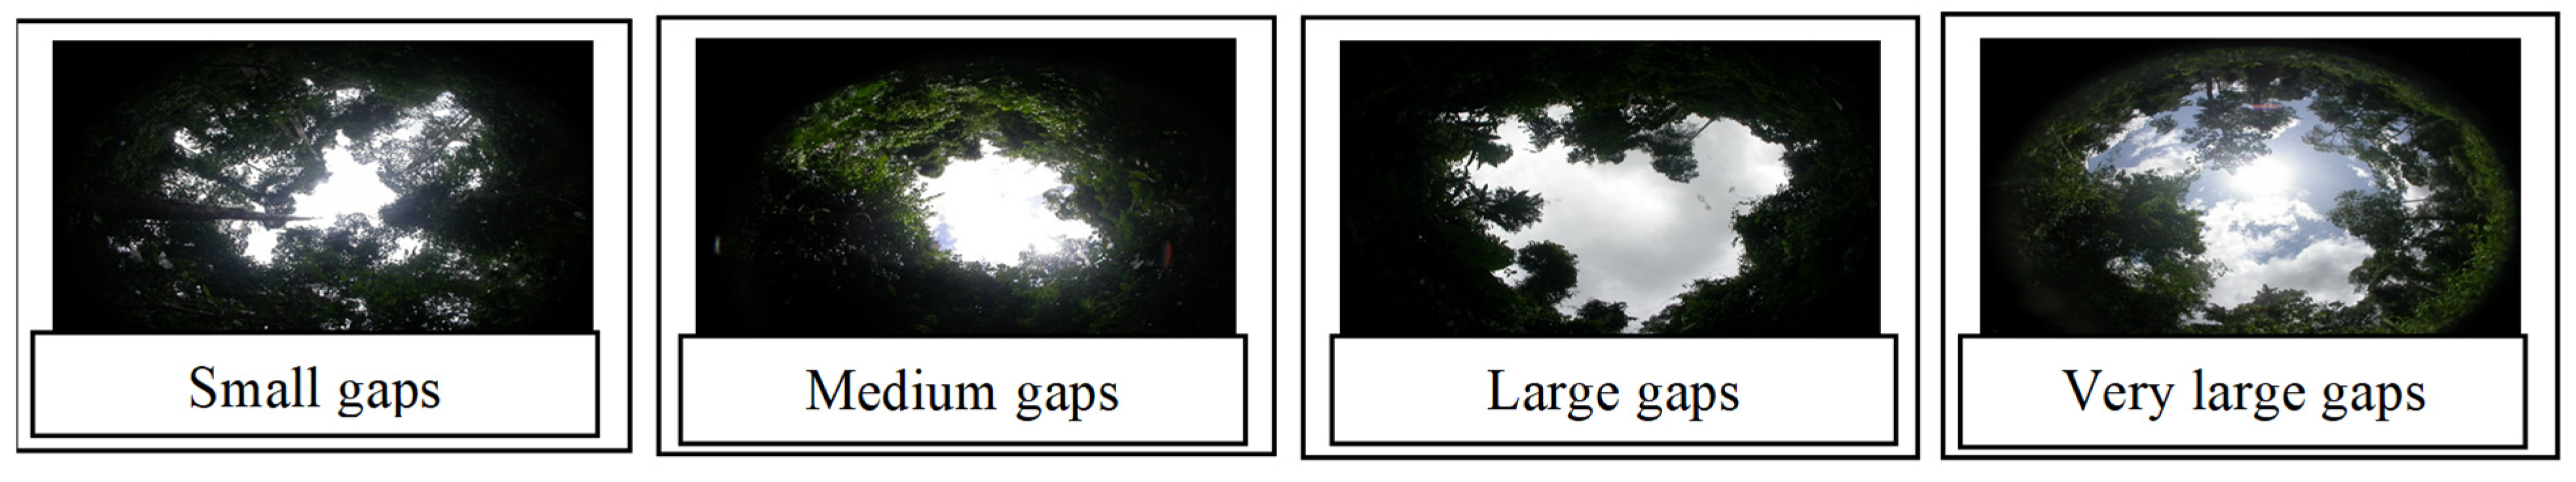
Figure 2.
Plate of 7 assessed biodiversity indices (where, S is the number of taxa, n is the total number of individuals, D is dominance, ni is the number of individuals of taxon ith, in is the logarithm, a is Fisher’s alpha, Nmax is the total number of individuals of the most abundant species, F1 is the number of singly regenerated species and F2 is the number of doubleton regenerated species).
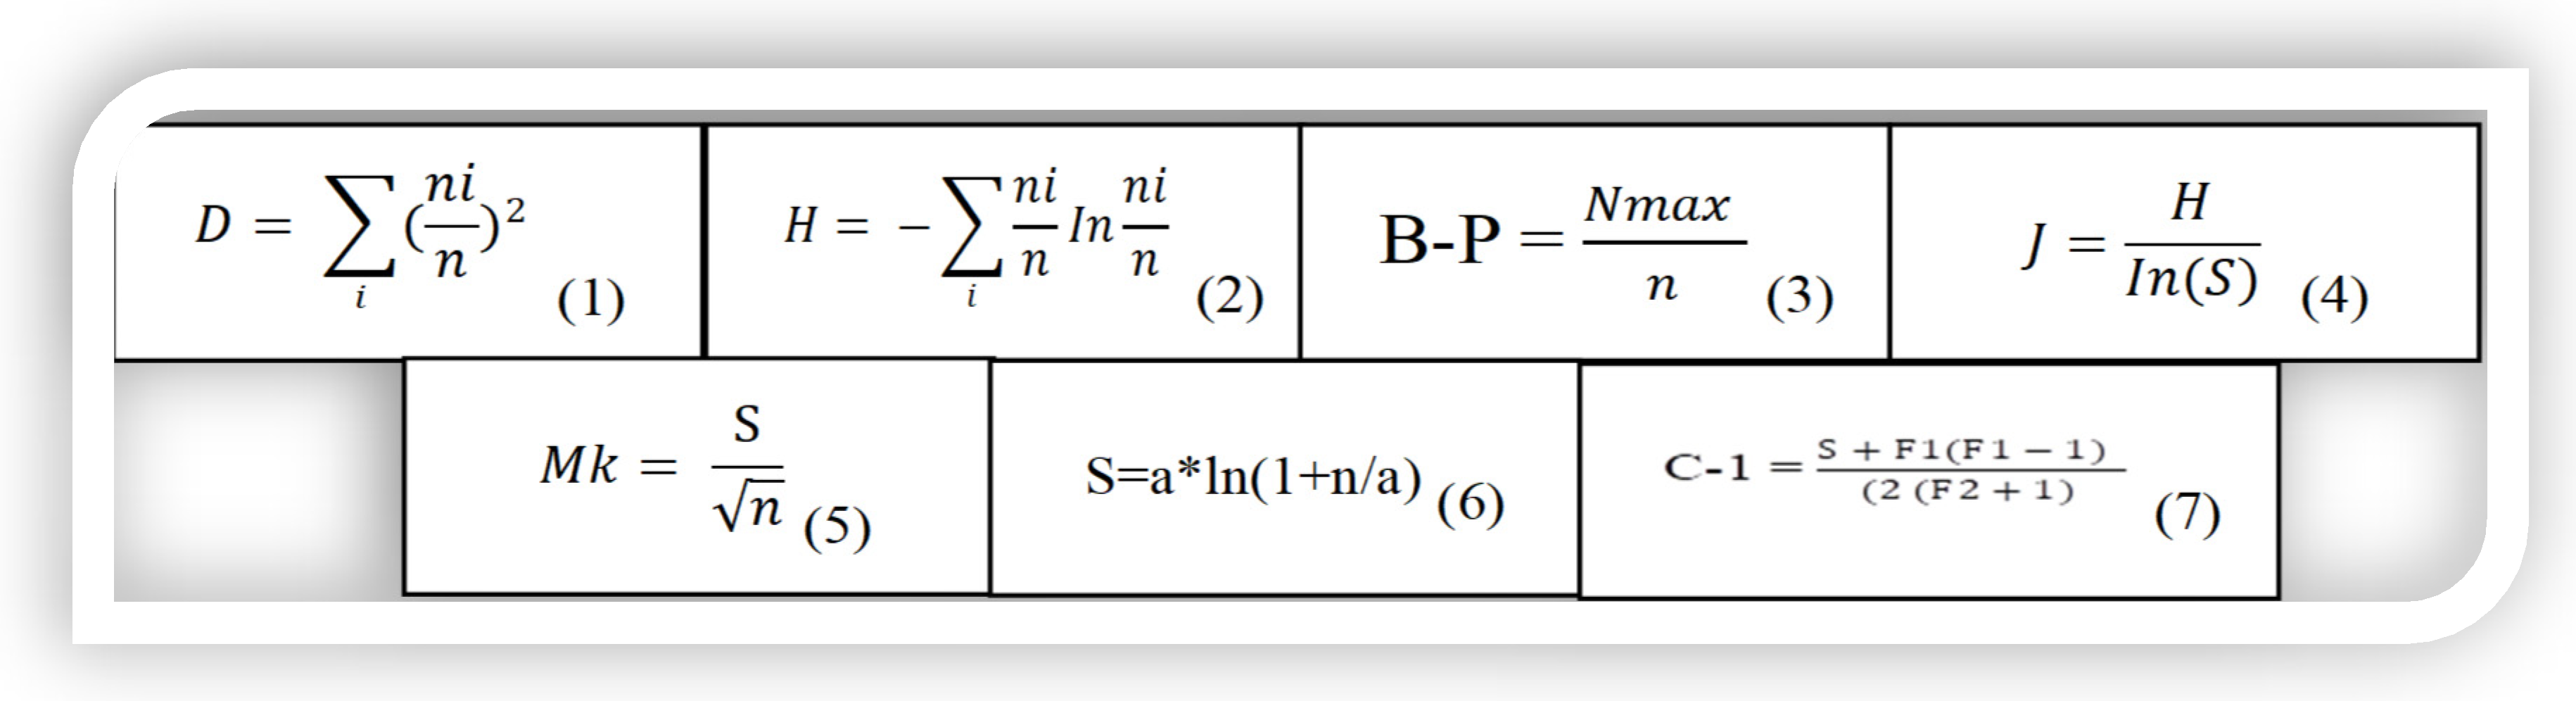
Figure 3.
Multiple comparison of different naturally regenerated tree species in small (n = 2); medium (n = 7); large (n = 11); and very large (n = 3) gaps. Bars with *** denote significant differences at p-value < 0.001 significance level while bars with ns denote not significant differences at p-value > 0.05 significance level.
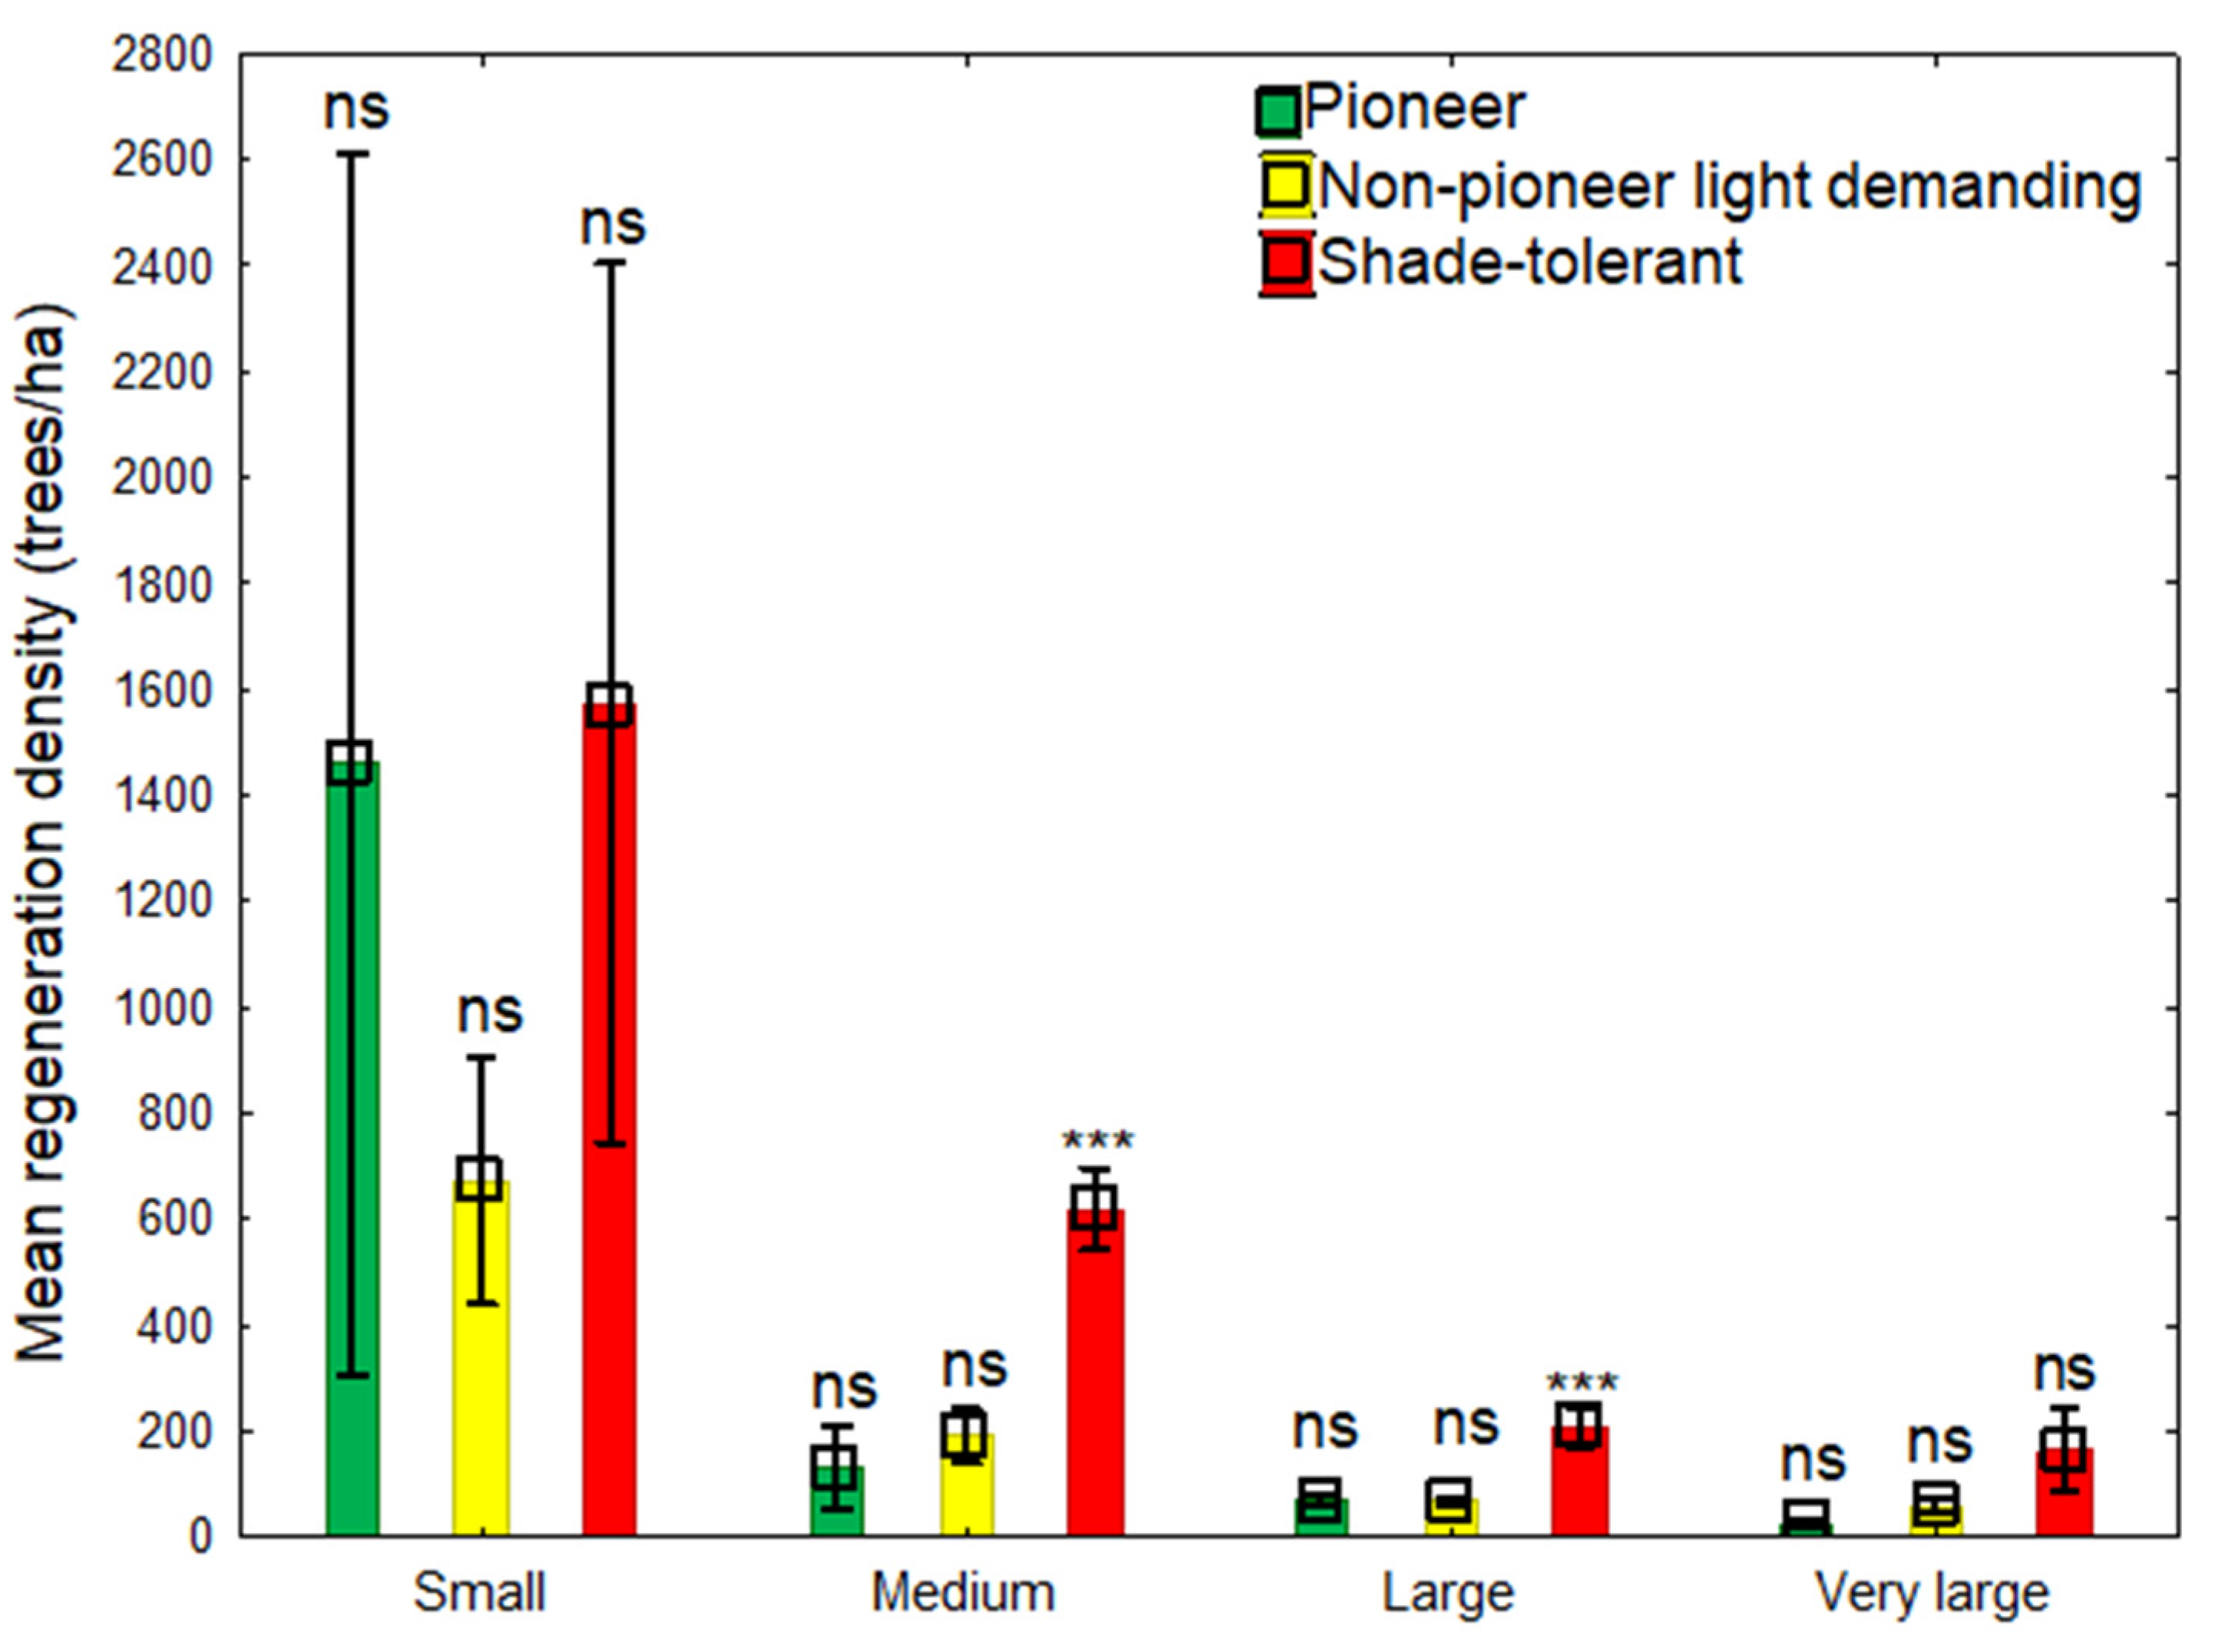
Figure 4.
Multiple comparison of diameter (left) and height (right) growths of different naturally regenerated tree species in small (n =2); medium (n = 7); large (n = 11); and very large (n = 3) gaps.
Figure 4.
Multiple comparison of diameter (left) and height (right) growths of different naturally regenerated tree species in small (n =2); medium (n = 7); large (n = 11); and very large (n = 3) gaps.

Table 1.
Presenting total individuals (N), Taxa (S), Simpson’s index (1-D), Shannon diversity index (H), Berger–Parker dominance (B-P), Menhinick richness index (Mk), Pielous evenness (J), Fisher alpha (α) and Chao-1 (C-1) biodiversity indices to express species diversity of naturally regenerated tree species in gaps of different sizes at tropical moist semi-deciduous forest in Ghana.
| Gap ID (Size/Area m2) | Estimated Biodiversity Indices | |||||||||
|---|---|---|---|---|---|---|---|---|---|---|
| N | S | 1-D | H | B-P | J | Mk | α | C-1 | ||
| Gap1(Large/1896) | 123 | 29 | 0.87 | 2.60 | 0.29 | 0.78 | 2.49 | 11.14 | 29.41 | |
| Gap2(Medium/782) | 90 | 16 | 0.56 | 1.49 | 0.65 | 0.54 | 1.62 | 5.32 | 24.78 | |
| Gap3(Medium/782) | 57 | 11 | 0.65 | 1.56 | 0.55 | 0.65 | 1.46 | 4.06 | 17.72 | |
| Gap4(Large/1252) | 35 | 13 | 0.85 | 2.18 | 0.26 | 0.87 | 2.08 | 6.83 | 28.08 | |
| Gap5(Large/1098) | 46 | 17 | 0.87 | 2.39 | 0.25 | 0.86 | 2.36 | 8.78 | 34.62 | |
| Gap6(Very large/2557) | 102 | 14 | 0.77 | 1.86 | 0.36 | 0.72 | 1.32 | 4.11 | 20.57 | |
| Gap7(Large/1244) | 48 | 15 | 0.85 | 2.27 | 0.28 | 0.84 | 2.12 | 7.21 | 22.32 | |
| Gap8(Large/1457) | 12 | 9 | 0.84 | 1.96 | 0.25 | 0.94 | 2.31 | 12.50 | 14.03 | |
| Gap9(Medium/692) | 25 | 13 | 0.84 | 2.18 | 0.29 | 0.88 | 2.40 | 9.34 | 25.67 | |
| Gap10(Large/1249) | 52 | 11 | 0.81 | 1.95 | 0.31 | 0.81 | 1.48 | 4.07 | 17.67 | |
| Gap11(Large/1425) | 73 | 15 | 0.79 | 2.03 | 0.37 | 0.76 | 1.64 | 5.18 | 22.67 | |
| Gap12(Large/1420) | 37 | 9 | 0.83 | 1.94 | 0.27 | 0.89 | 1.48 | 3.79 | 12.00 | |
| Gap13(Large/1647) | 33 | 9 | 0.73 | 1.63 | 0.39 | 0.77 | 1.45 | 3.62 | 13.50 | |
| Gap14(Large/1058) | 39 | 15 | 0.86 | 2.29 | 0.25 | 0.87 | 2.24 | 7.92 | 23.31 | |
| Gap15(Very large/2728) | 20 | 9 | 0.83 | 1.95 | 0.27 | 0.90 | 1.94 | 5.84 | 14.42 | |
| Gap16(Large/1664) | 50 | 19 | 0.88 | 2.48 | 0.23 | 0.86 | 2.55 | 10.17 | 34.70 | |
| Gap17(Very large/2005) | 57 | 19 | 0.90 | 2.60 | 0.18 | 0.89 | 2.43 | 9.39 | 27.78 | |
| Gap18(Small/296) | 44 | 18 | 0.91 | 2.62 | 0.17 | 0.91 | 2.61 | 10.60 | 24.67 | |
| Gap19(Small/287) | 170 | 19 | 0.79 | 2.05 | 0.37 | 0.70 | 1.46 | 5.48 | 23.38 | |
| Gap20(Medium/607) | 108 | 29 | 0.91 | 2.81 | 0.18 | 0.84 | 2.76 | 12.75 | 42.05 | |
| Gap21(Medium/884) | 88 | 15 | 0.77 | 1.89 | 0.37 | 0.71 | 1.49 | 4.72 | 21.17 | |
| Gap22(Medium/971) | 100 | 20 | 0.71 | 1.98 | 0.51 | 0.66 | 2.00 | 7.52 | 37.00 | |
| Gap23(Medium/837) | 59 | 17 | 0.80 | 2.13 | 0.37 | 0.76 | 2.08 | 7.27 | 31.94 | |
| df | 22 | 22 | 22 | 22 | 22 | 22 | 22 | |||
| F-ratio | 5.94 | 7.52 | 4.21 | 6.04 | 15.37 | 7.72 | 2.15 | |||
| p-value | *** | *** | *** | *** | *** | *** | * | |||
Total number (n) presents individual species. Taxa (S) is the number of presented species. p < 0.001 (***) significance level, p < 0.05 (*) significance level.
Publisher’s Note: MDPI stays neutral with regard to jurisdictional claims in published maps and institutional affiliations. |
© 2021 by the authors. Licensee MDPI, Basel, Switzerland. This article is an open access article distributed under the terms and conditions of the Creative Commons Attribution (CC BY) license (https://creativecommons.org/licenses/by/4.0/).
Share and Cite
MDPI and ACS Style
Hammond, M.E.; Pokorný, R. Impact of Canopy Gap Ecology on the Diversity and Dynamics of Natural Regeneration in a Tropical Moist Semi-Deciduous Forest, Ghana. Biol. Life Sci. Forum 2021, 2, 10. https://doi.org/10.3390/BDEE2021-09455
AMA Style
Hammond ME, Pokorný R. Impact of Canopy Gap Ecology on the Diversity and Dynamics of Natural Regeneration in a Tropical Moist Semi-Deciduous Forest, Ghana. Biology and Life Sciences Forum. 2021; 2(1):10. https://doi.org/10.3390/BDEE2021-09455
Chicago/Turabian StyleHammond, Maame Esi, and Radek Pokorný. 2021. "Impact of Canopy Gap Ecology on the Diversity and Dynamics of Natural Regeneration in a Tropical Moist Semi-Deciduous Forest, Ghana" Biology and Life Sciences Forum 2, no. 1: 10. https://doi.org/10.3390/BDEE2021-09455