
Use of Statistical Approach Combined with SAR Polarimetric Indices for Surface Moisture Estimation over Bare Agricultural Soil †


Abstract
:1. Introduction
2. Experiments
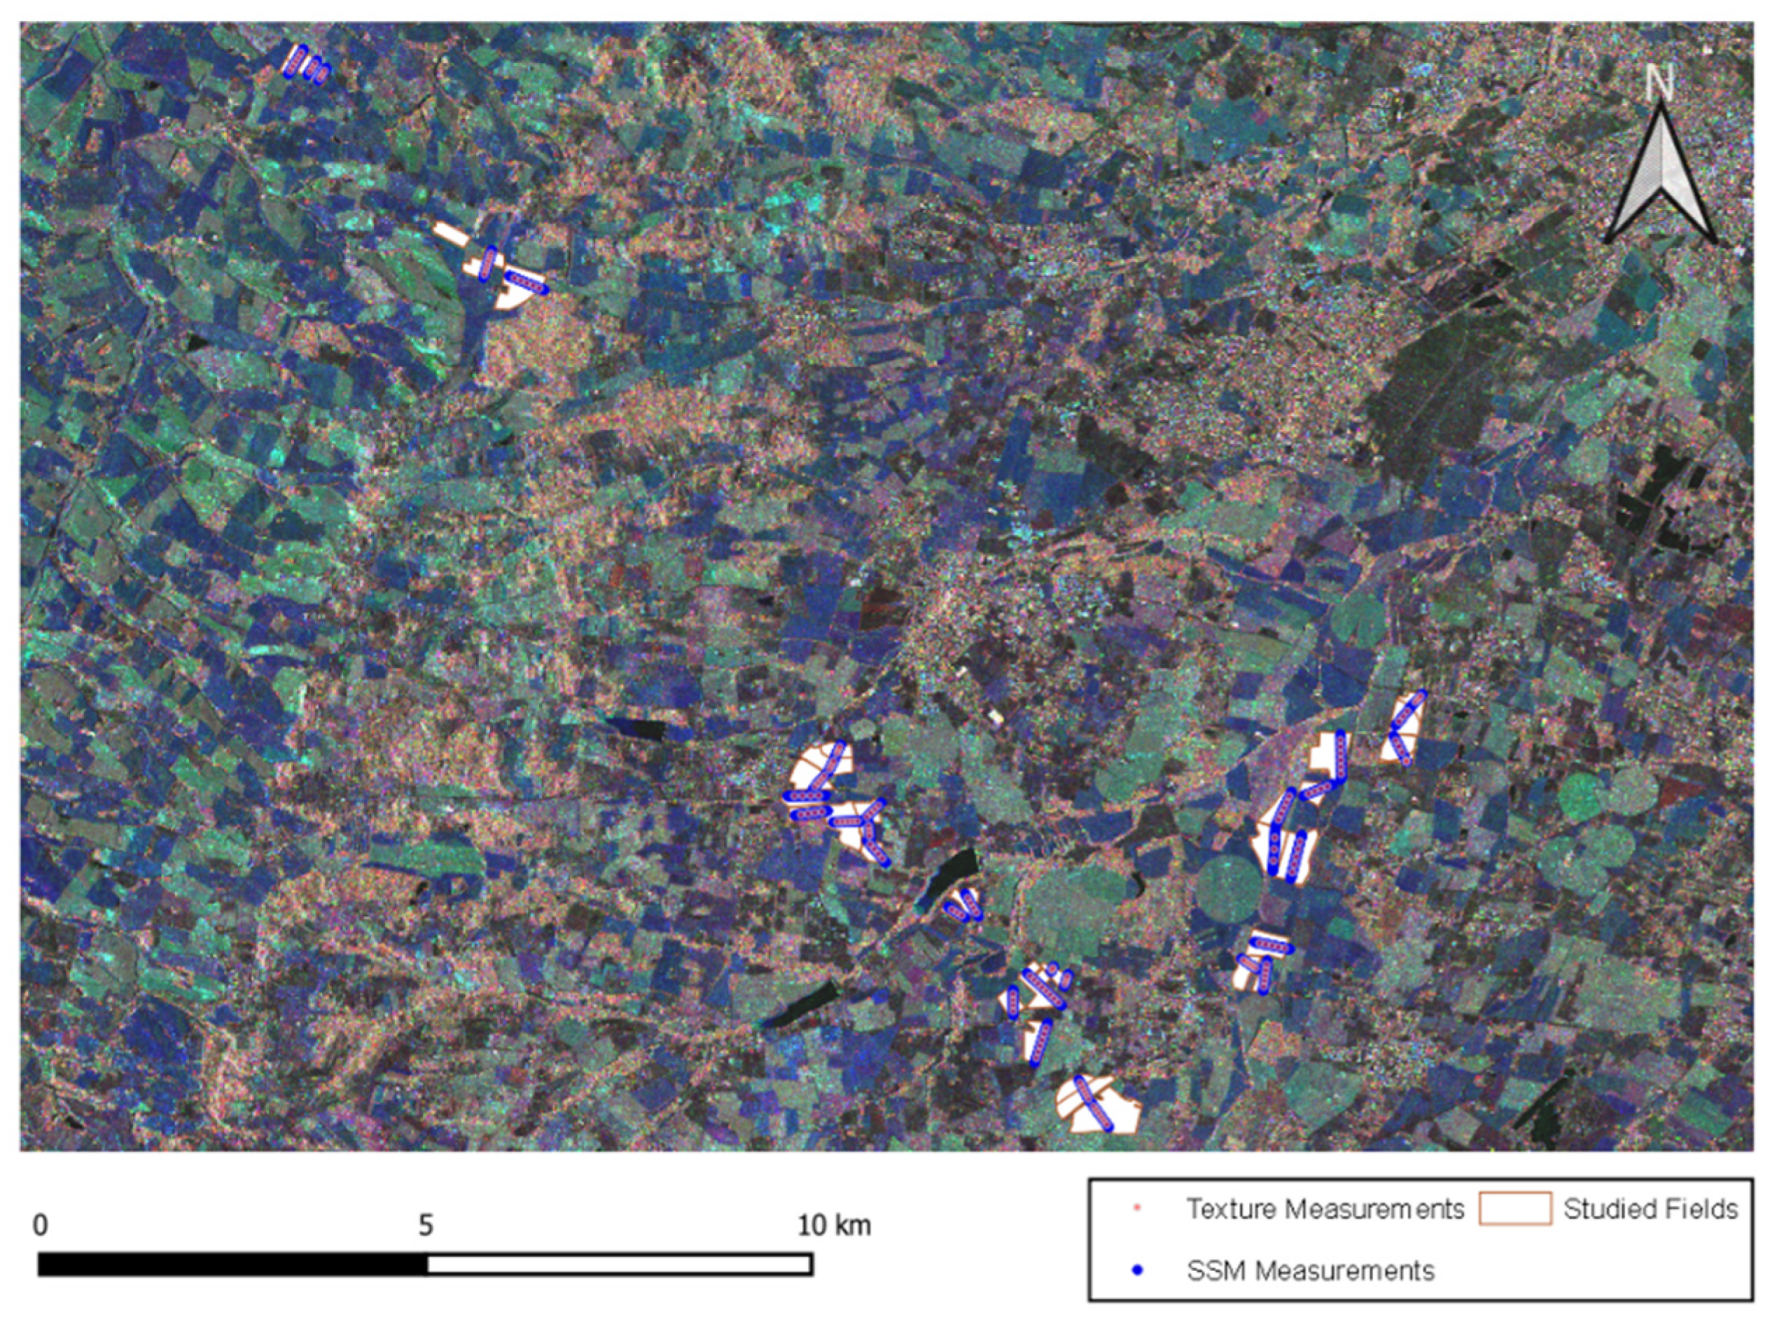
2.1. Study Site
2.2. Materials
2.2.1. In Situ Data
- Surface soil moisture
- Soil texture
- Surface roughness
2.2.2. Radarsat-2 Satellite Data
2.3. Method
2.3.1. Images Processing
2.3.2. From Satellite Signals to SSM Estimates
3. Results
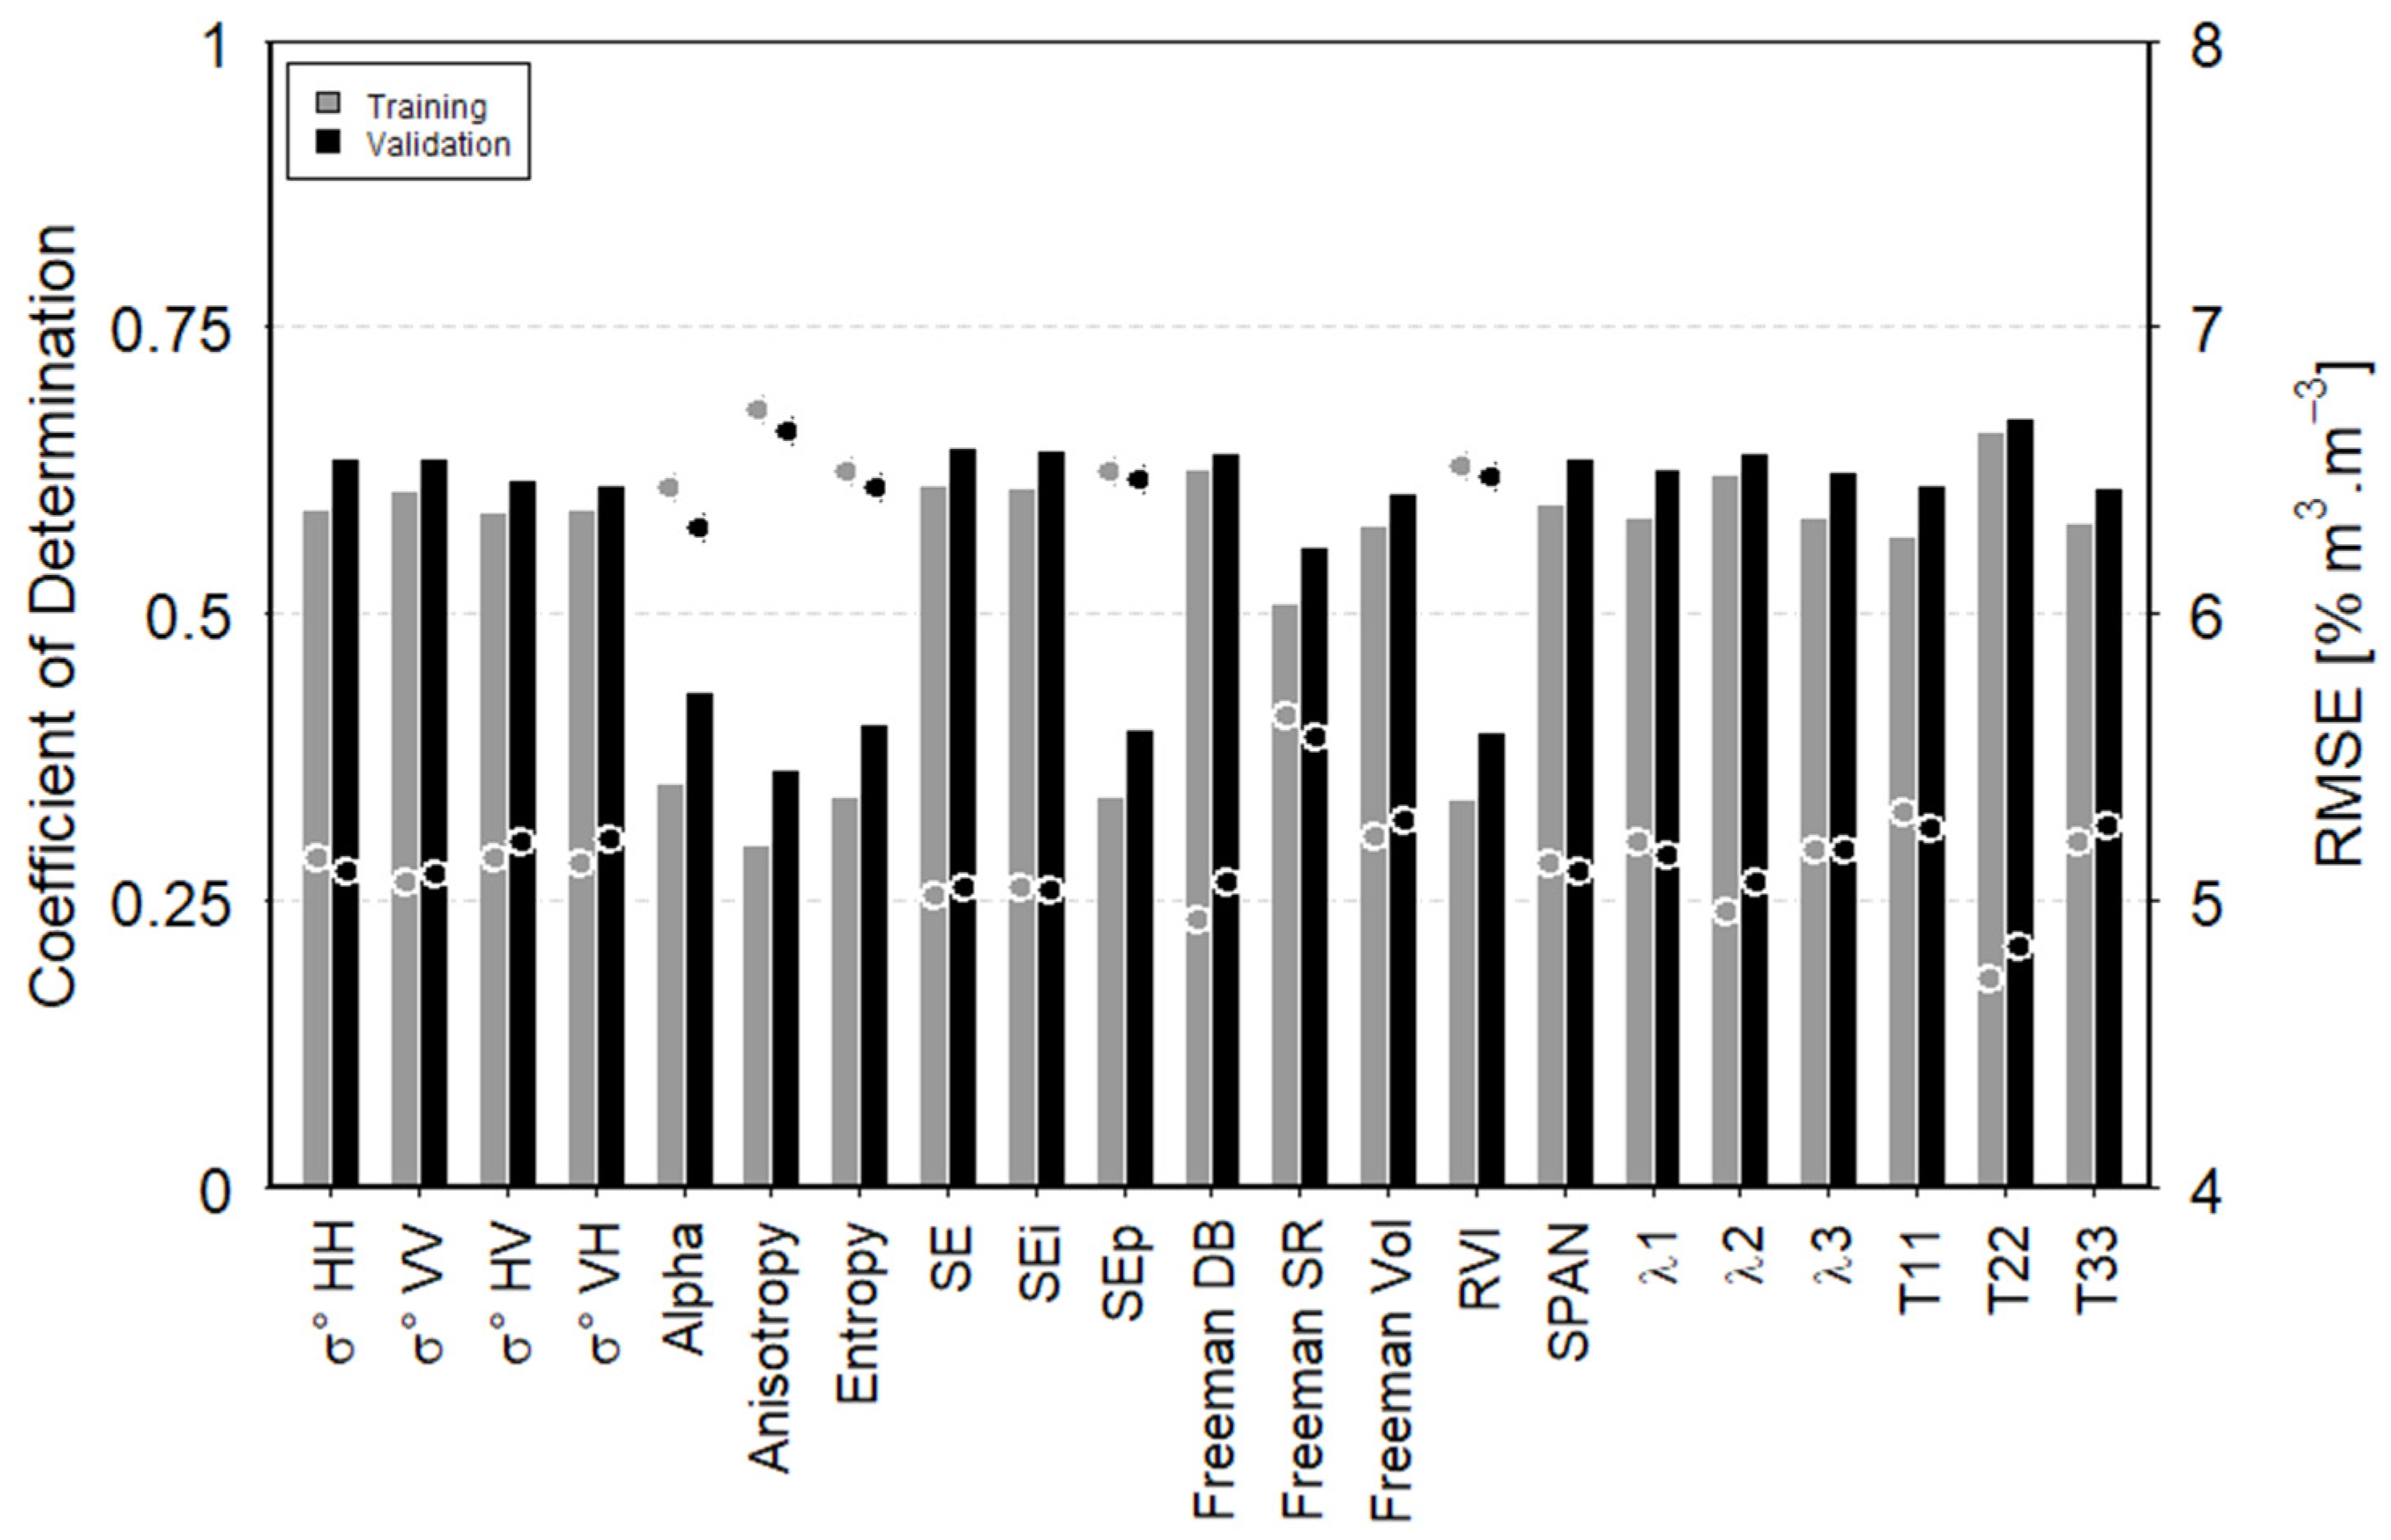
3.1. Comparison of Statistical Performances Obtained Using Parameters Derived from SAR Images
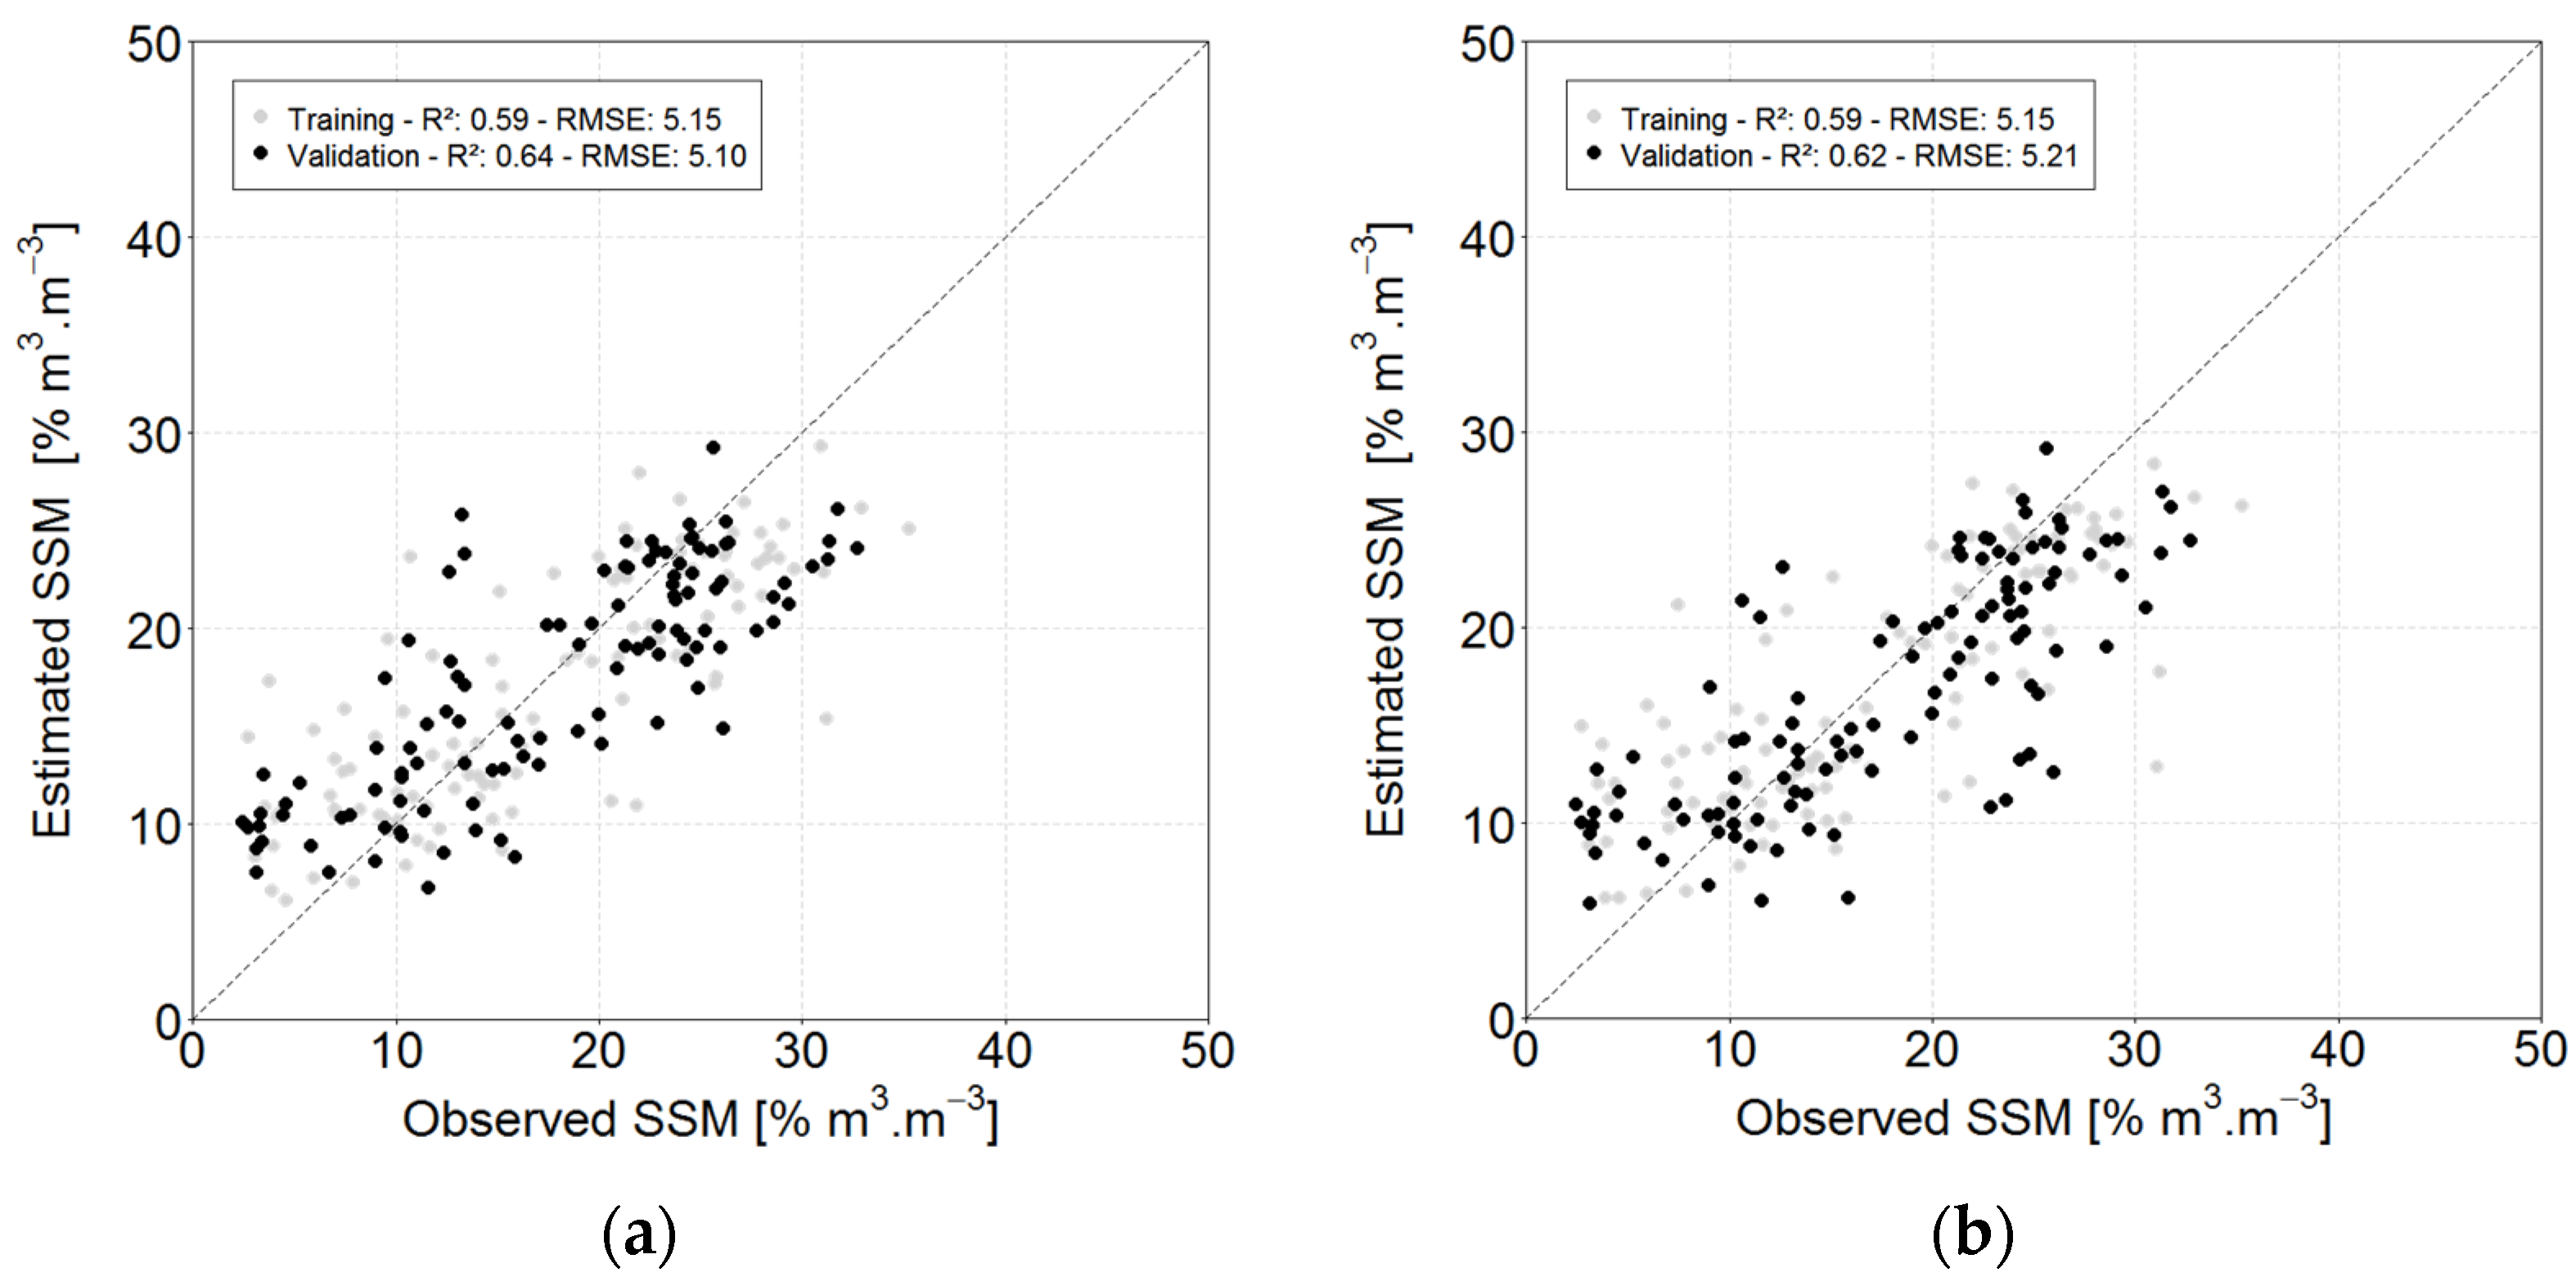
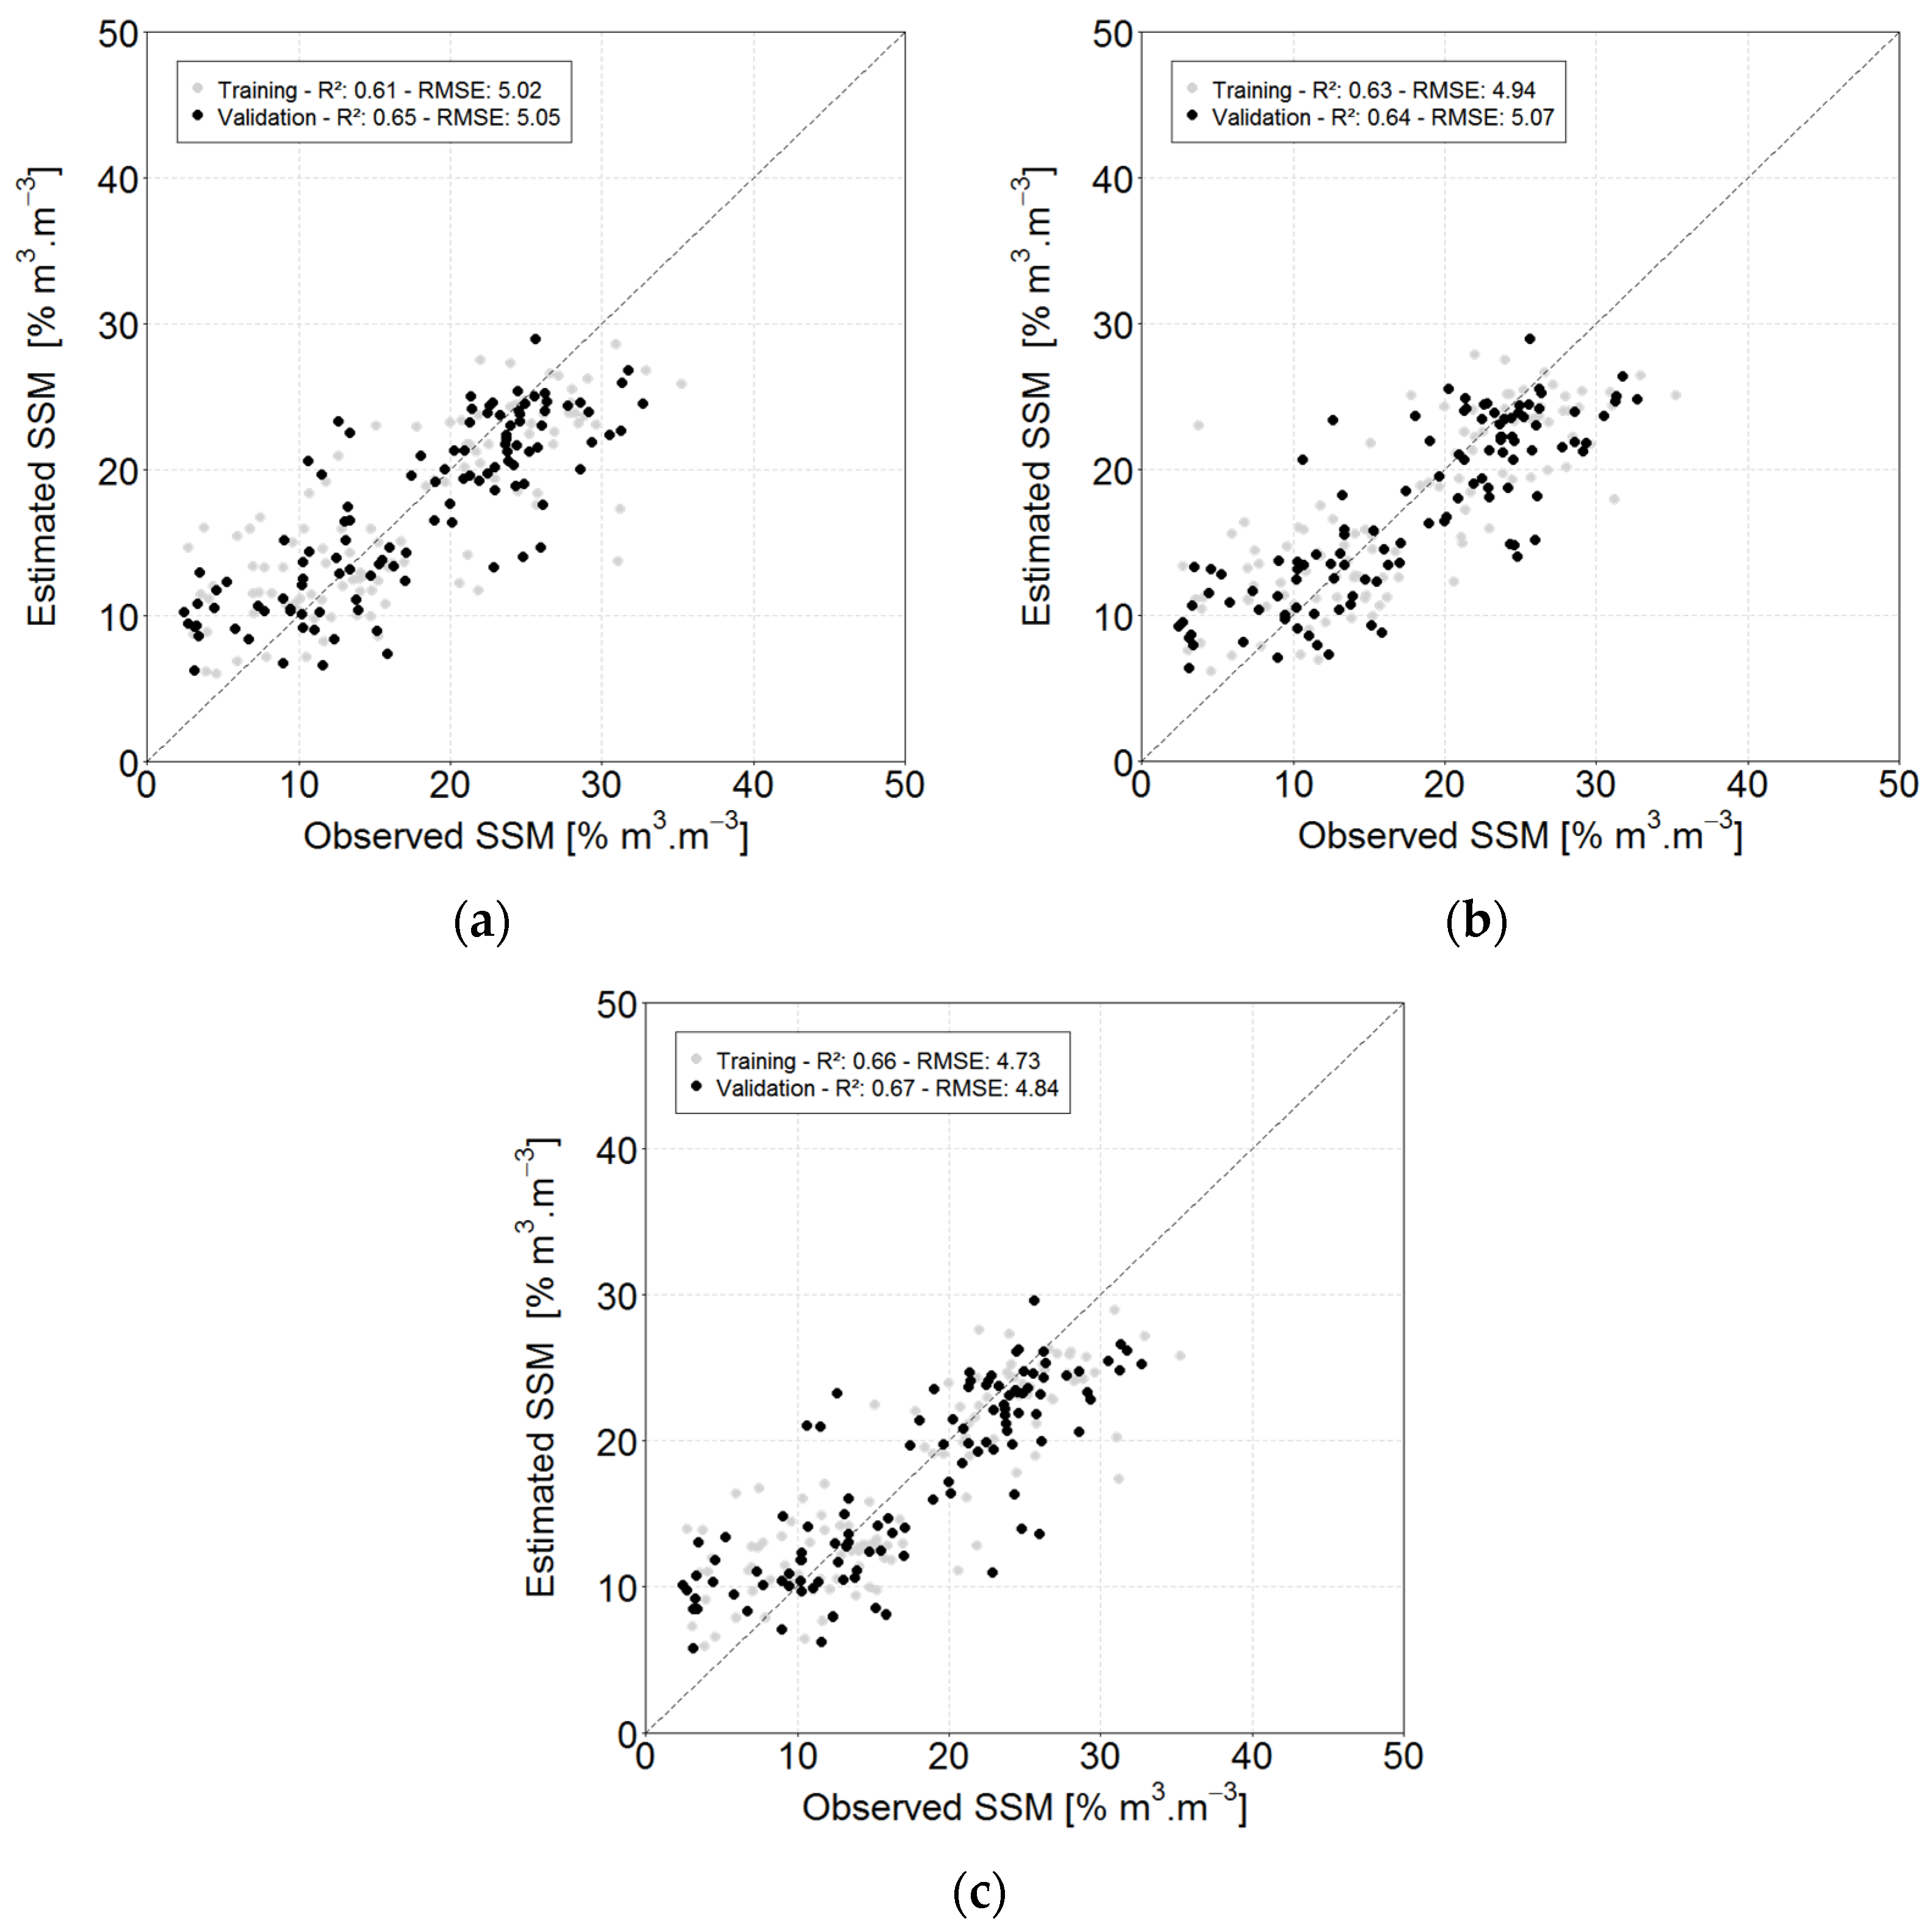
3.2. Focus on Promising Parameters Derived from the C-Band Images
4. Discussion
5. Conclusions
Author Contributions
Institutional Review Board Statement
Informed Consent Statement
Data Availability Statement
Acknowledgments
Conflicts of Interest
References
- Zribi, M.; Le Hégarat-Mascle, S.; Ottlé, C.; Kammoun, B.; Guerin, C. Surface soil moisture estimation from the synergistic use of the (multi-incidence and multi-resolution) active microwave ERS Wind Scatterometer and SAR data. Remote Sens. Environ. 2003, 86, 30–41. [Google Scholar] [CrossRef]
- Fieuzal, R.; Duchemin, B.; Jarlan, L.; Zribi, M.; Baup, F.; Merlin, O.; Hagolle, O.; Garatuza-Payan, J. Combined use of optical and radar satellite data for the monitoring of irrigation and soil moisture of wheat crops. Hydrol. Earth Syst. Sci. 2011, 15, 1117–1129. [Google Scholar] [CrossRef]
- Gherboudj, I.; Magagi, R.; Berg, A.A.; Toth, B. Soil moisture retrieval over agricultural fields from multi-polarized and multi-angular RADARSAT-2 SAR data. Remote Sens. Environ. 2011, 115, 33–43. [Google Scholar] [CrossRef]
- Baghdadi, N.; Cresson, R.; Pottier, E.; Aubert, M.; Zribi, M.; Jacome, A.; Benabdallah, S. A potential use for the C-band polarimetric SAR parameters to characterize the soil surface over bare agriculture fields. IEEE Trans. Geosci. Remote Sens. 2012, 50, 3844–3858. [Google Scholar] [CrossRef]
- Baghdadi, N.; Dubois-Fernandez, P.; Dupuis, X.; Zribi, M. Sensitivity of main polarimetric parameters of multifrequency polarimetric SAR data to soil moisture and surface roughness over bare agricultural soils. IEEE Geosci. Remote Sens. Lett. 2013, 10, 731–735. [Google Scholar] [CrossRef]
- Yang, L.; Feng, X.; Liu, F.; Liu, J.; Sun, X. Potential of soil moisture estimation using C-band polarimetric SAR data in arid regions. Int. J. Remote Sens. 2019, 40, 2138–2150. [Google Scholar] [CrossRef]
- Hajnsek, I.; Jagdhuber, T.; Schon, H.; Papathanassiou, K.P. Potential of estimating soil moisture under vegetation cover by means of PolSAR. IEEE Trans. Geosci. Remote Sens. 2009, 47, 442–454. [Google Scholar] [CrossRef]
- Wang, H.; Magagi, R.; Goita, K.; Jagdhuber, T.; Hajnsek, I. Evaluation of simplified polarimetric decomposition for soil moisture retrieval over vegetated agricultural fields. Remote Sens. 2016, 8, 142. [Google Scholar] [CrossRef]
- Wang, H.; Magagi, R.; Goita, K. Comparison of different polarimetric decompositions for soil moisture retrieval over vegetation covered agricultural area. Remote Sens. Environ. 2017, 199, 120–136. [Google Scholar] [CrossRef]
- Baup, F.; Fieuzal, R.; Marais-Sicre, C.; Dejoux, J.-F.; le Dantec, V.; Mordelet, P.; Claverie, M.; Hagolle, O.; Lopes, A.; Keravec, P.; et al. MCM’10: An experiment for satellite multi-sensors crop monitoring from high to low resolution observations. In Proceedings of the 2012 IEEE International Geoscience and Remote Sensing Symposium, Munich, Germany, 22–27 July 2012; pp. 4849–4852. [Google Scholar]
- Morena, L.C.; James, K.V.; Beck, J. An introduction to the RADARSAT-2 mission. Can. J. Remote Sens. 2004, 30, 221–234. [Google Scholar] [CrossRef]
- Pottier, E.; Ferro-Famil, L. PolSARPro V5.0: An ESA educational toolbox used for self-education in the field of POLSAR and POL-INSAR data analysis. In Proceedings of the 2012 IEEE International Geoscience and Remote Sensing Symposium, Munich, Germany, 22–27 July 2012; pp. 7377–7380. [Google Scholar]
- Breiman, L. Random Forests. Mach. Learn. 2001, 45, 5–32. [Google Scholar] [CrossRef]
- Ulaby, F.T.; Batlivala, P.P.; Dobson, M.C. Microwave backscatter dependence on surface roughness, soil moisture, and soil texture: Part I-Bare Soil. IEEE Trans. Geosci. Electron. 1978, 16, 286–295. [Google Scholar] [CrossRef]
- Hallikainen, M.T.; Ulaby, F.T.; Dobson, M.C.; El-Rayes, M.A.; Lil-Kun, W. Microwave dielectric behavior of wet soil—Part 1: Empirical models and experimental observations. IEEE Trans. Geosci. Remote Sens. 1985, 23, 25–34. [Google Scholar] [CrossRef]
- Fieuzal, R.; Baup, F. Improvement of bare soil semiempirical radar backscattering models (Oh and Dubois) with SAR multi-spectral satellite data (at X, C and L bands). Adv. Remote Sens. 2016, 5, 296–314. [Google Scholar] [CrossRef]
- Fieuzal, R.; Baup, F. Statistical estimation of backscattering coefficients in X-band over bare agricultural aoils. In Proceedings of the 2020 Mediterranean and Middle-East Geoscience and Remote Sensing Symposium (M2GARSS), Tunis, Tunisia, 9–11 March 2020; pp. 302–305. [Google Scholar]


| Mode | Acquisition Date (MM/DD) | Pass | Incidence | Pixel |
|---|---|---|---|---|
| Angle | Size | |||
| (°) | (m) | |||
| FQ5 | 03/05; 11/24 | A | 23.3–25.3 | 4.7 × 4.9 |
| FQ6 | 10/21; 11/14 | D | 24.6–26.5 | 4.7 × 4.7 |
| FQ10 | 02/26; 04/15; 05/09; 09/30 | A | 29.1–30.9 | 4.7 × 5.1 |
| FQ11 | 03/26; 08/17 | D | 30.2–32.0 | 4.7 × 5.5 |
| FQ15 | 03/15; 04/08; 05/02; 08/30; 10/17 | A | 34.3–36.0 | 4.7 × 4.8 |
| FQ16 | 05/20; 07/31; 10/11 | D | 35.4–37.0 | 4.7 × 5.1 |
| FQ20 | 11/03 | A | 39.1–40.7 | 4.7 × 4.8 |
| FQ21 | 02/20; 03/16; 07/14 | D | 40.1–41.6 | 4.7 × 5.1 |
Publisher’s Note: MDPI stays neutral with regard to jurisdictional claims in published maps and institutional affiliations. |
© 2020 by the authors. Licensee MDPI, Basel, Switzerland. This article is an open access article distributed under the terms and conditions of the Creative Commons Attribution (CC BY) license (https://creativecommons.org/licenses/by/4.0/).
Share and Cite
Fieuzal, R.; Baup, F. Use of Statistical Approach Combined with SAR Polarimetric Indices for Surface Moisture Estimation over Bare Agricultural Soil. Environ. Sci. Proc. 2021, 5, 22. https://doi.org/10.3390/IECG2020-08543
Fieuzal R, Baup F. Use of Statistical Approach Combined with SAR Polarimetric Indices for Surface Moisture Estimation over Bare Agricultural Soil. Environmental Sciences Proceedings. 2021; 5(1):22. https://doi.org/10.3390/IECG2020-08543
Chicago/Turabian StyleFieuzal, Rémy, and Frédéric Baup. 2021. "Use of Statistical Approach Combined with SAR Polarimetric Indices for Surface Moisture Estimation over Bare Agricultural Soil" Environmental Sciences Proceedings 5, no. 1: 22. https://doi.org/10.3390/IECG2020-08543
APA StyleFieuzal, R., & Baup, F. (2021). Use of Statistical Approach Combined with SAR Polarimetric Indices for Surface Moisture Estimation over Bare Agricultural Soil. Environmental Sciences Proceedings, 5(1), 22. https://doi.org/10.3390/IECG2020-08543