Remote Sens. 2023, 15(3), 550; https://doi.org/10.3390/rs15030550 - 17 Jan 2023
Cited by 13 | Viewed by 2757
Abstract
Understanding the hydrological surface condition changes, climate change and their combined impacts on flood runoff are critical for comprehending the hydrology under environmental changes and for solving future flood management challenges. This study was designed to examine the relative contributions of the hydrological
[...] Read more.
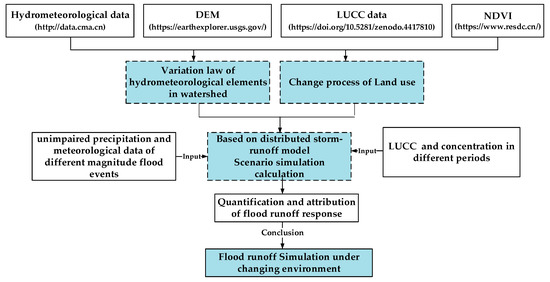
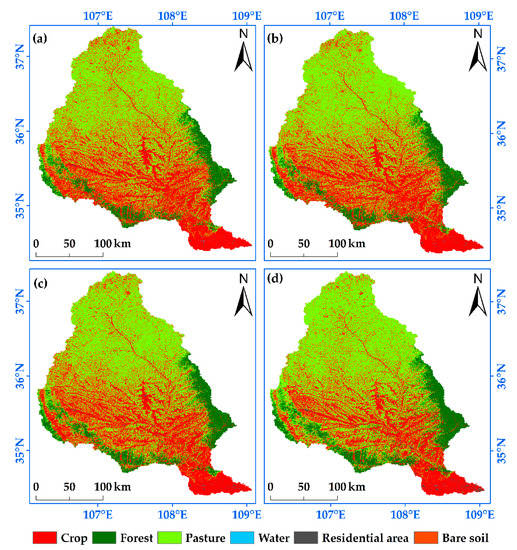
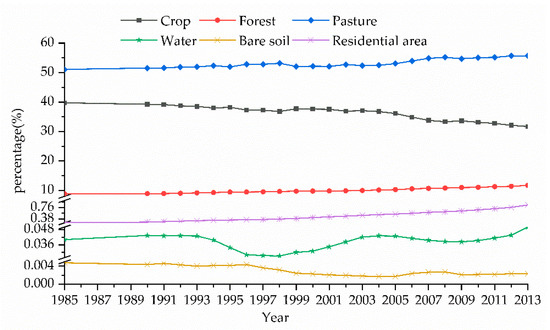
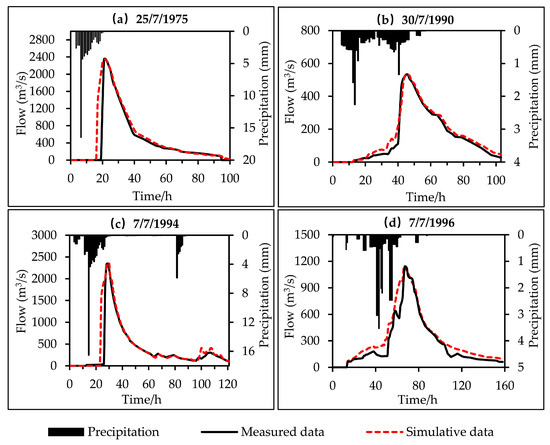
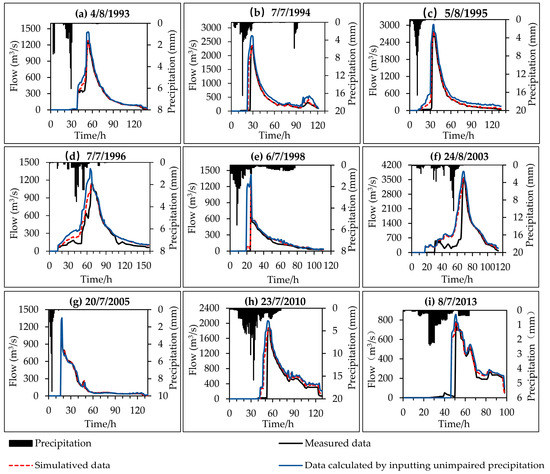
Understanding the hydrological surface condition changes, climate change and their combined impacts on flood runoff are critical for comprehending the hydrology under environmental changes and for solving future flood management challenges. This study was designed to examine the relative contributions of the hydrological surface condition changes and climate change in the flood runoff of a 45,421-km2 watershed in the Loess Plateau region. Statistical analytical methods, including Kendall’s trend test, the Theisen median trend analysis, and cumulative anomaly method, were used to detect trends in the relationship between the climatic variables, the normalized difference vegetation index (NDVI), land use/cover change (LUCC) data, and observed flood runoff. A grid-cell distributed rainfall–runoff model was used to detect the quantitative hydrologic responses to the climatic variability and land-use change. We found that climatic variables were not statistically significantly different (p > 0.05) over the study period. From 1985 to 2013, the cropland area continued to decrease, while the forest land, pastures, and residential areas increased in the Jinghe River Basin. Affected by LUCC and climate change, the peak discharges and flood volumes decreased by 8–22% and 5–67%, respectively. This study can provide a reference for future land-use planning and flood runoff control policy formulation and for revision in the study area.
Full article
(This article belongs to the Special Issue Remote Sensing in Natural Resource and Water Environment)
►
Show Figures
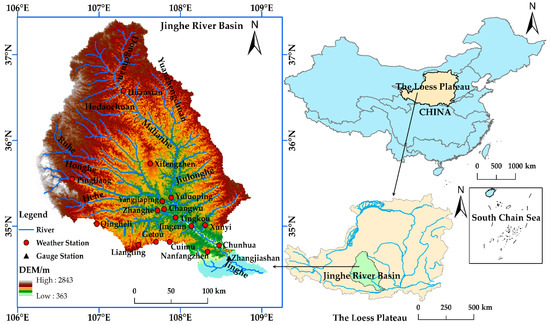
Figure 1


