Skip to Content

Risks

Risks is an international, scholarly, peer-reviewed, open access journal for research and studies on insurance and financial risk management. Risks is published monthly online by MDPI. 

Get Alerted

Add your email address to receive forthcoming issues of this journal.

All Articles (1,952)

Climate transition risks are increasingly relevant to financial development, particularly in resource-dependent economies. However, the existing literature has largely examined how financial development affects environmental outcomes, while the reverse relationship remains comparatively understudied. This study investigates whether carbon emissions and renewable energy consumption influence financial development in Kazakhstan over 1996–2024, controlling for economic growth, inflation, and foreign direct investment. Financial development is measured by domestic credit to the private sector provided by banks (% of GDP). Using the Autoregressive Distributed Lag (ARDL) bounds testing approach and accounting for structural breaks, the study examines short-run and long-run dynamics. The results confirm a long-run equilibrium relationship among the variables, but none of the individual long-run coefficients is statistically significant. This finding does not imply that climate-transition factors are economically irrelevant; rather, it suggests that their effects have not yet translated into persistent, statistically identifiable changes in aggregate bank-based financial development. In the short run, economic growth has a positive effect, while inflation has a negative effect, with renewable energy consumption and foreign direct investment showing lagged effects. The study contributes new evidence on the climate–finance nexus from a resource-dependent transition economy and highlights the evolving, but still limited, transmission of climate-transition dynamics through Kazakhstan’s banking system.

Risks

11 September 2026
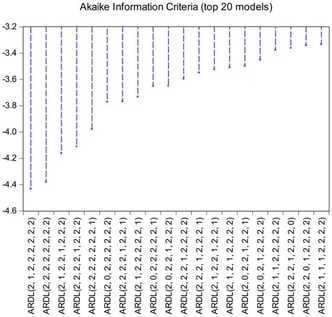
Selection of the ARDL Model.

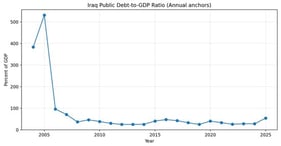
This study examines the dynamic interactions among gross domestic product (GDP), external public debt, and domestic public debt in Iraq and discusses their implications for fiscal sustainability. The observed annual data cover the period 2005–2024, while the values for 2025 are based on IMF projections. Because continuous official monthly observations were unavailable, the annual series were temporally disaggregated using cubic-spline interpolation to construct an analytical monthly series. These interpolated values do not represent additional independent observations; therefore, the empirical findings are interpreted as exploratory. A recursive Structural Vector Autoregression (SVAR) model was estimated using Cholesky identification with the ordering GDP, external debt, and domestic debt. The variables were transformed into second differences in their natural logarithms, and a three-lag specification was employed. Impulse-response functions and forecast-error variance decomposition were used to examine the transmission and relative importance of the identified innovations. At the 24-month forecast horizon, GDP shocks explained 93.3% of GDP variation, while external debt was predominantly explained by its own shocks (86.3%). Domestic-debt variation was explained by its own shocks (47.3%), GDP shocks (44.1%), and external-debt shocks (8.6%). These results suggest that domestic debt is more closely associated with changes in domestic economic activity, whereas external debt follows a comparatively persistent path. The findings emphasize the importance of debt composition, non-oil revenue diversification, expenditure management, and coordination between domestic and external borrowing. Because oil revenues and government expenditure are not included as separate endogenous variables, the model does not directly identify oil-revenue or government-spending shocks. Future research should employ genuinely observed quarterly or monthly data and incorporate these fiscal variables explicitly.

Risks

11 September 2026

Public debt to GDP ratio.
  • Feature Paper
  • Article
  • Open Access

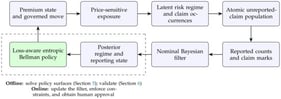
Non-life insurance pricing is forward-looking, yet its principal cost signal, reported claims, is delayed by the occurrence-to-reporting process. The rating cell is treated as a stylised, homogeneous unit without renewal, lapse, expiry, or cohort dynamics; a fully annual-contract formulation would require these dynamics to be modelled jointly with the risk and claims processes. This paper develops a partially observed risk-sensitive control framework in which premium-sensitive exposure generates claims in a latent risk regime, while unreported claims form an atomic population governed by an age-structured transport equation. The numerical instance solved and validated in this research restricts the general model to a memoryless (one-phase) reporting process for tractability. It is best matched to lines with predominantly short-to-medium reporting tails, rather than to the most extreme long-tailed liability or cyber exposures the general model is designed to eventually accommodate. A finite-state reporting reservoir and nominal Bayesian filter provide the decision state, and compound Poisson–Gamma loss enters an entropic Bellman recursion through a closed-form exponential-tilting identity, checked against an independently coded Bellman-residual test. Every dynamic policy is benchmarked against alternatives matched at the same risk-sensitivity parameter and evaluated using common random numbers. This is a general feature of the results, not a single statistic: CE0.8 is a standardised yardstick applied uniformly across strategies, while CEγ at the policy’s own γ is what that policy actually optimises, and the two need not agree. In 3000 out-of-model paths at γ = 1.2, the delay-aware dynamic policy increases mean profit by EUR 0.148 million and a standardised γeval = 0.8 certainty equivalent by EUR 0.034 million relative to a matched static price. Its fifth percentile and TVaR 5%, by contrast, are lower by EUR 0.056 and 0.078 million. At the policy’s own optimisation level, however, the γeval = 1.2 certainty-equivalent difference is EUR −0.006 million, with a 95% interval reaching zero. The dynamic policy, therefore, does not clearly outperform the matched static price on the exact objective it was optimised to maximise. Matched comparisons attribute EUR 0.039–0.043 million of mean profit to reporting-delay modelling and EUR 0.017 million to dynamic continuation. Separating state observation from transition-law knowledge attributes EUR 0.161–0.182 million to observing the regime exactly, and a small, sign-changing EUR −0.010 to +0.003 million to knowing the true transition law itself. Across an eight-scenario misspecification stress suite, the dynamic policy’s mean-profit advantage over the matched static price is directionally robust in seven of eight scenarios, but it reverses sign under a +30% true-severity shock, indicating that this advantage is sensitive to substantial severity misspecification specifically. Grid, Bellman-residual, and out-of-model filter diagnostics indicate that state reconstruction is economically primary, while entropy risk sensitivity is a secondary overlay whose apparent benefit depends materially on which certainty-equivalent level and evaluation model are used to judge it.

Risks

10 September 2026

Closed-loop architecture for delay-aware dynamic pricing. Blue boxes show the occurrence, reporting, and filtering components; the green box shows the pricing policy. The dashed box separates the offline policy-solution and validation stage (Section 5 and Section 6) from the online filter-update, governance, and approval stage.

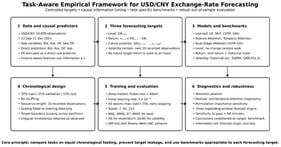
Exchange rate forecasting is a core issue in empirical finance, but in the majority of studies, the impact of target construction, feature representation, and model structure is not disaggregated, and the evaluation is confined to one prediction problem. The three tasks are: (1) prediction of ERt+1; (2) prediction of ; and (3) prediction of future volatility defined as the sample standard deviation of , where the horizon is the next 10 recorded observations. The seven model families are evaluated with a strict chronological 70%/15%/15% split; ER is excluded as a direct raw predictor, deep models use seeds 7, 42, and 123, and task-specific financial benchmarks are included. The findings reveal markedly different out-of-sample forecasting behavior across the three tasks. For level prediction, the no-change random walk gives RMSE = 0.0005923 and R2=0.99815, while Linear Regression gives RMSE = 0.0005939 and R2=0.99814; the difference is not significant (DM = 0.480, p=0.631). For return prediction, Linear Regression gives RMSE = 0.0005920 and R2=0.00061 and does not significantly outperform the zero-return benchmark (DM = 0.083, p=0.934). For future volatility, the best average finance-aware learned model is FeatureAttention_Only (RMSE = 0.0004407±0.0000180; ), and its three-seed ensemble gives RMSE = 0.0004298 and R2=0.024. FeatureAttention_Only improves squared-error loss relative to EWMA and GARCH in the fixed hold-out, but is not significantly superior to GARCH under QLIKE; rankings also vary across forecast origins.

Risks

8 September 2026

Task-aware forecasting framework showing causal information timing, the genuinely future 10-observation volatility target, and task-specific benchmarks.

Highly Accessed Articles

News & Conferences

Latest Issues

Open for Submission

Journal Sections

Volatility Modeling in Financial Market
Reprint

Volatility Modeling in Financial Market

Editors: Katarzyna Czech, Michal Wielechowski
Advanced Techniques and Modeling in Business and Economics
Reprint

Advanced Techniques and Modeling in Business and Economics

Editors: José Manuel Santos-Jaén, Ana León-Gomez, María del Carmen Valls Martínez
XFacebookLinkedIn
Risks - ISSN 2227-9091