Atmosphere 2021, 12(7), 840; https://doi.org/10.3390/atmos12070840 - 29 Jun 2021
Cited by 12 | Viewed by 3966
Abstract
The metal concentrations and isotopic compositions (13C, 207/206Pb) of urban dust, topsoil, and PM10 samples were analyzed in a residential area near Donghae port, Korea, which is surrounded by various types of industrial factories and raw material stockpiled on
[...] Read more.
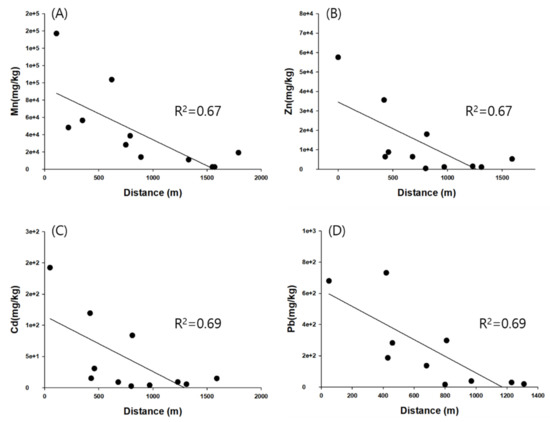
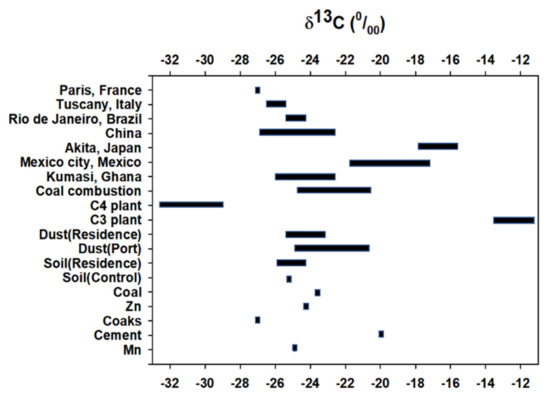
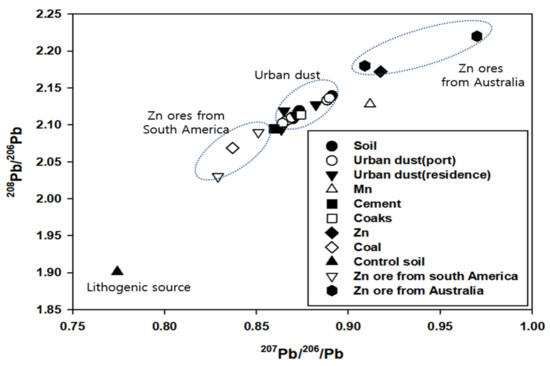
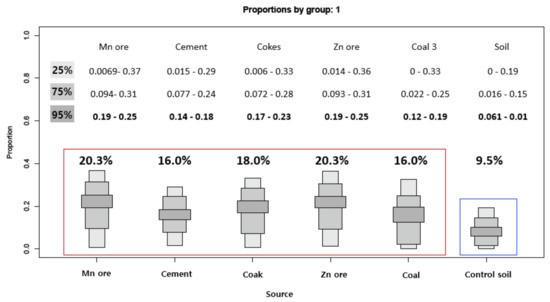
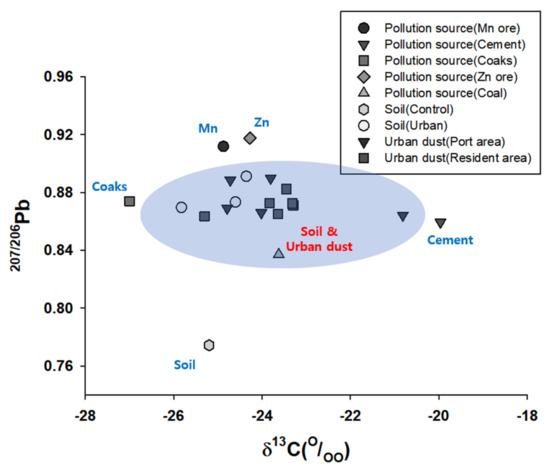
The metal concentrations and isotopic compositions (13C, 207/206Pb) of urban dust, topsoil, and PM10 samples were analyzed in a residential area near Donghae port, Korea, which is surrounded by various types of industrial factories and raw material stockpiled on empty land, to determine the contributions of the main pollution sources (i.e., Mn ore, Zn ore, cement, coal, coke, and topsoil). The metal concentrations of urban dust in the port and residential area were approximately 85~112 times higher (EF > 100) in comparison with the control area (EF < 2), especially the Mn and Zn ions, indicating they were mainly derived from anthropogenic source. These ions have been accumulating in urban dust for decades; furthermore, the concentration of PM10 is seven times higher than that of the control area, which means that contamination is even present. The isotopic (13C, 207/206Pb) values of the pollution sources were highly different, depending on the characteristics of each source: cement (−19.6‰, 0.8594‰), Zn ore (−24.3‰, 0.9175‰), coal (−23.6‰, 0.8369‰), coke (−27.0‰, 0.8739‰), Mn ore (−24.9‰, 0.9117‰), soil (−25.2‰, 0.7743‰). As a result of the evaluated contributions of pollution source on urban dust through the Iso-source and SIAR models using stable isotope ratios (13C, 207/206Pb), we found that the largest contribution of Mn (20.4%) and Zn (20.3%) ions are derived from industrial factories and ore stockpiles on empty land (Mn and Zn). It is suggested that there is a significant influence of dust scattered by wind from raw material stockpiles, which are stacked near ports or factories. Therefore, there is evidence to support the idea that port activities affect the air quality of residence areas in a city. Our results may indicate that metal concentrations and their stable isotope compositions can predict environmental changes and act as a powerful tool to trace the past and present pollution history in complex contexts associated with peri-urban regions.
Full article
(This article belongs to the Special Issue Road Dust in Urban and Industrial Environments: Sources, Pollutants, Impacts, and Management)
►
Show Figures
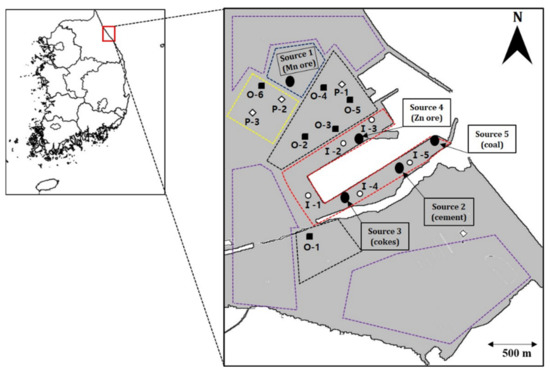
Figure 1


