Remote Sens. 2023, 15(4), 1078; https://doi.org/10.3390/rs15041078 - 16 Feb 2023
Cited by 21 | Viewed by 2603
Abstract
Accurate and continuous rainfall monitoring is essential for effective water resources management, especially in arid and semi-arid regions such as the United Arab Emirates (UAE). Significant spatio-temporal precipitation variation in the UAE necessitates the use of the latest techniques to measure rainfall intensity
[...] Read more.
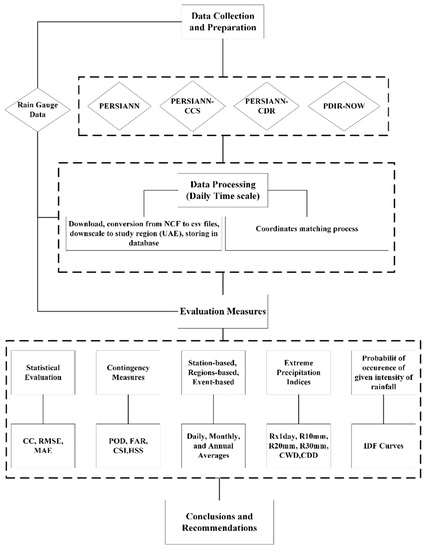
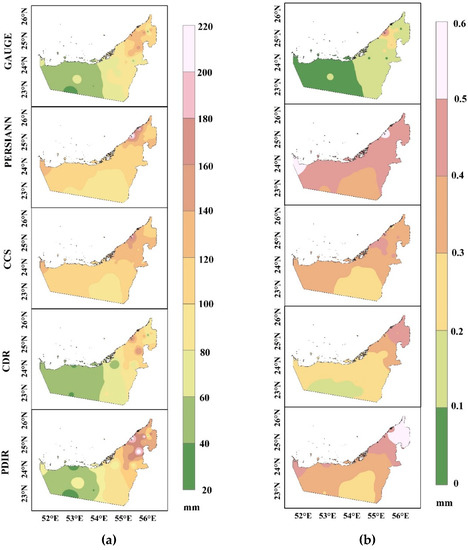
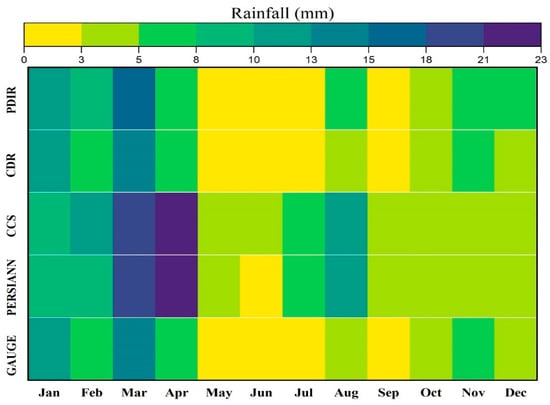
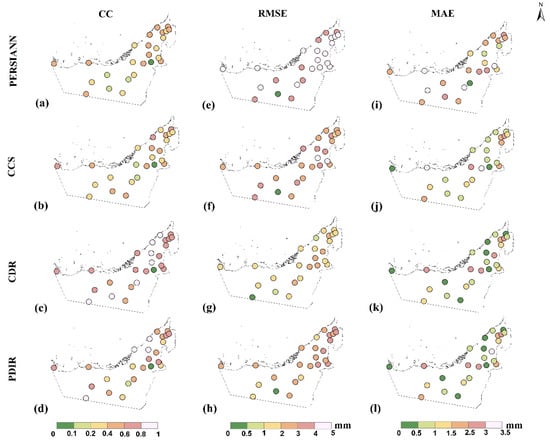
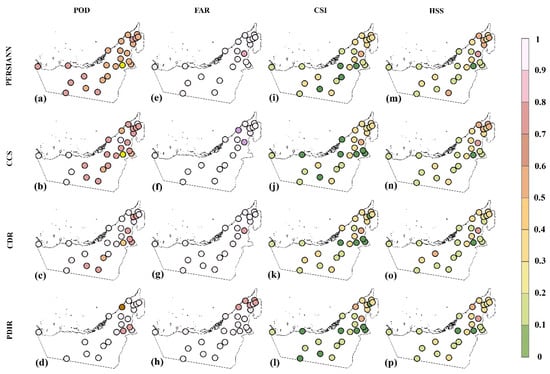
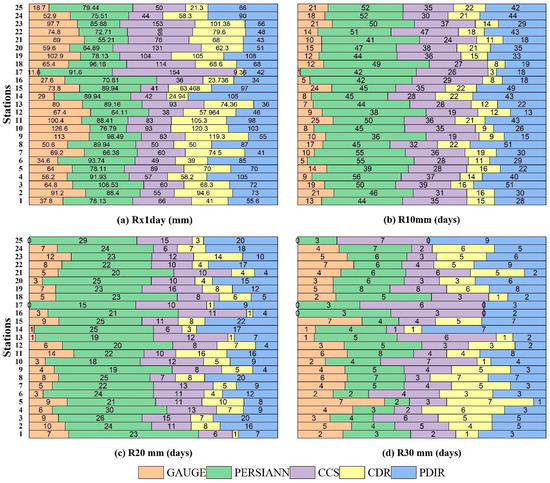
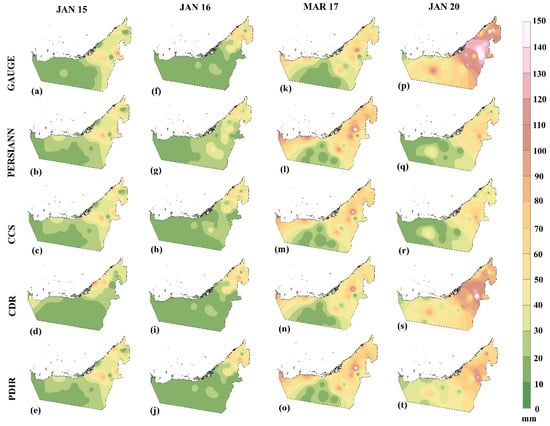
Accurate and continuous rainfall monitoring is essential for effective water resources management, especially in arid and semi-arid regions such as the United Arab Emirates (UAE). Significant spatio-temporal precipitation variation in the UAE necessitates the use of the latest techniques to measure rainfall intensity accurately. This study investigates the consistency and applicability of four satellite precipitation products, namely PERSIANN, PERSIANN-CCS, PERSIANN-CDR, and PDIR-Now, over the UAE. Daily time series data from 2011 to 2020 were analyzed using various statistical measures and climate indices to develop the belief in the products and for their inter-comparison. The analysis revealed that the average probability of detection (POD) for PDIR and CDR was the highest, with values ranging from 0.7–0.9 and 0.6–0.9, respectively. Similarly, CDR has a better Heidke Skill Score (HSS) with an average value of 0.26. CDR outperformed its counterparts with an average correlation coefficient value of 0.70 vs. 0.65, 0.40, and 0.34 for PDIR, CCS, and PERSIANN, respectively. Precipitation indices analysis revealed that all the products overestimated the number of consecutive wet days by 15–20%, while underestimating consecutive dry days by 5–10%. The quantitative estimations indicate that all the products were matching with the gauge values during the wet months (January–April), while they showed significant overestimation during the dry months. CDR and PDIR were in close agreement with the gauge data in terms of maximum daily rainfall with an error of less than 10% for both products. As compared to others, PERSIANN-CDR provided better estimates, particularly in terms of capturing extreme rainfall events and spatial distribution of rainfall. This study provides the first comprehensive evaluation of four PERSIANN family products based on recent daily rainfall data of UAE. The findings can provide future insights into the applicability and improvement of PERSIANN products in arid and semi-arid regions.
Full article
(This article belongs to the Special Issue Synergetic Remote Sensing of Clouds and Precipitation)
►
Show Figures
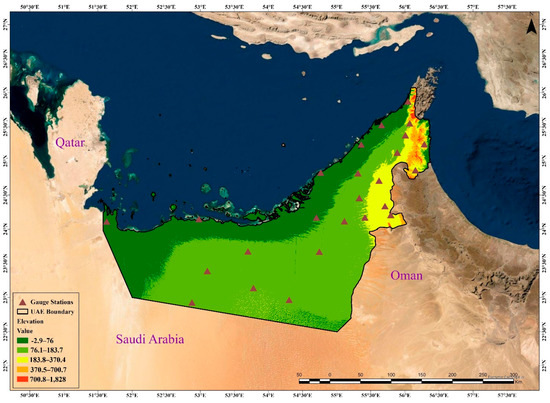
Figure 1


