Remote Sens. 2021, 13(9), 1712; https://doi.org/10.3390/rs13091712 - 28 Apr 2021
Cited by 6 | Viewed by 4833
Abstract
►
Show Figures
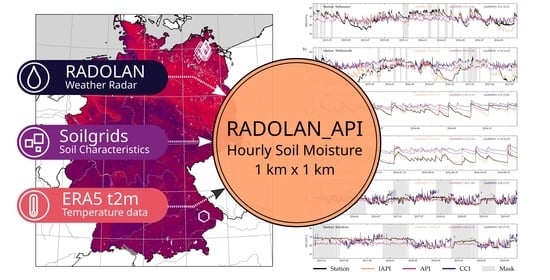
Soil moisture is a key variable in the terrestrial water and energy system. This study presents an hourly index that provides soil moisture estimates on a high spatial and temporal resolution (1 km × 1 km). The long established Antecedent Precipitation Index (API)
[...] Read more.
Soil moisture is a key variable in the terrestrial water and energy system. This study presents an hourly index that provides soil moisture estimates on a high spatial and temporal resolution (1 km × 1 km). The long established Antecedent Precipitation Index (API) is extended with soil characteristic and temperature dependent loss functions. The Soilgrids and ERA5 data sets are used to provide the controlling variables. Precipitation as main driver is provided by the German weather radar data set RADOLAN. Empiric variables in the equations are fitted in a optimization effort using 23 in-situ soil moisture measurement stations from the Terrestial Environmental Observatories (TERENO) and a separately conducted field campaign. The volumetric soil moisture estimation results show error values of 3.45 Vol% mean
Graphical abstract


