



-
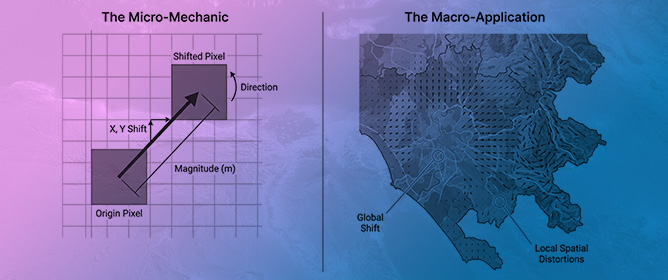
HyperCoreg: An Automated, Operational Pipeline for Co-Registering PRISMA and EnMAP Hyperspectral Imagery -
Global Assessment of Time-Varying Periodic Signals in GNSS Vertical Displacements Using SSA Versus Parameterized Models Considering Environmental Loading Effects -
Semantic Mapping of Urban Mobile Mapping LiDAR Using Panoramic OCR and Geometric Back-Projection -
A Scoping Review of LiDAR Solutions for Urban Safety of Vulnerable Road Users
Journal Description
Geomatics
Geomatics
is an international, peer-reviewed, open access journal on geomatic science published bimonthly online by MDPI. The Federation of Scientific Associations for Territorial and Environmental Information (ASITA) is affiliated with Geomatics and its members receive discounts on the article processing charges.
- Open Access— free for readers, with article processing charges (APC) paid by authors or their institutions.
- High Visibility: indexed within ESCI (Web of Science), Scopus, EBSCO, and other databases.
- Journal Rank: JCR - Q2 (Geography, Physical) / CiteScore - Q1 (Earth and Planetary Sciences (miscellaneous))
- Rapid Publication: manuscripts are peer-reviewed and a first decision is provided to authors approximately 21.6 days after submission; acceptance to publication is undertaken in 2.9 days (median values for papers published in this journal in the first half of 2026).
- Recognition of Reviewers: APC discount vouchers, optional signed peer review, and reviewer names published annually in the journal.
- Geomatics is a companion journal of Remote Sensing.
- Journal Cluster of Geospatial and Earth Sciences: Remote Sensing, Atmosphere, Geosciences, Climate, Quaternary, Earth, Geographies, Geomatics, Meteorology and Fossil Studies.
Impact Factor:
3.7 (2025);
5-Year Impact Factor:
3.0 (2025)
Latest Articles
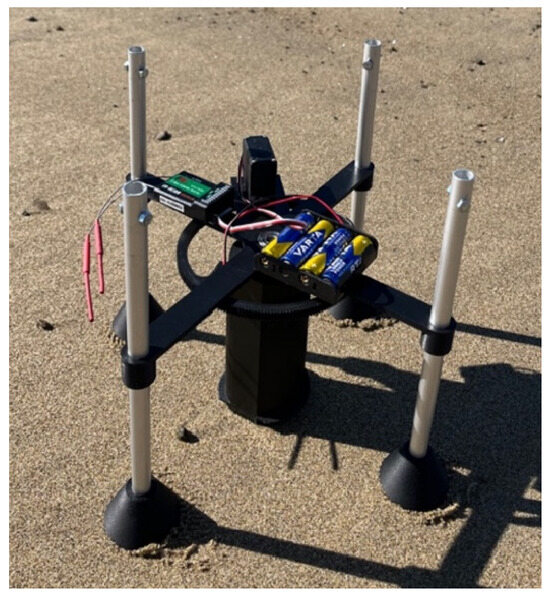
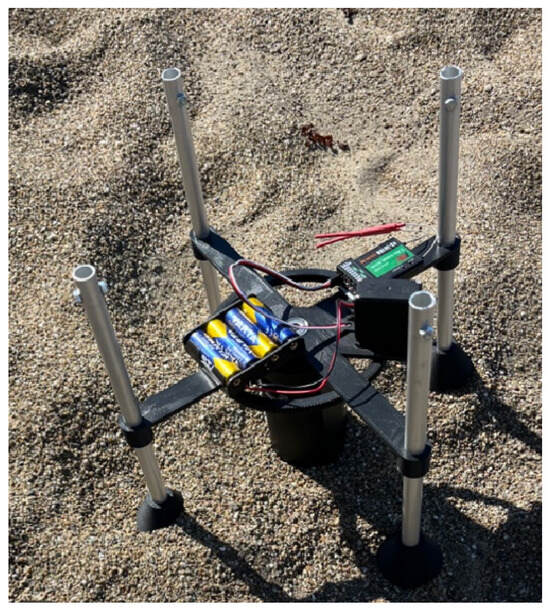
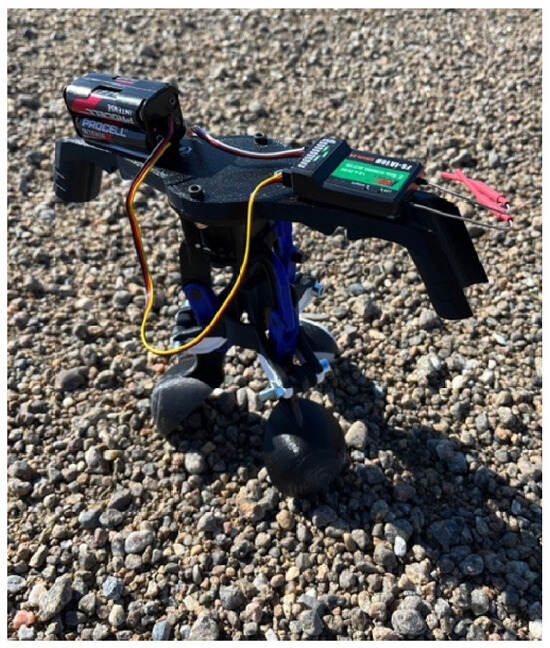
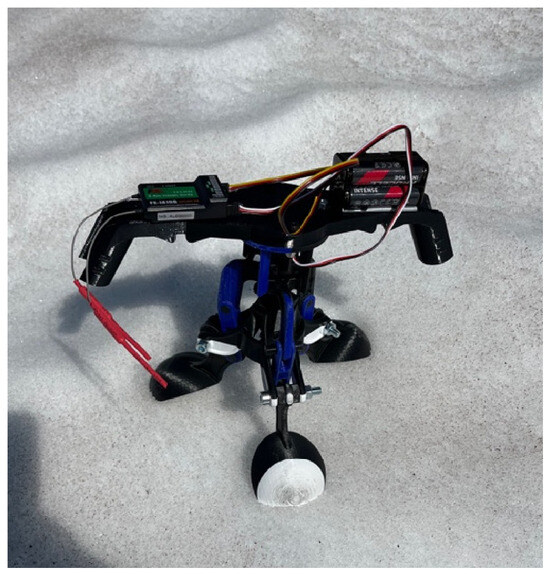
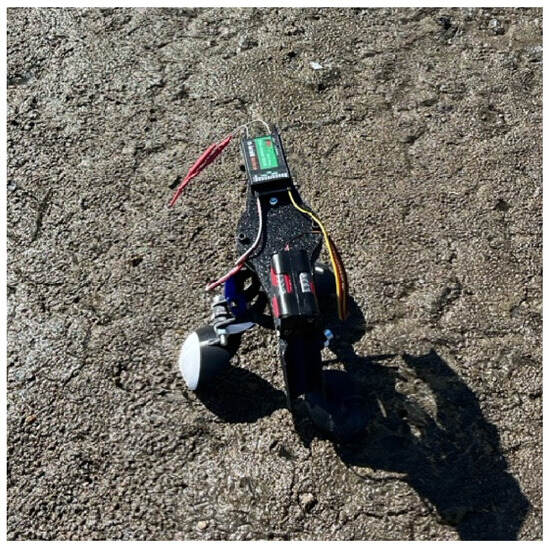
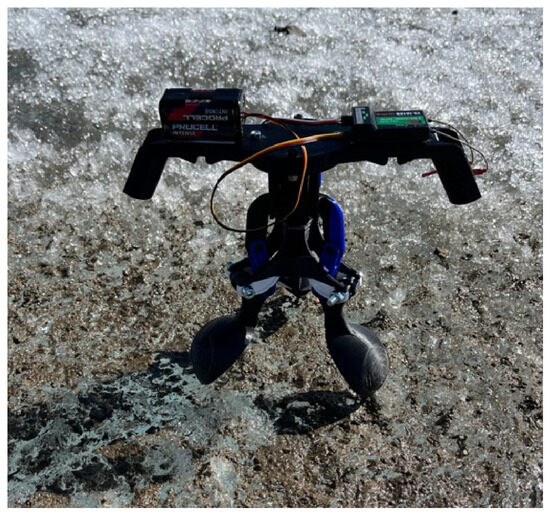
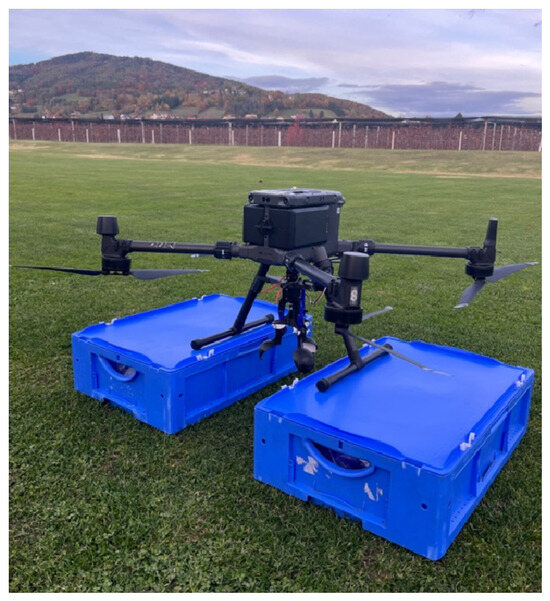
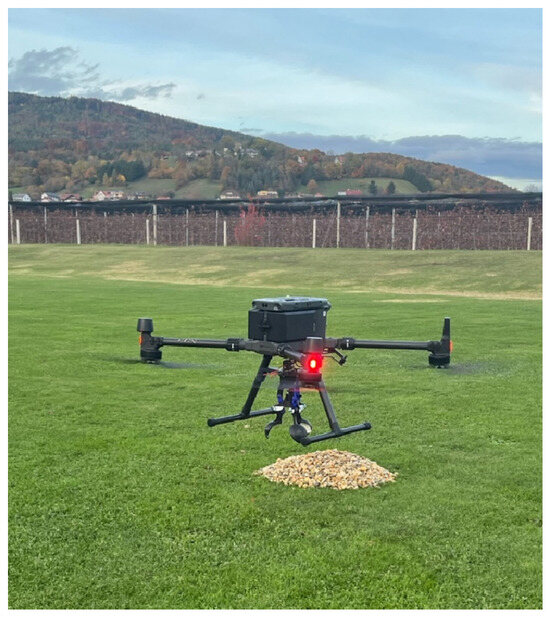
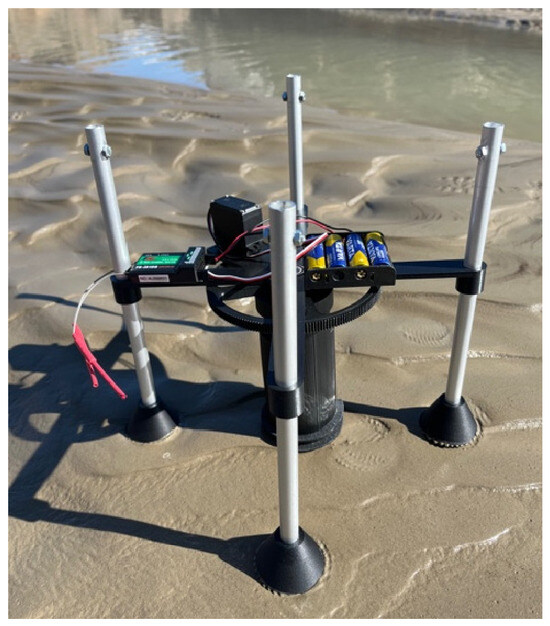
3D-Printed, Remote-Controlled Soil Sample Collector for UAS
Geomatics 2026, 6(4), 90; https://doi.org/10.3390/geomatics6040090 - 17 Aug 2026
Abstract
►
Show Figures
Remote-controlled UAS-based soil sampling offers great potential for scientific research and practical applications in various fields, including agriculture, environmental monitoring, hazardous waste, radiation measurements, chemical plants, snow sampling and glaciology. The added value of automated sampling using a UAS (unmanned aircraft system) compared
[...] Read more.
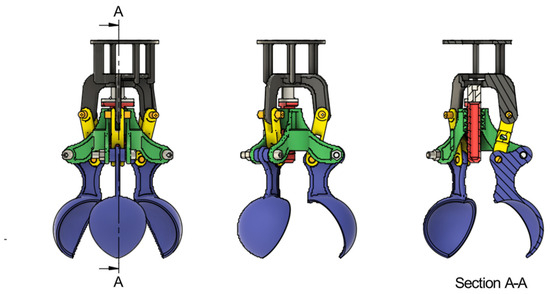
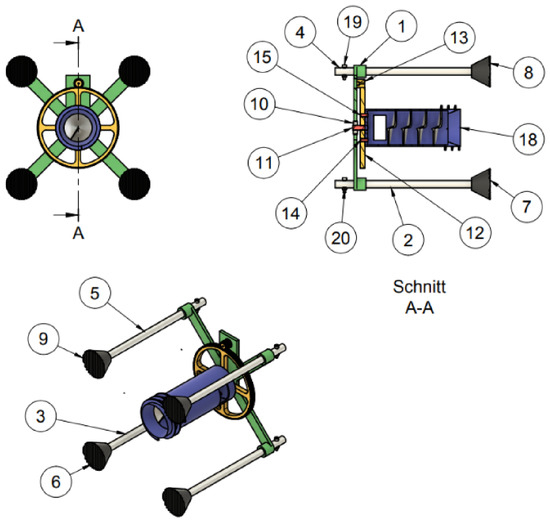
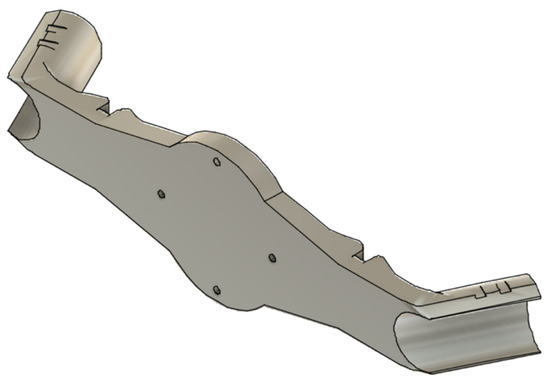
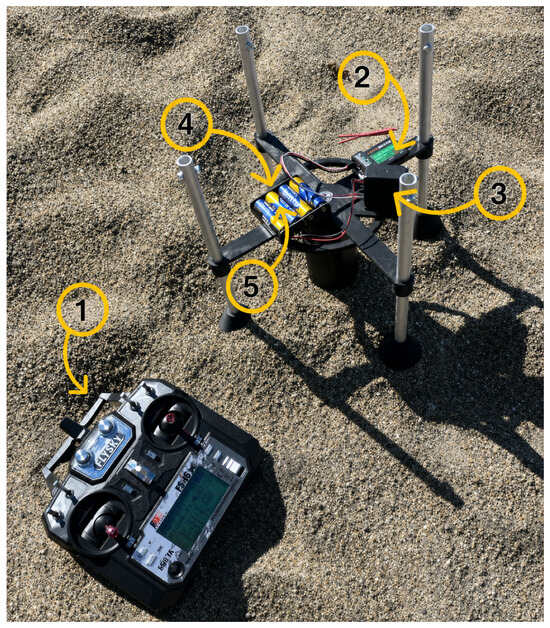
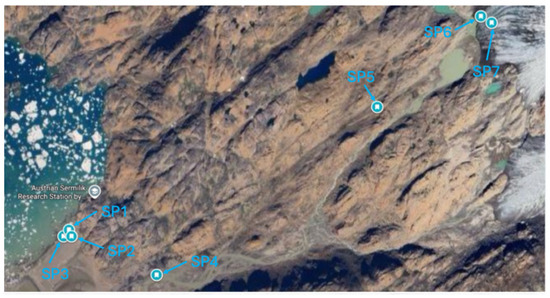
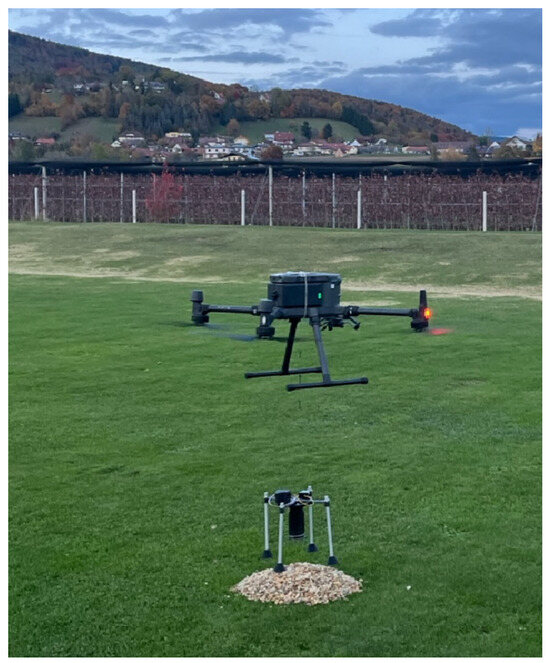
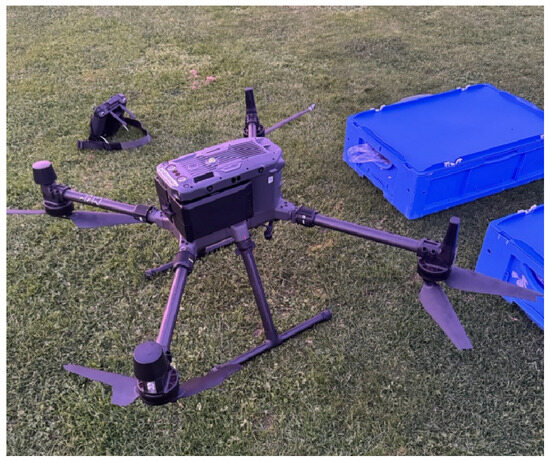
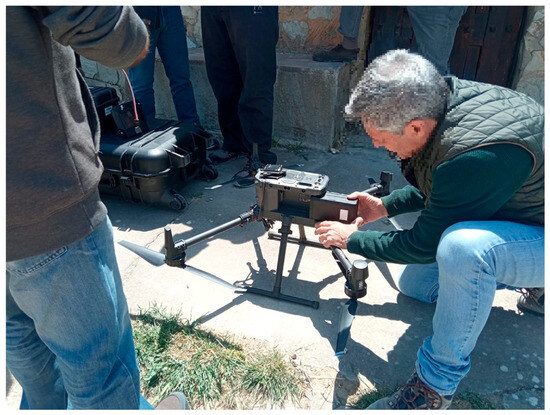
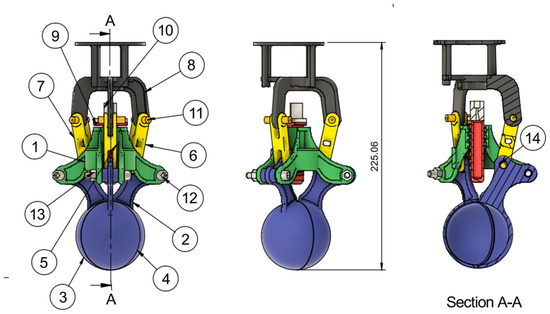
Remote-controlled UAS-based soil sampling offers great potential for scientific research and practical applications in various fields, including agriculture, environmental monitoring, hazardous waste, radiation measurements, chemical plants, snow sampling and glaciology. The added value of automated sampling using a UAS (unmanned aircraft system) compared to manual sampling lies primarily in improved accessibility to hazardous or remote locations, increased operational safety, and the potential to improve efficiency in applications requiring repeated or difficult-to-access sampling. This article introduces two different 3D-printed constructions (grab arm and screw pipe) for UAS-based, remote-controlled sample collection of different soil types. The grab arm construction is based on an adapted version of an open-source CAD from GrabCAD. The screw pipe construction is a new design. During an expedition to Greenland in August 2025, the two constructions were manually evaluated during several days of field work near the Danish and Austrian research stations at the Sermilik Fjord to assess their mechanical sampling performance on challenging Arctic surface materials, including dry and wet sand, gravel, glacial sediment, snow, and glacier surfaces. Because flight testing was not possible during the expedition due to unavailable UAS batteries, these experiments were limited to manual ground evaluation of the constructions. Independent flight tests were subsequently conducted in Austria using a DJI Matrice 300 to evaluate the integration of both the grab arm and the screw pipe with the UAS platform and their operational handling during flight. In Greenland the performance of manual sampling was documented precisely. Further the coordinates of each sampling point were recorded by using GPS, sample images were taken on site, and the collected material was weighed. The results show that UAS in combination with 3D printed constructions is a flexible and location-independent solution for obtaining soil samples of varying composition. In addition to the design, materials, and electronics of the systems, the article also describes the connection to the UAS and the field work results.
Full article
Open AccessArticle
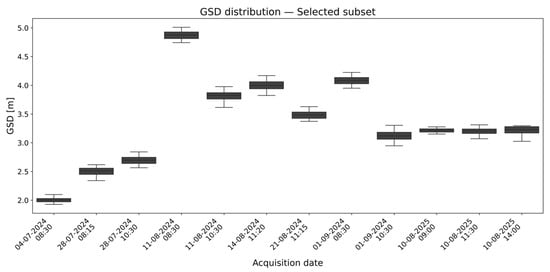
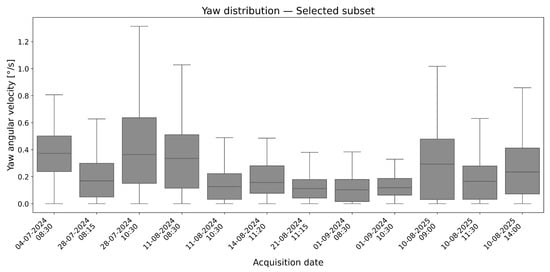
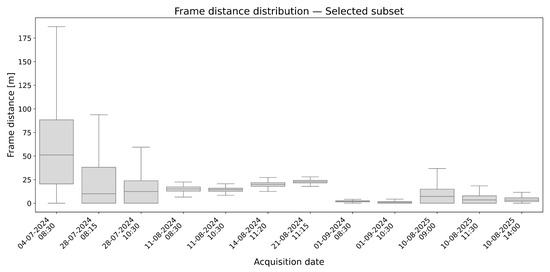
Geometric and Photogrammetric Assessment of Stratospheric Platform for Precision Agriculture Monitoring: A Multi-Campaign Analysis
by
Lorenza Bovio, Victor Miherea, Jannis Fath, Piero Boccardo and Enrico Borgogno-Mondino
Geomatics 2026, 6(4), 89; https://doi.org/10.3390/geomatics6040089 - 14 Aug 2026
Abstract
►▼
Show Figures
Remote sensing is widely recognized as a key technology across a wide range of technical and scientific domains, especially in agriculture. Although satellite data have long supported crop monitoring, their limitations in spatial resolution, revisit frequency and cloud coverage have often constrained their
[...] Read more.
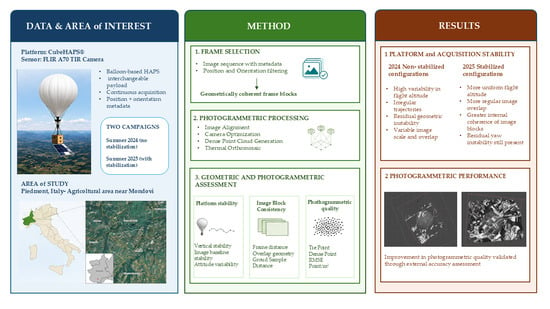
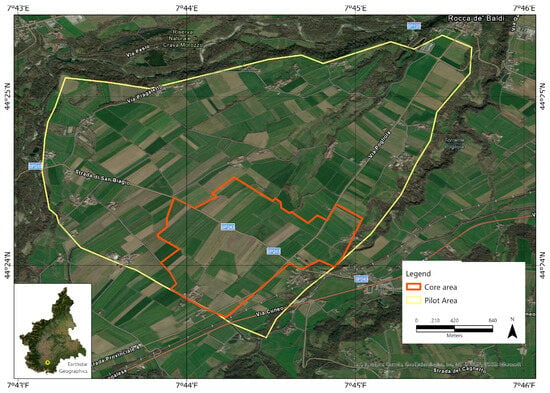
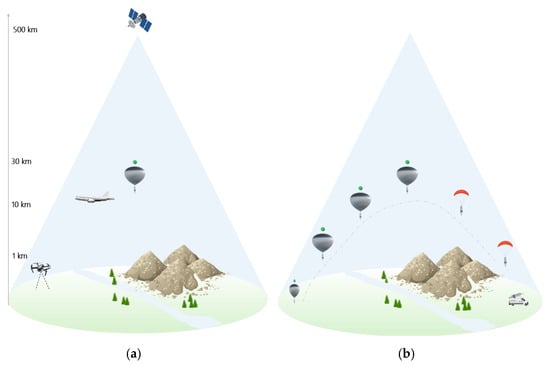
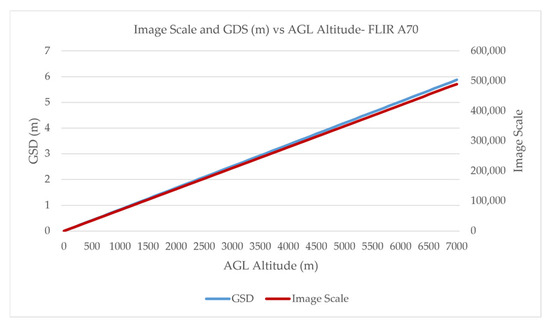
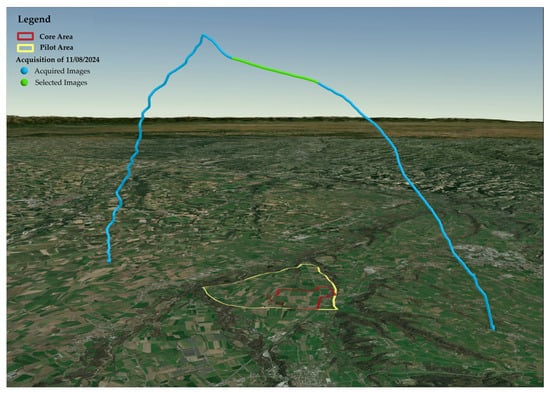
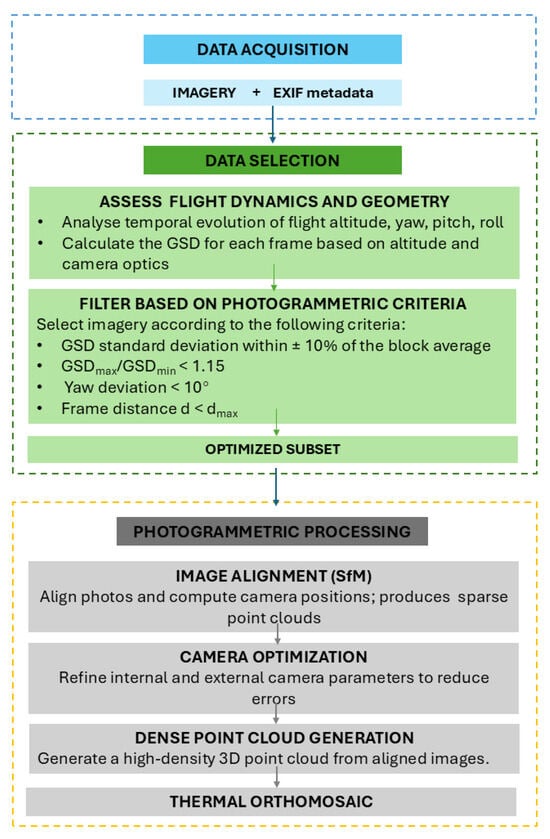
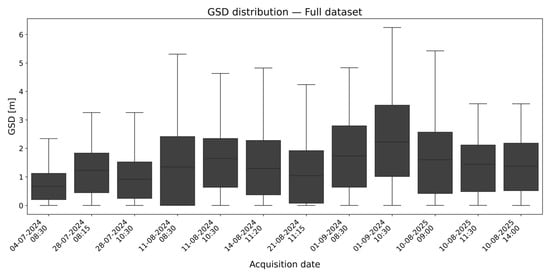
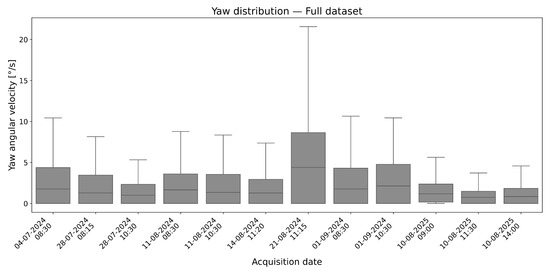
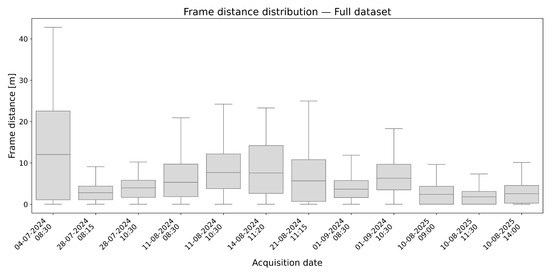
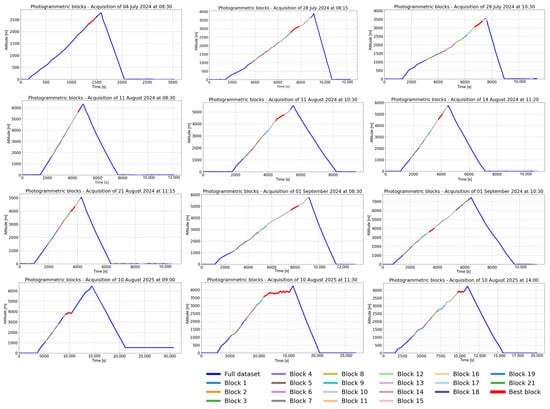
Remote sensing is widely recognized as a key technology across a wide range of technical and scientific domains, especially in agriculture. Although satellite data have long supported crop monitoring, their limitations in spatial resolution, revisit frequency and cloud coverage have often constrained their applications. High-resolution satellites, available from the beginning of the 2000s, have improved performance, particularly in the field of precision agriculture, but they remain expensive and inflexible. Unmanned Aerial Vehicles perform better in precision agriculture, offering flexibility and high levels of detail; however, their limited operational areas and short endurance flight times constrain their effectiveness. In this evolving landscape, High Altitude Pseudo Satellites (HAPSs), particularly high-altitude balloons, are emerging as a promising new technology that could fill the gaps between satellite and drone remote sensing. These platforms provide large area coverage with high-resolution imagery and long endurance flights at low operational expenses and ease of deployment. This study investigates the operational characteristics, strengths, and geometric limitations of data acquired by the CubeHAPS® platform, a high-altitude pseudo-satellite system, as a prerequisite for its application in precision agriculture. Focusing on experimental campaigns conducted in northern Italy in summer 2024 and 2025, the research characterizes platform stability, image block consistency, and photogrammetric quality through internal metrics. The results demonstrate measurable improvements between the two campaigns, attributed to the introduction of a stabilization system in 2025 and establishing the conditions under which the platform can support reliable photogrammetric reconstruction.
Full article

Graphical abstract
Open AccessReview
A Review of Multi-Criteria Decision Analysis (MCDA) for Cultural Heritage Risk Assessment Using Geospatial and Earth Observation Data
by
Kyriakos Michaelides and Athos Agapiou
Geomatics 2026, 6(4), 88; https://doi.org/10.3390/geomatics6040088 - 13 Aug 2026
Abstract
►▼
Show Figures
Cultural heritage sites are affected by environmental and anthropogenic pressures that require decision-analysis methods capable of combining heterogeneous datasets while accounting for uncertainty. Multi-Criteria Decision Analysis (MCDA), particularly when integrated with Geographic Information Systems (GIS) and Earth Observation (EO) data, is widely used
[...] Read more.
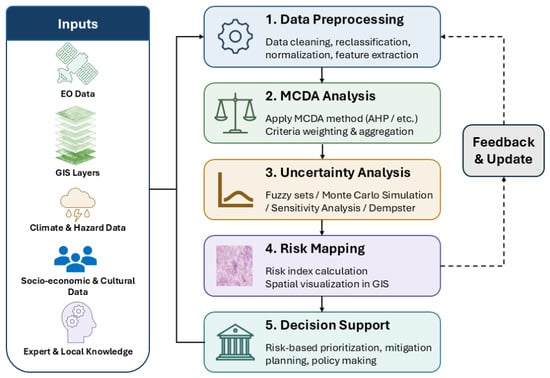
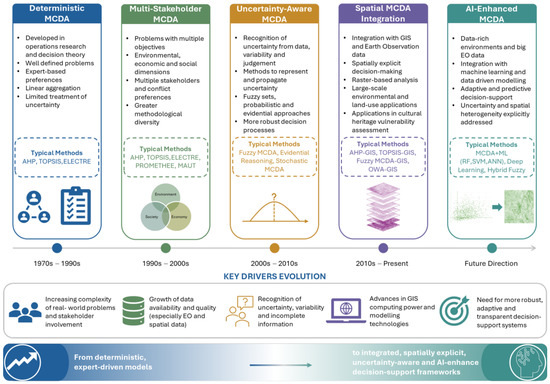
Cultural heritage sites are affected by environmental and anthropogenic pressures that require decision-analysis methods capable of combining heterogeneous datasets while accounting for uncertainty. Multi-Criteria Decision Analysis (MCDA), particularly when integrated with Geographic Information Systems (GIS) and Earth Observation (EO) data, is widely used in geospatial analysis involving multiple, often conflicting criteria. This review examines the evolution, application domains, and methodological challenges of MCDA in cultural heritage risk assessment. The literature indicates a predominant reliance on weighting-based methods, especially the Analytic Hierarchy Process (AHP) combined with GIS-based weighted overlay techniques, while uncertainty treatment, temporal monitoring, validation, and multi-threat applications remain limited. Three illustrative applications show that asset-level, regional susceptibility, and historic-urban frameworks address complementary decision needs but differ in their data, expertise, and institutional requirements. Recent developments show a trend to combine MCDA with fuzzy logic, machine learning, and uncertainty modeling, although methodological consistency across these approaches remains uneven. The findings suggest that multi-criteria risk assessment for cultural heritage may depend less on introducing new analytical techniques and more on improving the integration of existing methods. Incorporating repeatable environmental observations, sensitivity analyses, multi-threat assessment, and stakeholder participation may support a more coherent and reproducible approach to heritage-risk assessment.
Full article

Figure 1
Open AccessArticle
Fusing Multispectral UAV and Satellite Imagery to Improve the Discrimination of Vachellia karroo in Savanna and Grassland Ecosystems
by
Siphokazi Ruth Gcayi, Samuel Adewale Adelabu, Wonga Masiza and George Johannes Chirima
Geomatics 2026, 6(4), 87; https://doi.org/10.3390/geomatics6040087 - 12 Aug 2026
Abstract
Effective control and management of the encroaching and invasive Vachellia karroo (V. karroo) in grassland and savanna biomes depends on accurate information about its spatial distribution, making remote sensing approaches essential for mapping the extent of affected areas. Although Sentinel-2 satellite
[...] Read more.
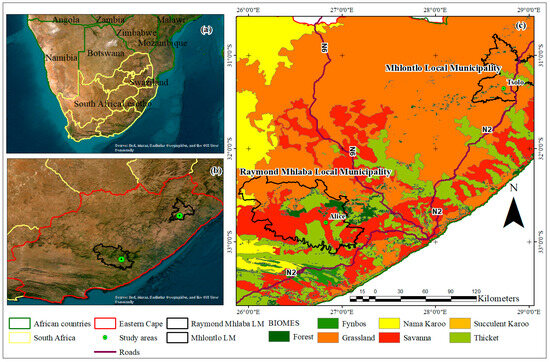
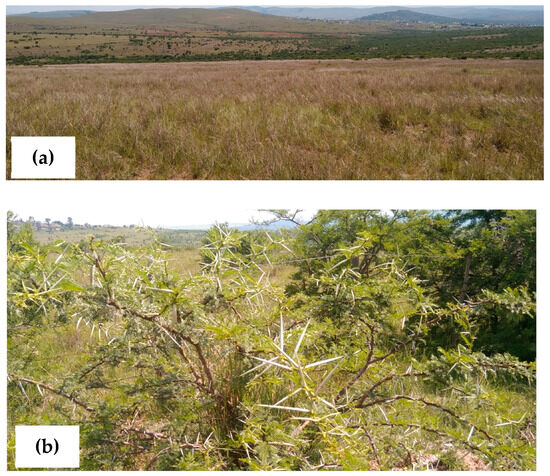
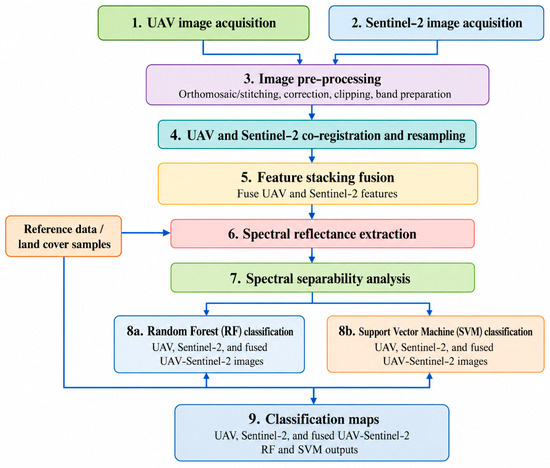
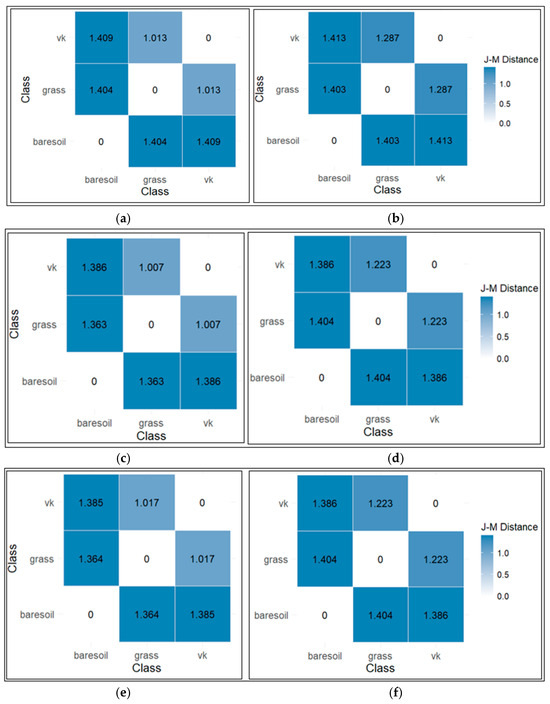
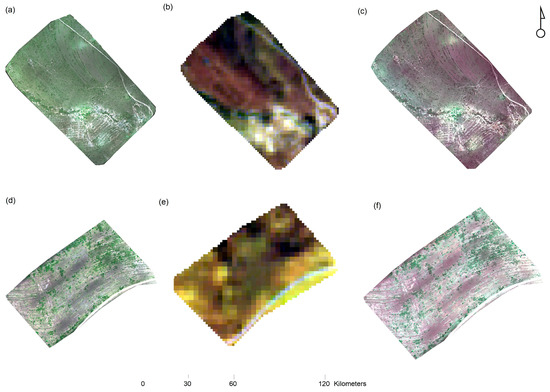
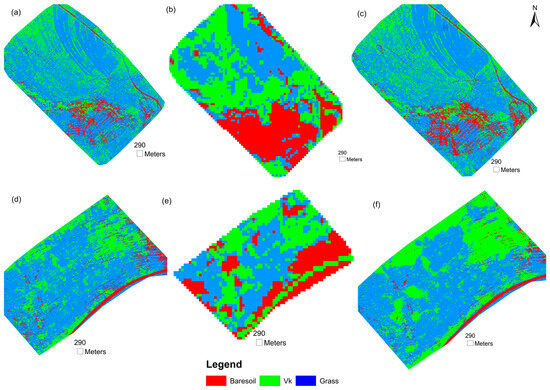
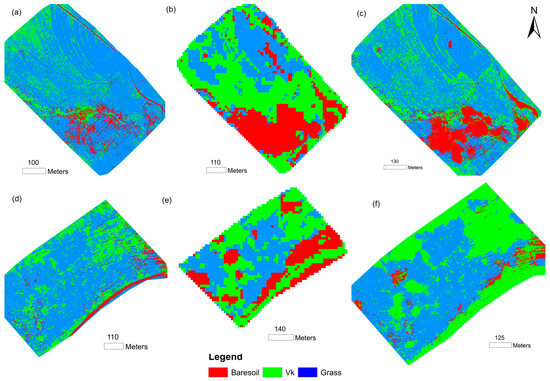
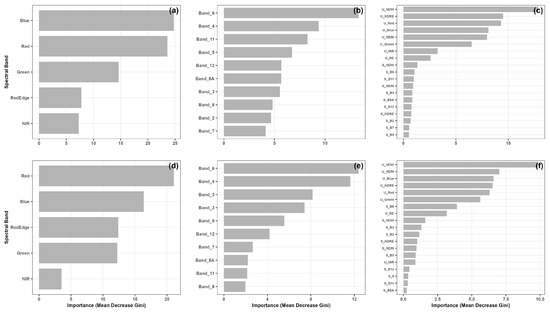
Effective control and management of the encroaching and invasive Vachellia karroo (V. karroo) in grassland and savanna biomes depends on accurate information about its spatial distribution, making remote sensing approaches essential for mapping the extent of affected areas. Although Sentinel-2 satellite data are widely used for land use and land cover applications, they often lack the spatial details required to distinguish woody species like V. karroo. The fusion of Sentinel-2 data with high-resolution UAV imagery offers a promising approach to enhance spectral information for species-level discrimination. This study evaluated UAV, Sentinel-2, and fused UAV–Sentinel-2 imagery for discrimination of V. karroo in grassland and savanna biomes of the Eastern Cape, South Africa. Field data and imagery were collected in October 2022 and classified using Random Forest (RF) and Support Vector Machine (SVM) algorithms to distinguish V. karroo. The findings showed that V. karroo was more prevalent in the savanna biome. SVM marginally outperformed RF in classifying V. karroo in the grassland biome, achieving overall accuracies ranging from 68.9% to 97.4%, compared to 57.8% to 97.4% for RF. Among the datasets, the fused UAV–Sentinel-2 images yielded the highest classification accuracy, with an overall accuracy of 97.4% and a kappa coefficient of 0.96. The UAV images also demonstrated high classification accuracy, with an overall accuracy of 91.67% and a kappa coefficient of 0.77, confirming its value for fine-scale mapping and reference data support. In contrast, the Sentinel-2 images produced lower classification accuracy, with an overall accuracy of 84.6% and a kappa coefficient of 0.75, mainly due to their coarser spatial resolution. Classification was more challenging in the savanna site, where mixed vegetation structure increased confusion between V. karroo and grass. These findings show that fused UAV–Sentinel-2 images can improve species-level discrimination, while UAV and Sentinel-2 data remain complementary for fine-scale mapping and broader monitoring of bush encroachment in grassland and savanna ecosystems.
Full article
(This article belongs to the Special Issue Advanced Geospatial Intelligence for Sustainable Agriculture and Environmental Management)
►▼
Show Figures

Figure 1
Open AccessArticle
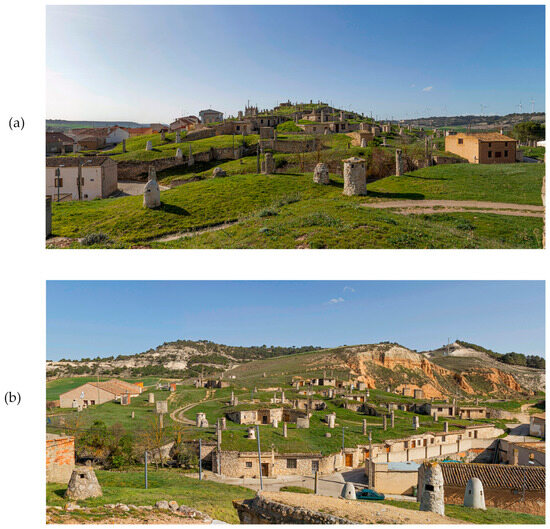
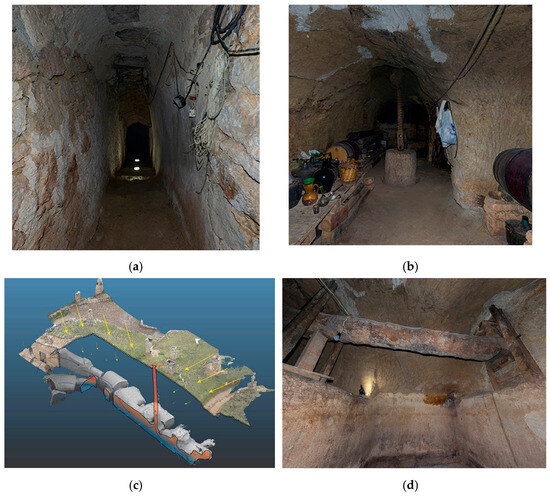
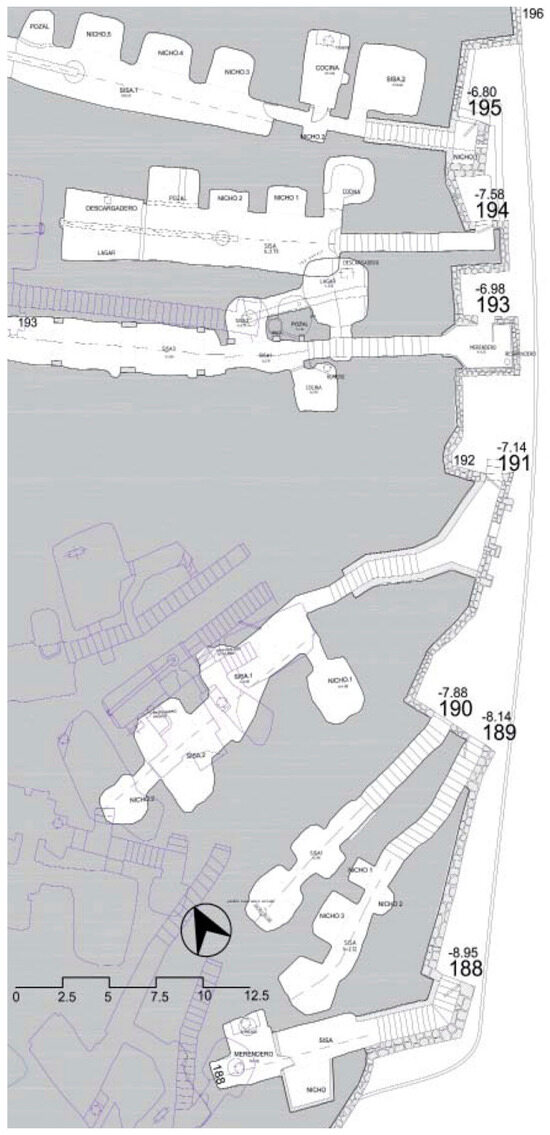
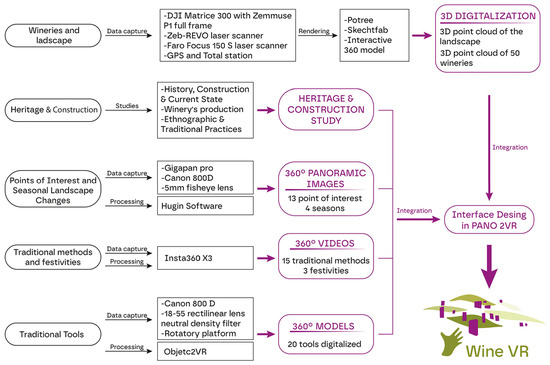
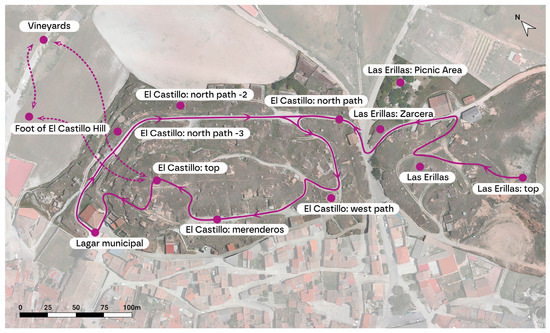
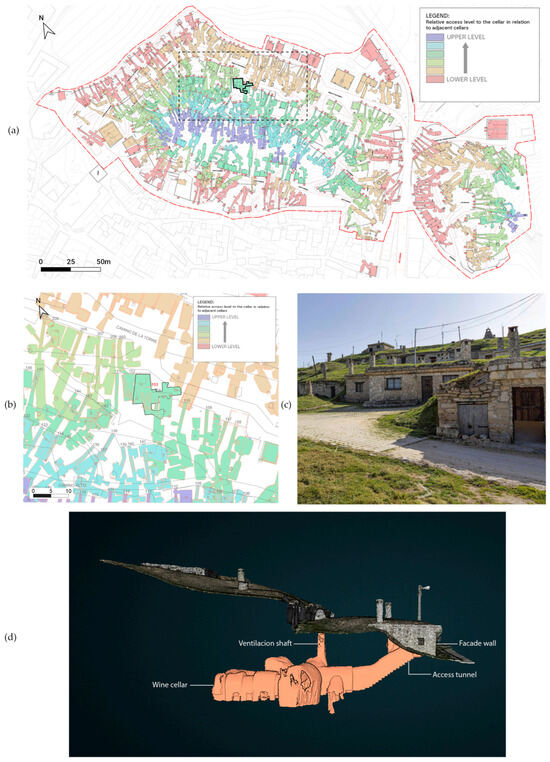
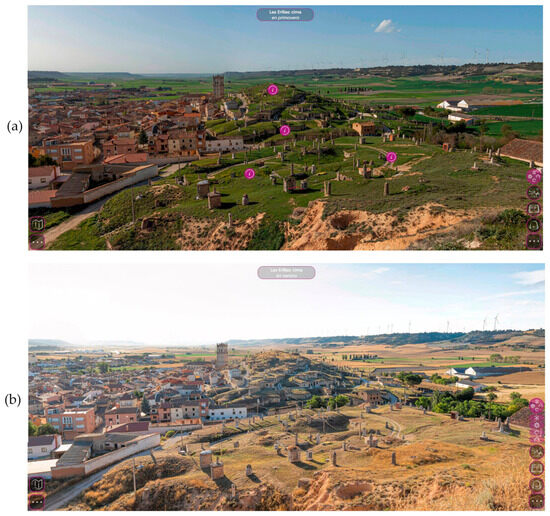
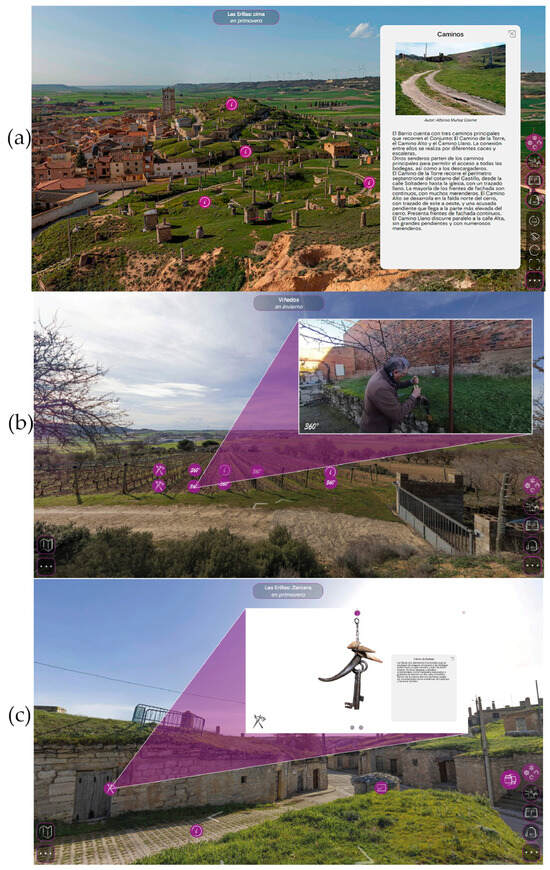
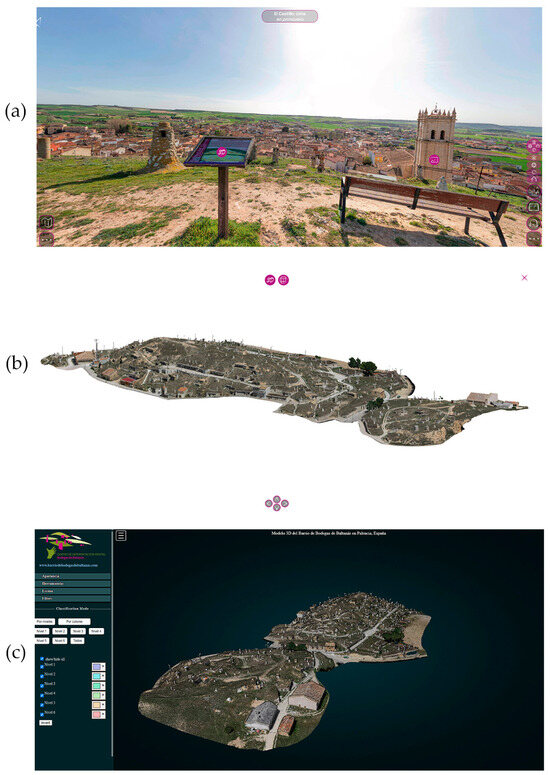
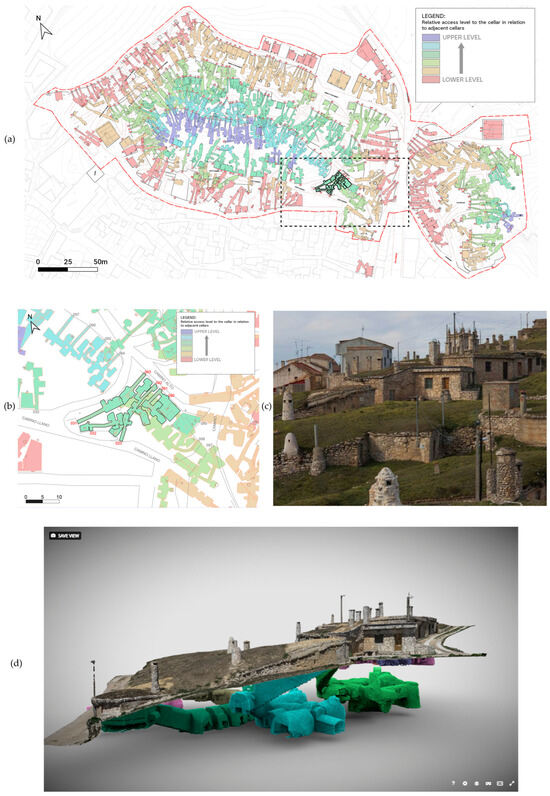
A Virtual Reality Platform for Showcasing the Tangible and Intangible Heritage of the Underground Wineries of Baltanás (Spain)
by
Rubén Santamaría-Maestro, María Sánchez-Aparicio, Andrea Martín-Crespo and Luis Javier Sánchez-Aparicio
Geomatics 2026, 6(4), 86; https://doi.org/10.3390/geomatics6040086 - 11 Aug 2026
Abstract
Digital platforms for cultural heritage are increasingly expected to document the geometric and material properties of sites. Furthermore, such platforms are increasingly expected to preserve and communicate the intangible practices and community knowledge that give these places cultural significance. In this context, this
[...] Read more.
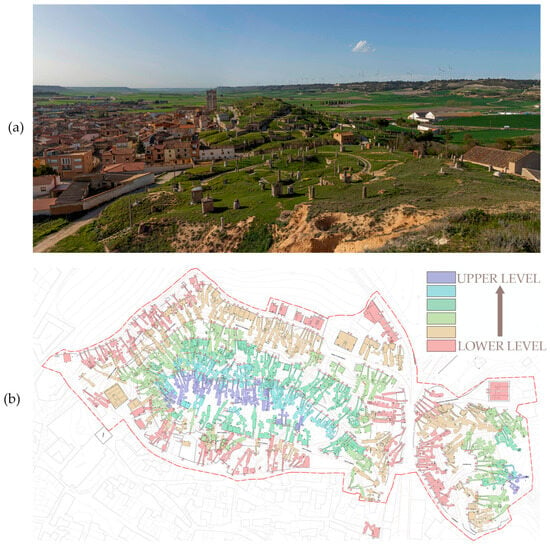
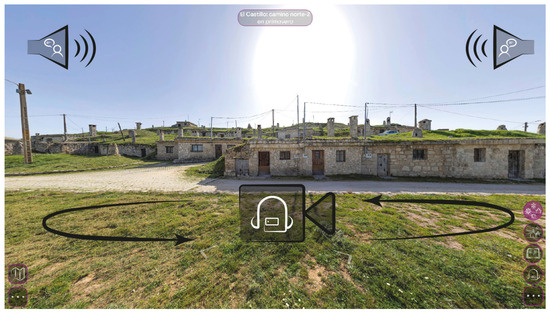
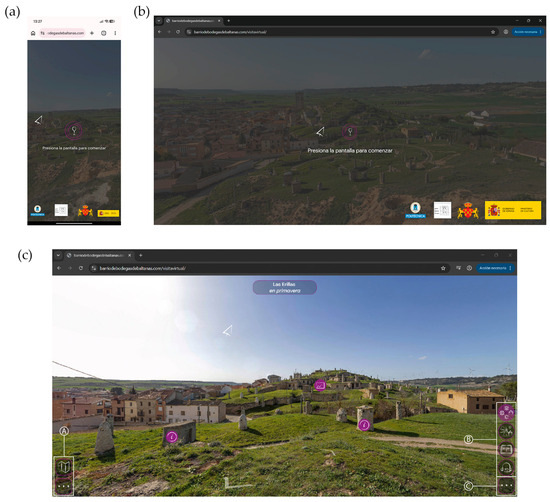
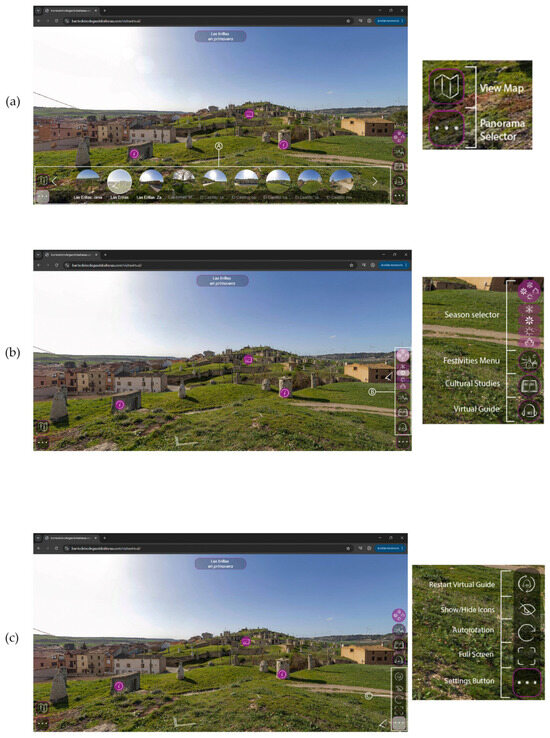
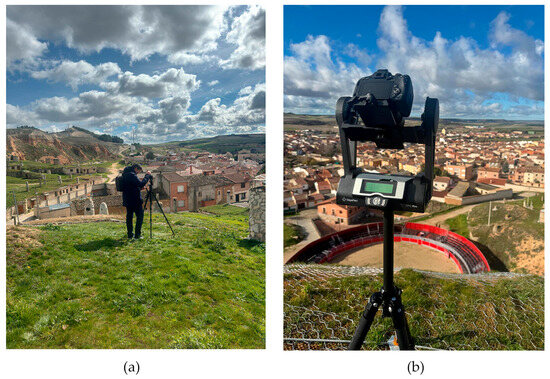
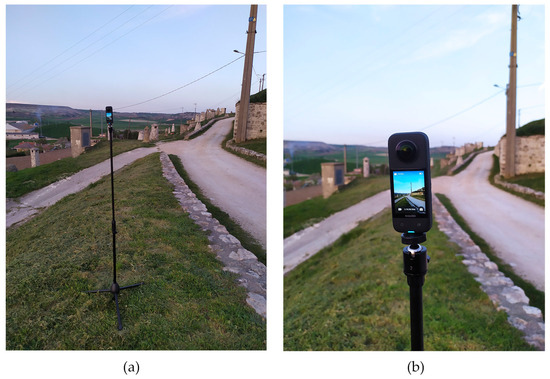
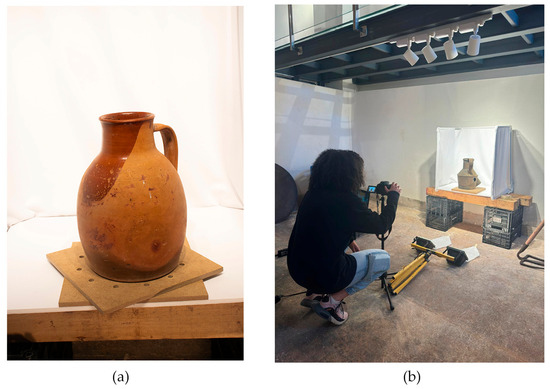
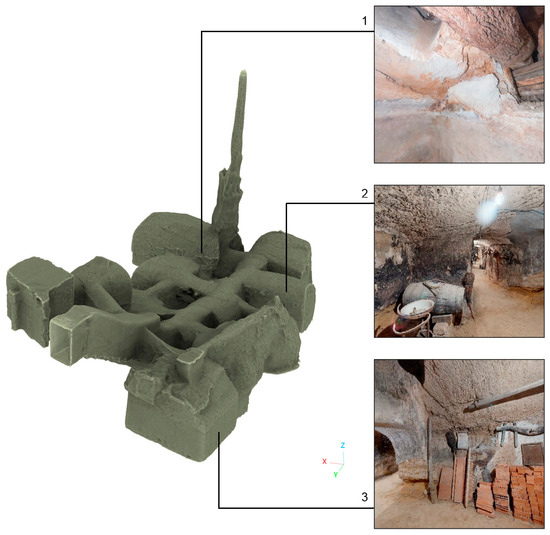
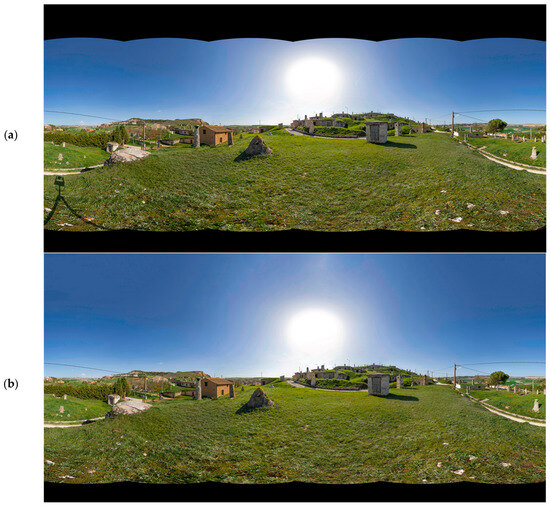
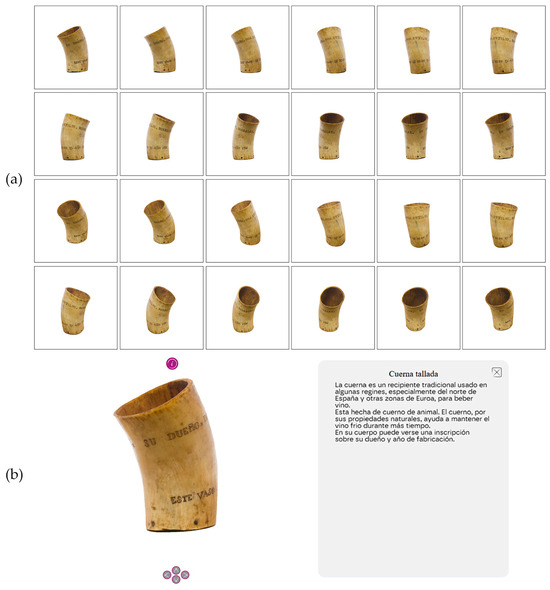
Digital platforms for cultural heritage are increasingly expected to document the geometric and material properties of sites. Furthermore, such platforms are increasingly expected to preserve and communicate the intangible practices and community knowledge that give these places cultural significance. In this context, this paper presents a hybrid virtual reality platform for the documentation, communication, and dissemination of both tangible and intangible heritage in underground wine landscapes. The framework integrates 360° panoramic imagery, 360° videos, lightweight object visualisations, and georeferenced 3D point clouds within a unified interface adapted to different device capabilities. The system’s key contributions include seasonal navigation, participatory recording of community practices, multiscale representation of artefacts and architecture, and a guided narrative system that improves orientation for non-expert users. The platform has been validated through the underground wineries of Baltanás (Spain), thereby demonstrating a novel approach that brings together metric documentation and immersive storytelling. This enhances accessibility, facilitates heritage interpretation, and ensures the digital preservation of living cultural practices in complex heritage settings with broad public dissemination potential.
Full article
(This article belongs to the Special Issue Innovative Remote Sensing Approaches: 3D Reconstruction, UAV Photogrammetry, and BIM in Cultural Heritage and Infrastructure)
►▼
Show Figures

Figure 1
Open AccessArticle
Probabilistic Modelling of Parcel Area Uncertainty: Implications for Land Administration and Urban Planning
by
Dimitrios Ampatzidis, Aristotelis Vartholomaios, Dionysia-Georgia Ch. Perperidou and Nikolaos Demirtzoglou
Geomatics 2026, 6(4), 85; https://doi.org/10.3390/geomatics6040085 - 3 Aug 2026
Abstract
Parcel area sits at the intersection of urban planning, land administration and land surveying. It underpins development intensity, floor area allocation, minimum lot thresholds, land readjustment and value capture mechanisms. Yet discrepancies between modern measurements and ownership titles are usually evaluated through fixed
[...] Read more.
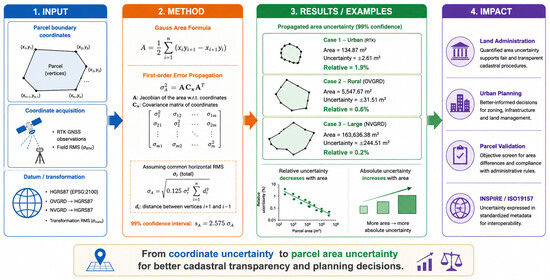
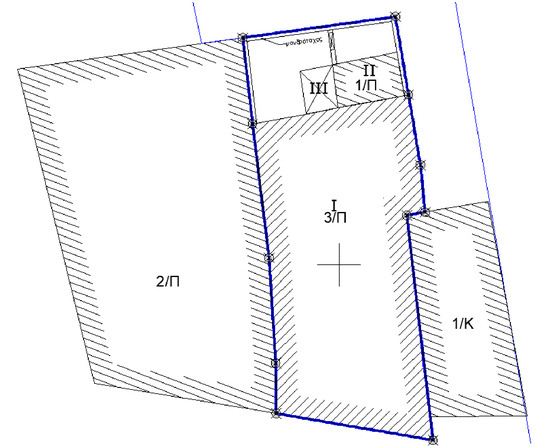
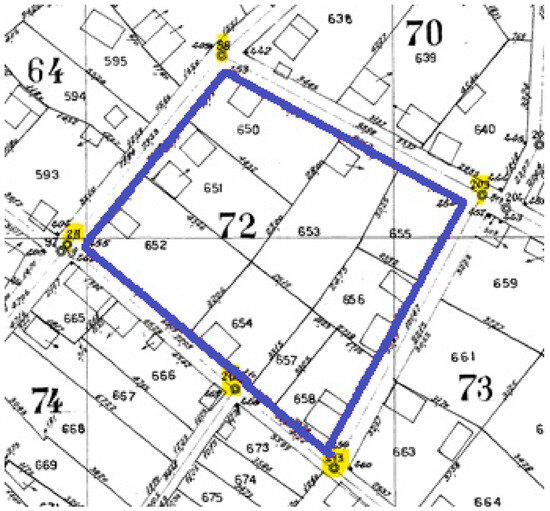
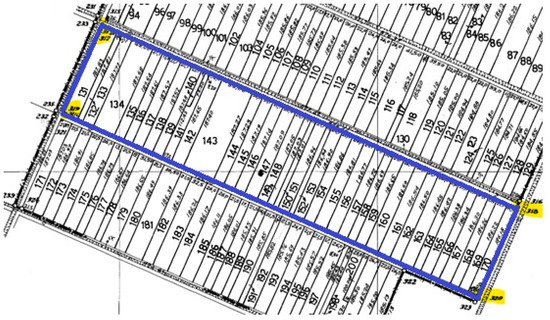
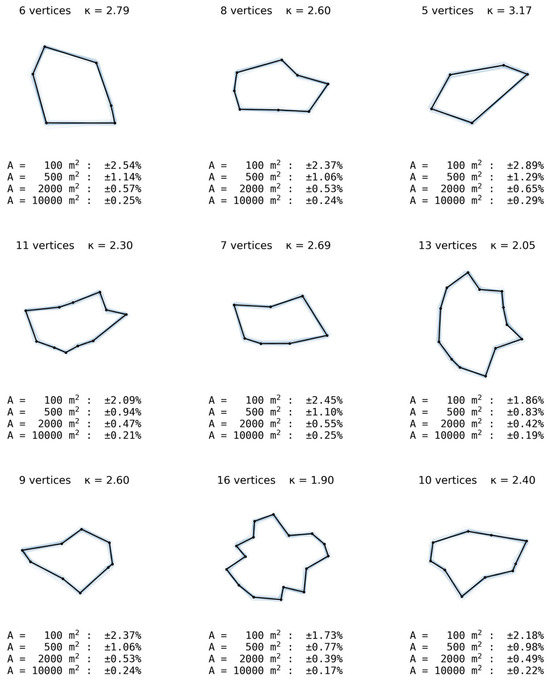
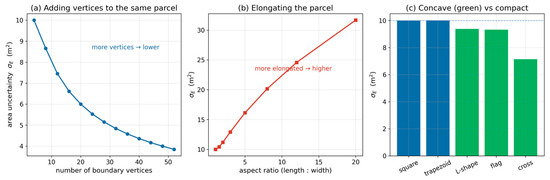
Parcel area sits at the intersection of urban planning, land administration and land surveying. It underpins development intensity, floor area allocation, minimum lot thresholds, land readjustment and value capture mechanisms. Yet discrepancies between modern measurements and ownership titles are usually evaluated through fixed tolerance formulas rather than quantified confidence intervals. While coordinate precision is routinely specified, the uncertainty of the derived parcel area is seldom expressed explicitly, limiting the traceability of planning calculations based on cadastral geometry. This paper presents a variance-based formulation for estimating parcel area uncertainty from boundary coordinates. Using the Gauss area function and first-order propagation, vertex precision is translated into parcel-level confidence intervals based on horizontal RMS parameters commonly reported in cadastral practice, including documented transformation accuracy. The Greek cadastre provides an illustrative case combining a national GNSS infrastructure, a unified reference system and formula-based area screening embedded in statutory workflows. Illustrative examples show how area uncertainty varies with parcel geometry and measurement origin. Absolute uncertainty increases with parcel size and boundary elongation, while relative uncertainty decreases with parcel size. A Monte Carlo analysis of the error-correlation structure shows that the diagonal, independent model is not a universal bound: depending on the structure of the transformation error and on parcel geometry it may either overstate or understate the true area uncertainty, by factors between about 0.4 and 3.5 in the cases examined. The results clarify how coordinate precision propagates into regulatory-relevant area values and support more transparent interpretation of area discrepancies in planning and land administration contexts.
Full article
(This article belongs to the Topic Innovative Approaches in Geospatial Analysis and Modeling of Urban Environments)
►▼
Show Figures

Graphical abstract
Open AccessArticle
Evaluating Tropospheric Mapping Functions for GPS-Derived PWV in a Tropical Region: Insights from Southwestern Mexico
by
Lizbeth G. Santiago-Sánchez, Rosendo Romero-Andrade, Ana I. Vidal-Vega, Evangelina Ávila-Aceves and Naccieli Bojorquez-Pacheco
Geomatics 2026, 6(4), 84; https://doi.org/10.3390/geomatics6040084 - 1 Aug 2026
Abstract
Global Navigation Satellite Systems (GNSS) have emerged as a reliable and cost-effective tool for estimating atmospheric precipitable water vapor (PWV), particularly in regions with limited meteorological instrumentation. In this study, the performance of three tropospheric mapping functions—the Global Mapping Function (GMF), Niell Mapping
[...] Read more.
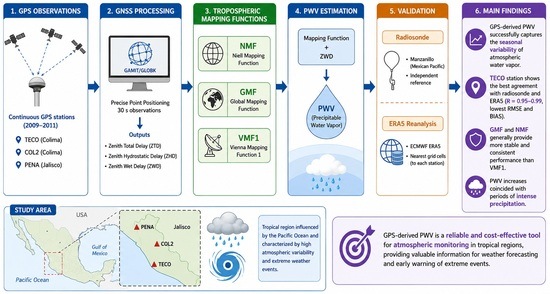
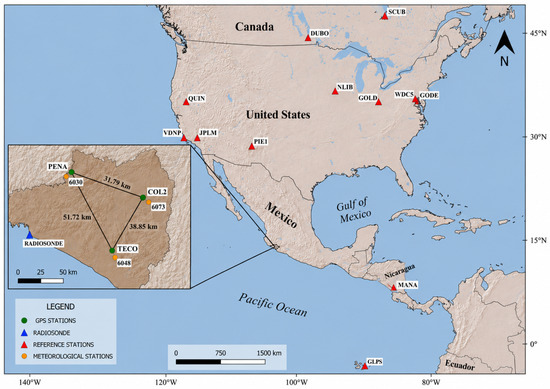
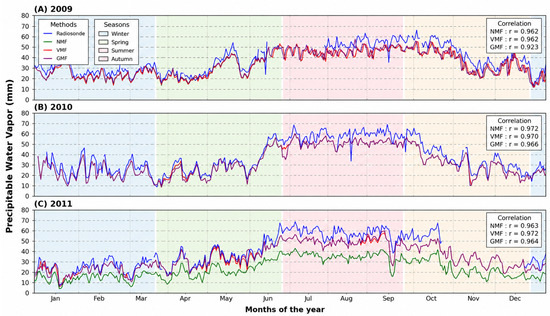
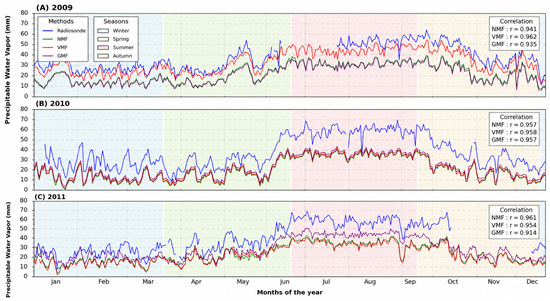
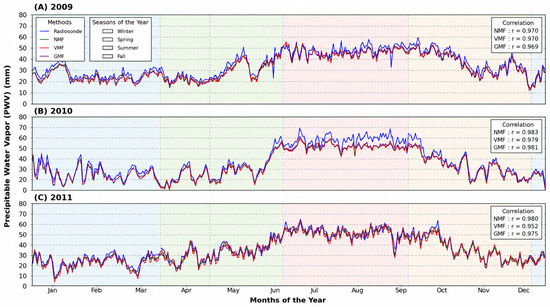
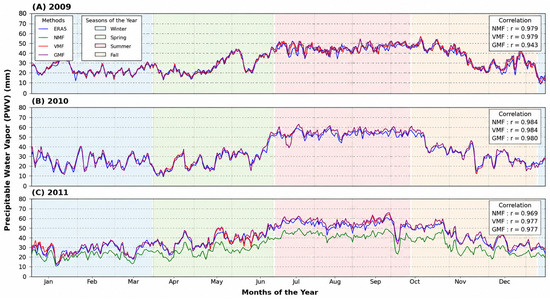
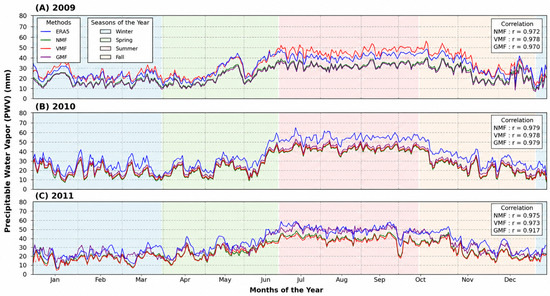
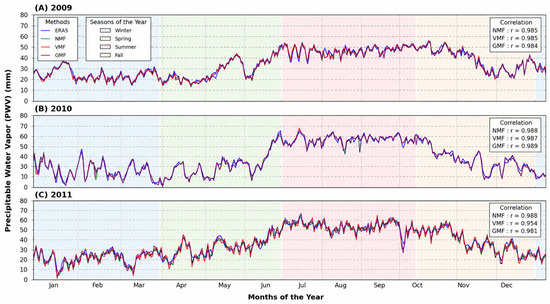
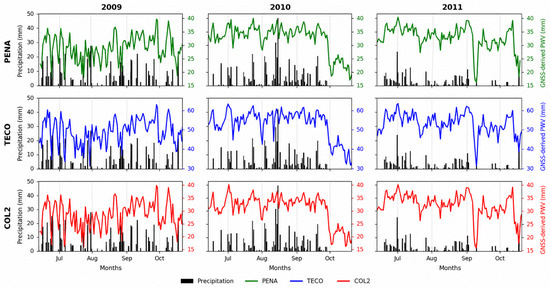
Global Navigation Satellite Systems (GNSS) have emerged as a reliable and cost-effective tool for estimating atmospheric precipitable water vapor (PWV), particularly in regions with limited meteorological instrumentation. In this study, the performance of three tropospheric mapping functions—the Global Mapping Function (GMF), Niell Mapping Function (NMF), and Vienna Mapping Function 1 (VMF1)—was evaluated for PWV estimation using GPS observations collected during the 2009–2011 period in southwestern Mexico, a region characterized by high atmospheric variability and frequent extreme weather events. GPS data from three stations (TECO, COL2, and PENA) were processed using the GAMIT/GLOBK 10.71 software, and the resulting PWV estimates were validated against independent radiosonde observations and the European Centre for Medium-Range Weather Forecasts (ECMWF) Fifth-Generation Reanalysis (ERA5) data. The results show that GPS-derived PWV successfully captures the seasonal variability of atmospheric water vapor, with maximum values during the summer rainy season. High correlations were obtained with both radiosonde and ERA5 data, particularly at the TECO station (R = 0.95–0.99), where RMSE values ranged from 3.27 to 5.46 mm and BIAS values from to mm. In contrast, larger discrepancies were observed at COL2 and PENA, mainly due to horizontal separation and altitude differences relative to the radiosonde site, highlighting the importance of spatial representativeness during validation. Among the evaluated mapping functions, no single model consistently outperformed the others across all stations, years, and reference datasets. Nevertheless, GMF and NMF generally exhibited more stable and consistent performance, whereas VMF1 showed greater variability under the adopted processing strategy. Additionally, a clear relationship was identified between PWV and precipitation records, indicating that increases in PWV coincided with periods of intense rainfall and suggesting its potential as an indicator of atmospheric conditions favorable for precipitation events. Overall, this study shows that GPS-derived PWV can reproduce the seasonal variability of atmospheric water vapor under the adopted processing strategy and demonstrates the importance of mapping function selection and spatial representativeness for accurate PWV estimation.
Full article
(This article belongs to the Special Issue GNSS Observations in Meteorology)
►▼
Show Figures

Graphical abstract
Open AccessArticle
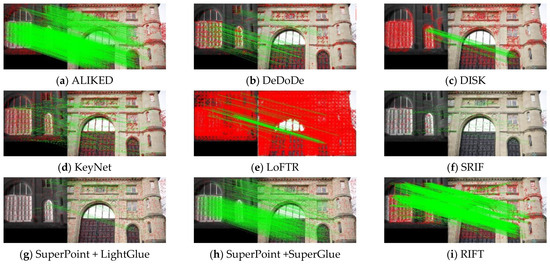
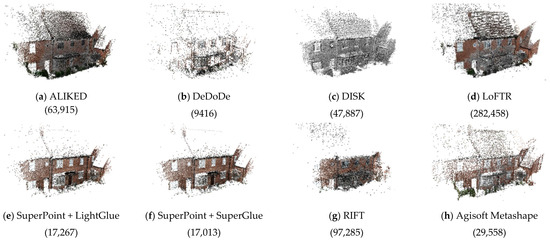
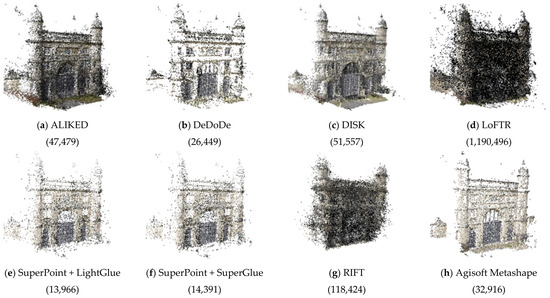
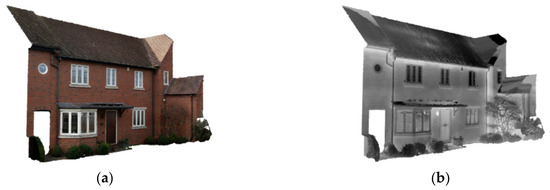
Evaluating Deep Learning Local Features for RGB-Thermal Image Matching and 3D InfraRed Thermography
by
Luca Morelli, Neil Sutherland, Francesco Ioli, Alfonso Vitti, Stuart Marsh, Jon Mills, Paul Bryan and Fabio Remondino
Geomatics 2026, 6(4), 83; https://doi.org/10.3390/geomatics6040083 - 29 Jul 2026
Abstract
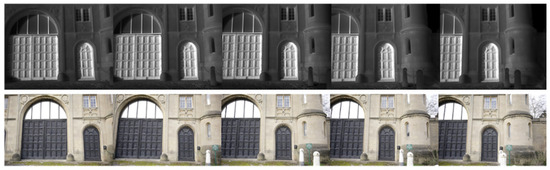
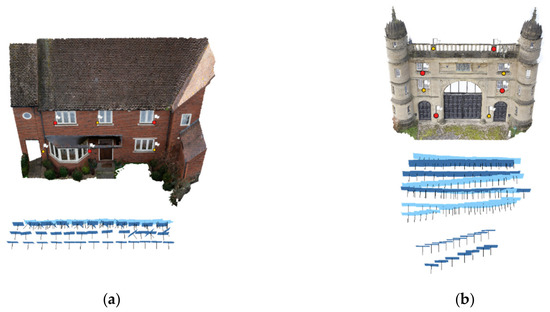
InfraRed Thermography (IRT), a non-invasive, non-contact, and non-destructive testing (NDT) technique, has become an established tool in the assessment of a building’s behavior and energy performance. However, the inherent low spatial resolution of thermal infrared (TIR) cameras has led recent work to fuse
[...] Read more.
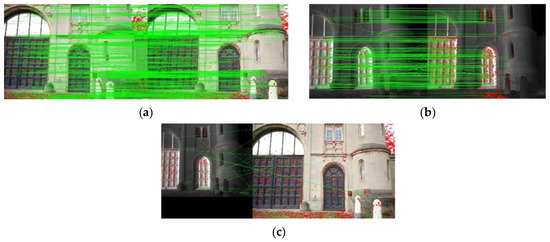
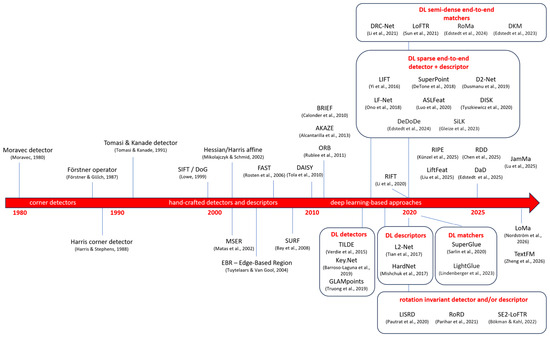
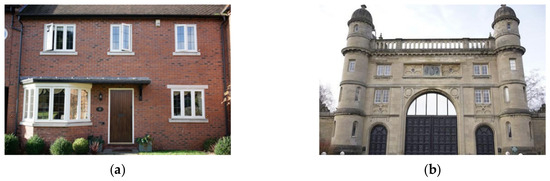
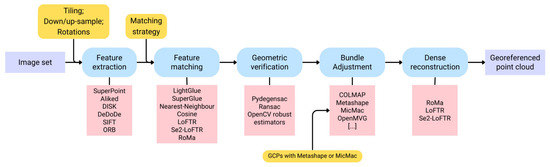
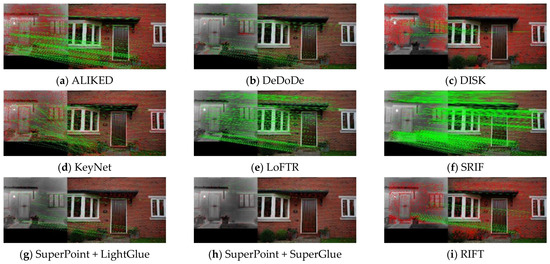
InfraRed Thermography (IRT), a non-invasive, non-contact, and non-destructive testing (NDT) technique, has become an established tool in the assessment of a building’s behavior and energy performance. However, the inherent low spatial resolution of thermal infrared (TIR) cameras has led recent work to fuse thermographic and geometric data to generate accurate 3D representations of buildings encapsulating temperature information. Whilst existing data fusion methods have relied on sensors in fixed relative orientation (RO), the co-registration of independent TIR and RGB blocks using ground control points (GCPs), or the reprojection of TIR images onto additional geometric or parametric models, approaches that directly match multi-modal images remain limited. In principle, if multi-modal tie points were available, it would be possible to directly align the RGB block with the TIR block; however, such matching is extremely challenging due to the substantial differences in radiometric properties. The main contribution of this paper is to demonstrate the applicability of off-the-shelf deep learning-based image matching algorithms, originally trained on mono-modal datasets, to multi-modal matching tasks for InfraRed Thermography 3D-Data Fusion (IRT-3DDF). We conduct a comparative evaluation of the principal algorithms developed in recent years, with particular emphasis on 3D accuracy and computational efficiency, under the hypothesis that, owing to the inherently local nature of the problem they address, these algorithms can generalize from a mono-modal training domain to a multi-modal application domain. The results are benchmarked against existing hand-crafted open-source multi-modal reference methods. Importantly, the proposed method is fully-automatic, obviating the need for sensor pre-calibration, manual co-registration, or associated positioning information. Results demonstrate that DL-based image matching, using pre-trained neural networks outside of their expected training domain, provides a viable approach for IRT-3DDF capable of co-registering blocks of multi-modal images across varying scales, settings, sensors, and subjects. Our results indicate accuracy in 3D is up to seven times better than multi-modal hand-crafted algorithms, while hand-crafted mono-modal methods fail to co-register images in their entirety.
Full article
(This article belongs to the Special Issue Innovative Remote Sensing Approaches: 3D Reconstruction, UAV Photogrammetry, and BIM in Cultural Heritage and Infrastructure)
►▼
Show Figures

Figure 1
Open AccessArticle
Benchmarking Indonesian Land Parcel Data Quality Regulations Against ISO 19157:2013 and International Geospatial Quality Frameworks: A Regulatory Gap Analysis
by
Hendry Yuli Wibowo, Trias Aditya and Nurrohmat Widjajanti
Geomatics 2026, 6(4), 82; https://doi.org/10.3390/geomatics6040082 - 23 Jul 2026
Abstract
►▼
Show Figures
Geospatial data quality assurance is fundamental to effective land administration, yet regulatory frameworks vary significantly in their incorporation of internationally recognized quality concepts. This study conducts a systematic regulatory gap analysis assessing the extent to which Indonesian land registration regulations incorporate the quality
[...] Read more.
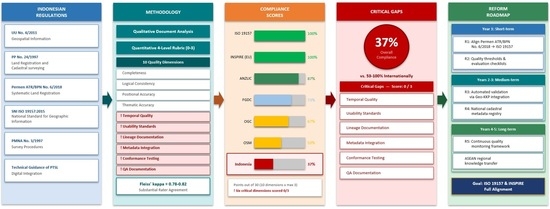
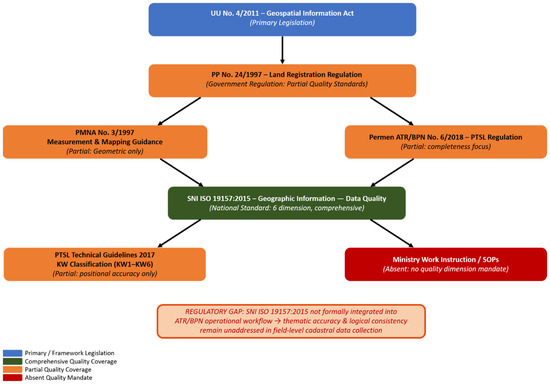
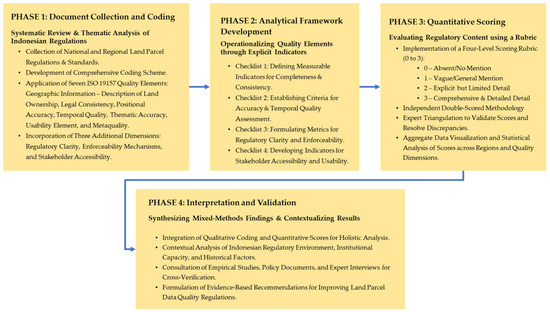
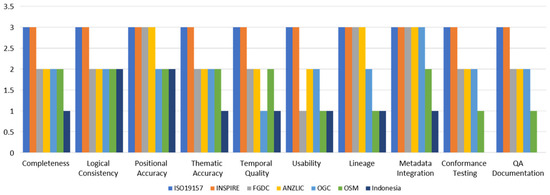
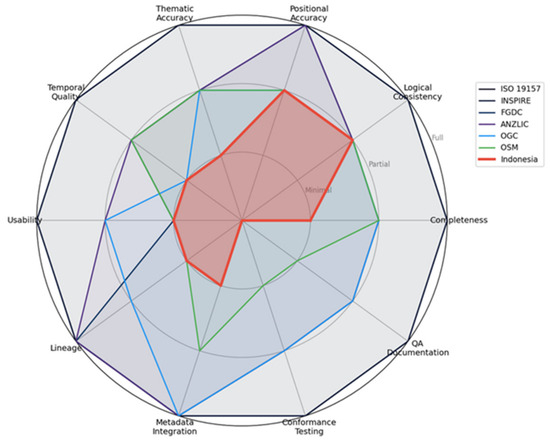
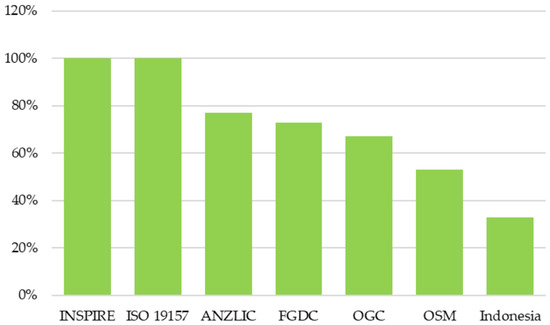
Geospatial data quality assurance is fundamental to effective land administration, yet regulatory frameworks vary significantly in their incorporation of internationally recognized quality concepts. This study conducts a systematic regulatory gap analysis assessing the extent to which Indonesian land registration regulations incorporate the quality concepts, measures, evaluation procedures, and reporting requirements defined by ISO 19157:2013. Employing a mixed-methods approach combining qualitative document analysis with a quantitative four-level scoring rubric across ten quality dimensions, we benchmark six Indonesian regulatory instruments against ISO 19157 and five international geospatial quality frameworks (INSPIRE, FGDC, ANZLIC, OGC, and OSM). Results reveal that the Indonesian regulatory framework achieves only 37% overall compliance (11/30 points), compared to 100% for ISO 19157 and INSPIRE, 77% for ANZLIC, 73% for FGDC, 67% for OGC, and 53% for OSM. Critical regulatory gaps exist in temporal quality, usability, lineage documentation, metadata integration, conformance testing, and quality assurance documentation. Inter-rater reliability analysis (Fleiss’ Kappa = 0.78–0.82) confirms the robustness of the scoring process. Based on these findings, we propose a phased, context-appropriate reform roadmap comprising five recommendations with short-term (Year 1), medium-term (Years 2–3), and long-term (Years 4–5) implementation timelines for achieving regulatory alignment with international standards. This regulatory baseline provides the essential foundation for subsequent empirical assessments of cadastral data quality in Indonesian land administration.
Full article

Graphical abstract
Open AccessArticle
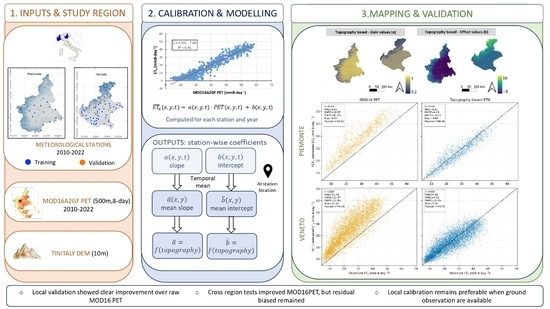
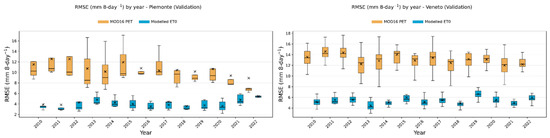
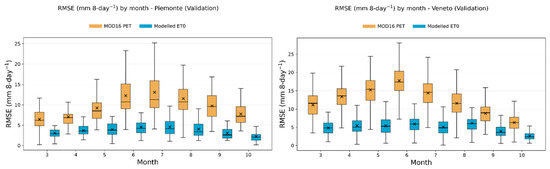
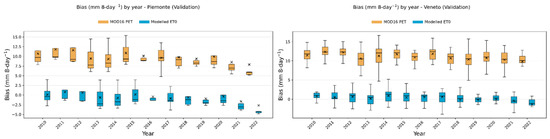
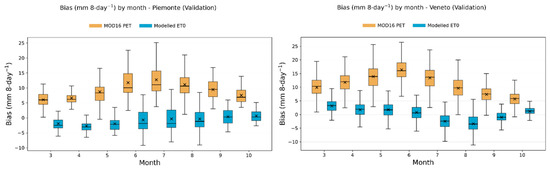
Topography-Constrained Correction of MOD16A2 PET for Estimating and Mapping ET0
by
Edoardo Ronco, Mirco Balin, Samuele De Petris, Salvatore Tuand, Marco Gianinetto and Enrico C. Borgogno-Mondino
Geomatics 2026, 6(4), 81; https://doi.org/10.3390/geomatics6040081 - 17 Jul 2026
Abstract
Reference evapotranspiration (ET0) is essential for irrigation management, but its spatial estimation is limited by sparse meteorological observations. Satellite products such as MOD16 potential evapotranspiration (PET) provide spatial continuity, yet they are not directly comparable to FAO-56 ET0 due to
[...] Read more.
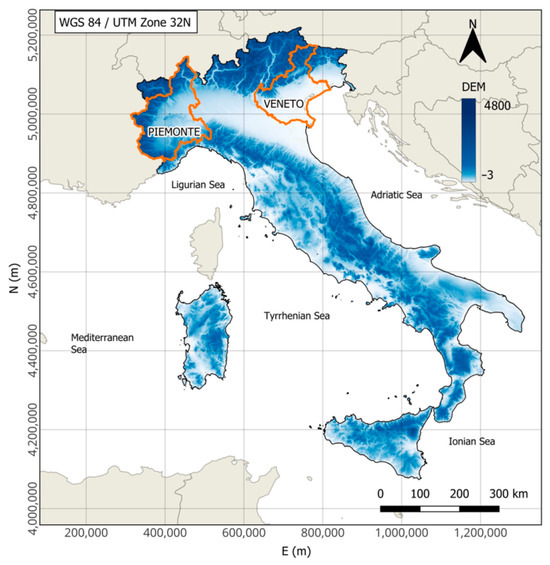
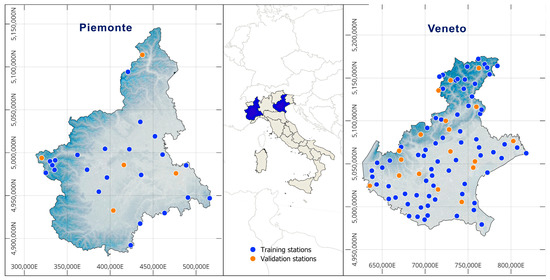
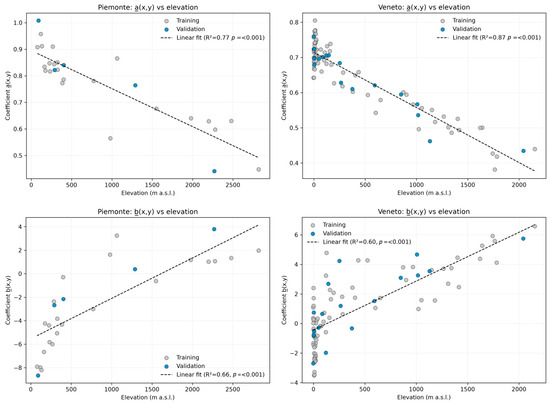
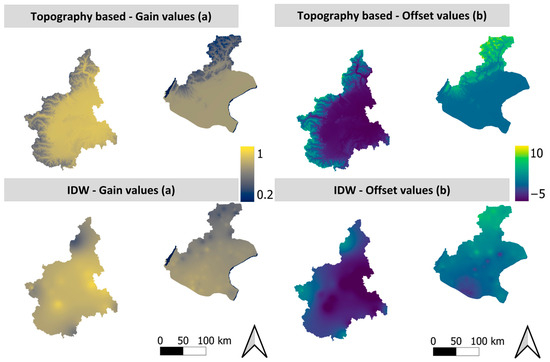
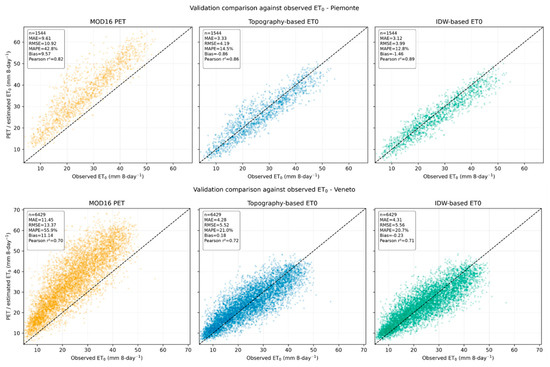
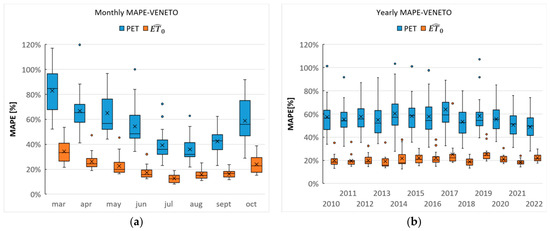
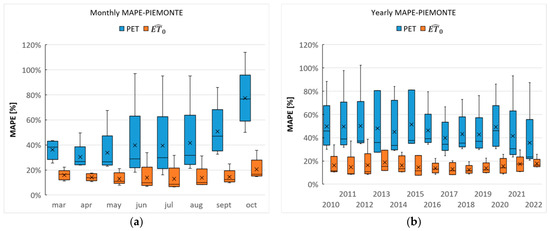
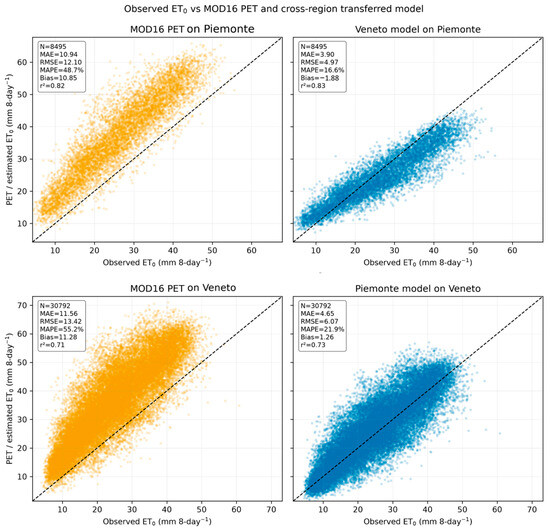
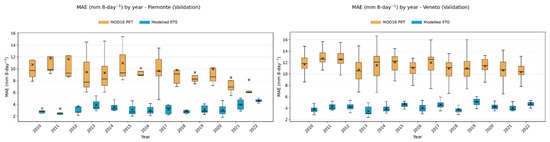
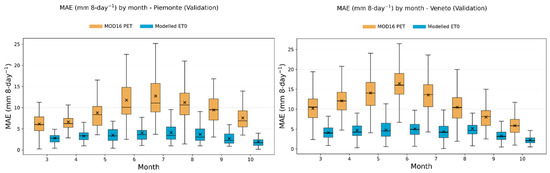
Reference evapotranspiration (ET0) is essential for irrigation management, but its spatial estimation is limited by sparse meteorological observations. Satellite products such as MOD16 potential evapotranspiration (PET) provide spatial continuity, yet they are not directly comparable to FAO-56 ET0 due to structural differences in model parameterization. This study proposes a topography-constrained framework to convert MOD16 PET into FAO-consistent ET0. The approach was tested in two heterogeneous regions of northern Italy (Piemonte and Veneto) using ground-based ET0 derived from the FAO Penman–Monteith equation (2010–2022). PET–ET0 transformation coefficients, estimated via station-wise linear regression, showed no significant temporal drift over the study period and strong spatial structure. Among the tested topographic predictors, elevation was retained as the main topographic proxy for modelling the spatial variability of the correction coefficients. The locally calibrated correction reduced the systematic overestimation of raw MOD16 PET and improved agreement with station-based ET0 in both regions. Its performance was comparable to an IDW interpolation benchmark, although IDW slightly outperformed the topography-based model in Piemonte. A cross-region test showed that the correction reduced MOD16 PET errors when transferred between Piemonte and Veneto, but residual bias remained. The proposed framework should therefore be interpreted as a parsimonious regional topographic correction approach that requires local calibration and validation before application to other areas.
Full article
(This article belongs to the Special Issue Advances and Innovations in Geomatics: Celebrating a New Chapter—First Impact Factor and CiteScore Received)
►▼
Show Figures

Graphical abstract
Open AccessArticle
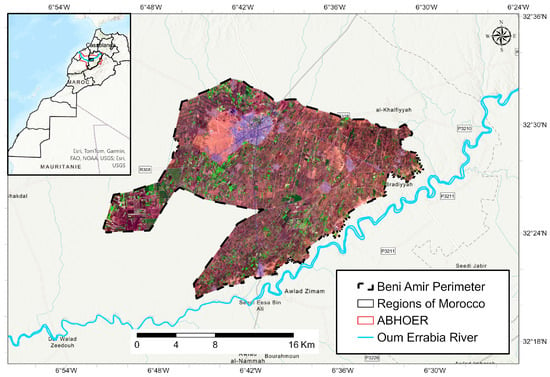
Spatio-Temporal Assessment of Drought Impacts on Olive Groves Using Sentinel-2 and CHIRPS Data in Central Morocco: A Case Study of the Beni-Amir Perimeter, Central Morocco
by
Ayoub Daiz, Abderrazak El Harti, El Hassania El Hamzaoui, Jaouad El Atiq and Soufiane Hajaj
Geomatics 2026, 6(4), 80; https://doi.org/10.3390/geomatics6040080 - 16 Jul 2026
Abstract
►▼
Show Figures
Climate variability represents a major threat to agricultural systems, particularly in arid and semi-arid regions such as the Beni-Amir irrigated perimeter, located in the Tadla plain in central Morocco. In this perimeter, olive trees are exposed to multiple environmental and management-related factors that
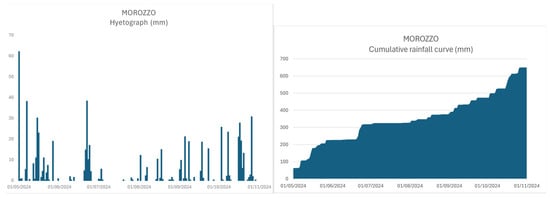
[...] Read more.
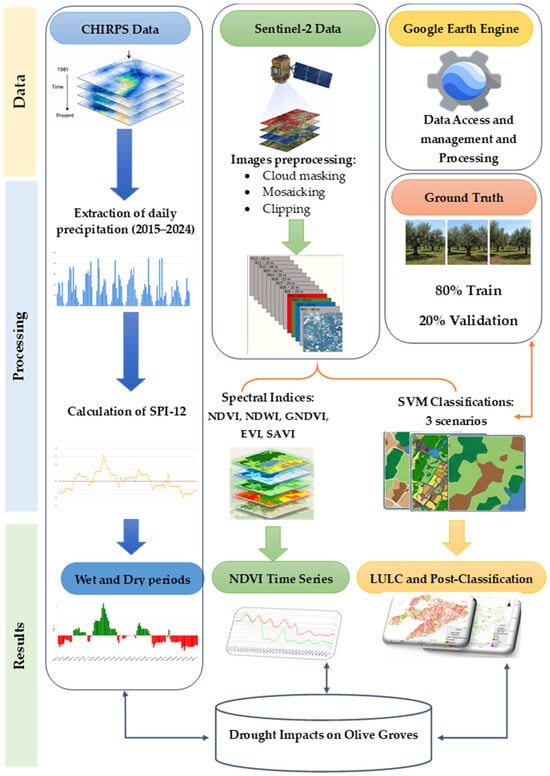
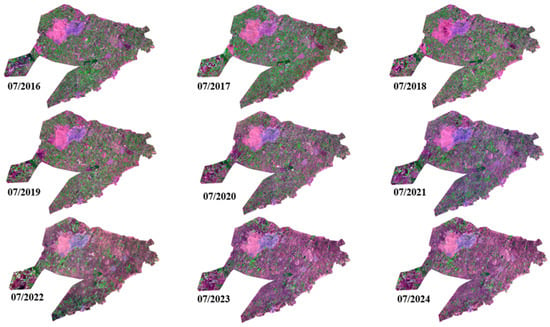
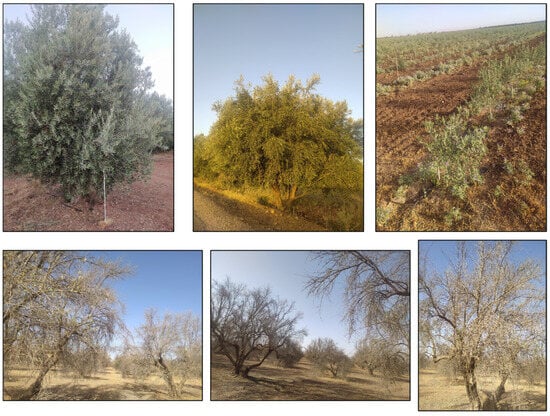
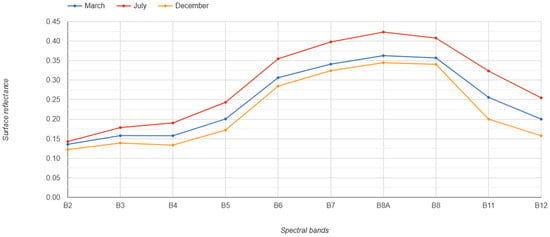
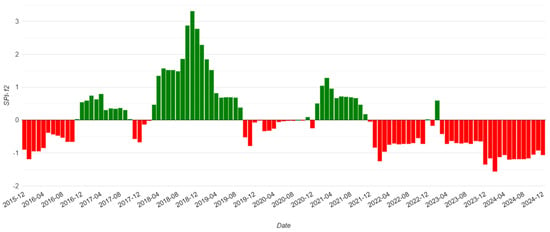
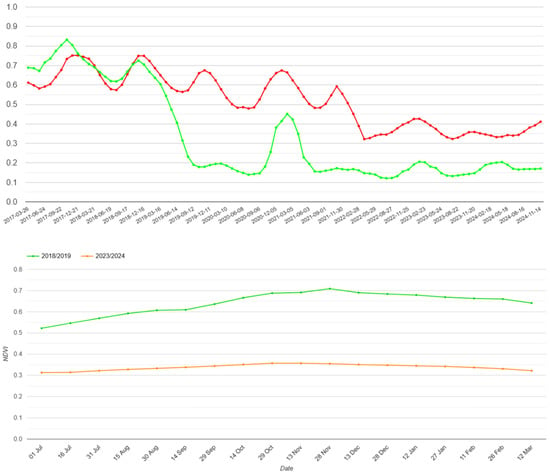
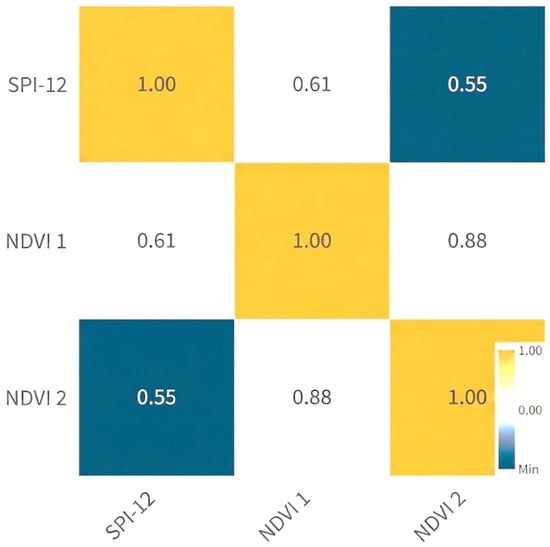
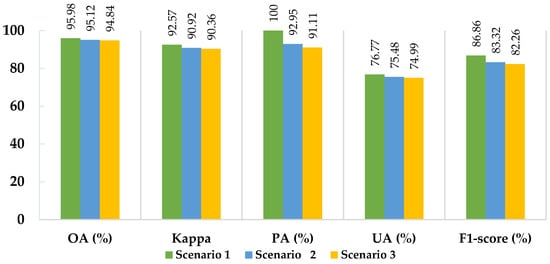
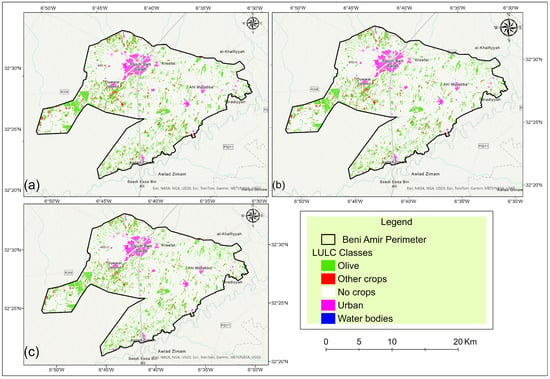
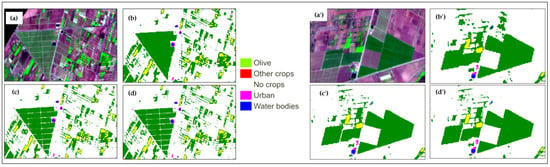
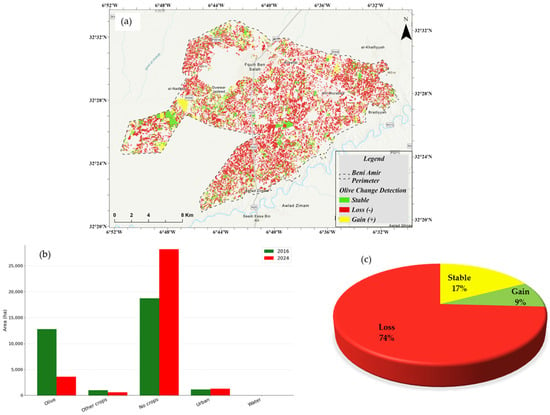
Climate variability represents a major threat to agricultural systems, particularly in arid and semi-arid regions such as the Beni-Amir irrigated perimeter, located in the Tadla plain in central Morocco. In this perimeter, olive trees are exposed to multiple environmental and management-related factors that are associated with variations in phenology and vegetation vigor, such as successive drought episodes. This study represents a spatio-temporal assessment of drought impact on olive using satellite- derived vegetation indices from Sentinel-2 imagery and precipitation satellite data from CHIRPS over the period 2015–2024. The Standardized Precipitation Index (SPI-12) was used to identify wet and dry phases over this period. The results indicate an alternation of dry and wet periods between 2015 and 2021, followed by a predominance of dry conditions from September 2021. Over the same period, the time series of the Normalized Difference Vegetation Index (NDVI) and the other vegetation indices reveals marked interannual variability and a progressive degradation of olive tree phenological cycles. A land cover map derived from a supervised support vector machine (SVM) under three classification scenarios achieved high overall accuracies exceeding 94%. Post-classification change detection highlights a substantial reduction in mapped olive-growing areas between 2016 and 2024, with an estimated 72% loss of the initial area. The findings reported in this study indicate that the succession of drought episodes may have contributed to olive grove degradation, including disruptions in phenological cycles and a decline in maximum NDVI values. Even the most resilient olive groves appeared affected following the severe drought period after 2021. The study underscores the usefulness of satellite-derived vegetation indices and drought indicators for the effective monitoring of drought-related stress and supporting improved management practices under climate change.
Full article

Figure 1
Open AccessArticle
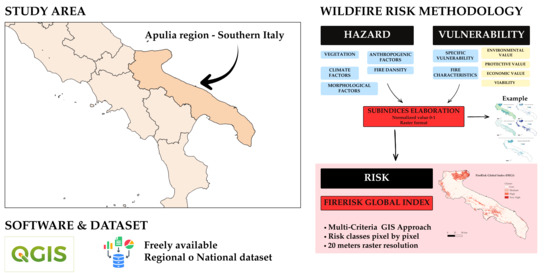
A Multi-Criteria Open-Source GIS Approach for Wildfire Risk Mapping: Methodology and Application in the Apulia Region (Southern Italy)
by
Gabriele Nolè, Antonio Lanorte and Giuseppe Cillis
Geomatics 2026, 6(4), 79; https://doi.org/10.3390/geomatics6040079 - 15 Jul 2026
Abstract
►▼
Show Figures
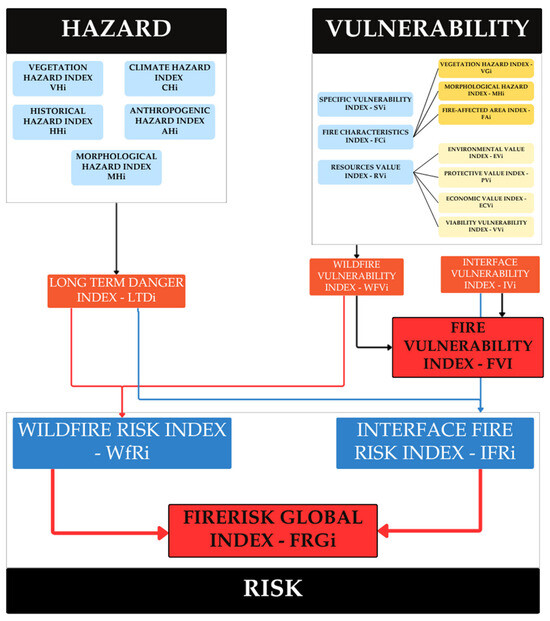
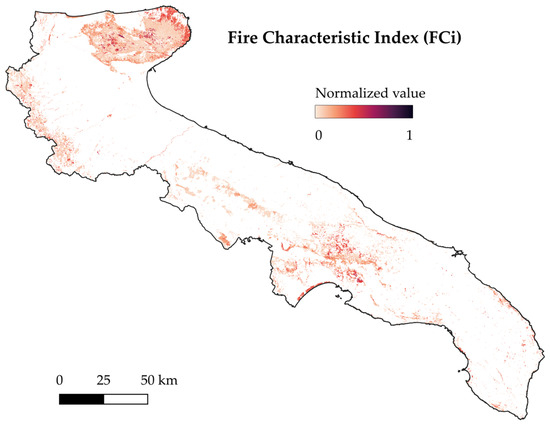
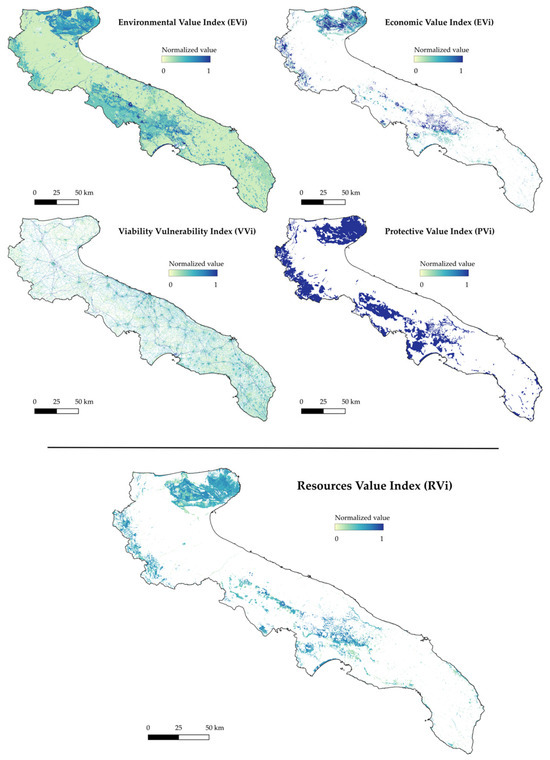
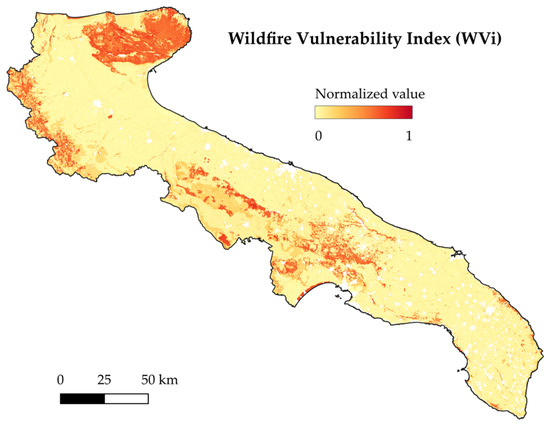
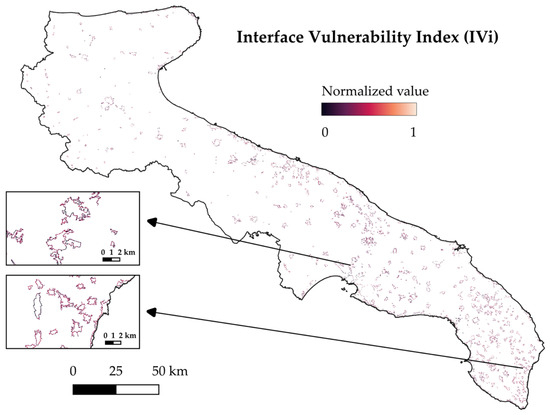
Wildfires are an increasing threat to Mediterranean ecosystems and populated areas. This study proposes an innovative static wildfire risk assessment methodology for the Apulia Region (southern Italy). The framework produces a Fire Risk Global Index (FRGi) by spatially combining two sub-indices related to
[...] Read more.
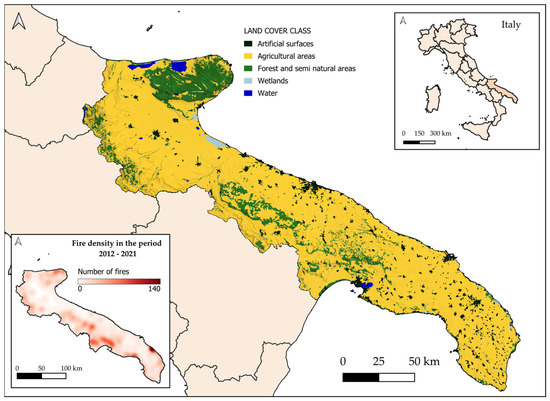
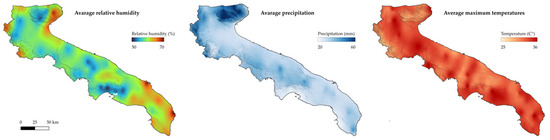
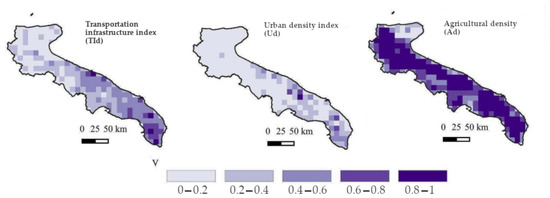
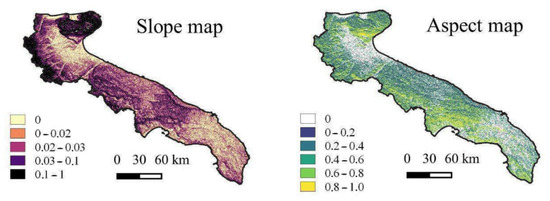
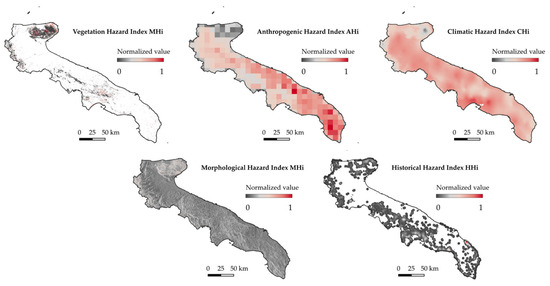
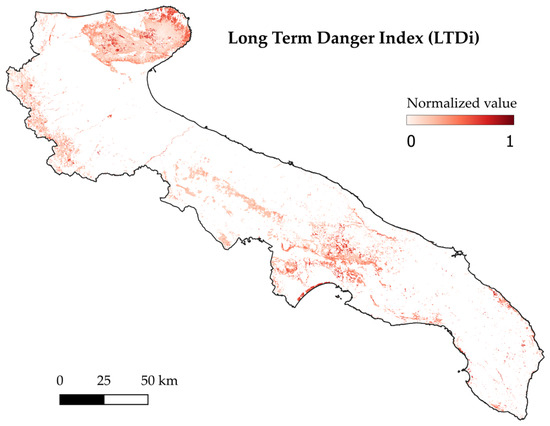
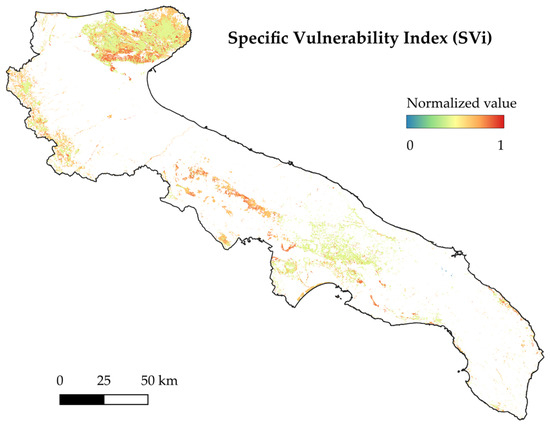
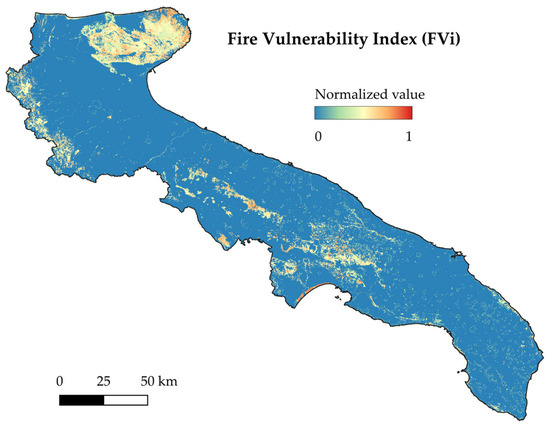
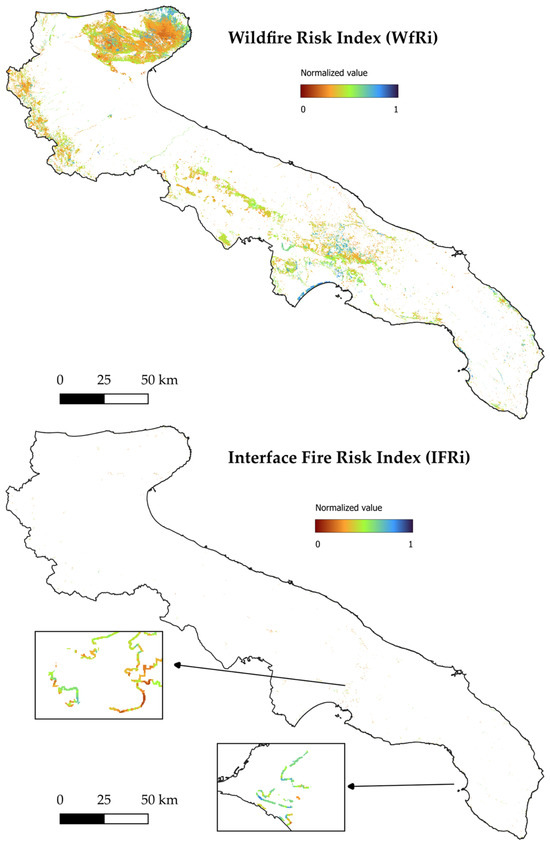
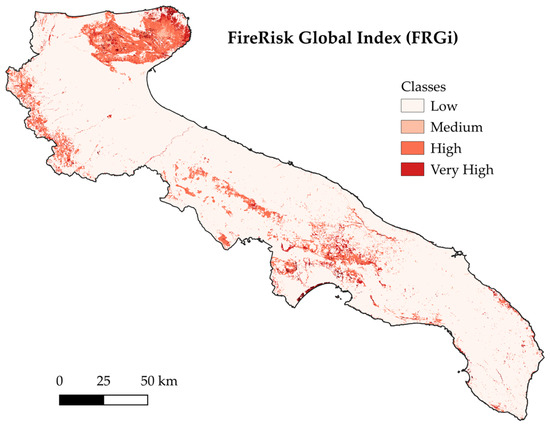
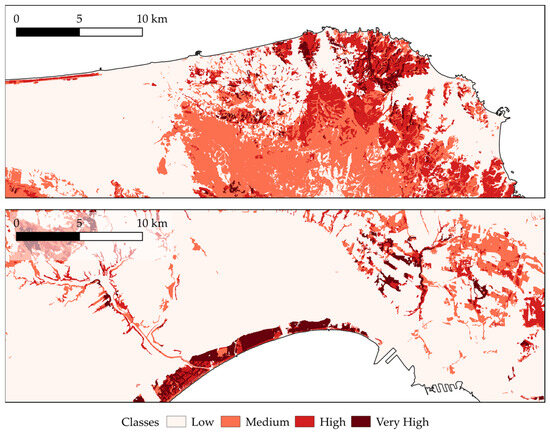
Wildfires are an increasing threat to Mediterranean ecosystems and populated areas. This study proposes an innovative static wildfire risk assessment methodology for the Apulia Region (southern Italy). The framework produces a Fire Risk Global Index (FRGi) by spatially combining two sub-indices related to risk, which are hazard and vulnerability, in line with European Community and United Nations guidelines. Hazard is quantified through five sub-indices—vegetational, historical, climatic, morphological, and anthropogenic—combined into a Long-Term Danger Index (LTDi). Vulnerability integrates ecological, economic, and wildland-urban interface components into a Fire Vulnerability Index (FVi). All processing was performed in an open-source GIS environment (QGIS) at a spatial resolution of 20 m, ensuring full reproducibility for public administrations. Preliminary validation confirms the internal consistency of the model, demonstrating a statistically significant relationship between risk classes and historical fire occurrence. Beyond its scientific contribution, the methodology serves as an operational tool for civil protection planning at the regional scale.
Full article

Graphical abstract
Open AccessArticle
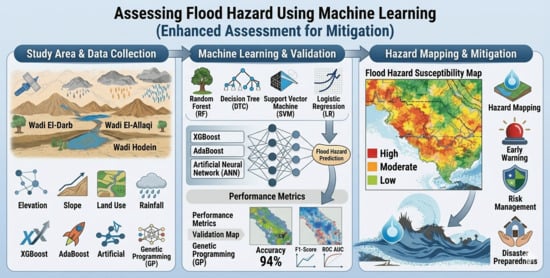
Assessing Flood Susceptibility Using Machine Learning in Arid Regions
by
Mostafa Mashal, Doaa Amin, Mona A. Hagras and Ashraf M. Elmoustafa
Geomatics 2026, 6(4), 78; https://doi.org/10.3390/geomatics6040078 - 14 Jul 2026
Abstract
Flash floods are among the most destructive natural hazards, often causing substantial loss of life and severe damage to infrastructure and property. Predicting flood-prone areas remains challenging because flood generation is controlled by complex interactions among topographic, hydrological, climatic, and environmental factors. In
[...] Read more.
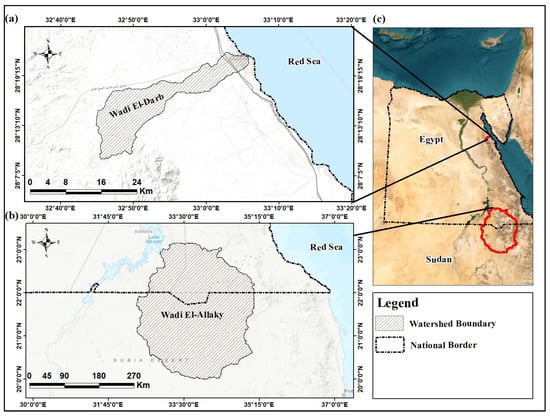
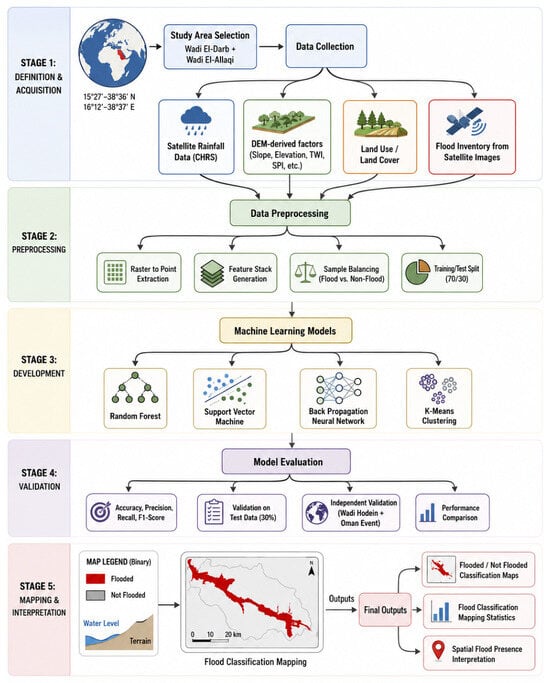
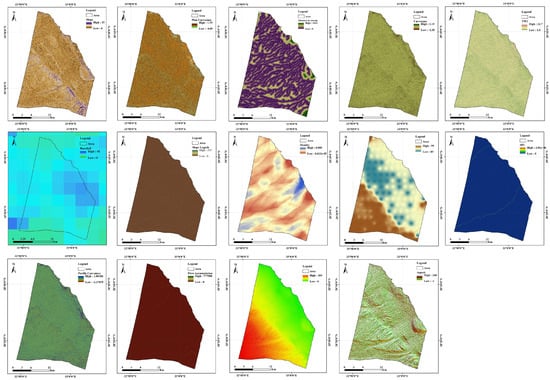
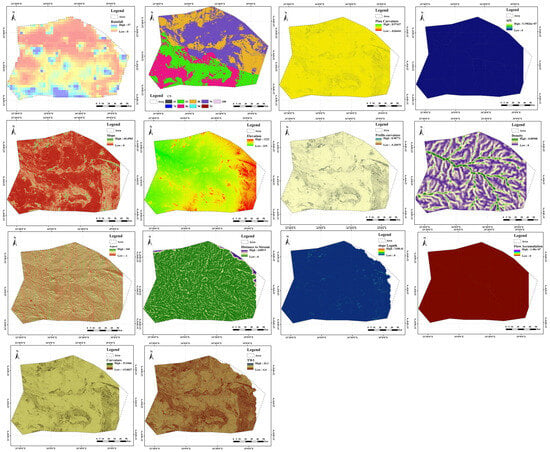
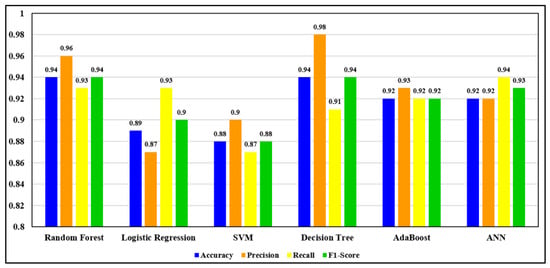
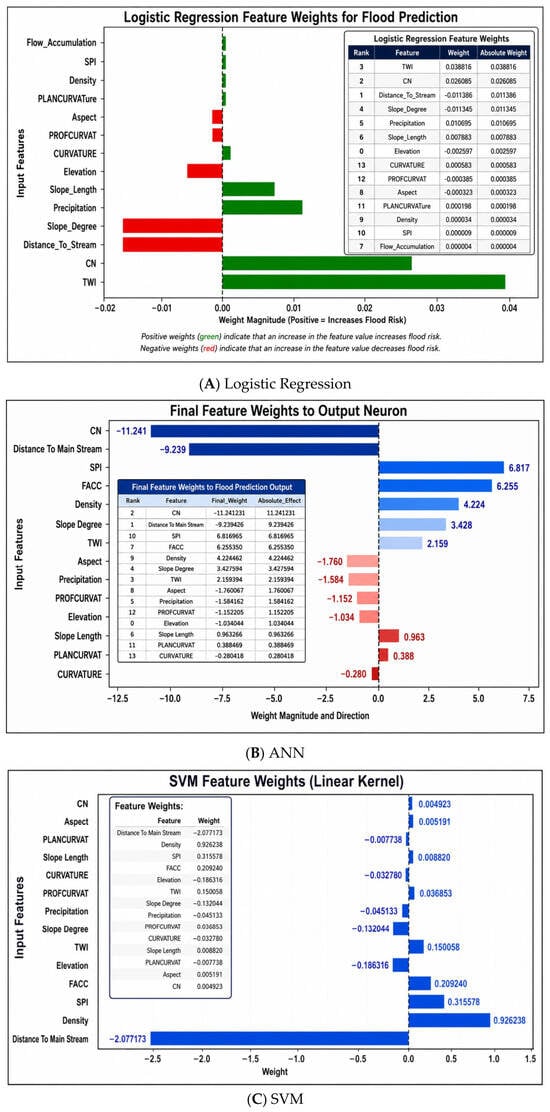
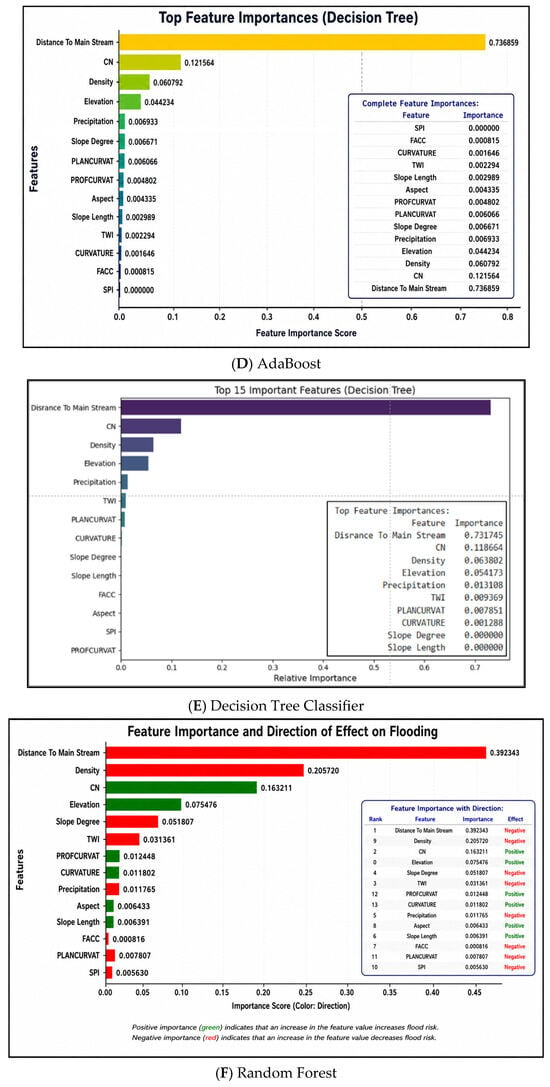
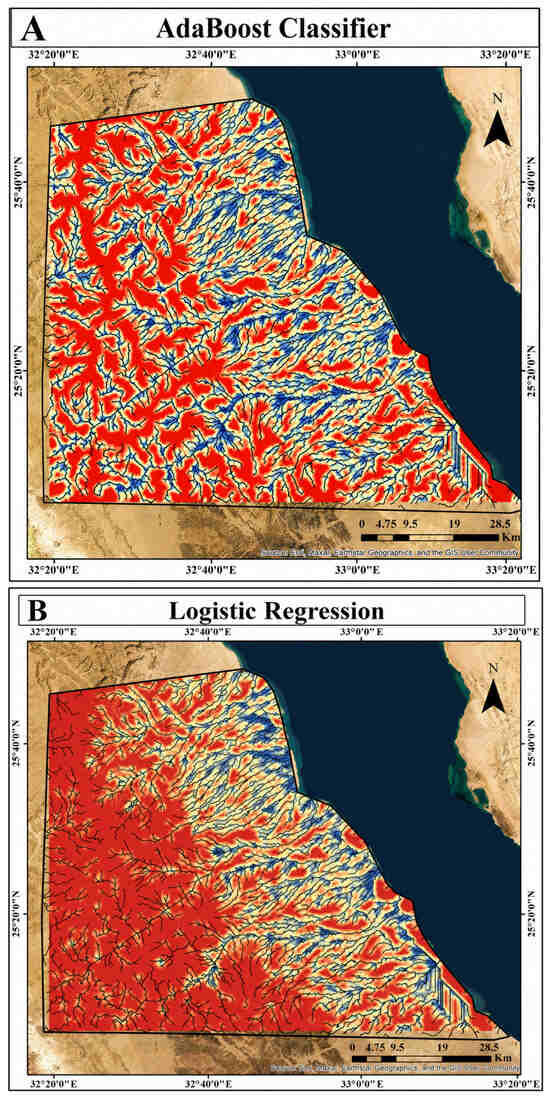
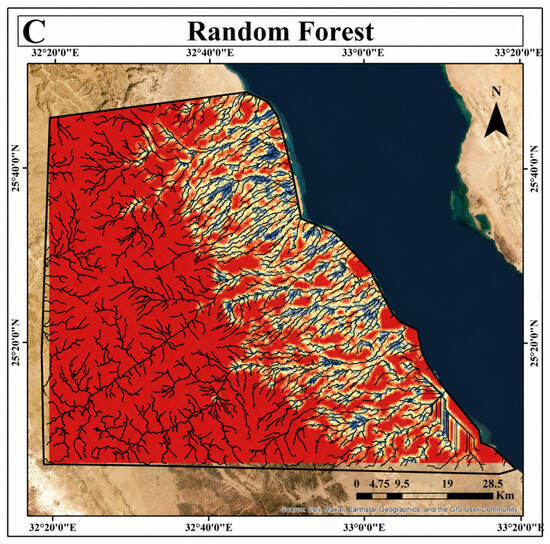
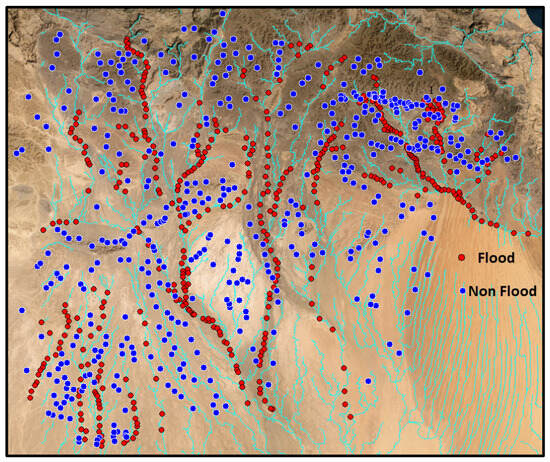
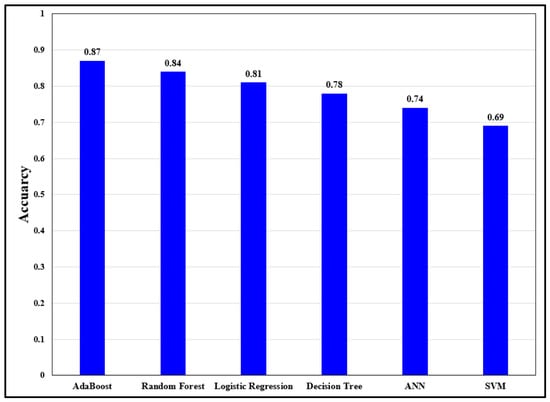
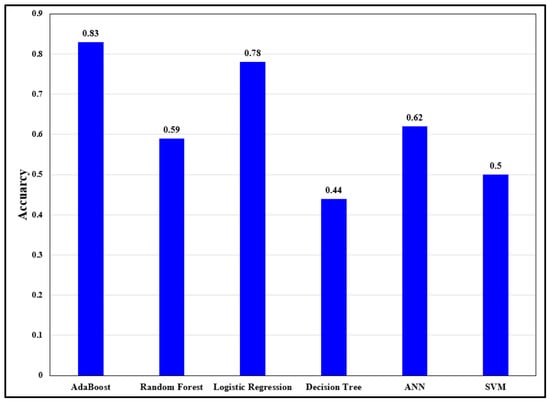
Flash floods are among the most destructive natural hazards, often causing substantial loss of life and severe damage to infrastructure and property. Predicting flood-prone areas remains challenging because flood generation is controlled by complex interactions among topographic, hydrological, climatic, and environmental factors. In this study, six machine learning algorithms—Random Forest (RF), Logistic Regression (LR), Support Vector Machine (SVM), Decision Tree Classifier (DTC), AdaBoost, and Artificial Neural Network (ANN)—were developed to predict flash-flood inundation locations using satellite-derived flood inventories from two major rainfall events in Wadi El-Darb and Wadi El-Allaqi, Egypt. Model performance was evaluated using accuracy, precision, recall, and F1-score. During model development, Random Forest and Decision Tree Classifier achieved the highest prediction accuracy (94%), followed by AdaBoost and ANN (92%), while Logistic Regression (89%) and SVM (88%) also produced satisfactory results. To evaluate model generalization, the trained models were independently validated using a rainfall event in Wadi Hodein (Egypt) and a major flash-flood event that occurred in Oman during April 2024. The external validation showed that AdaBoost achieved the highest predictive performance in both validation basins, with accuracies of 87% for Wadi Hodein and 83% for Oman, providing encouraging initial evidence of applicability across hydrologically similar arid watersheds, While AdaBoost and Logistic Regression maintained satisfactory performance during external validation, other algorithms exhibited noticeable reductions in recall and F1-score, particularly in the Oman case study, indicating variability in model generalization across independent watersheds These findings suggest that the proposed framework may support flood susceptibility assessment in ungauged arid environments with comparable hydrological characteristics, although further validation across a wider range of climatic and geological settings is needed. Overall, the results highlight the value of integrating satellite remote sensing with machine learning to support flood hazard assessment, disaster preparedness, early warning systems, and flood risk management in data-scarce regions.
Full article
(This article belongs to the Topic Advances in Hydrological Remote Sensing)
►▼
Show Figures

Graphical abstract
Open AccessArticle
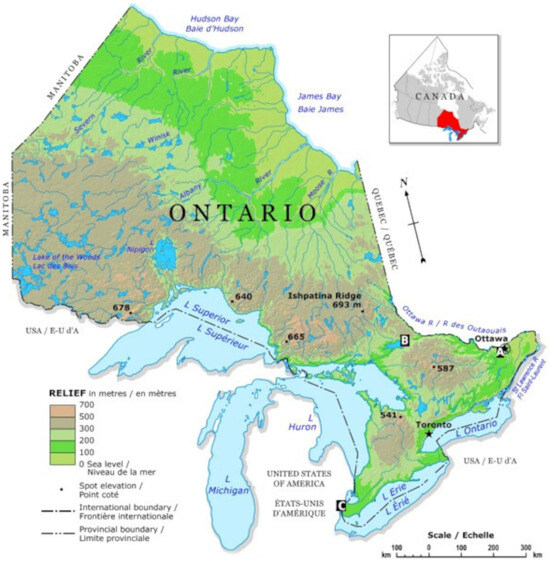
Pilot-Site Land Cover Mapping Using an Externally-Guided Clustering Framework: A Case Study from Ontario, Canada
by
Sondos Omar, Reza Shahidi, Masoud Mahdianpari and Fariba Mohammadimanesh
Geomatics 2026, 6(4), 77; https://doi.org/10.3390/geomatics6040077 - 10 Jul 2026
Abstract
►▼
Show Figures
High-resolution land cover classification is critical for monitoring environmental change and managing natural resources. This study presents an unsupervised framework with externally guided feature prioritization that integrates Sentinel-1 synthetic aperture radar (SAR) and Sentinel-2 optical imagery at 10 m spatial resolution. A cloud-native
[...] Read more.
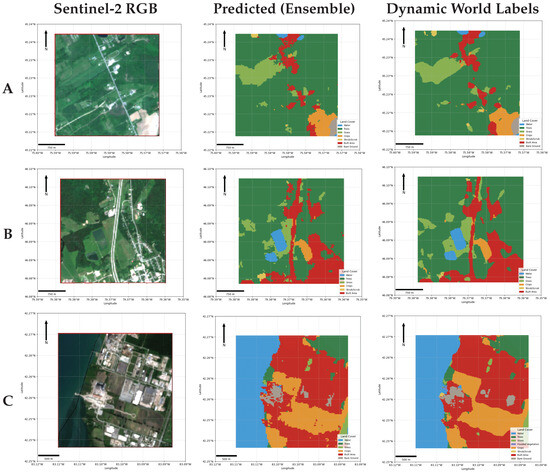
High-resolution land cover classification is critical for monitoring environmental change and managing natural resources. This study presents an unsupervised framework with externally guided feature prioritization that integrates Sentinel-1 synthetic aperture radar (SAR) and Sentinel-2 optical imagery at 10 m spatial resolution. A cloud-native export protocol in Google Earth Engine (GEE) enables the generation of consistent, cloud-free, and snow-free seasonal composites across Ontario, Canada. A comprehensive feature engineering pipeline combines spectral indices, radar backscatter metrics, terrain derivatives from digital elevation models (DEMs), and temporal statistics to create a rich multi-sensor input space. Dimensionality reduction is performed using Sparse Principal Component Analysis (SparsePCA) and mutual-information-based feature selection. Clustering is conducted using three complementary algorithms: centroid-based K-means, density-based Hierarchical Density-Based Spatial Clustering of Applications with Noise (HDBSCAN), and reachability-based Ordering Points To Identify the Clustering Structure (OPTICS). Final land cover labels are assigned via a majority-voting ensemble, with prediction ties resolved deterministically using OPTICS. OPTICS is particularly effective for modeling heterogeneous landscapes due to its ability to detect clusters of varying density without requiring a global threshold. This study is designed as a pilot-site methodological demonstration using three representative 2 km × 2 km regions in Ontario, rather than a full provincial-scale land cover product. The resulting classification maps are validated against reference land cover data, demonstrating the effectiveness and potential scalability of the proposed external-label guided unsupervised mapping approach.
Full article

Figure 1
Open AccessArticle
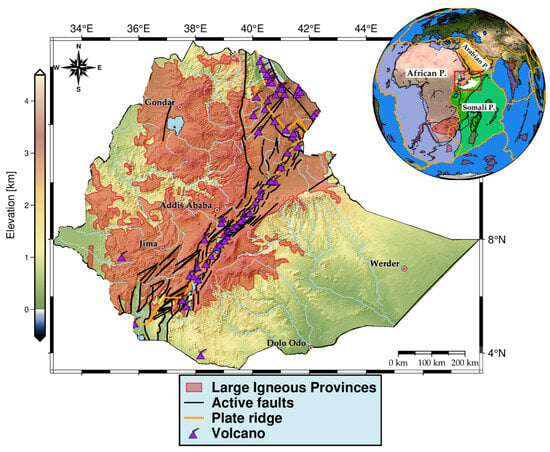
Rock Density Model of Ethiopia and Its Implications for Gravimetric Geodesy and Geophysics
by
Natnael Agegnehu Ayele, Robert Tenzer, Franck Eitel Kemgang Ghomsi, Andenet Ashagrie Gedamu and Muralitharan Jothimani
Geomatics 2026, 6(4), 76; https://doi.org/10.3390/geomatics6040076 - 9 Jul 2026
Abstract
►▼
Show Figures
Robust and accurate lithological parameters are essential in engineering, geology, geophysics, geodesy, and resource exploration. Among these parameters, rock density plays a fundamental role in gravimetric geodesy and geophysics. However, the systematic collection, analysis, and categorization of rock density data remain insufficient in
[...] Read more.
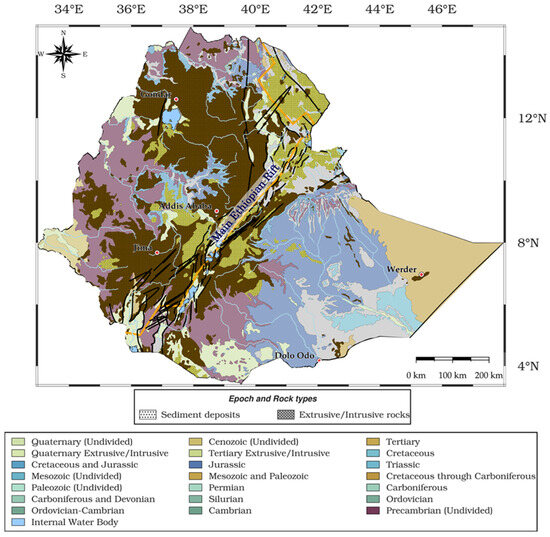
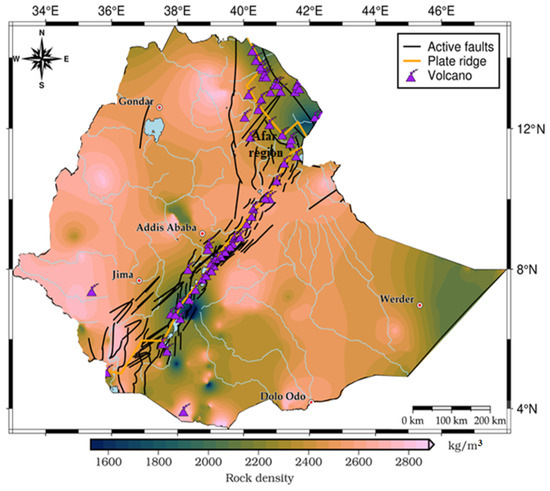
Robust and accurate lithological parameters are essential in engineering, geology, geophysics, geodesy, and resource exploration. Among these parameters, rock density plays a fundamental role in gravimetric geodesy and geophysics. However, the systematic collection, analysis, and categorization of rock density data remain insufficient in many countries around the world, including Ethiopia. Ethiopia is characterized by extreme topographic variations (exceeding 4500 m) and complex geology, dominated by Cenozoic volcanic formations associated with the East African Rift System. Consequently, the commonly adopted upper continental crustal density of 2670 kg/m3 is inadequate for precise geodetic applications (e.g., the definition and realization of the geodetic vertical datum) as well as for gravimetric modeling and interpretation (e.g., the compilation of Bouguer, isostatic, and mantle gravity maps) in the country. To address these limitations, we prepared the first comprehensive digital rock density model of Ethiopia, with a particular focus on its applications in gravimetric geodesy and geophysics. The rock density model has been prepared by integrating the Ethiopian geological database, comprising 88 lithological units, with established global rock-density databases to assign representative density values and their uncertainties to each geological unit. The height-weighted average densities, accounting for the mass contribution of elevated terrain, were computed from a 90-m-resolution digital elevation model. The rock density map shows significant density variations across Ethiopia, ranging from 1528 to 2892 kg/m3. The average height-weighted density of Ethiopia is 2430 ± 352 kg/m3, which is 9% lower than the standard density of 2670 kg/m3. We expect that the use of the rock density model instead of assuming only a constant density value for the whole country will improve the accuracy of gravimetric geoid modeling and orthometric height determination, both essential for the modernization of the geodetic vertical datum. This demonstrates the necessity of region-specific density models for countries in tectonically active and/or geologically complex settings. The study also provides a transferable methodological framework for developing similar products in other data-sparse regions.
Full article

Figure 1
Open AccessArticle
Vertical Accuracy Assessment of the MOASURE 2 for DTM Generation in Urban Environments
by
Abdullah Kamel, Yehia Miky and Ahmed Al Shouny
Geomatics 2026, 6(4), 75; https://doi.org/10.3390/geomatics6040075 - 6 Jul 2026
Abstract
►▼
Show Figures
Digital terrain models (DTMs) are essential elevation datasets that represent the morphology of the Earth’s surface and play a critical role in applications, such as urban planning, civil engineering, infrastructure design, and environmental assessment. However, the excessive cost remains the major challenge in
[...] Read more.
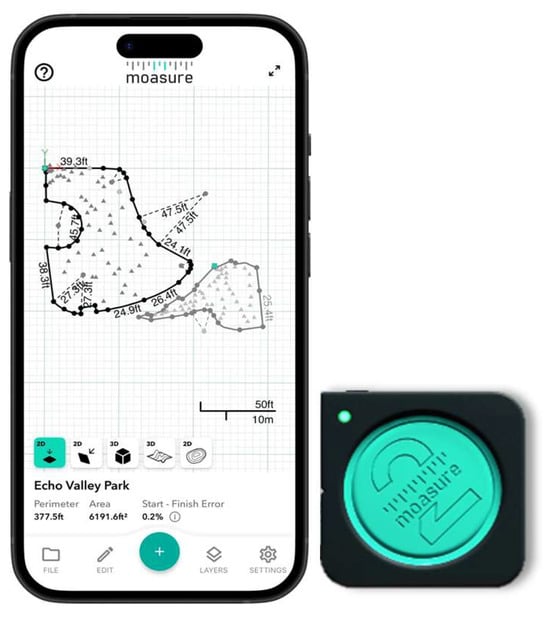
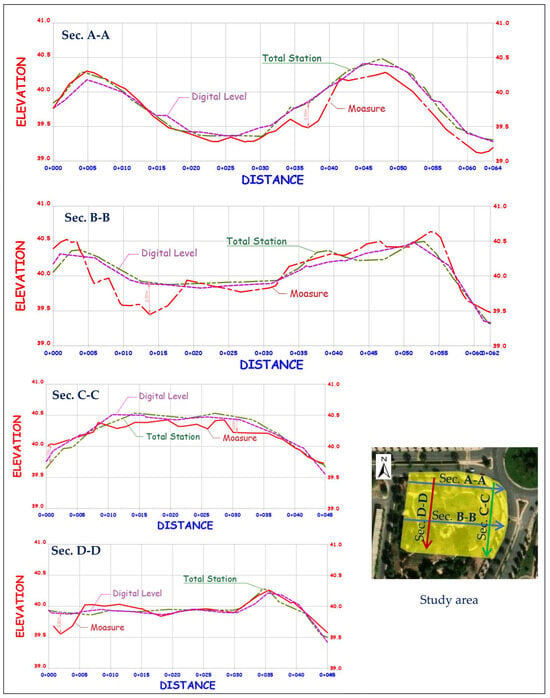
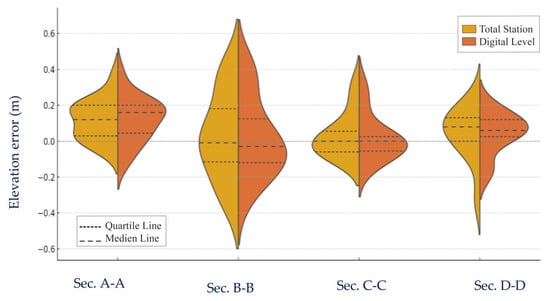
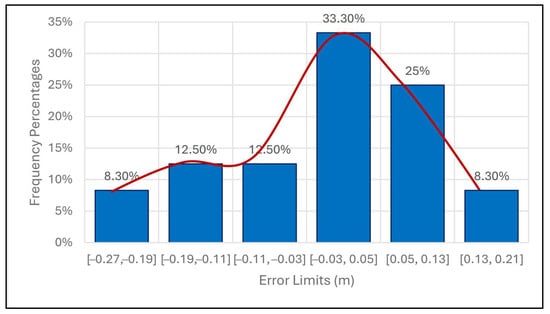
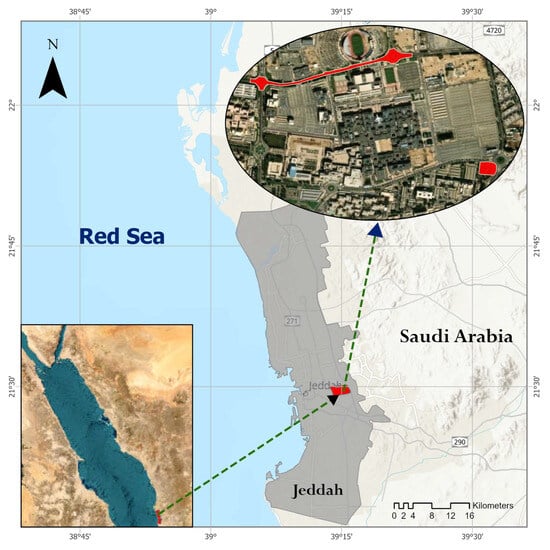
Digital terrain models (DTMs) are essential elevation datasets that represent the morphology of the Earth’s surface and play a critical role in applications, such as urban planning, civil engineering, infrastructure design, and environmental assessment. However, the excessive cost remains the major challenge in obtaining accurate terrain models. Recent advancements in low-cost inertial navigation and motion-sensing technologies offer significant potential to enhance the cost-effectiveness of surveying projects. This study investigates the vertical accuracy and operational usability of a handheld inertial measurement unit (IMU) device (Moasure 2) for DTM generation in urban environments through the comparison with traditional total station and digital levels procedures. It also assesses the device compliance with The American Society for Photogrammetry and Remote Sensing (ASPRS) Positional Accuracy Standards. For this purpose, a comprehensive field survey was conducted in a small urban area characterized by varied terrain morphology. The vertical accuracy of the Moasure 2 was acceptable for many urban mapping applications based on a rigorous analysis of checkpoint data and error patterns, which were quantitatively assessed relative to reference surfaces. Profile-based validation showed that the elevation differences between similar terrain types were mainly within ±25 cm, with minimal bias and symmetric error distributions. The findings indicate that Moasure 2 can be a viable alternative tool for fast DTM generation in low-cost urban projects. It offers significant advantages in terms of portability, ease of use, and reduced fieldwork time compared to conventional methodologies. Furthermore, this study addresses the critical gap in the validation of the new IMU-based surveying technology and provides evidence for choosing appropriate equipment for urban terrain modeling.
Full article

Figure 1
Open AccessReview
Artificial Intelligence and Total Electron Content in Earthquake-Related Seismo-Ionospheric Analysis: A Mapping Review
by
Félix Díaz, Nhell Cerna, Rafael Liza and Bryan Motta
Geomatics 2026, 6(4), 74; https://doi.org/10.3390/geomatics6040074 - 3 Jul 2026
Abstract
►▼
Show Figures
Artificial intelligence is increasingly applied to earthquake-related seismo-ionospheric analysis with total electron content (TEC), but whether this literature is converging methodologically remains unresolved. We conducted a mapping review of 56 English-language journal articles retrieved from Scopus and Web of Science to characterize how
[...] Read more.
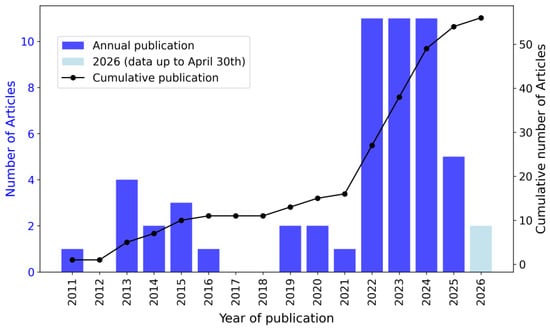
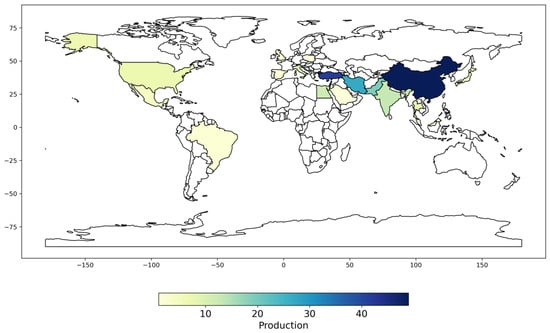
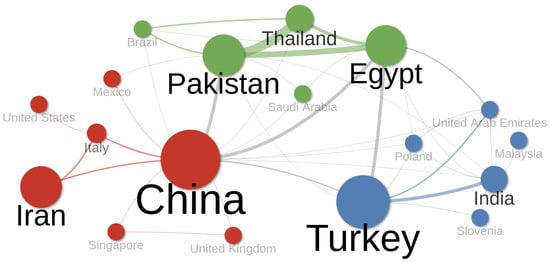
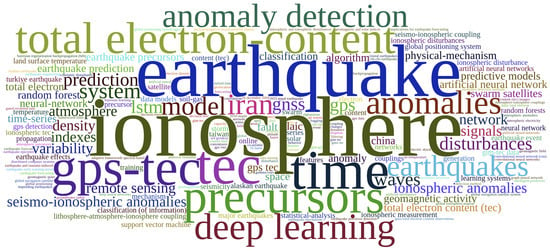
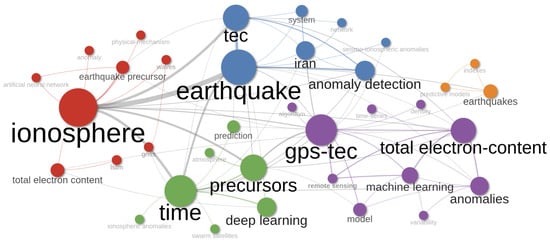
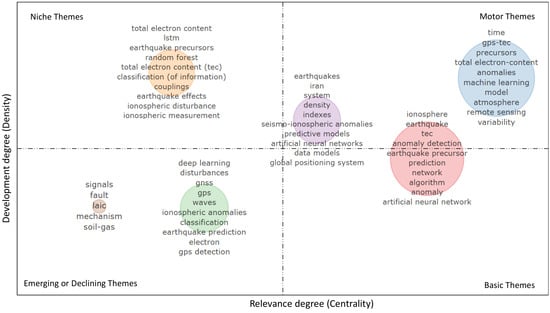
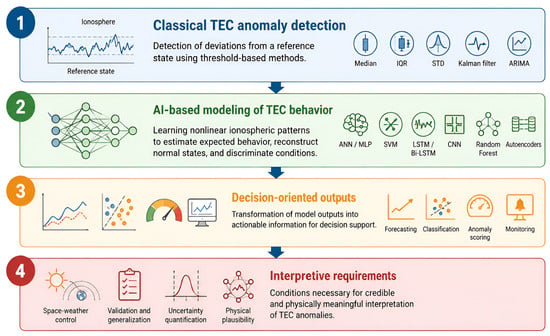
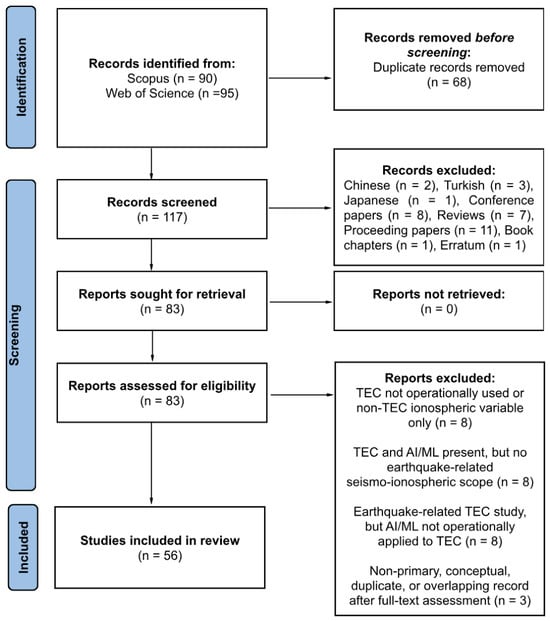
Artificial intelligence is increasingly applied to earthquake-related seismo-ionospheric analysis with total electron content (TEC), but whether this literature is converging methodologically remains unresolved. We conducted a mapping review of 56 English-language journal articles retrieved from Scopus and Web of Science to characterize how artificial intelligence and computational intelligence methods are used with TEC in seismo-ionospheric and multi-precursor frameworks. The corpus shows recent growth in scientific production, strong concentration in a limited set of countries, institutions, and journals, and a stable conceptual backbone centered on earthquake, ionosphere, TEC, GPS-TEC, precursors, prediction-related terminology, anomaly detection, machine learning, and deep learning. However, full-text synthesis of the included studies shows that this thematic coherence coexists with substantial methodological divergence. We identified a transition from classical TEC anomaly detection toward AI-assisted decision systems, including models that forecast expected TEC behavior, flag candidate anomalies, classify precursor-like or disturbance-related states, and support monitoring-oriented outputs. We also identified a distinct operational strand focused on near-real-time detection of coseismic and tsunami-related ionospheric disturbances rather than deterministic earthquake prediction. Across these formulations, anomaly definitions, TEC representations, confounder control, baselines, uncertainty handling, and validation strategies remain pipeline-dependent, which limits cumulative comparability and physical interpretability across studies. These findings indicate that the field is thematically focused but not yet methodologically unified. Future progress will depend less on adding isolated case studies and more on clearer anomaly criteria, stronger control of solar and geomagnetic effects, explicit baselines, event-wise and region-wise validation, systematic false-alarm reporting, uncertainty-aware outputs, and transparent documentation of preprocessing and modeling decisions.
Full article

Figure 1
Open AccessArticle
Spatiotemporal Modeling and Uncertainty Quantification of Reference Evapotranspiration Using Machine Learning and Bayesian Model Averaging in Benin
by
Bienvenue Christela Finounou Mizele, Modeste Meliho, Vinasetan Ratheil Houndji, Semevo Arnaud R. M. Ahouandjinou and Collins A. Orlando
Geomatics 2026, 6(4), 73; https://doi.org/10.3390/geomatics6040073 - 2 Jul 2026
Cited by 1
Abstract
Reference evapotranspiration (ET0) represents the atmospheric demand for water from a well-watered vegetated surface and is a key component of the hydrological cycle and agricultural water management. This study evaluated the performance of seven machine learning (ML) models: linear regression (LR),
[...] Read more.
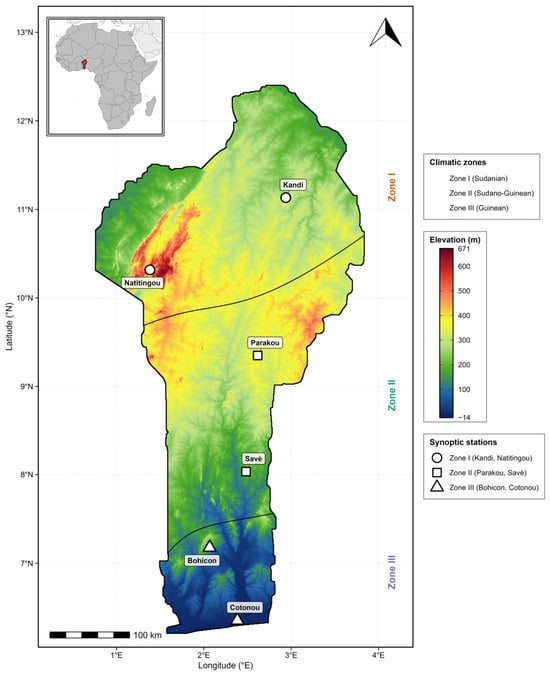
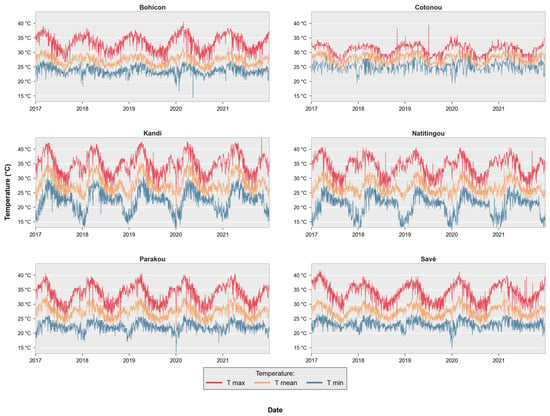
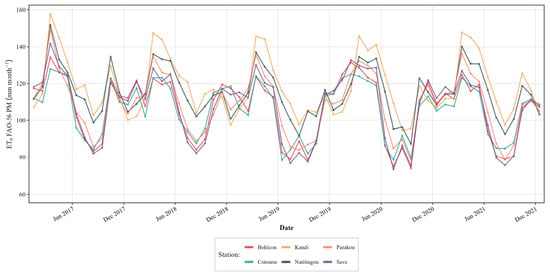
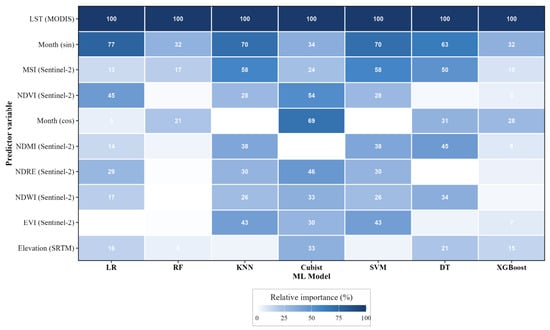
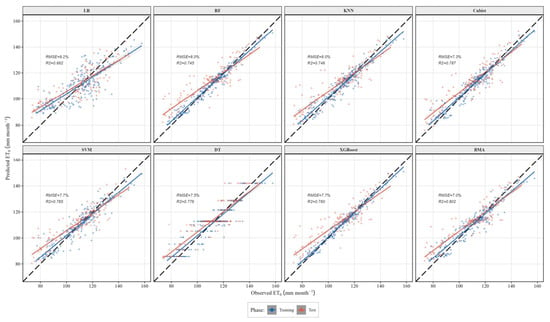
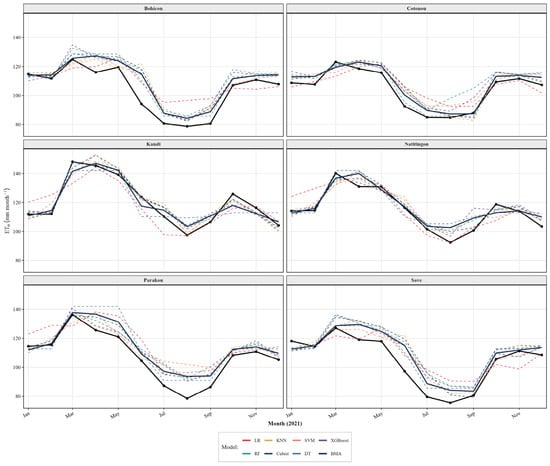
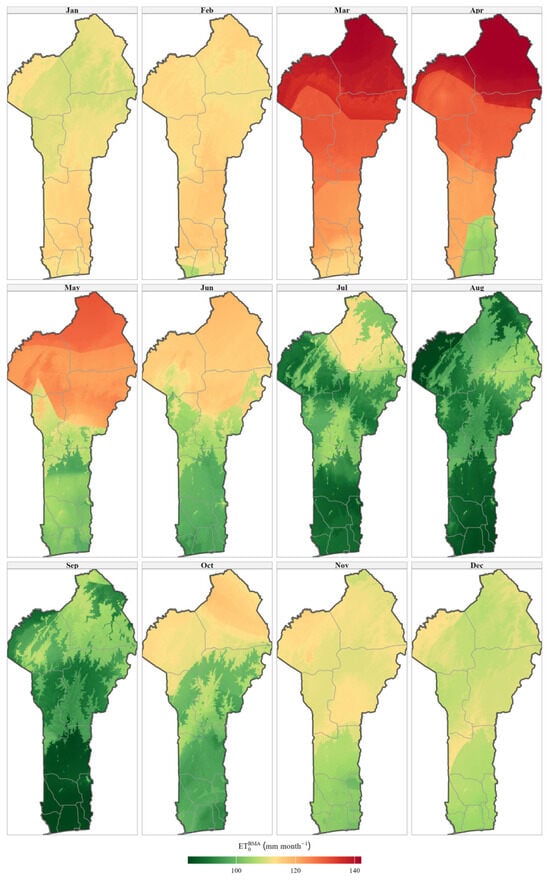
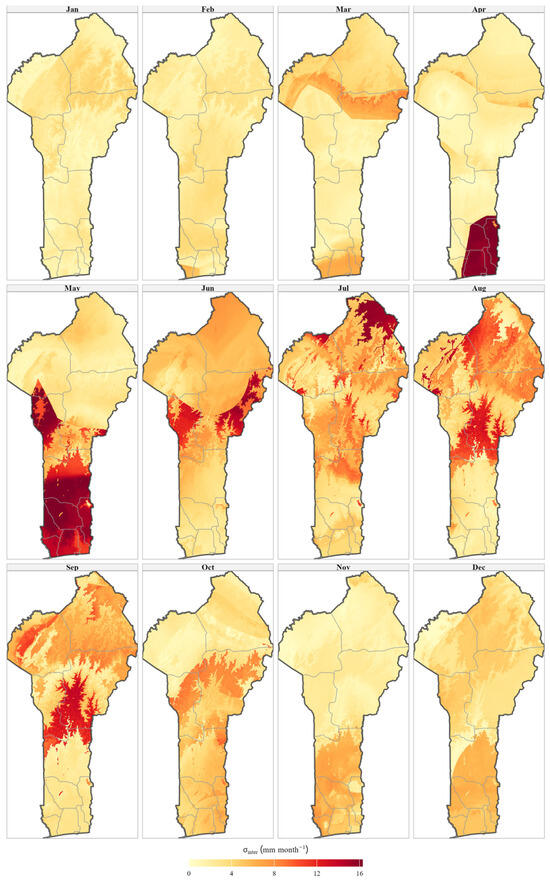
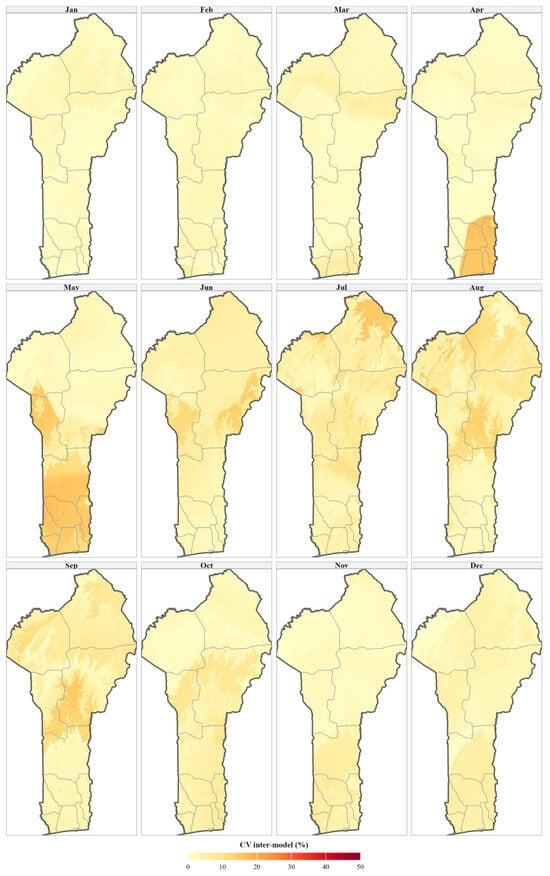
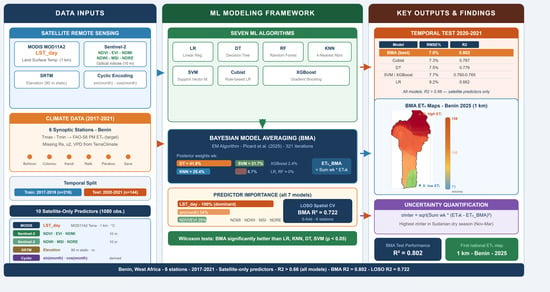
Reference evapotranspiration (ET0) represents the atmospheric demand for water from a well-watered vegetated surface and is a key component of the hydrological cycle and agricultural water management. This study evaluated the performance of seven machine learning (ML) models: linear regression (LR), Random Forest (RF), Support Vector Machines (SVM), K-Nearest Neighbors (KNN), Extreme Gradient Boosting (XGBoost), Decision Trees (DT), and Cubist, for predicting monthly FAO-56 Penman–Monteith ET0 in Benin. The target variable was calculated from data collected at six synoptic stations over the 2017–2021 period. Ten remote-sensing and topographic predictors were used: MODIS Land Surface Temperature (LST), six Sentinel-2 optical vegetation indices (NDVI, EVI, NDMI, NDWI, MSI, NDRE), elevation, and cyclic month encoding. Models were trained on the 2017–2019 period and evaluated on an independent temporal test set (2020–2021). All models showed positive predictive performance, with the BMA ensemble achieving the highest accuracy (RMSE = 7.0% of mean ET0, R2 = 0.802), followed by Cubist (RMSE = 7.3%, R2 = 0.787) and DT (RMSE = 7.5%, R2 = 0.776). The seven models were combined via Bayesian Model Averaging (BMA) with posterior weights estimated by the EM algorithm to produce 1 km monthly ET0 maps for Benin for 2025. BMA-derived inter-model standard deviation provided spatially explicit uncertainty estimates, revealing that prediction uncertainty is greatest in the northern Sudanian zone during the dry season. The ET0 target variable was constructed as a hybrid product combining station temperature observations with solar radiation, wind speed, and vapor pressure deficit extracted from the TerraClimate gridded reanalysis dataset; this methodological choice is discussed as a study limitation.
Full article
(This article belongs to the Special Issue Advanced Geospatial Intelligence for Sustainable Agriculture and Environmental Management)
►▼
Show Figures

Graphical abstract
Open AccessArticle
Hybrid CNN Vision Transformer Framework with Grad-CAM and SHAP Analysis for Urban Change Detection
by
Abdulmajid A. Alnoamani and Tawfiq Hasanin
Geomatics 2026, 6(4), 72; https://doi.org/10.3390/geomatics6040072 - 1 Jul 2026
Abstract
To track land use and land cover transformation in Makkah, techniques that allow steep relief, spectral confusion, and dense sacred–commercial mosaics, and can be justified in terms of planning, should be used. Satellite images are tedious and prone to uneven labeling on mixed-pixel
[...] Read more.
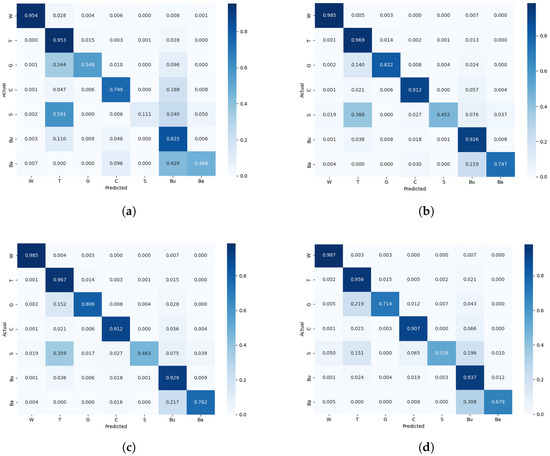
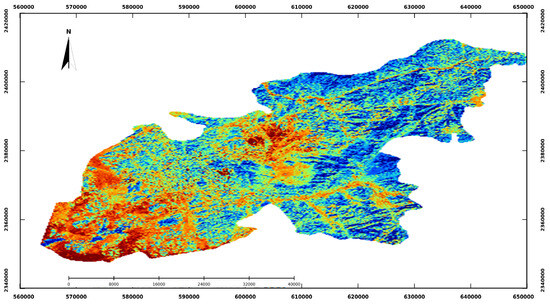
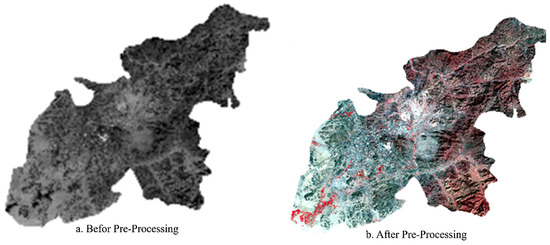
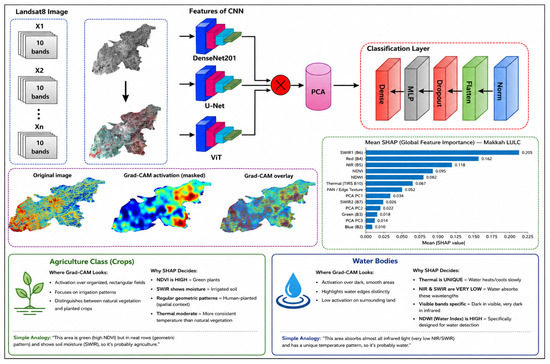
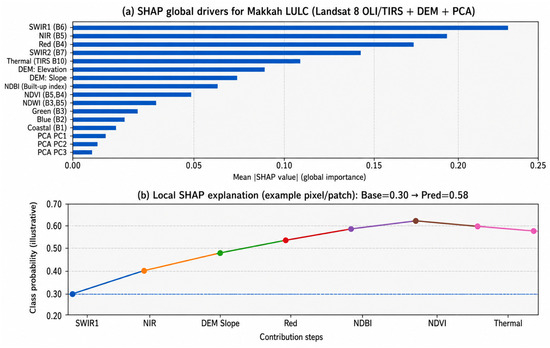
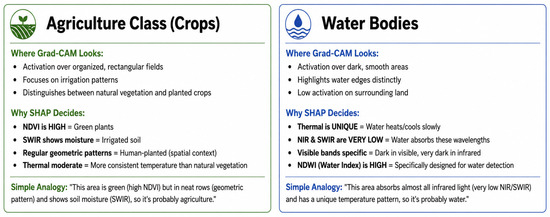
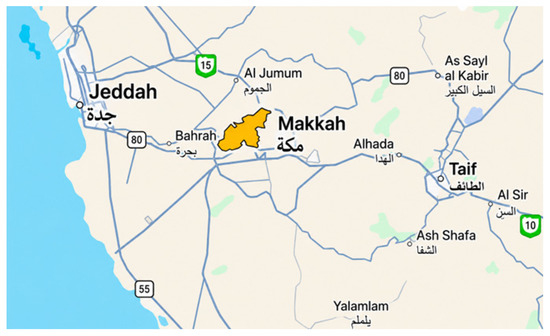
To track land use and land cover transformation in Makkah, techniques that allow steep relief, spectral confusion, and dense sacred–commercial mosaics, and can be justified in terms of planning, should be used. Satellite images are tedious and prone to uneven labeling on mixed-pixel boundaries, particularly in urban regions and Haram borders. Using multi-temporal Landsat-8 data (2013 and 2024), a hybrid deep learning architecture comprising U-Net, DenseNet201, and a Vision Transformer was trained. U-Net retained the geometry of the boundaries, DenseNet201 reinforced feature transfer across heterogeneous textures, and the transformer modeled long-range context. Gradient-weighted Class Activation Mapping (Grad-CAM) was used to incorporate interpretability during spatial attention mapping, and Shapley Additive exPlanations (SHAP) during spectral topographic attribution, after which paired class-level statistical tests were performed. Modern residential increased from 15% to 20% (180 million to 240 million m2); roads from 5% to 10% (60 million to 120 million m2); industrial facilities from 3% to 5% (36 million to 60 million m2). The vegetation expanded by 1 to 5% (an addition of 48 million m2), and agriculture declined by 2 to 1% (a loss of 12 million m2). Its tension with urban development and preservation of productive land was growing. The proposed U-Net–DenseNet201–ViT hybrid system achieved over 98% overall accuracy on the test data for both study years, with kappa coefficients of 0.978 and 0.981 for 2013 and 2024, respectively. Grad-CAM identified attention focused on development fronts and transport corridors, whereas SHAP identified SWIR, thermal response, and slope as the main drivers. Significant class-level gains were statistically validated (p < 0.01), confirming an interpretable and auditable account of land transformation in Makkah.
Full article
(This article belongs to the Special Issue Environmental Features Assisted Satellite Navigation)
►▼
Show Figures

Figure 1
Open AccessArticle
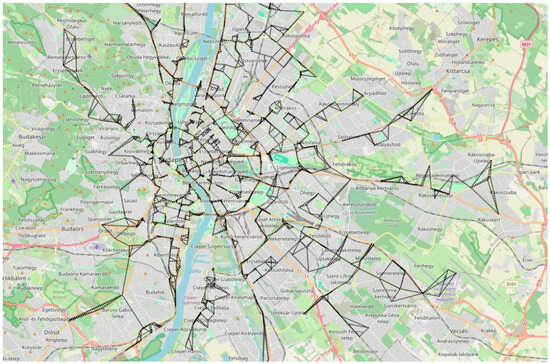
Spatiotemporal Analysis of Urban Traffic Patterns Using Floating Car Data: A Methodology for Day-Type and Weather Baselines in Budapest
by
Zoltán Farkas-Németh, Zsolt Győző Török and Dániel Balla
Geomatics 2026, 6(4), 71; https://doi.org/10.3390/geomatics6040071 - 1 Jul 2026
Abstract
►▼
Show Figures
GPS-derived floating car data (FCD) provide spatially continuous urban traffic observations without fixed-sensor infrastructure. This study develops a spatiotemporal baseline framework jointly modelling day type and precipitation for 1189 junction-level nodes in Budapest. A six-phase pipeline—GPS preprocessing, coordinate reprojection, FME (Feature Manipulation Engine,
[...] Read more.
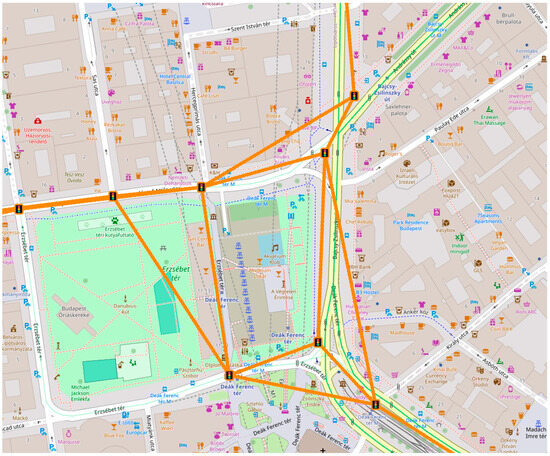
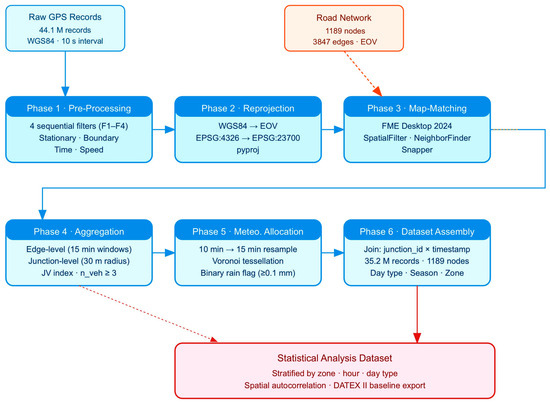
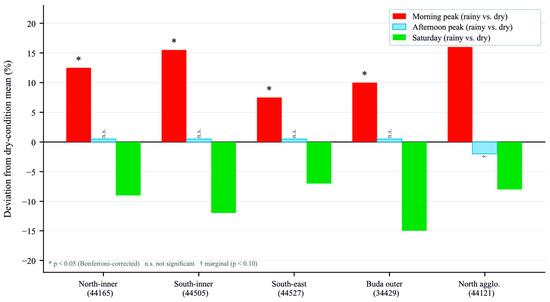
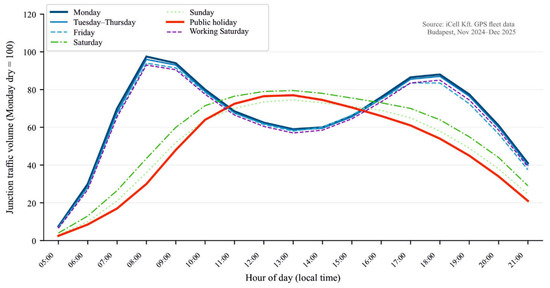
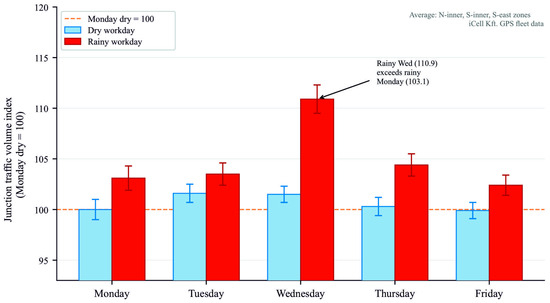
GPS-derived floating car data (FCD) provide spatially continuous urban traffic observations without fixed-sensor infrastructure. This study develops a spatiotemporal baseline framework jointly modelling day type and precipitation for 1189 junction-level nodes in Budapest. A six-phase pipeline—GPS preprocessing, coordinate reprojection, FME (Feature Manipulation Engine, Safe Software Inc., Surrey, BC, Canada)-based map-matching, junction-level aggregation, Voronoi meteorological allocation, and dataset assembly—was applied to 44.1 million 10 s records from approximately 1100 probe vehicles (November 2024–December 2025). Public holidays form a structurally distinct traffic flow pattern compared to Sundays (r = 0.71) and to regular workdays (r = 0.42); morning peak shifts to 09:00–11:00 and pooling holidays with Sundays introduces reference errors of 15–25%. Precipitation raises morning peak volumes by 6–17% across all zones while afternoon peaks remain statistically unchanged, consistent with commuter inertia; Saturday volumes fall by 7–15%. Rainy Wednesdays reach 109–112% of the Monday dry reference in inner zones, attributed to hybrid workers advancing their office day. Pairwise junction correlations show a non-monotonic distance-decay pattern, and time-lagged cross-correlation identifies 23 anticipative junction pairs with 60–90 min lead times. The results could potentially help decision making when developing city-wide infrastructure and tuning traffic signals so that traffic can be optimised and adapt to both real-time natural and social effects. The resulting baselines map onto DATEX II (Data Exchange standard, CEN EN 16157) ElaboratedDataPublication fields, supporting metadata publication on the Hungarian National Access Point under EU Regulation 2022/670/EU.
Full article

Figure 1
Journal Menu
► ▼ Journal Menu-
- Geomatics Home
- Aims & Scope
- Editorial Board
- Reviewer Board
- Topical Advisory Panel
- Instructions for Authors
- Special Issues
- Topics
- Article Processing Charge
- Indexing & Archiving
- Editor’s Choice Articles
- Most Cited & Viewed
- Journal Statistics
- Journal History
- Society Collaborations
- Conferences
- Editorial Office
Journal Browser
► ▼ Journal BrowserHighly Accessed Articles
Latest Books
E-Mail Alert
News
5 August 2026
MDPI INSIGHTS: The CEO’s Letter #37 – Canada Summit, Sciforum Relaunch, 30 Years of Impactful Research & ISPRS 2026
29 July 2026
MDPI at the ISPRS Congress 2026: Focusing on Frontiers in Remote Sensing and Geoinformation, Discussing a New Future for Open Access
Topics
Topic in
Applied Sciences, Drones, Geomatics, Heritage, IJGI, Remote Sensing, Sensors
3D Documentation of Natural and Cultural Heritage
Topic Editors: Lorenzo Teppati Losè, Elisabetta Colucci, Arnadi MurtiyosoDeadline: 31 August 2026
Topic in
Applied Sciences, Geomatics, IJGI, Remote Sensing, Smart Cities
The Geography of Digital Twin: Concepts, Architectures, Modeling, AI and Applications
Topic Editors: Chaowei Yang, Daniel Q. Duffy, Xiao Huang, Lingbo LiuDeadline: 20 September 2026
Topic in
Geographies, Geomatics, IJGI, Land, Urban Science, Sustainability
Spatial Decision Support Systems for Urban Sustainability
Topic Editors: Shivanand Balram, Raja Sengupta, Jorge RochaDeadline: 16 October 2026
Topic in
Applied Sciences, Geomatics, NDT, Remote Sensing
Geographic Information and Remote Sensing Technology (GIRST)
Topic Editors: Francesco Benedetto, Fabio TostiDeadline: 31 December 2026
Conferences
Special Issues
Special Issue in
Geomatics
Editorial Board Members’ Collection Series: GeoAI in Disaster
Guest Editor: Suchi GopalDeadline: 30 September 2026
Special Issue in
Geomatics
Innovative Remote Sensing Approaches: 3D Reconstruction, UAV Photogrammetry, and BIM in Cultural Heritage and Infrastructure
Guest Editors: Lidia M. Ortega Alvarado, María Ramos GalanDeadline: 30 September 2026
Special Issue in
Geomatics
Multi-Modal Geospatial AI: Fusing Images, Point Clouds, and Text
Guest Editors: Bashar Alsadik, Daniel Rodrigues dos SantosDeadline: 1 December 2026
Special Issue in
Geomatics
Environmental Features Assisted Satellite Navigation
Guest Editor: Guohao ZhangDeadline: 15 December 2026