


-
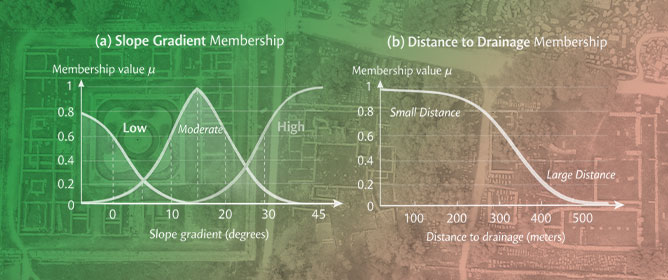
Advancing Geohazard Assessment in Heritage Areas Through Fuzzy Logic -
Spatial Inequality in Urban Park Provision: A GIS-Based Comparative Analysis of Sofia (Bulgaria) and Istanbul (Republic of Türkiye) -
Geographical Literacy and Preventive Culture in the Face of Natural Disasters: Analysis of the Master Plan for Analysis, Anticipation and Reaction of the Valencian Community, Spain
Journal Description
Geographies
Geographies
is an international, peer-reviewed, open access journal on geography published quarterly online by MDPI.
- Open Access— free for readers, with article processing charges (APC) paid by authors or their institutions.
- High Visibility: indexed within ESCI (Web of Science), Scopus, AGRIS, RePEc, and other databases.
- Journal Rank: JCR - Q2 (Geography) / CiteScore - Q1 (Social Sciences (miscellaneous))
- Rapid Publication: manuscripts are peer-reviewed and a first decision is provided to authors approximately 19.6 days after submission; acceptance to publication is undertaken in 5.8 days (median values for papers published in this journal in the first half of 2026).
- Recognition of Reviewers: APC discount vouchers, optional signed peer review, and reviewer names published annually in the journal.
- Journal Cluster of Geospatial and Earth Sciences: Remote Sensing, Atmosphere, Geosciences, Climate, Quaternary, Earth, Geographies, Geomatics, Meteorology and Fossil Studies.
Impact Factor:
2.3 (2025);
5-Year Impact Factor:
2.1 (2025)
Latest Articles
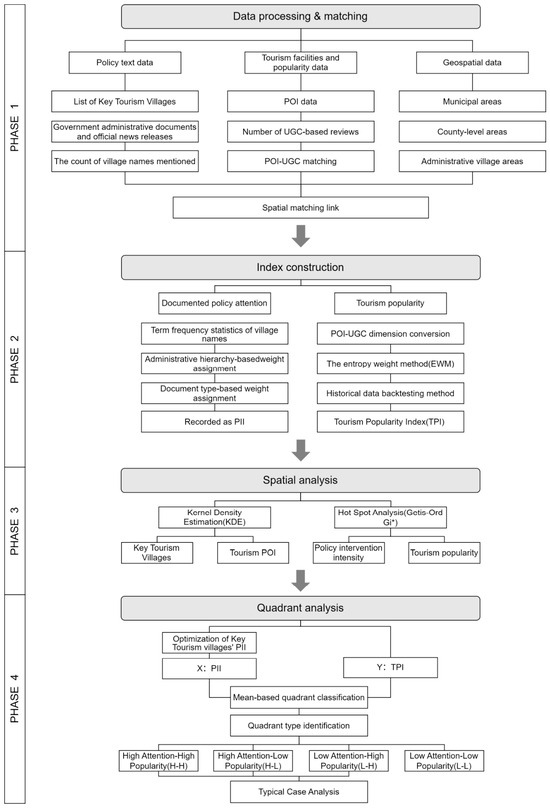
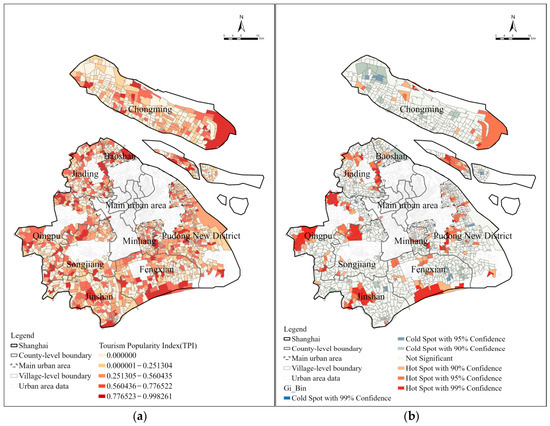
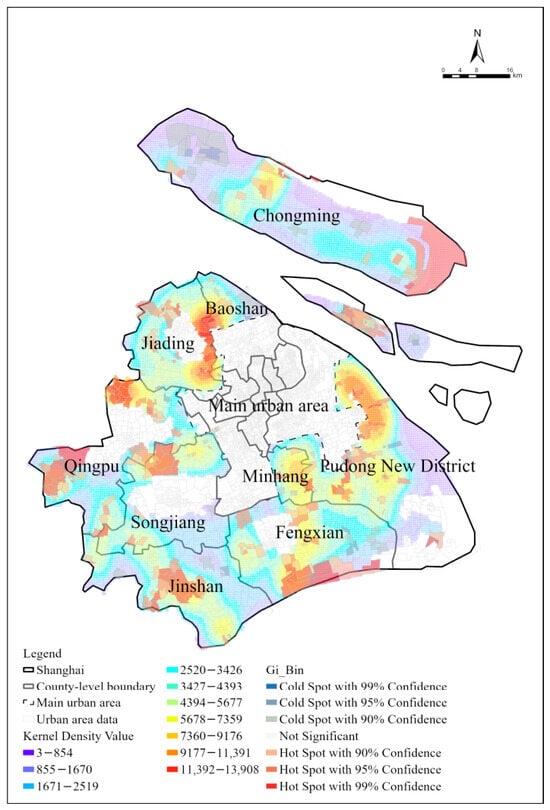
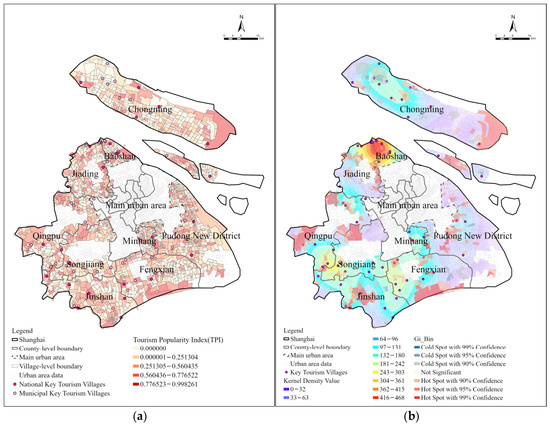
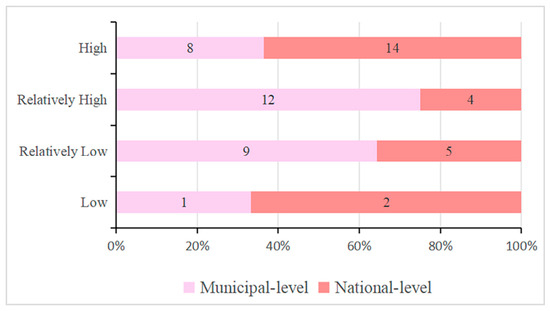
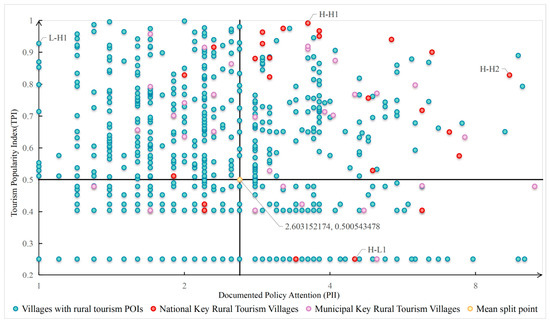
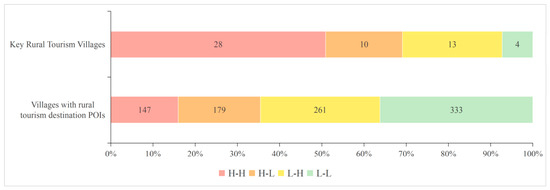
Spatial Alignment and Mismatch Between Documented Policy Attention and Rural Tourism Popularity: Evidence from Shanghai’s Peri-Urban Villages
Geographies 2026, 6(3), 90; https://doi.org/10.3390/geographies6030090 (registering DOI) - 5 Sep 2026
Abstract
With rural revitalization as China’s national policy priority, rural tourism has been promoted as a pathway to stimulate local economies and advance revitalization objectives. National and local governments have introduced policy measures to support rural tourism development. However, the spatial correspondence between documented
[...] Read more.
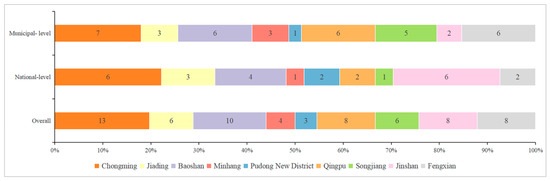
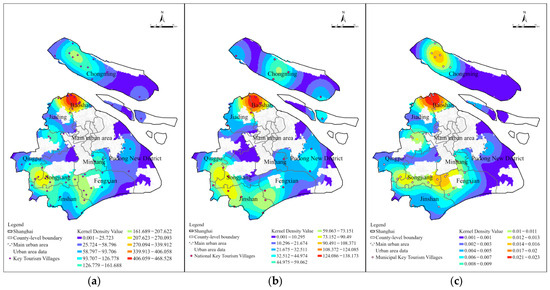
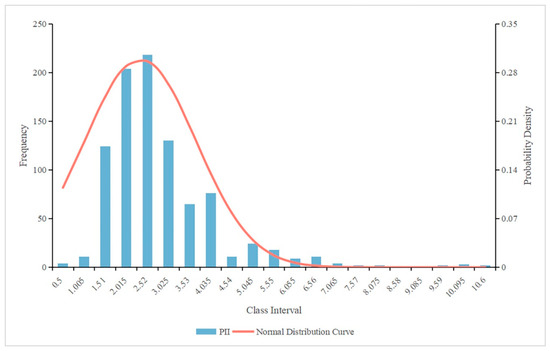
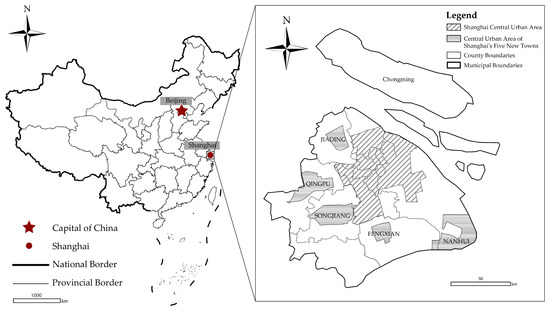
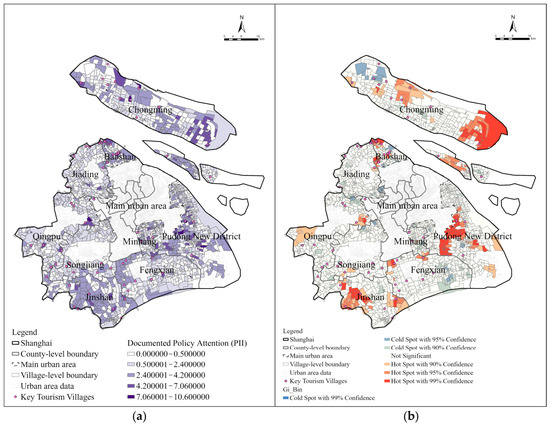
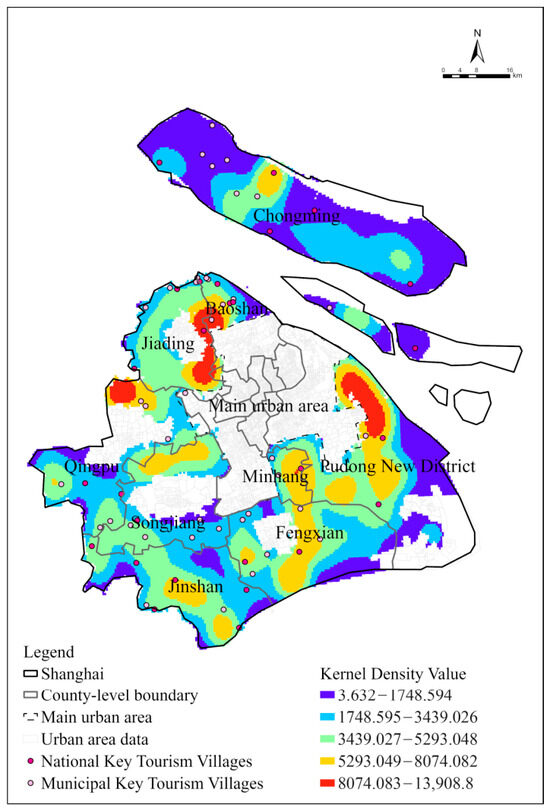
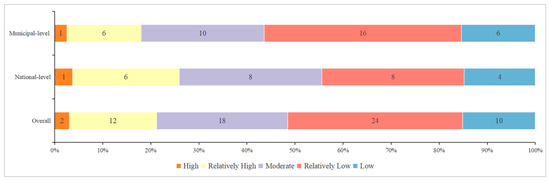
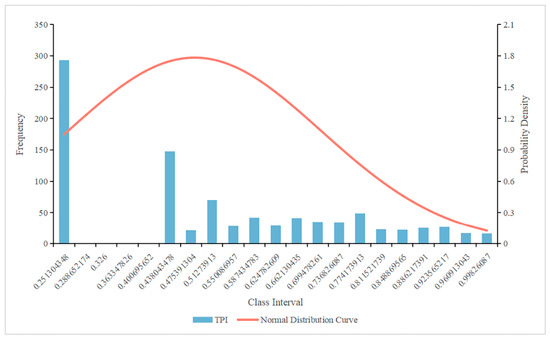
With rural revitalization as China’s national policy priority, rural tourism has been promoted as a pathway to stimulate local economies and advance revitalization objectives. National and local governments have introduced policy measures to support rural tourism development. However, the spatial correspondence between documented policy attention and tourism popularity remains uneven and insufficiently understood. To address this gap, this study develops an integrated evaluation framework combining a text-based measure of documented policy attention, denoted PII, and a Tourism Popularity Index (TPI) using multi-source data from 920 peri-urban villages in Shanghai with rural tourism destination POIs. Spatial analysis reveals disparities between tourism popularity and documented policy attention, and further examines the contextual characteristics associated with this misalignment. The findings indicate that: (1) documented policy attention and rural tourism popularity exhibit pronounced spatial disparities, with high-popularity clusters emerging where favorable resource conditions, accessibility, and higher levels of policy attention coexist; (2) widespread policy–popularity mismatches indicate limited correspondence between the two measures; (3) the selected cases illustrate differences in spatial planning, operational capacity, and market-oriented strategies, cautioning against uniform policy expansion. The study offers a spatially explicit framework for assessing policy–popularity alignment and informing context-sensitive rural tourism governance in highly urbanized regions.
Full article
(This article belongs to the Special Issue Feature Papers of Geographies in 2026)
►
Show Figures
Open AccessArticle
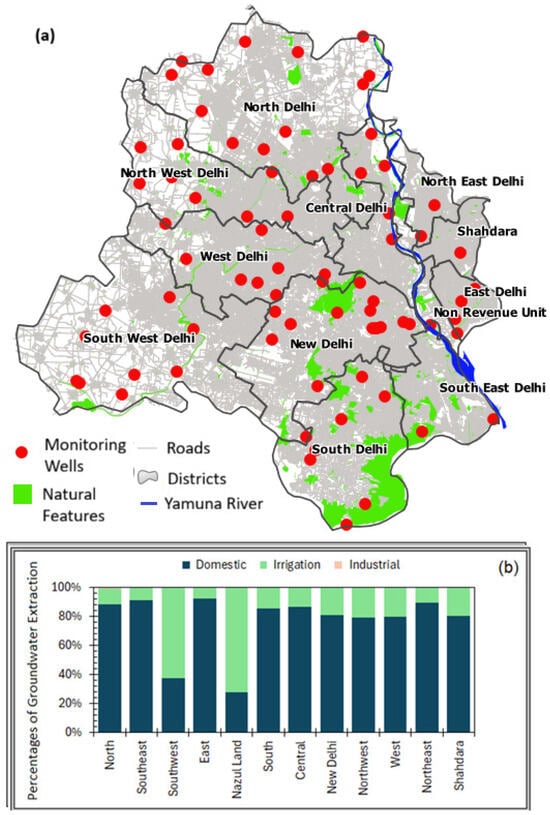
Spatio-Temporal Groundwater Levels in Megacity Delhi (2010–2022): Implications for Urban Drinking-Water Services (DWSF)
by
Mimi Roy and Sriroop Chaudhuri
Geographies 2026, 6(3), 89; https://doi.org/10.3390/geographies6030089 - 4 Sep 2026
Abstract
►▼
Show Figures
Rapid urbanization across global South megacities has accelerated the overexploitation of urban aquifers, creating complex socio-hydrological crises that threaten long-term water resilience for a vast population. Conventional urban-water management frequently relies on uniform, city-wide regulatory mandates that fail to account for localized hydrogeological
[...] Read more.
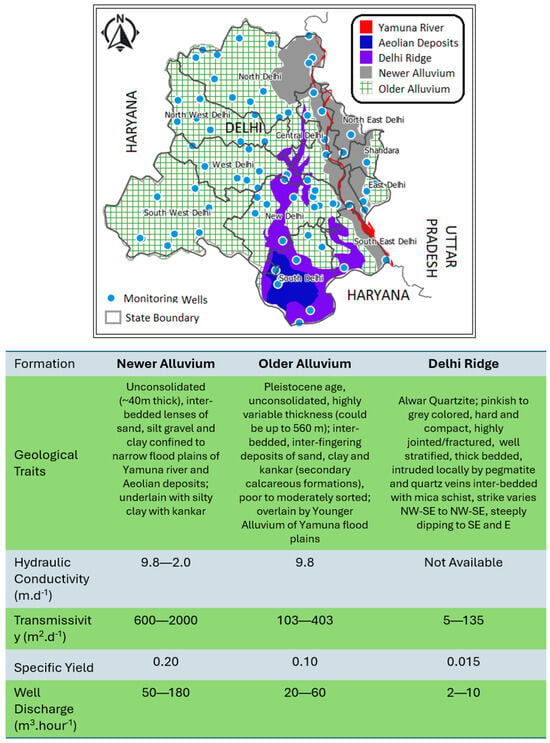
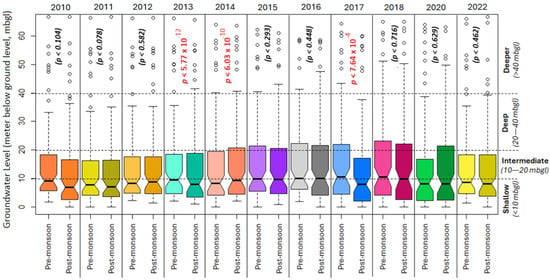
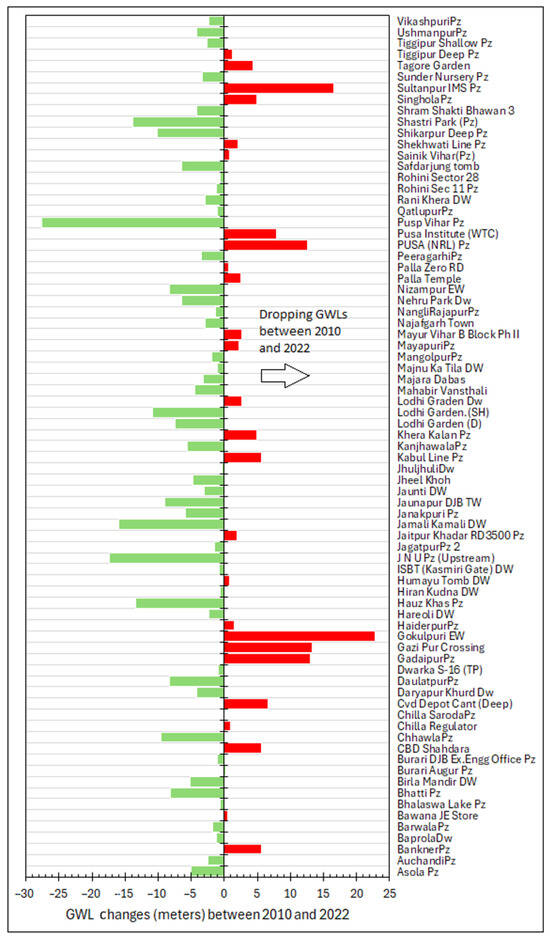
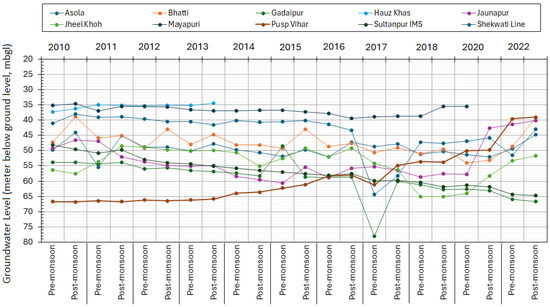
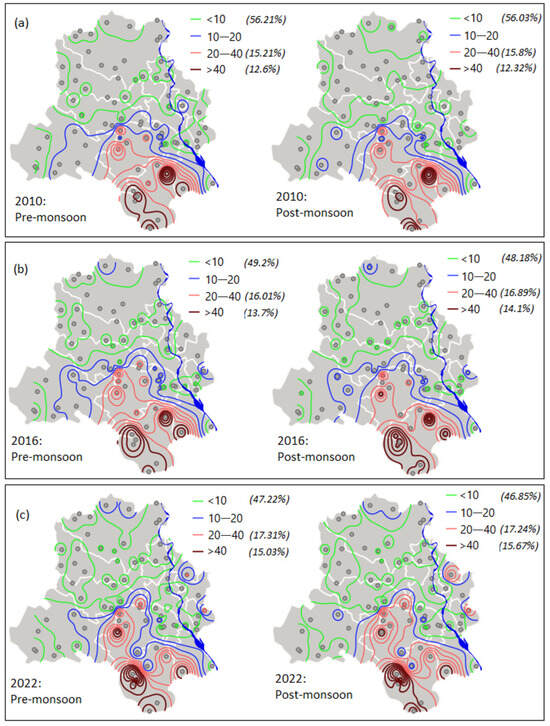
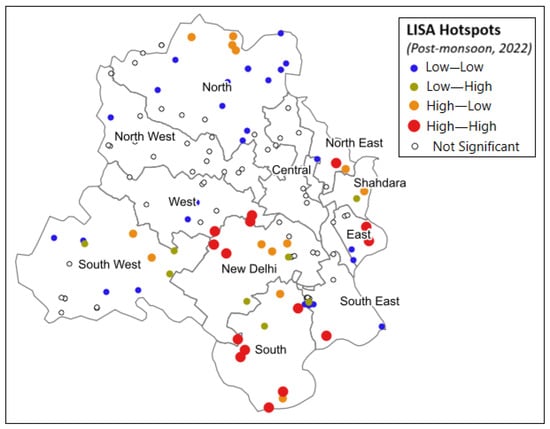
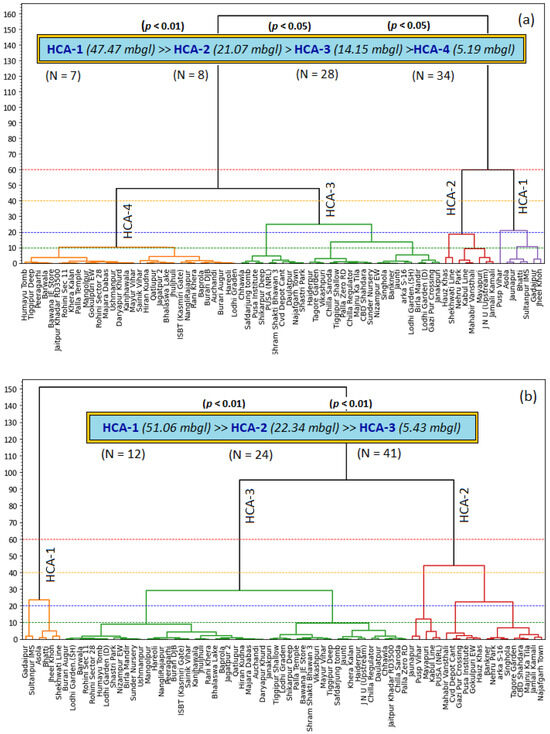
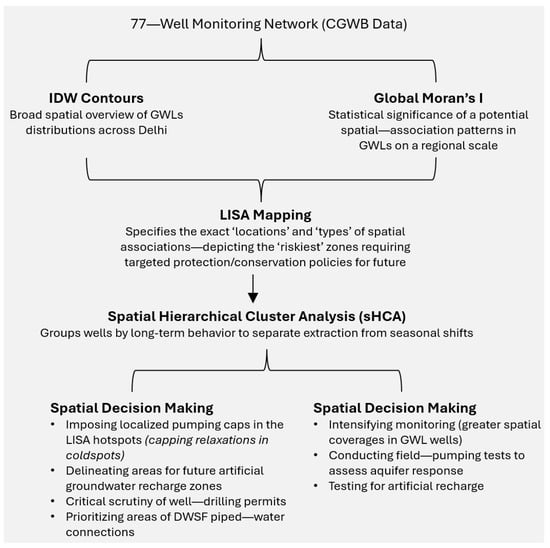
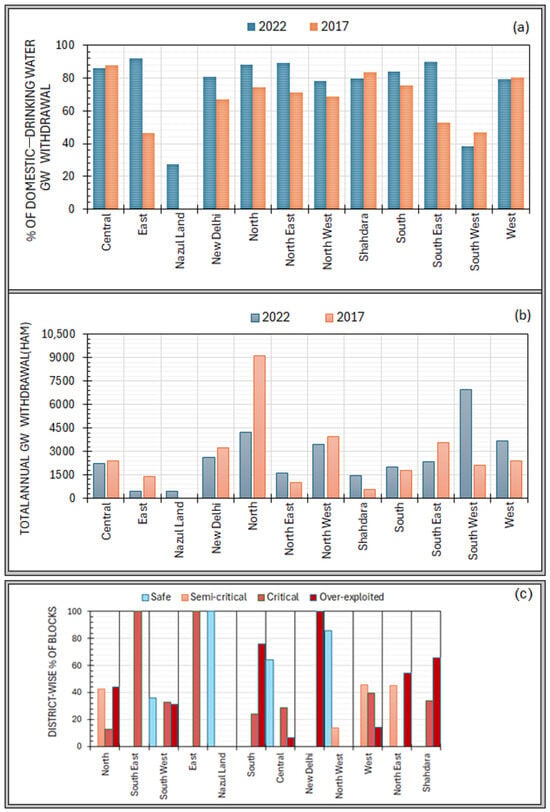
Rapid urbanization across global South megacities has accelerated the overexploitation of urban aquifers, creating complex socio-hydrological crises that threaten long-term water resilience for a vast population. Conventional urban-water management frequently relies on uniform, city-wide regulatory mandates that fail to account for localized hydrogeological heterogeneities and the socio-economic drivers of private extraction. This study performed a seasonal assessment (post- and pre-monsoon) of groundwater levels (GWLs), across the National Capital Territory of Delhi, India, using a 13-year archival dataset (2010–2022) of 77 ‘common’ wells, with a sequential spatial–statistical framework. No statistically significant ‘seasonality’ was found in GWLs, except for isolated years. About 13% of the observations appeared as ‘deep outliers’, the call for more process-level hydrogeologic investigations. Spatial interpolation via the Inverse Distance Weighting (IDW) interpolation technique, alongside Global Moran’s I, Local Indicators of Spatial Association (LISA), and spatially Constrained Hierarchical Cluster Analysis (sHCA), revealed a recurrent spatial pattern: persistent, deep GWLs, within the fracture-dominated, low-yielding Alwar Quartzite (Delhi Ridge) of South and Southeast Delhi. The spatial clustering demonstrates the migration of the deep-GWL hotspots toward the unconfined alluvial aquifers of the Yamuna River floodplains to the east, threatening future baseflow stability. These spatial drawdown patterns represent a structural response to municipal Drinking Water Services Framework (DWSF) deficits, where intermittent supply and informal water markets incentivize the growth of more unregulated and unrestricted private pumping of groundwater. Achieving sustainable urban groundwater governance requires replacing blanket administrative mandates with a more data-driven, micro-zoned socio-hydrological framework across the city—combining area-specific extraction caps, economic instruments for geologically targeted aquifer storage and recovery, informal market regulation, and facilitating more participatory, community-based (Water users Associations, WUA) initiatives in the future to protect groundwater resources in Delhi. However, it requires specialized monitoring data, which is still largely lacking, and detailed investigations involving the aquifer hydrogeology and groundwater pumping patterns.
Full article

Figure 1
Open AccessArticle
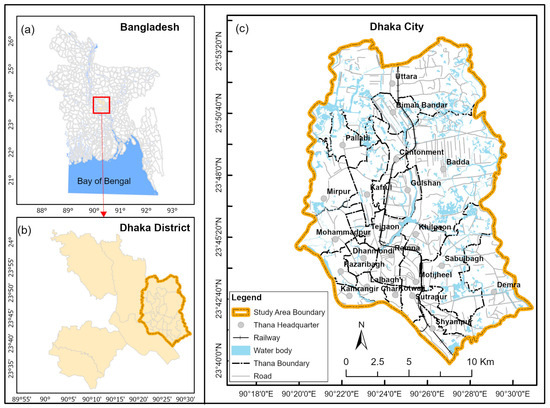
Multi-Sensor Downscaling of Land Surface Temperature Using Sentinel-2 and Landsat 8 Imagery: Evidence from Dhaka City, Bangladesh
by
Md. Mostafizur Rahman, Jannatul Ferdouse Ratu, Md. Kamruzzaman, Md. Arshadul Islam and György Szabó
Geographies 2026, 6(3), 88; https://doi.org/10.3390/geographies6030088 - 3 Sep 2026
Abstract
►▼
Show Figures
Rapid urbanization and increasing land surface temperatures (LSTs) have intensified urban heat stress in rapidly growing tropical megacities such as Dhaka. However, the coarse spatial resolution of conventional thermal satellite imagery limits the identification of fine-scale urban thermal variability required for climate-sensitive urban
[...] Read more.
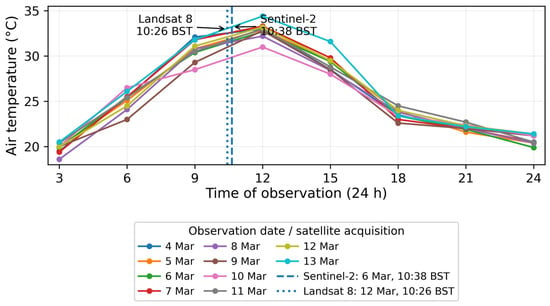
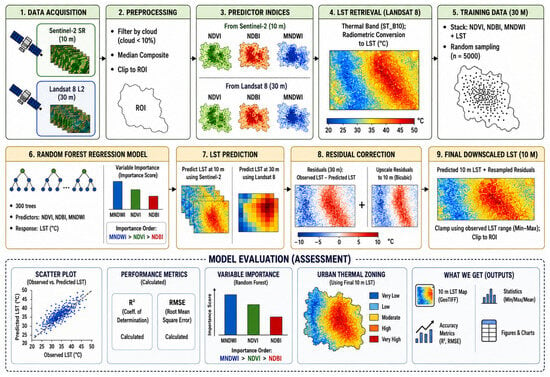
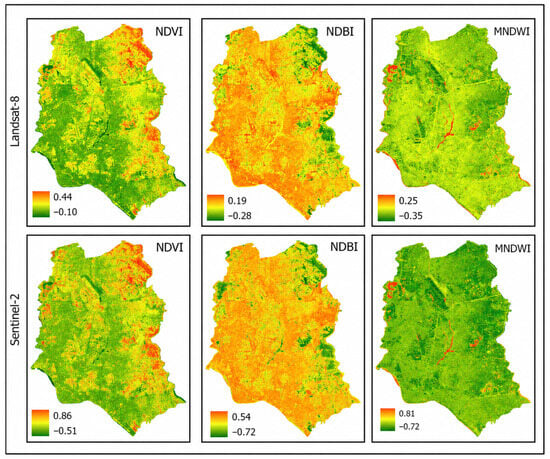
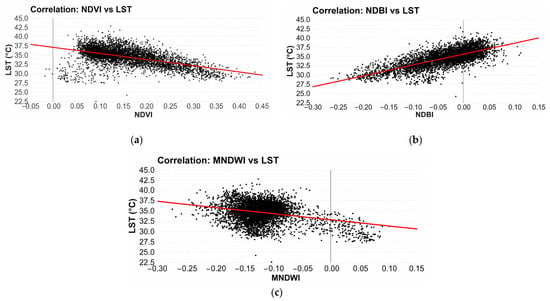
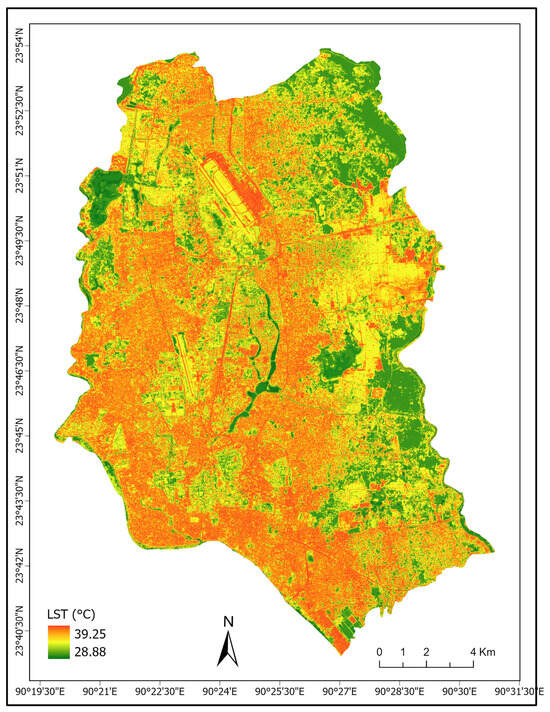
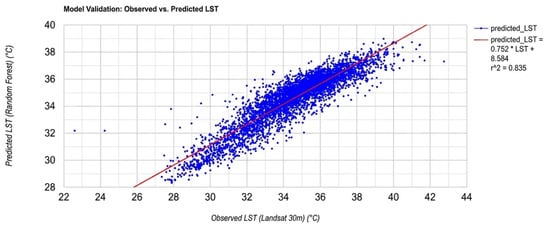
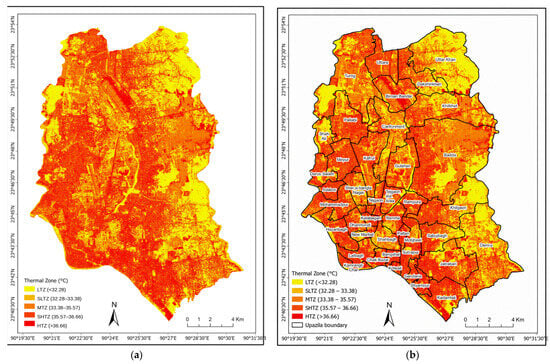
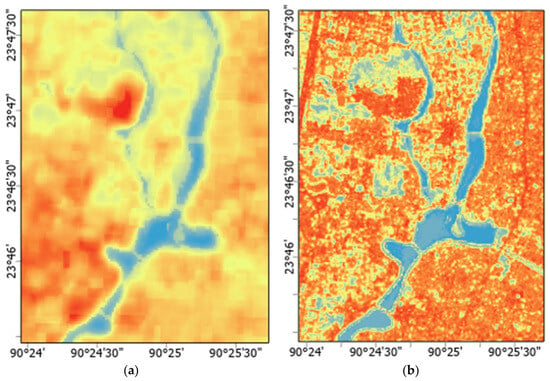
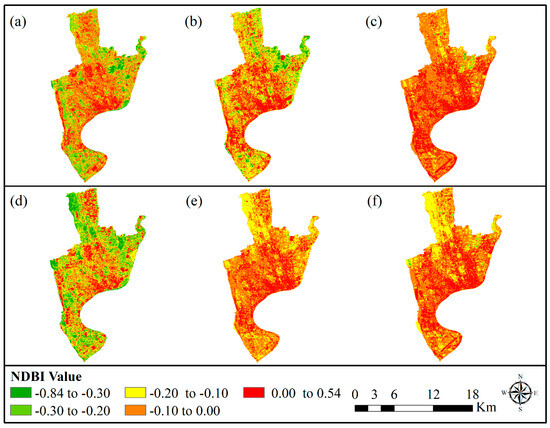
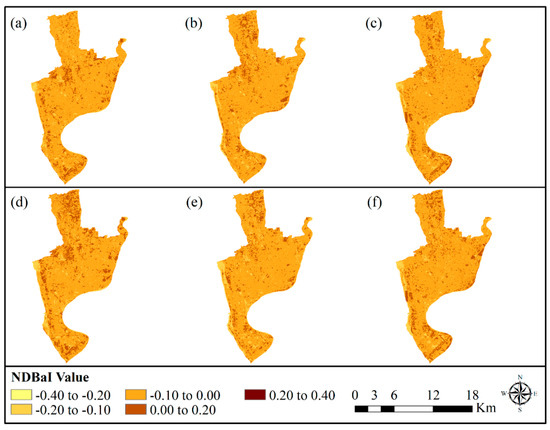
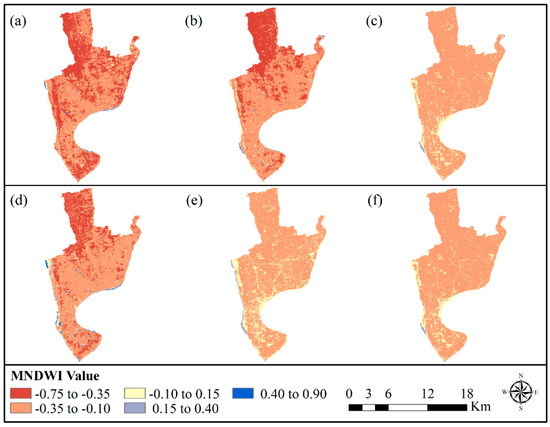
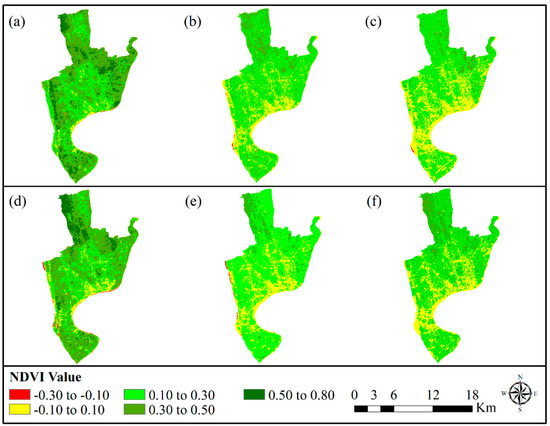
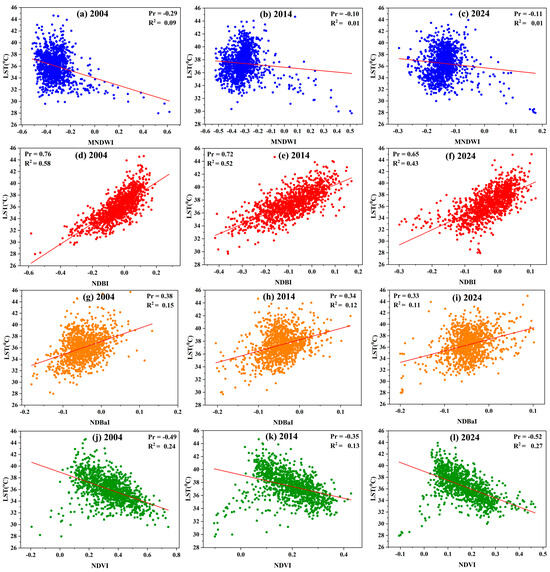
Rapid urbanization and increasing land surface temperatures (LSTs) have intensified urban heat stress in rapidly growing tropical megacities such as Dhaka. However, the coarse spatial resolution of conventional thermal satellite imagery limits the identification of fine-scale urban thermal variability required for climate-sensitive urban planning. This study develops a multi-sensor LST downscaling framework by integrating Landsat 8 thermal imagery with Sentinel-2-derived spectral indices within the Google Earth Engine (GEE) platform. A random forest regression model was developed using the normalized difference vegetation index, normalized difference built-up index, and modified normalized difference water index as predictors for statistical downscaling from the 30 m Landsat grid to a nominal 10 m grid. To preserve localized thermal heterogeneity and improve radiometric consistency, a bicubic residual correction approach was incorporated into the downscaling workflow. The resulting statistically downscaled LST estimate on a nominal 10 m grid was subsequently used to classify Urban Thermal Zones (UTZs) across Dhaka City. The results showed that LST was negatively associated with vegetation and water-related indices and positively associated with the built-up index. The statistically downscaled product provided a more spatially detailed representation of the Landsat-derived thermal field and delineated relative surface-temperature hotspots and cooler zones across the study area. High-temperature zones were primarily concentrated within densely built-up commercial and industrial areas, whereas comparatively lower temperatures were observed in vegetated and water-dominated regions. The proposed framework demonstrates a computationally efficient approach to spatially refining Landsat-derived LST in a data-constrained tropical megacity. The findings provide valuable spatial information for urban climate adaptation, heat mitigation planning, and climate-resilient urban development.
Full article

Figure 1
Open AccessArticle
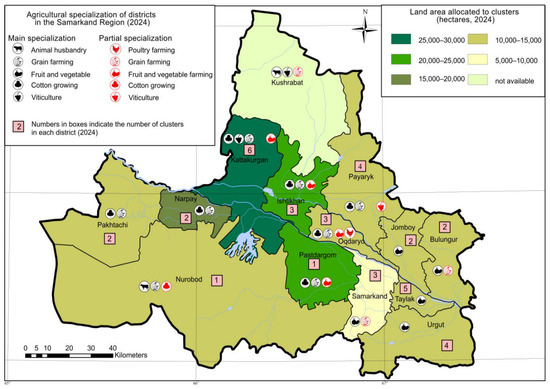
The Spatial Concentration of Emerging Forms of Agro-Industrial Integration (Clusters) in the Samarkand Region, Uzbekistan
by
Shodiyor Boboyev, Lutfullo Ibragimov, Aigul Sergeyeva, Alexander Danshin, Mamatkodir Nazarov, Khayitboy Abduvaliev, Khamidullo Fozilov and Sirojiddin Do’sbekov
Geographies 2026, 6(3), 87; https://doi.org/10.3390/geographies6030087 - 3 Sep 2026
Abstract
►▼
Show Figures
Agro-industrial clusters have become an important instrument of agricultural transformation in Uzbekistan, yet their spatial organization remains insufficiently examined from a geographical perspective. This study investigates the spatial concentration, sectoral differentiation, and geographical characteristics associated with the distribution of agro-industrial clusters in the
[...] Read more.
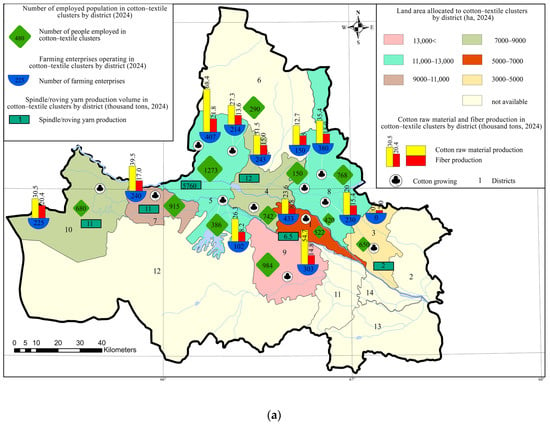
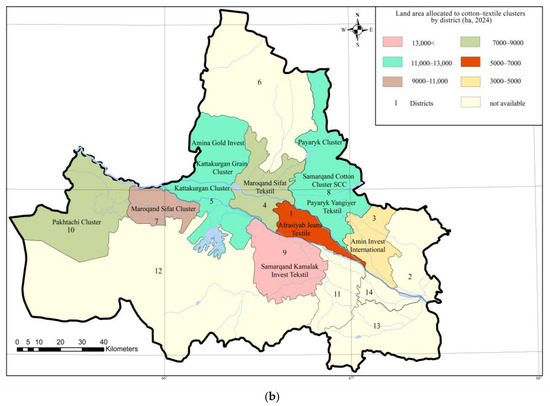
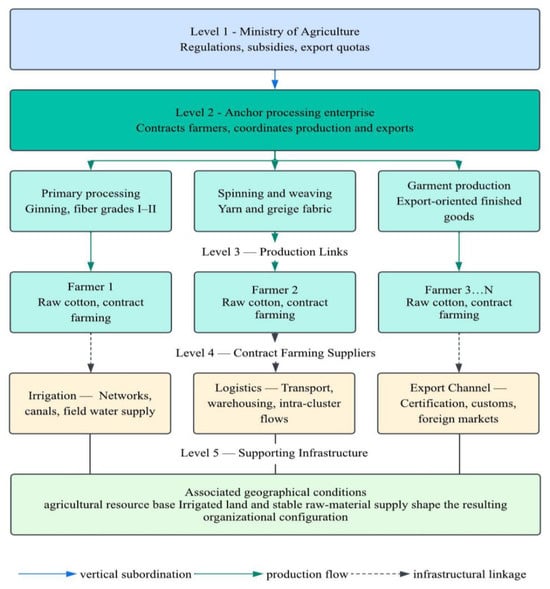
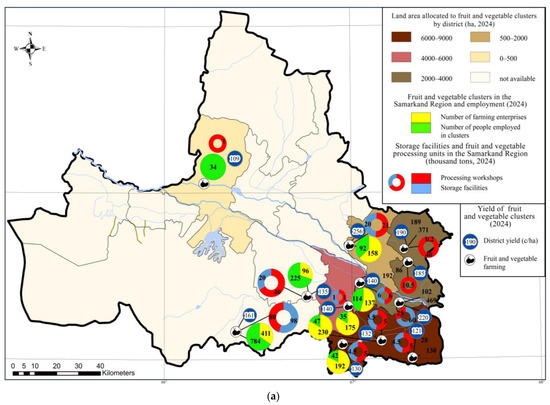
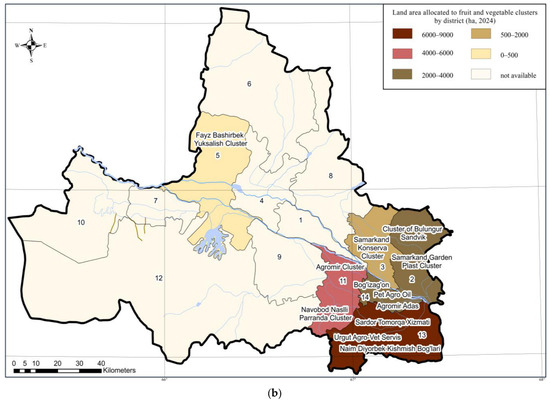
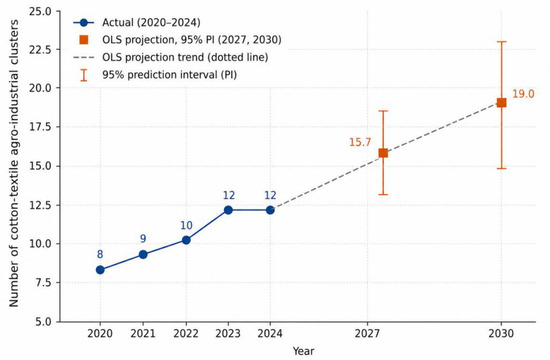
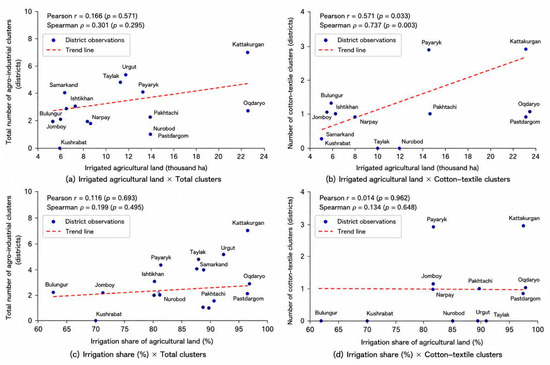
Agro-industrial clusters have become an important instrument of agricultural transformation in Uzbekistan, yet their spatial organization remains insufficiently examined from a geographical perspective. This study investigates the spatial concentration, sectoral differentiation, and geographical characteristics associated with the distribution of agro-industrial clusters in the Samarkand Region. The analysis combines official statistical data, descriptive GIS-based spatial analysis, Location Quotient (LQ) assessment, Global Moran’s I, district-level correlation analysis, and exploratory scenario analysis. The results reveal pronounced territorial differentiation, although Global Moran’s I indicates no statistically significant region-wide spatial autocorrelation (I = −0.218, p = 0.346). Cotton–textile clusters are concentrated in districts with extensive irrigated agricultural land, with a significant positive association supported by both Pearson (r = 0.571, p = 0.033) and Spearman (ρ = 0.737, p = 0.003) correlations. Fruit and vegetable clusters also show descriptive concentration in irrigated districts, although no statistically significant district-level association was identified. Other cluster types exhibit spatial patterns associated descriptively with processing infrastructure, feed resources, market accessibility, and historical agricultural specialization. Illustrative scenarios suggest that future development may increasingly depend on production intensification, value-added processing, and export diversification under conditions of limited irrigated land and growing water scarcity. Conceptually, the findings show that Uzbekistan’s agro-industrial “clusters” function as state-initiated, vertically integrated production systems rather than classical market-driven Porterian clusters. Given the aggregated district-level and exploratory nature of the analysis, the findings should be interpreted as ecological spatial associations rather than causal or cluster-level mechanisms.
Full article

Figure 1
Open AccessArticle
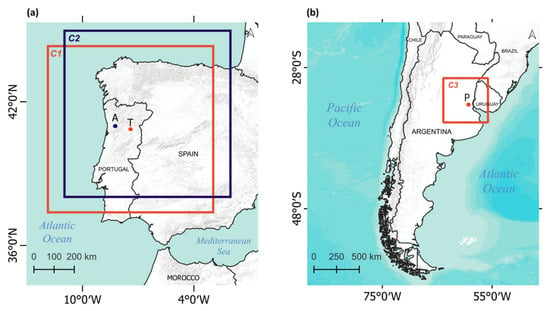
Multi-Scale High-Resolution Mapping of Wildfire Hotspots and Fire-Prone Areas Using Earth Observation and Atmospheric Modeling
by
Flavio Tiago Couto, Natalia Verónica Revollo Sarmiento, Cátia Campos, Federico Javier Beron de la Puente and María Andrea Huamantinco Cisneros
Geographies 2026, 6(3), 86; https://doi.org/10.3390/geographies6030086 - 3 Sep 2026
Abstract
►▼
Show Figures
Understanding where and why wildfires occur is essential for assessing fire danger and supporting mitigation strategies. This study proposes a spatiotemporal map to represent wildfire activity and support fire danger assessment in two fire-prone regions: Central–North Portugal and the Paraná Delta, Argentina. Active
[...] Read more.
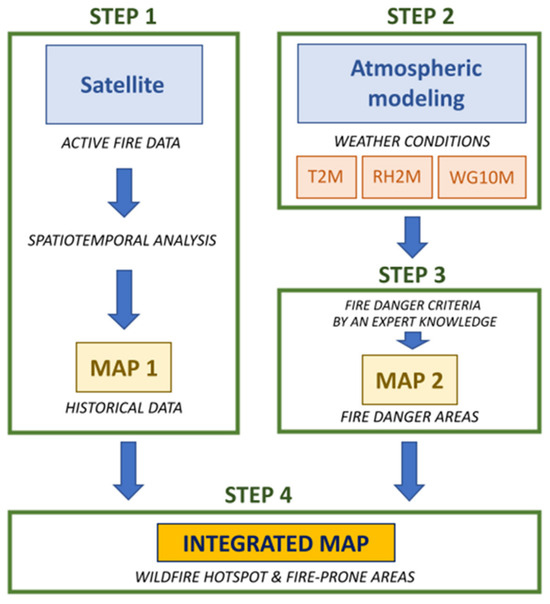
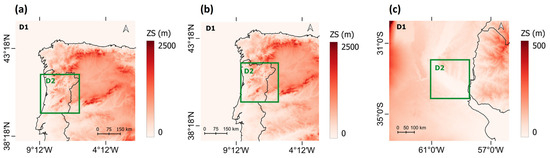
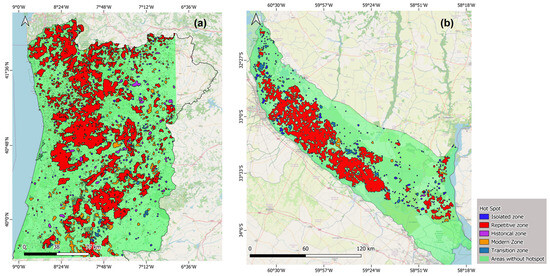
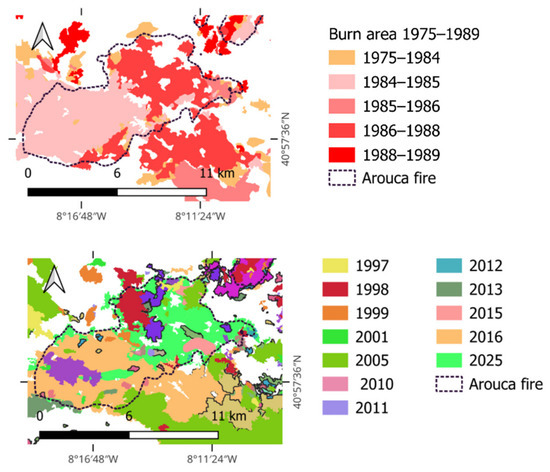
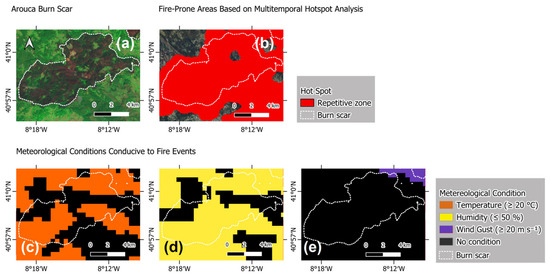
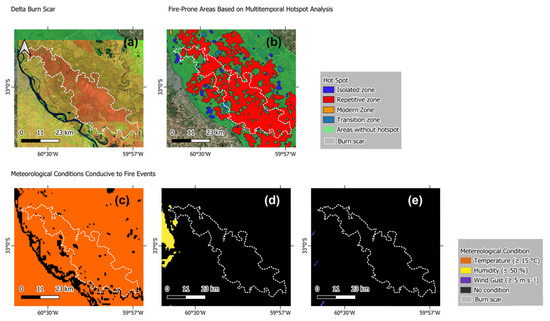
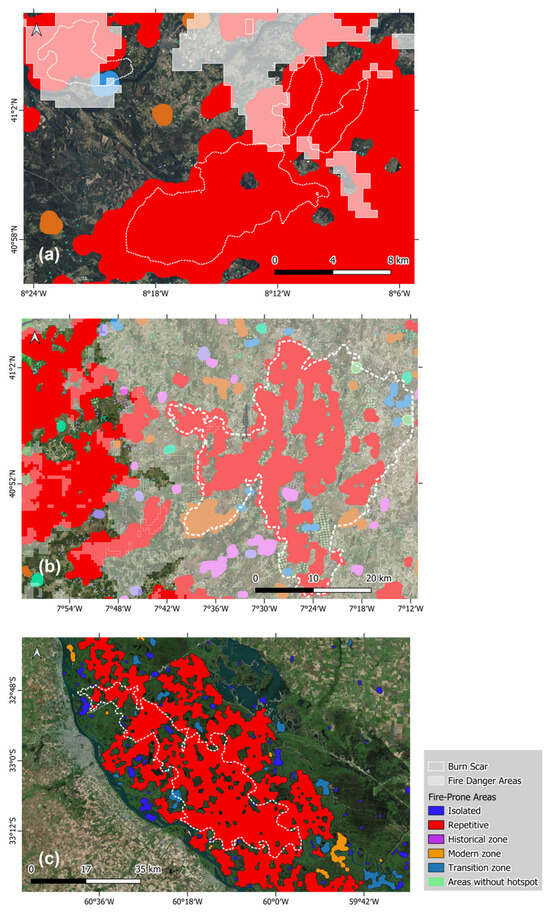
Understanding where and why wildfires occur is essential for assessing fire danger and supporting mitigation strategies. This study proposes a spatiotemporal map to represent wildfire activity and support fire danger assessment in two fire-prone regions: Central–North Portugal and the Paraná Delta, Argentina. Active fire observations spanning over 10 years were analyzed using spatial network theory and graph-based clustering to map regional patterns and identify persistent and emerging hotspots. To complement this, high-resolution Meso-NH simulations at 0.5 km resolution were conducted for selected events, including the Arouca and Trancoso fires in Portugal and two events in the Paraná Delta. The maps reveal that the central areas of both regions are the most fire-prone. Small areas in Portugal emerged as regions of increasing activity and potential future recurrence, while the Paraná Delta showed a progressive northward expansion of fire activity. The historical hotspot map was complemented by atmospheric conditions obtained from the numerical simulations to reflect meteorological fire danger. The high-resolution numerical simulations can provide key insights into areas with elevated danger, demonstrating that integrating Earth observation data and numerical modeling is highly effective for wildfire management and risk assessment.
Full article

Figure 1
Open AccessArticle
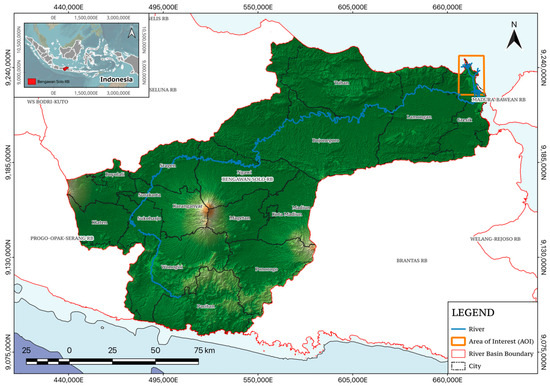
Sediment-Driven Expansion of Tropical Mangroves in the Bengawan Solo Delta Revealed by Multi-Decadal Google Earth Engine Analysis
by
Husamah Husamah, Abdulkadir Rahardjanto and Ludwick Satria Romadoni
Geographies 2026, 6(3), 85; https://doi.org/10.3390/geographies6030085 - 1 Sep 2026
Abstract
►▼
Show Figures
Mangrove deforestation is a global problem, but sediment-dominated estuaries can resist it through their own morphodynamic processes. This study reconstructs the spatiotemporal trajectory of the Ujung Pangkah estuary (1995–2025) to weigh natural progradation against anthropogenic pressure. We mapped the estuary in Google Earth
[...] Read more.
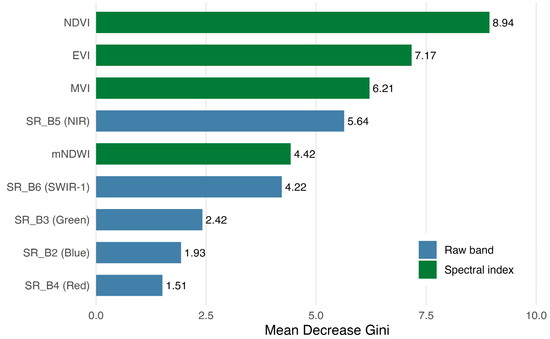
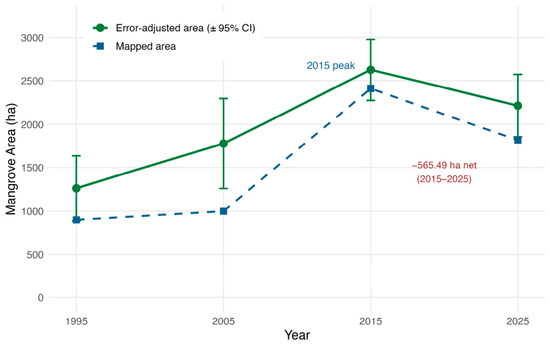
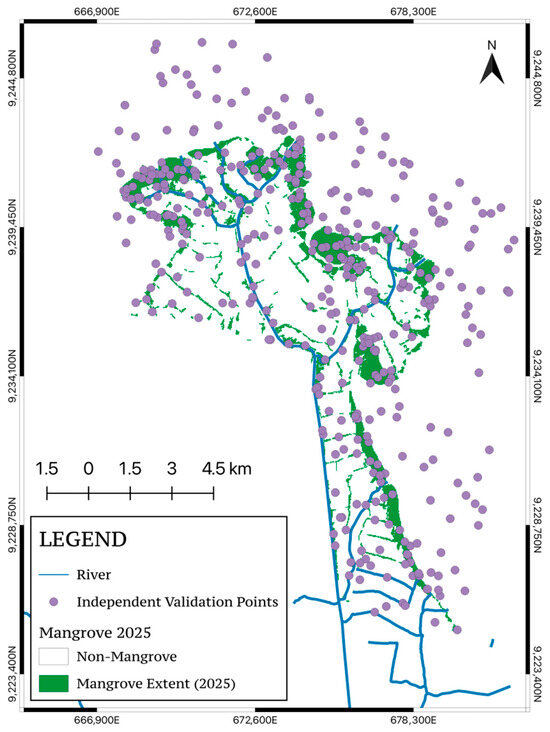
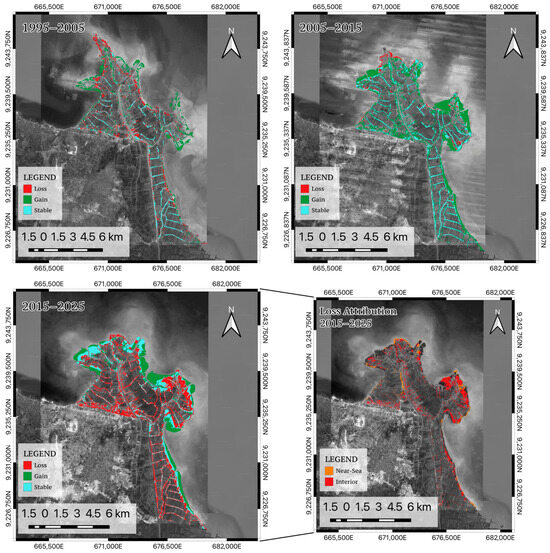
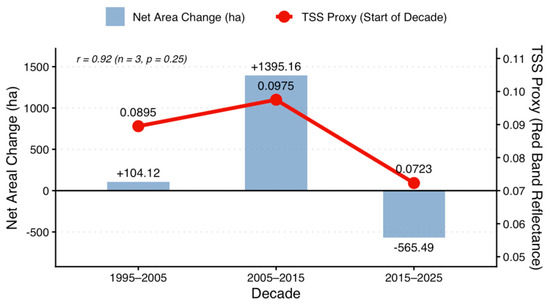
Mangrove deforestation is a global problem, but sediment-dominated estuaries can resist it through their own morphodynamic processes. This study reconstructs the spatiotemporal trajectory of the Ujung Pangkah estuary (1995–2025) to weigh natural progradation against anthropogenic pressure. We mapped the estuary in Google Earth Engine using Landsat archives and a Random Forest classifier with four spectral indices (NDVI, mNDWI, EVI, and MVI) and then independently validated all four epochs (Overall Accuracy 92.25–95.00%; Kappa 0.845–0.900). Error-adjusted change-detection analysis shows a non-monotonic trajectory: mangrove extent grew from 898.88 ha (1995) to a 2410.44 ha peak in 2015 and then contracted to 1816.87 ha by 2025 (error-adjusted: 1261.11 to 2626.03 to 2213.71 ha). Across the 30-year record, this is a statistically significant net expansion (z = 3.60, p < 0.001). Spatial attribution shows the 2015–2025 contraction comes mostly from landward anthropogenic conversion (78.1%), not seaward erosion (21.9%). A lagged correlation between a suspended sediment proxy and decadal net change (r = 0.92) offers quantitative support for continued sediment-driven coastal progradation. Ujung Pangkah’s resilience therefore coexists with a real, locatable anthropogenic pressure. Safeguarding this blue carbon ecosystem means targeting policy at the interior conversion zones already underway, alongside continued protection of the coastal frontier.
Full article

Figure 1
Open AccessArticle
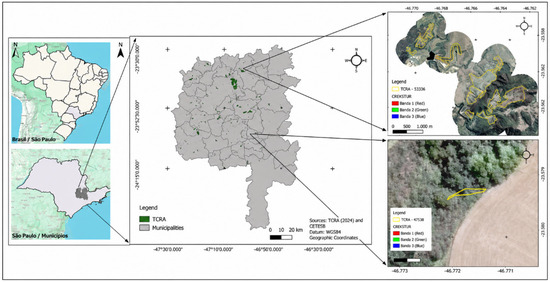
CBERS 4A/WPM Image Classification for Mapping Land Use and Land Cover in TCRAs
by
Carla Rodrigues Santos, Francisco Salazar, Fernanda Beatriz Jordan Rojas Dallaqua and Bruno Schultz
Geographies 2026, 6(3), 84; https://doi.org/10.3390/geographies6030084 - 1 Sep 2026
Abstract
►▼
Show Figures
Tropical restoration areas present high spectral heterogeneity and spatial fragmentation, making land use and land cover (LULC) classification challenging, particularly when using medium-resolution satellite imagery. Although spectral mixture analysis, object-based image analysis, and machine learning approaches have been widely explored individually, their integrated
[...] Read more.
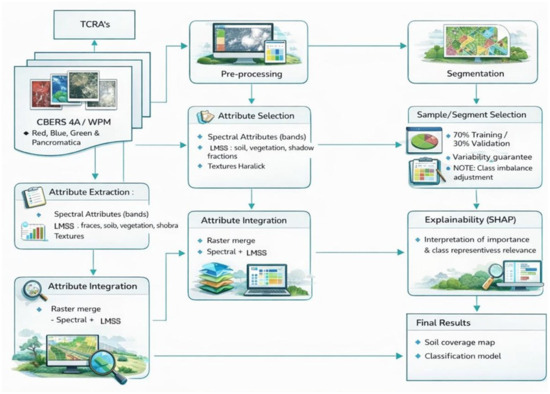
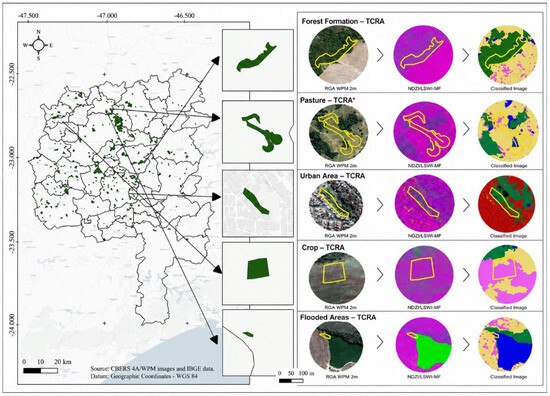
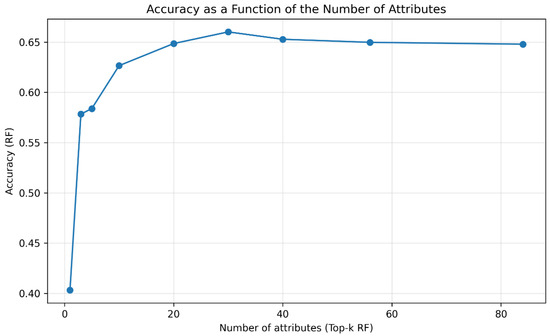
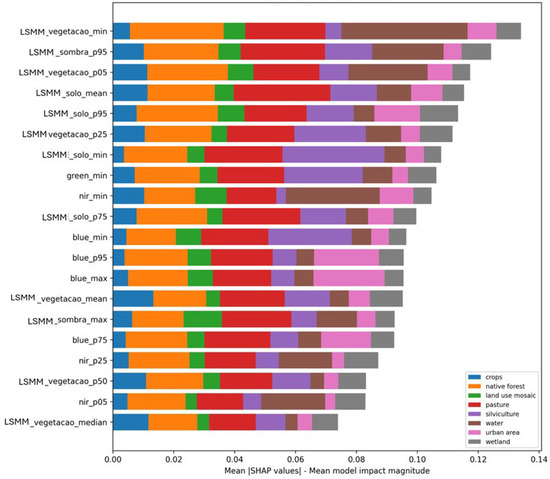
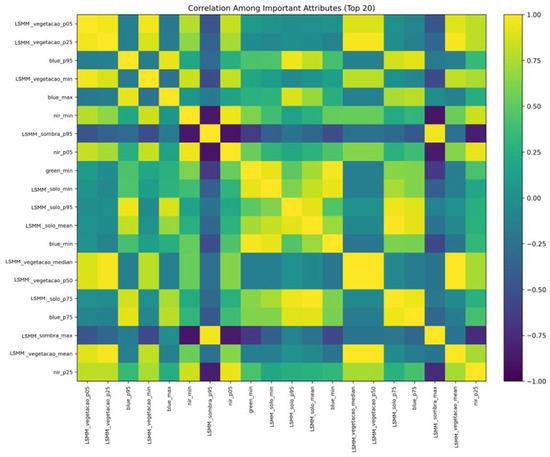
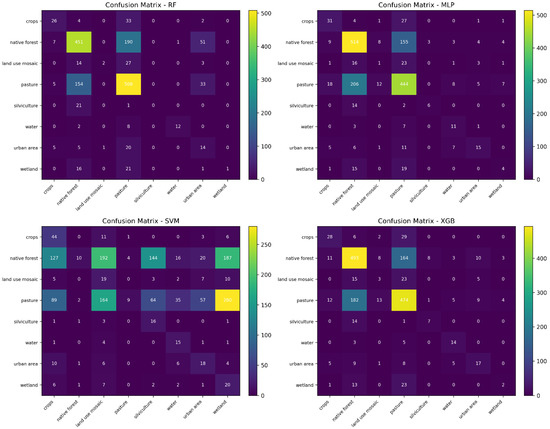
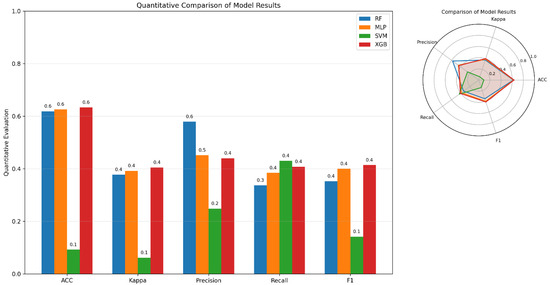
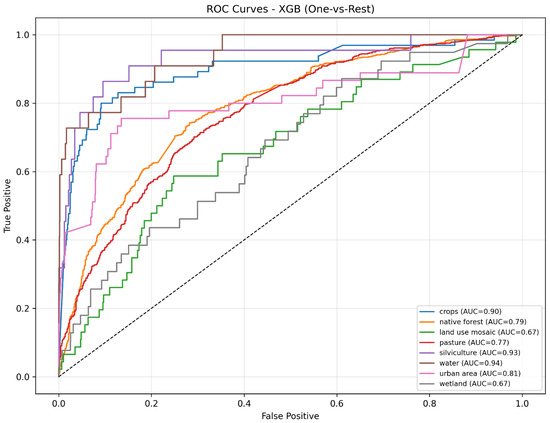
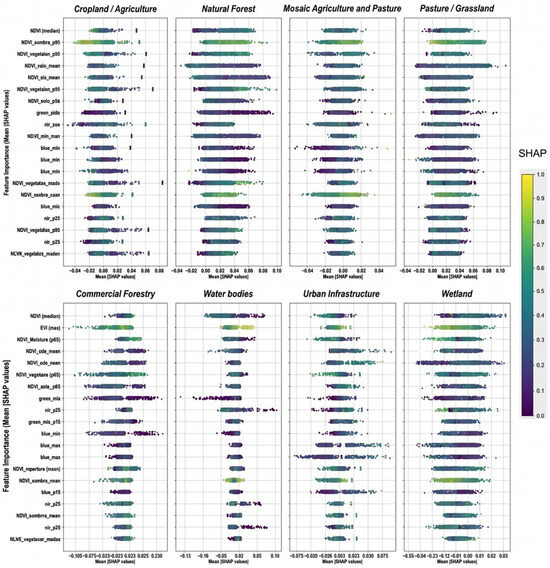
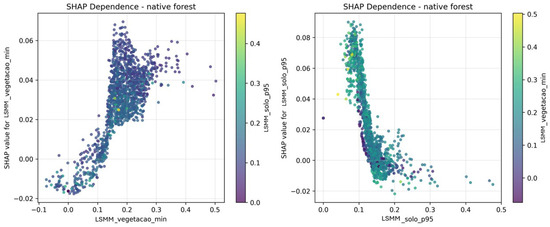
Tropical restoration areas present high spectral heterogeneity and spatial fragmentation, making land use and land cover (LULC) classification challenging, particularly when using medium-resolution satellite imagery. Although spectral mixture analysis, object-based image analysis, and machine learning approaches have been widely explored individually, their integrated application using freely available China–Brazil Earth Resources Satellite 4A Wide-field Panchromatic and Multispectral (CBERS-4A/WPM) imagery for monitoring Environmental Restoration Commitment Agreements (TCRAs) remains limited. This study investigated whether the integration of Linear Spectral Mixture Model (LSMM) fractions, Geographic Object-Based Image Analysis (GEOBIA), and machine learning algorithms could improve LULC classification for mapping TCRAs in the state of São Paulo, Brazil. Spectral, textural, and sub-pixel attributes derived from pan-sharpened CBERS-4A/WPM imagery were combined into a unified feature dataset, and Random Forest, XGBoost, Multilayer Perceptron, and Support Vector Machine classifiers were evaluated. Random Forest achieved the best classification performance, with an overall accuracy of approximately 0.66, demonstrating superior predictive capability compared with the other tested algorithms. Feature importance analysis indicated that LSMM-derived vegetation and shadow fractions contributed significantly to class discrimination. The integration of spectral, spatial, and machine learning approaches provides an interpretable and cost-effective framework for LULC mapping in highly fragmented tropical restoration landscapes, supporting environmental monitoring and restoration assessment.
Full article

Figure 1
Open AccessReview
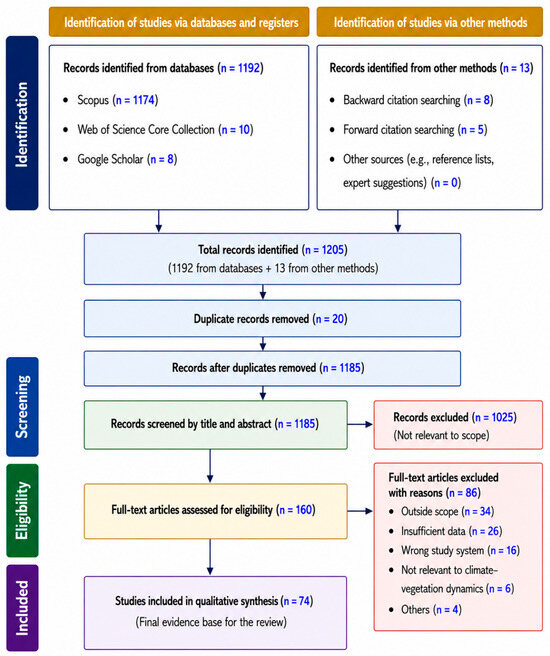
Climate Change and Forest Vegetation Dynamics: Ecological Responses, Risks, Opportunities, and Adaptation with Special Reference to India—Systematic Review
by
Nirakar Bhol, Umesh Sharma, Subhasmita Parida, Prajnashree Mallick, Sushree Rojalina Mahapatra, Jyotiraditya Das, Neeraj Sankhyan, Shilpa Sharma, Sunny Sharma and Amit Kumar
Geographies 2026, 6(3), 83; https://doi.org/10.3390/geographies6030083 - 1 Sep 2026
Abstract
►▼
Show Figures
Forest vegetation dynamics are changing under climate change, with important implications for biodiversity conservation, ecosystem services, carbon cycling, and livelihoods. Vegetation regulates terrestrial carbon storage and biophysical feedbacks, but its responses to warming, changing precipitation, rising atmospheric CO2, and climate extremes
[...] Read more.
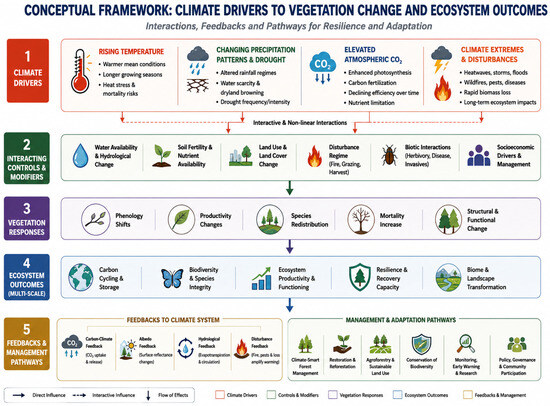
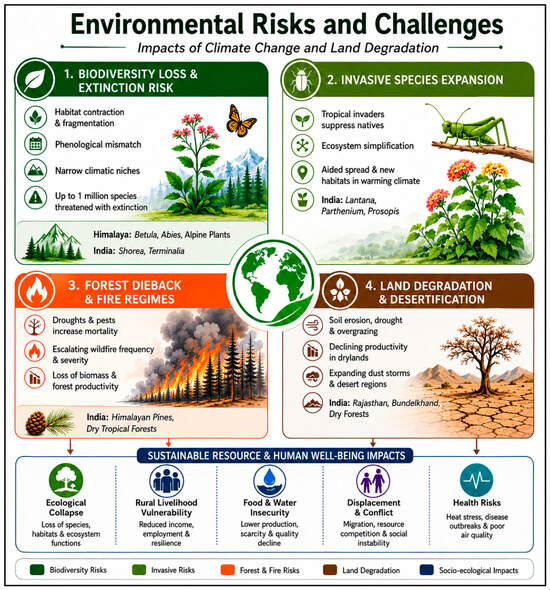
Forest vegetation dynamics are changing under climate change, with important implications for biodiversity conservation, ecosystem services, carbon cycling, and livelihoods. Vegetation regulates terrestrial carbon storage and biophysical feedbacks, but its responses to warming, changing precipitation, rising atmospheric CO2, and climate extremes are complex and spatially variable. This review presents a PRISMA-guided integrative synthesis of 74 peer-reviewed studies published between 1990 and 2025, incorporating evidence from remote sensing, long-term ecological observations, ecosystem flux measurements, experimental studies, and Earth system modelling. Rather than examining climatic drivers independently, the review synthesizes their interactions with water availability, nutrient limitation, land-use change, disturbance, and biotic processes across physiological, population, ecosystem, and biome scales, with particular emphasis on India. The synthesis reveals that vegetation responses are governed less by individual climatic drivers than by their interactions with resource availability, disturbance, land use, and ecosystem characteristics. Across the reviewed evidence, contrasting greening and browning trends, phenological shifts, species redistribution, and changes in productivity and carbon dynamics were observed. Importantly, greening does not consistently translate into enhanced ecosystem functioning or resilience because increased canopy development may occur alongside water and nutrient limitation, declining carbon-use efficiency, recurrent disturbance, land-use intensification, or changes in species composition. Indian evidence further demonstrates contrasting vegetation trajectories across forests, drylands, Himalayan ecosystems, and agricultural landscapes. Major uncertainties arise from differences among remote-sensing indicators, scale dependency, limited long-term experimental coverage, and incomplete representation of water, nutrient, disturbance, and vegetation processes in coupled climate–vegetation models. Overall, the review identifies a shift from assessing forest vegetation change primarily through greening toward evaluating ecosystem functioning, carbon permanence, and ecosystem resilience capacity as integrated indicators.
Full article

Figure 1
Open AccessArticle
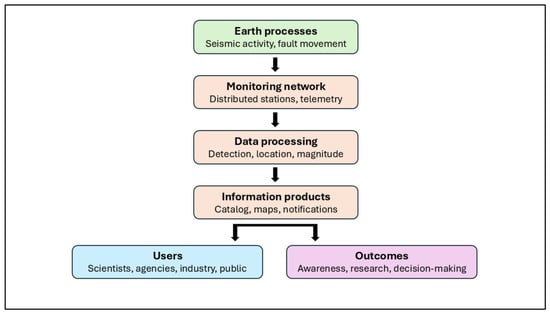
TexNet: A Statewide Seismic Monitoring Network as Geographic Information Infrastructure
by
Caroline Breton, Camilo Muñoz, Nikolaos Bakirtzis and Alexandros Savvaidis
Geographies 2026, 6(3), 82; https://doi.org/10.3390/geographies6030082 - 20 Aug 2026
Abstract
Seismic monitoring networks increasingly develop capabilities that function as geographic information infrastructure, transforming continuous geophysical observations into spatial information that supports research, decision-making, and public awareness. In Texas, seismicity linked to oil and gas operations has increased since 2009 across major producing regions,
[...] Read more.
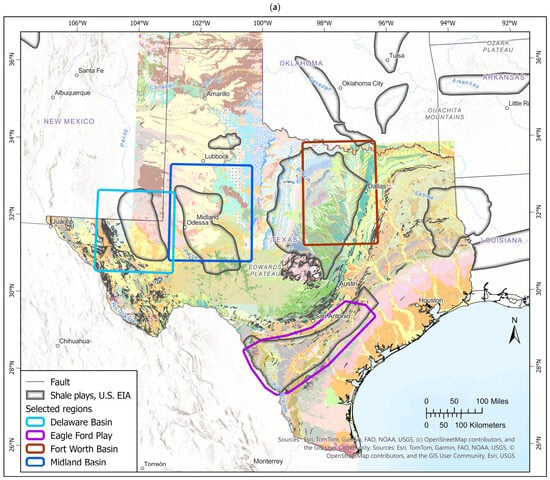
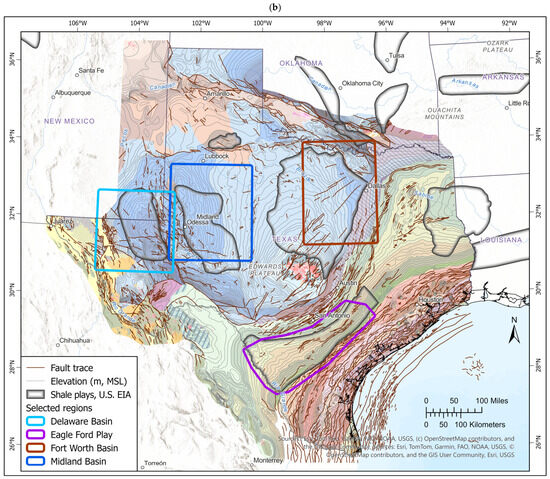
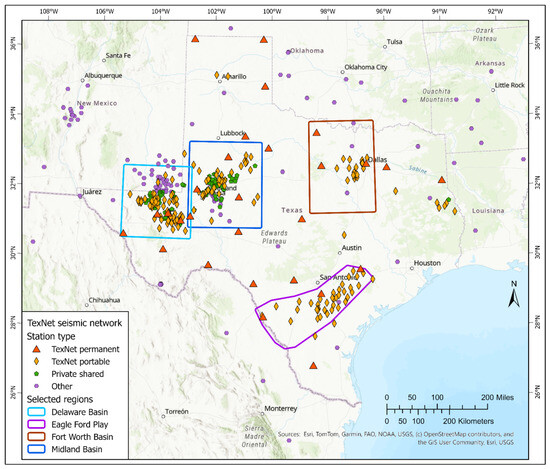
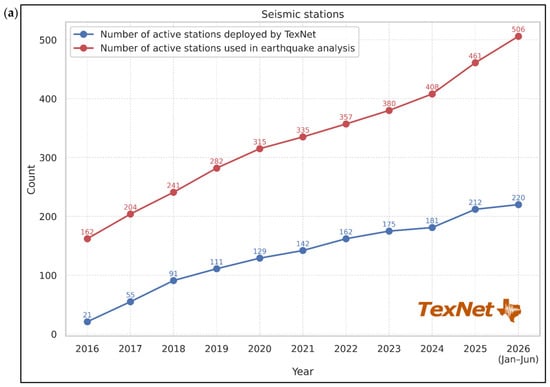
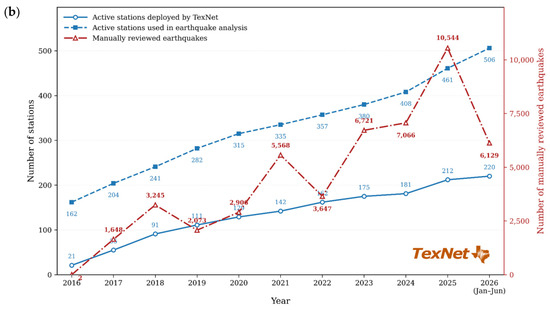
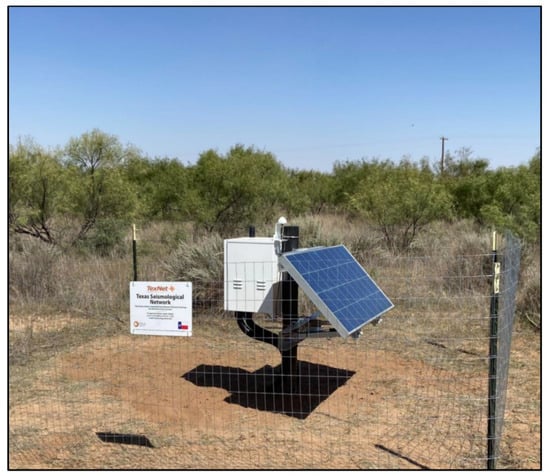
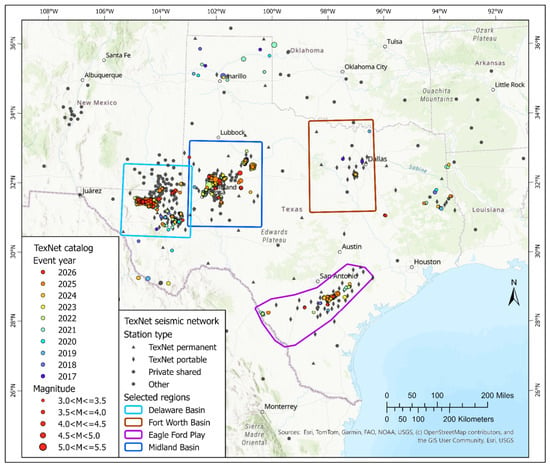
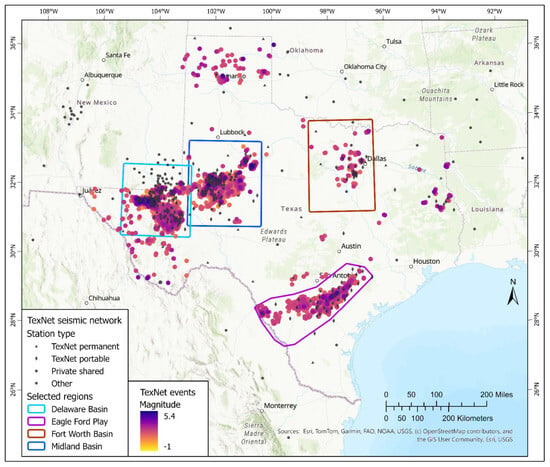
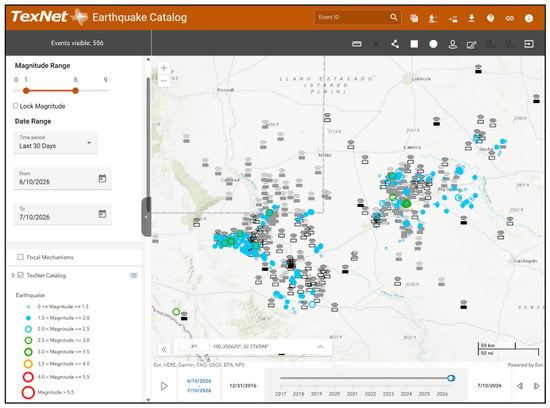
Seismic monitoring networks increasingly develop capabilities that function as geographic information infrastructure, transforming continuous geophysical observations into spatial information that supports research, decision-making, and public awareness. In Texas, seismicity linked to oil and gas operations has increased since 2009 across major producing regions, prompting the Texas Legislature to establish the Texas Seismological Network and Seismology Research program (TexNet) in 2015. This paper examines TexNet’s seismic monitoring network, field operations, data-processing pipeline, and the information products, data services, and decision-support tools that transform seismic observations into accessible earthquake information. Since routine earthquake reporting began in 2017, TexNet has grown from an inherited network of eighteen broadband stations to a system directly maintaining 207 stations and incorporating 421 active stations to locate earthquakes across Texas. TexNet provides a suite of information products, data services, and decision-support tools—including the TexNet Earthquake Catalog, near-real-time notification systems, and open data products—that connect geophysical observations with the needs of researchers, regulatory agencies, industry, and the public. TexNet remains fundamentally a seismic monitoring network, with additional capabilities that support scientific, regulatory, and public information needs in Texas and other regions with induced seismicity.
Full article
(This article belongs to the Special Issue Geography as a Transdisciplinary Science in a Changing World)
►▼
Show Figures

Figure 1
Open AccessArticle
Estimation of Gross Primary Production and Net Primary Production of Vegetation Cover for Low Mountain Sub-Mediterranean Landscapes Using Remote Sensing and Geoinformation Modeling
by
Vladimir Tabunshchik, Anna Drygval, Polina Drygval, Olga Parubets, Aleksandra Nikiforova, Cam Nhung Pham, Nikolai Bratanov, Maria Safonova, Ekaterina Petlukova, Anna Repetskaya and Irina Kalinchuk
Geographies 2026, 6(3), 81; https://doi.org/10.3390/geographies6030081 - 18 Aug 2026
Abstract
Terrestrial vegetation cover is a critical component of the global carbon cycle, annually assimilating a substantial fraction of anthropogenic CO2 emissions. However, regional estimates of gross primary production (GPP) and net primary production (NPP) remain insufficiently studied, especially for ecologically sensitive areas
[...] Read more.
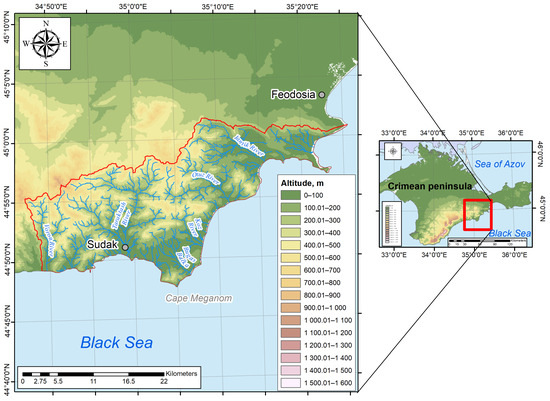
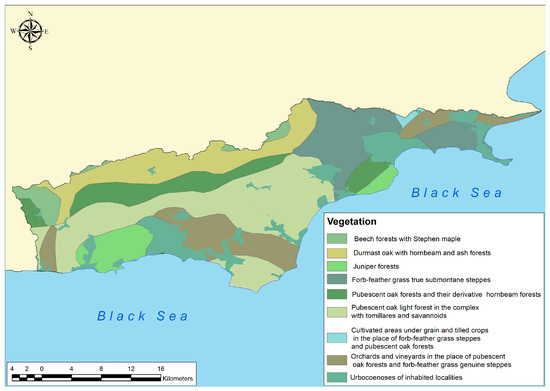
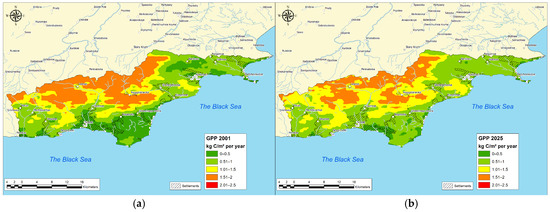
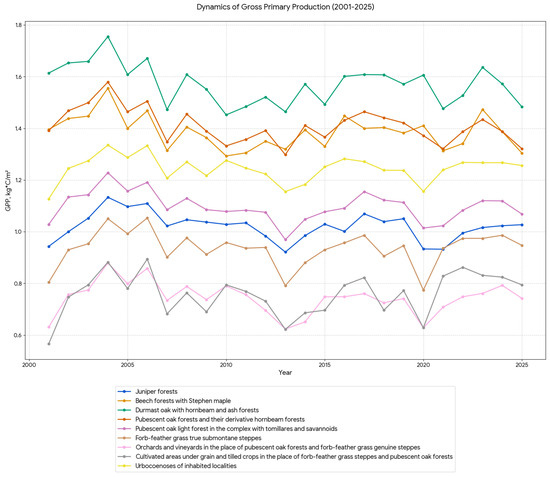
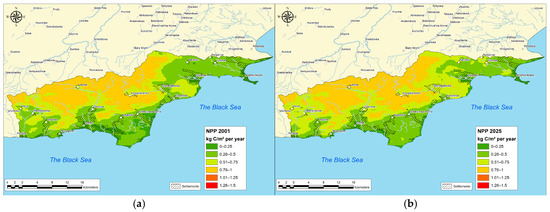
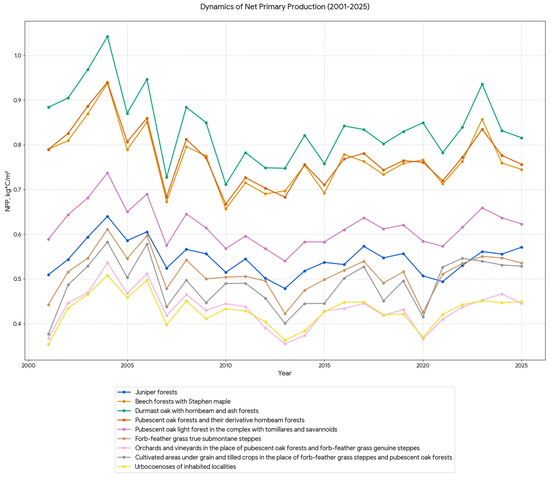
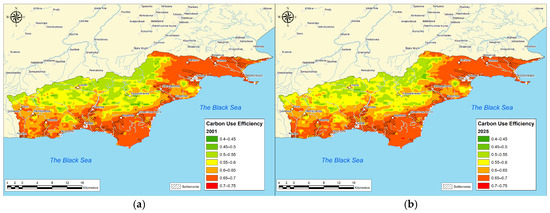
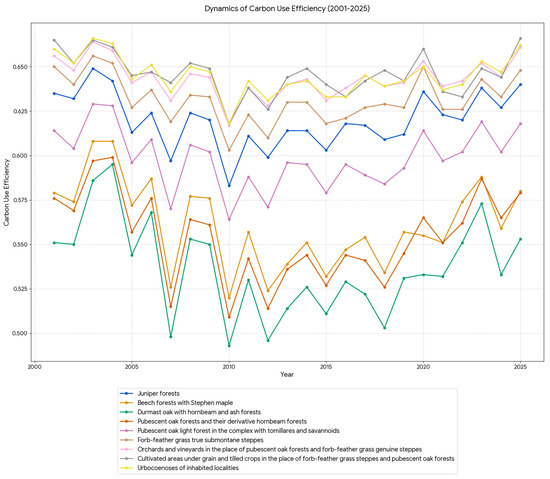
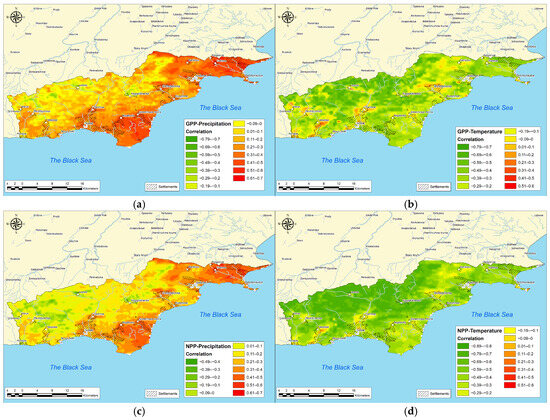
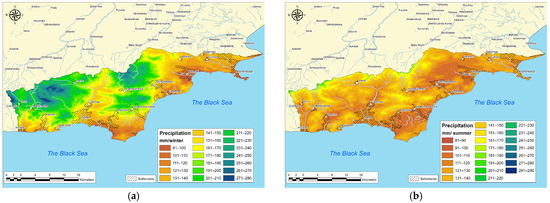
Terrestrial vegetation cover is a critical component of the global carbon cycle, annually assimilating a substantial fraction of anthropogenic CO2 emissions. However, regional estimates of gross primary production (GPP) and net primary production (NPP) remain insufficiently studied, especially for ecologically sensitive areas such as the sub-Mediterranean landscapes of southeastern Crimea. The aim of this study is to calculate and map the spatio-temporal distribution of GPP and NPP across southeastern Crimea over the period 2001–2025 using Earth remote sensing data and geoinformation modeling. This study employed MODIS products (MOD17A2H collection 061) processed in the Google Earth Engine cloud platform, together with temperature and precipitation data (ClimateEU, CHIRPS). Statistical analysis included calculation of the carbon use efficiency (CUE) coefficient and correlation analysis. The results show that the mean GPP for southeastern Crimea is 1.13 kg C/m2 and the mean NPP is 0.61 kg C/m2, which exceed global average values. Maximum productivity is characteristic of natural forest communities (sessile oak, beech and juniper forests), whereas anthropogenically transformed landscapes (agricultural land, urban coenoses) exhibit the lowest values. The mean CUE is 0.54, with the highest values (0.63–0.66) recorded for agrocoenoses and steppes, and the lowest (0.49–0.57) for forests. A positive correlation between productivity and precipitation and a negative correlation with air temperature were identified, especially for forest ecosystems. This study fills a gap in regional primary productivity assessments and can serve as a basis for ecosystem monitoring under climate change and anthropogenic pressure.
Full article
(This article belongs to the Special Issue Geography as a Transdisciplinary Science in a Changing World)
►▼
Show Figures

Figure 1
Open AccessArticle
Local Values in the Settlements of the Lower Ipoly (Ipel) Region in the Hungarian–Slovakian Border Zone
by
Gergely Halász, Alexandra Ferencz-Havel, Dénes Saláta, József Káposzta, Kristián Kurcz and Eszter Tormáné Kovács
Geographies 2026, 6(3), 80; https://doi.org/10.3390/geographies6030080 - 14 Aug 2026
Abstract
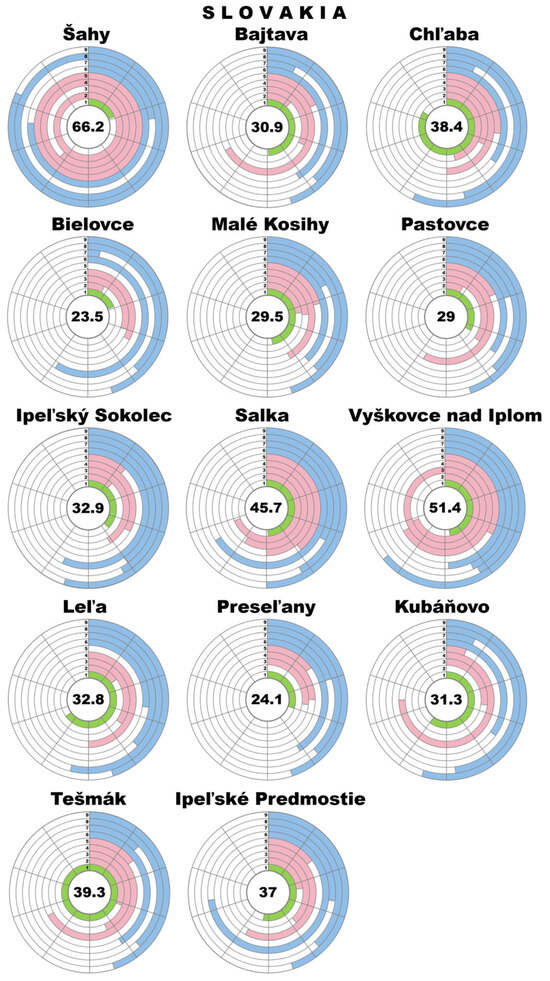
The primary aim of this study is to identify how residents on the Hungarian and Slovak sides of the Lower Ipoly Valley perceive the most considerable material and immaterial local values and unique resources of their settlements. The research was designed to explore
[...] Read more.
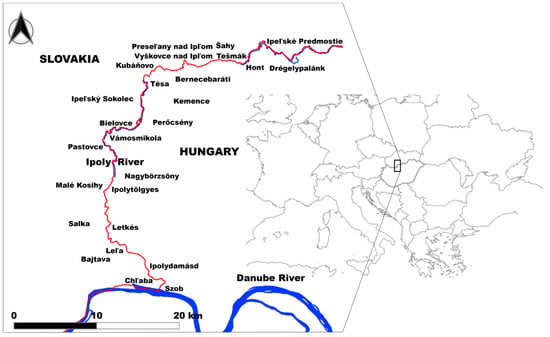
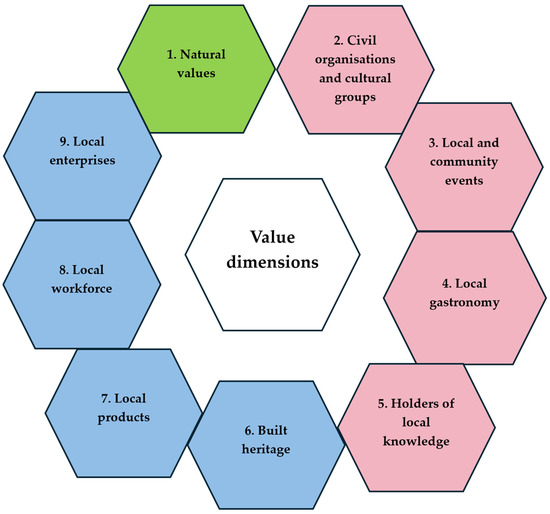
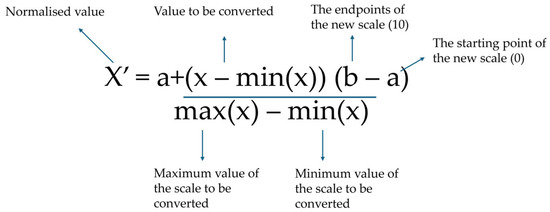
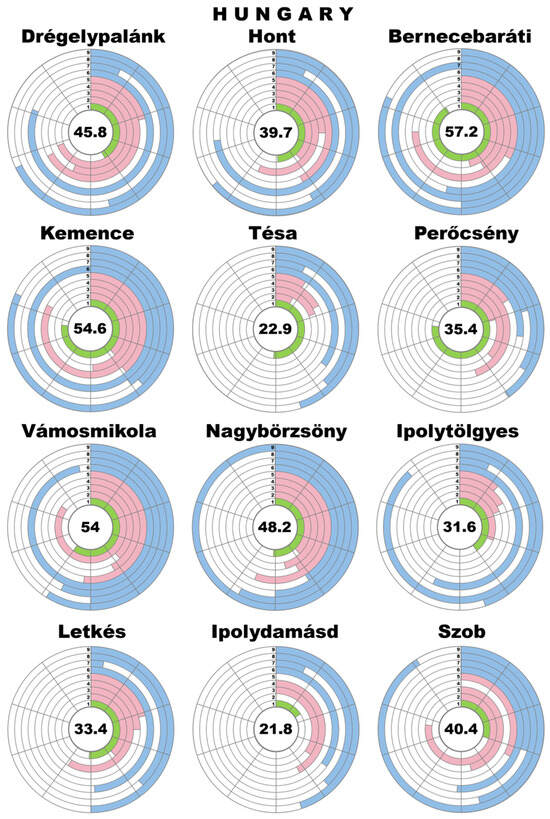
The primary aim of this study is to identify how residents on the Hungarian and Slovak sides of the Lower Ipoly Valley perceive the most considerable material and immaterial local values and unique resources of their settlements. The research was designed to explore and compare the territorial capital of the two sides of the study area based on three major capital types: natural, social, and economic capitals. Data collection included 254 semi-structured interviews, conducted with 136 residents on the Slovak side (14 settlements) and 118 residents on the Hungarian side (12 settlements). Detailed interview summaries were analysed with qualitative content analysis using emergent coding. This resulted in an analytical framework comprising nine value dimensions. Across both sides of the border, we examined the same nine value dimensions: local workforce, local enterprises, civil organisations and cultural groups, local and community events, local gastronomy, natural values, built heritage, holders of local knowledge, and local products. Items mentioned that related to each value dimension were counted for each dimension and normalised to a 0–10 scale. The quantified values were aggregated at the settlement level (90 points being the maximum score). The average score of each dimension was also calculated for both sides of the study area. Our findings show that the Hungarian side achieved a total score of 40.4, while the Slovak side reached 36.6, both reflecting a similarly weak–moderate state of the local capitals with minimal differences. This indicates that the two sides of the study area share comparable developmental challenges but also considerable potential for improvement. The Hungarian side performed slightly better in nearly all dimensions except local gastronomy, where the Slovak side proved stronger. The Hungarian side’s relative advantages include a higher presence of local enterprises, a richer network of civil and cultural groups, and more diverse built heritage; in other dimensions, differences are marginal. One of the most pressing regional challenges is improving employment opportunities and stimulating entrepreneurial activity, which are essential for enhancing population retention. Overall, the results indicate that the settlements possess substantial—yet largely underutilised—value assets, whose conscious and consensus-based development could form a strong foundation for creative and innovative local development. Each settlement’s value matrix includes elements that define its uniqueness, enabling the identification of numerous potential development pathways, whether through nature-based educational and recreational programmes, the utilisation of culturally considerable built heritage, the revitalisation of living traditions, or the promotion of local traditional gastronomy on both sides of the study area.
Full article
(This article belongs to the Special Issue Feature Papers of Geographies in 2026)
►▼
Show Figures

Figure 1
Open AccessArticle
Spatiotemporal Variability of Near-Surface Temperature Inversion over Ulaanbaatar City, Mongolia
by
Erdenesukh Sumiya, Sandelger Dorligjav, Munkhbat Byamba-Ochir, Batjargal Gankhuyag, Enkhbat Erdenebat, Dorligjav Donorov, Dongmei Song and Gantuya Ganbat
Geographies 2026, 6(3), 79; https://doi.org/10.3390/geographies6030079 - 14 Aug 2026
Abstract
►▼
Show Figures
Near-surface temperature inversions are prevalent during the cold months in Ulaanbaatar city, Mongolia, and significantly degrade urban air quality by trapping hazardous pollutants within a shallow atmospheric boundary layer. This study investigates spatiotemporal variability, physical mechanisms, and long-term evolution of near-surface temperature inversions
[...] Read more.
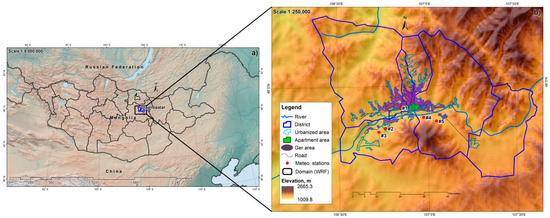
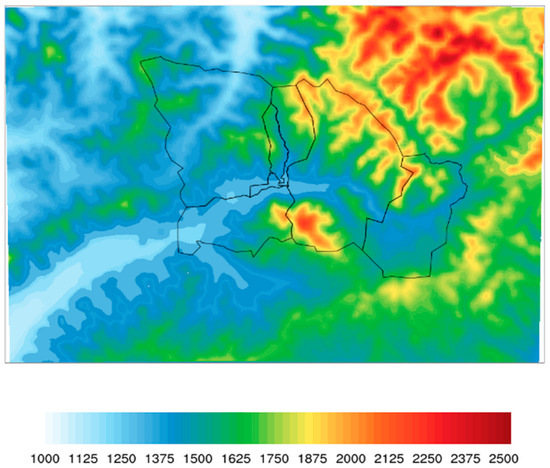
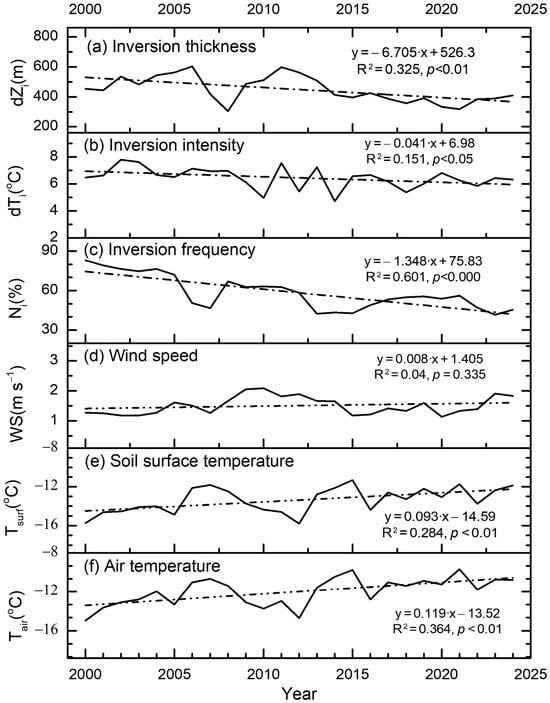
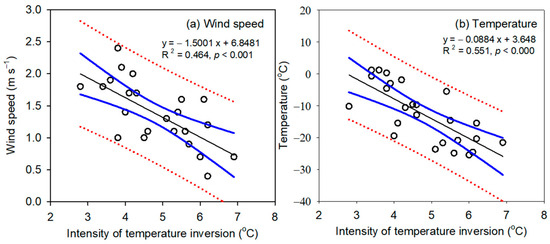
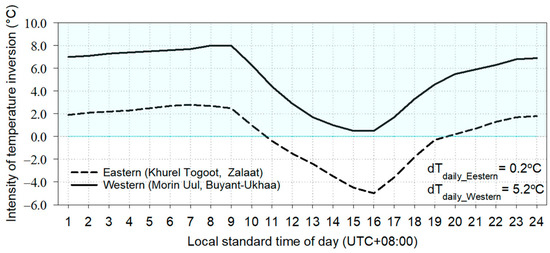
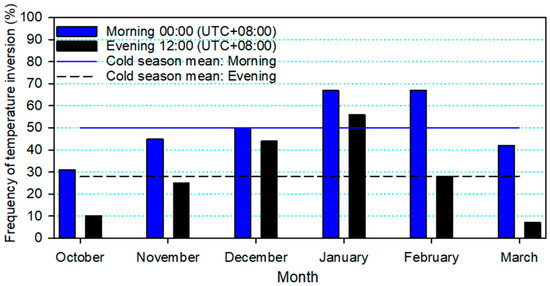
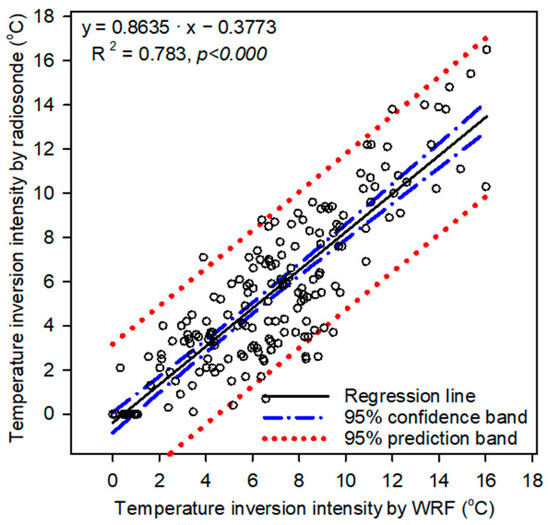
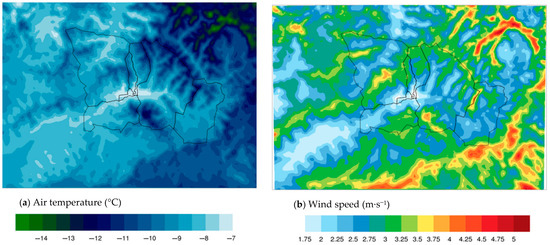
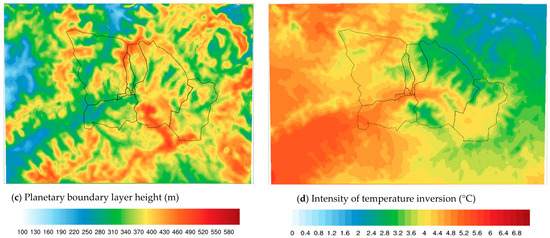
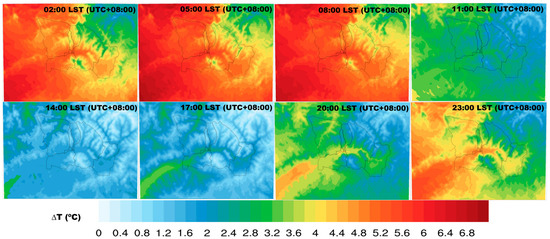
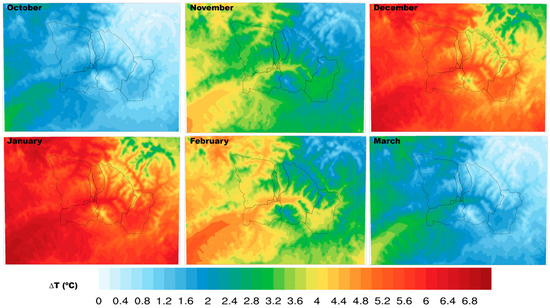
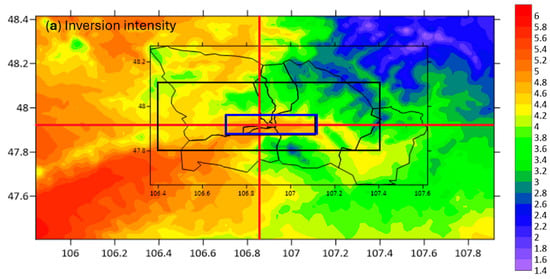
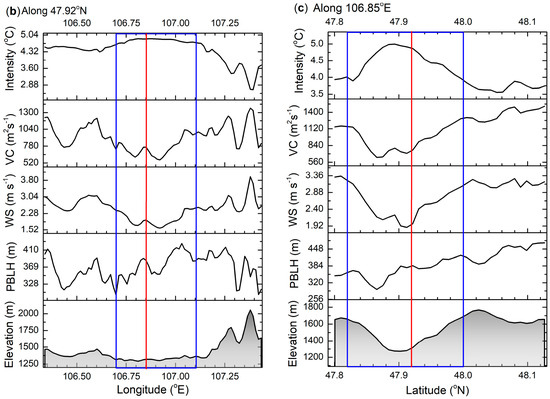
Near-surface temperature inversions are prevalent during the cold months in Ulaanbaatar city, Mongolia, and significantly degrade urban air quality by trapping hazardous pollutants within a shallow atmospheric boundary layer. This study investigates spatiotemporal variability, physical mechanisms, and long-term evolution of near-surface temperature inversions over Ulaanbaatar by integrating 25 years (2000–2024) of ground-based meteorological and radiosonde observations, with high-resolution Weather Research and Forecasting (WRF) model simulations for 2012–2023. Our results demonstrate the four-dimensional data assimilation (FDDA) grid nudging effectively captures localized topographic influences in the WRF simulations, showing a strong agreement with radiosonde observations (R2 = 0.783, p < 0.000). Near-surface temperature inversions are strongly controlled by the Siberian High, with the highest frequency occurring from December to February, when up to 67% of morning observations exhibit inversion conditions. A pronounced diurnal cycle was identified, with inversion intensity peaking at 5.6–6.8 °C during the early morning hours (02:00–08:00 LST) before reaching a minimum around 14:00 LST. Spatially, the strongest inversions occur along the low-lying Tuul River valley, where the planetary boundary layer is compressed to below 350 m and wind speeds decrease to less than 2.4 m·s−1, creating persistent atmospheric stagnation. Despite these favorable conditions for inversion formation, long-term observations indicate that regional warming (+2.0 °C) and the urban heat island effects have reduced inversion frequency by 31%, inversion thickness by 170 m, and inversion intensity by 0.9 °C over the past 25 years. These findings demonstrate the strong coupling between regional complex terrain, and boundary layer thermodynamics, highlighting the need to incorporate urban ventilation corridors and topography-informed planning into climate adaptation and winter air-quality management strategies.
Full article

Figure 1
Open AccessArticle
A Flood Setback Performance Index to Assess the Pluvial Flood Resilience of School Campuses in a Rapidly Urbanizing Coastal City
by
K. P. Deepthi, K. S. Vignesh, C. Pradeepa and Ramalingam Senthil
Geographies 2026, 6(3), 78; https://doi.org/10.3390/geographies6030078 - 13 Aug 2026
Abstract
Pluvial flooding is intensifying in fast-growing coastal cities as rapid urbanization increases impervious surfaces and reduces natural infiltration, challenging planners to identify scalable and site-level mitigation strategies. Although statutory setbacks around institutional buildings are widely mandated for ventilation, safety, and accessibility, their contribution
[...] Read more.
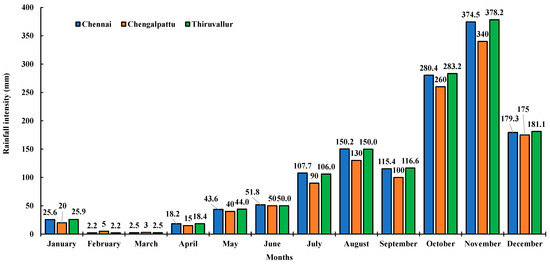
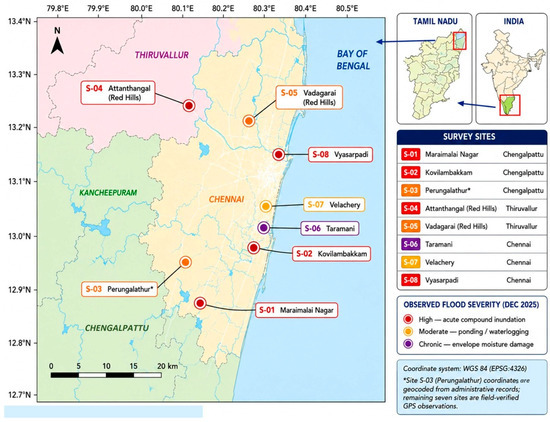
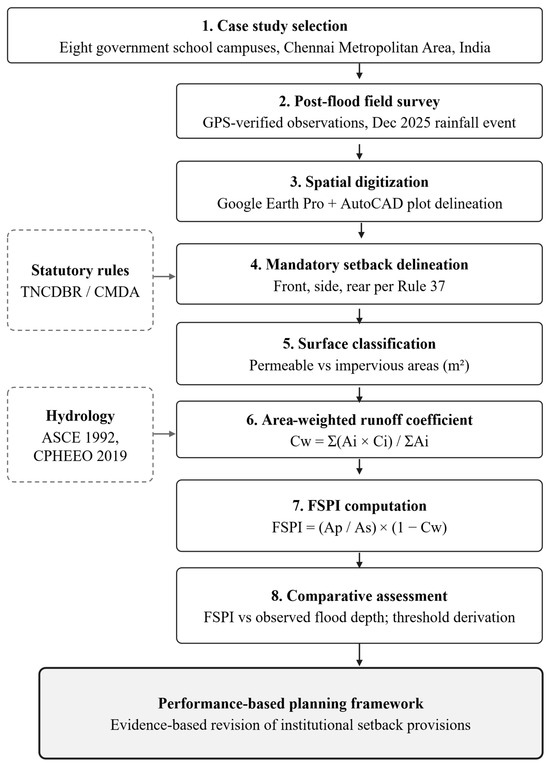
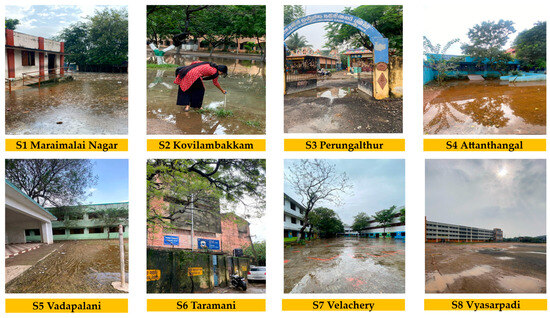
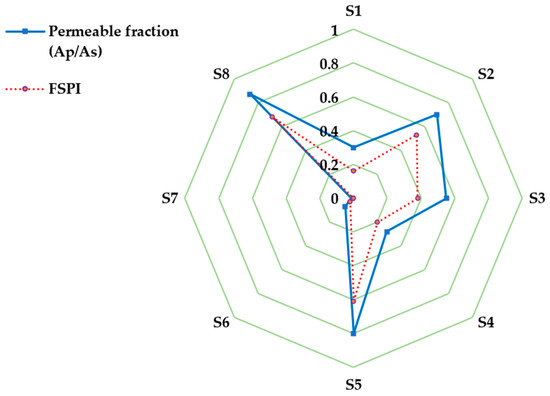
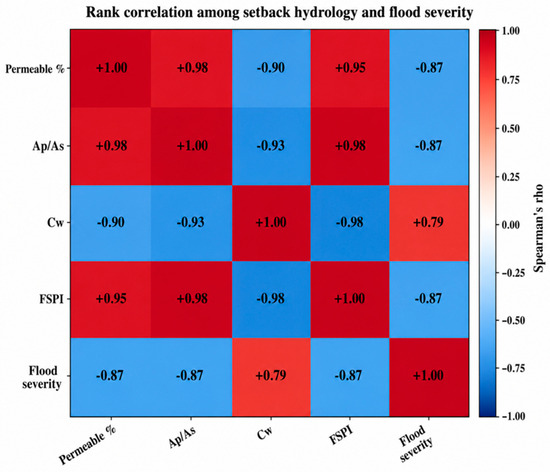
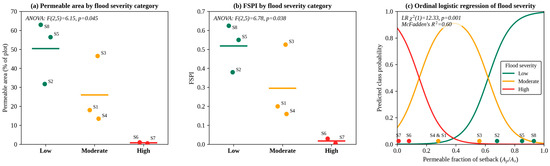
Pluvial flooding is intensifying in fast-growing coastal cities as rapid urbanization increases impervious surfaces and reduces natural infiltration, challenging planners to identify scalable and site-level mitigation strategies. Although statutory setbacks around institutional buildings are widely mandated for ventilation, safety, and accessibility, their contribution to urban flood resilience remains largely unexplored. This study develops the Flood Setback Performance Index (FSPI), a dimensionless indicator that integrates setback permeability and area-weighted runoff coefficients to quantify the flood-mitigation potential of mandatory setbacks. The framework was demonstrated using eight government school campuses in the Chennai, Chengalpattu, and Thiruvallur regions, which are part of a flood-prone coastal metropolis in India, following the extreme rainfall event of December 2025. Flood conditions were verified through post-event field surveys and visual evidence, while setback characteristics were extracted from satellite imagery and classified into permeable and impervious surfaces. The permeable fraction of setbacks and the FSPI values exhibited a strong inverse relationship with flood severity (Spearman’s ρ = −0.87, exact permutation p = 0.011). Ordinal logistic regression confirmed this gradient (likelihood-ratio χ2 = 9.3–10.3, p ≤ 0.002, McFadden’s R2 = 0.54–0.60), and campus rankings were made under saturated runoff coefficients. The findings demonstrate that statutory setbacks can function as nature-based flood-mitigation infrastructure with measurable hydrological benefits. Beyond the case study, the FSPI provides a simple, transferable, evidence-based tool for screening institutional sites by flood-mitigation performance and prioritizing where adaptation measures, such as increasing permeable-surface cover within statutory setbacks are needed, supporting climate-resilient urban planning and providing a regulatory reform decision-support tool with three applications: prioritizing the campus-level retrofit of permeable surfaces; screening building applications against setback surface standards; and identifying shelter-designated schools that require drainage upgrades. It thereby supports climate-resilient urban planning, regulatory reform, and progress toward Sustainable Development Goals 11 and 13.
Full article
(This article belongs to the Special Issue Feature Papers of Geographies in 2026)
►▼
Show Figures

Figure 1

Open AccessArticle
Demystifying Chungking Mansions as Vertical ‘Little India’/‘Little South Asia’ Urban Enclave: Linguistic Landscape, Low-End Globalisation, and Hub of Superdiversity
by
Chonglong Gu
Geographies 2026, 6(3), 77; https://doi.org/10.3390/geographies6030077 - 11 Aug 2026
Abstract
►▼
Show Figures
Positioned as a node of low-end globalization, the Chungking Mansions in Hong Kong’s Tsim Sha Tsui represents a transnational urban space with many ethnic restaurants, grocery stores, shops and cheap hotels. As a vertical hub of superdiversity, the building features significant number of
[...] Read more.
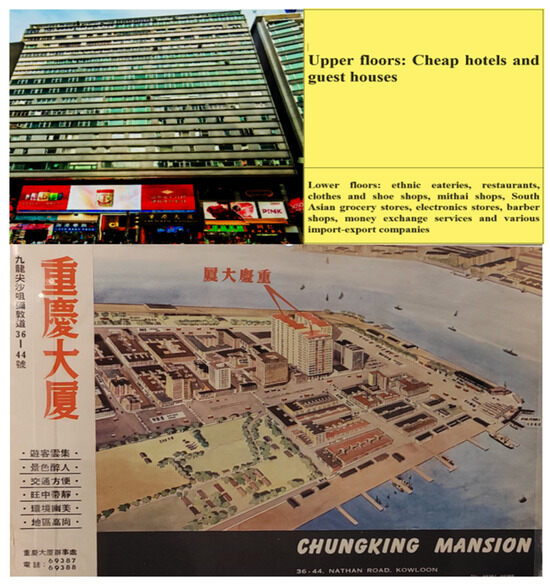
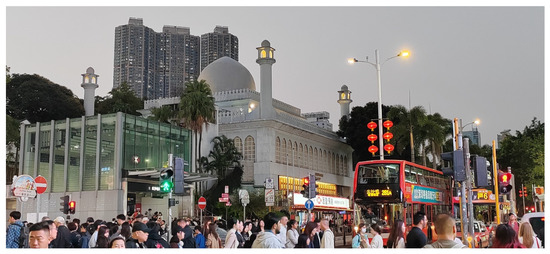
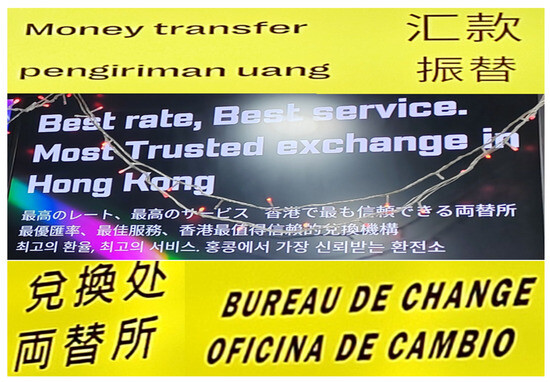
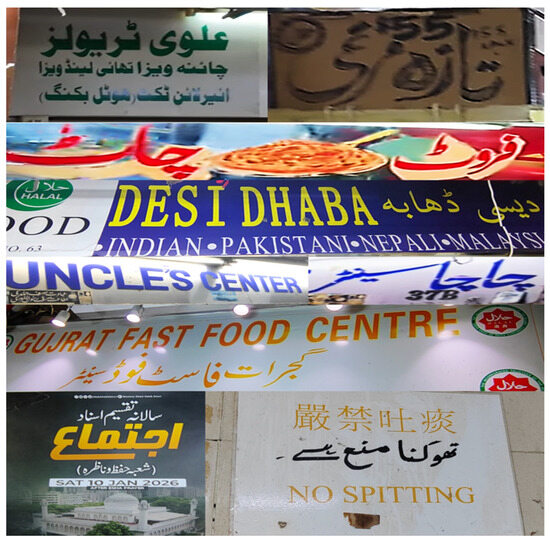
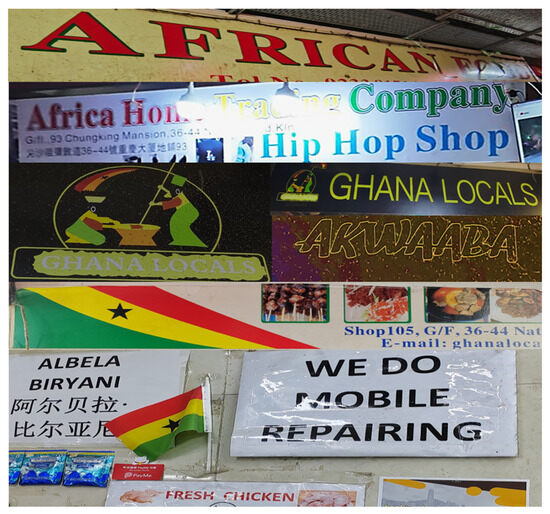
Positioned as a node of low-end globalization, the Chungking Mansions in Hong Kong’s Tsim Sha Tsui represents a transnational urban space with many ethnic restaurants, grocery stores, shops and cheap hotels. As a vertical hub of superdiversity, the building features significant number of people from South Asia (e.g., India, Pakistan, Bangladesh and Nepal), Southeast Asia, Africa and beyond. Unlike most ethnic enclaves and multicultural areas that feature horizontal spatial organization, the Chungking Mansions conceptually represents a vertical ‘Little South Asia’ or ‘Little UN’ condensed into one building. The transient and anonymous Chungking Mansions is something of a ‘non-place’ but it also has a sense of community. The building over time gained a bad reputation as a mysterious, dodgy, shady and dangerous ethnic place where violence and crimes take place. This article aims to demystify the Chungking Mansions from under-explored sociolinguistic/multilingual perspectives. Languages and symbols inscribed in the linguistic/semiotic landscape, we argue, represent important anthropogenic impacts on geography and nature, which constitute salient entry points into understanding how migration, low-end globalization and superdiversity leave traces on the urban landscape. This study documents and shows how various multilingual signs and cultural and religious symbols enact ethnic, linguistic, cultural and religious identities and produce and reproduce social meanings alongside the building’s verticality. These materially and symbolically contribute to a vertical geography of superdiversity.
Full article

Figure 1
Open AccessArticle
Remote Sensing Assessment of Land-Cover and Surface-Water Changes Associated with Black-Sand Mining Areas in an Arid Environment: A Multi-Index Exploratory Case Study from N’Diago, Mauritania (2014–2026)
by
Khadijetou AbdelWehab, Sidi Ahmed Elemin, Mohamed Ahmed Sidi Cheikh, Sidi Mohamed Cheikh Ouedi, Khadijetou El Hacen and Amjad Kallel
Geographies 2026, 6(3), 76; https://doi.org/10.3390/geographies6030076 - 10 Aug 2026
Abstract
►▼
Show Figures
Black-sand mining is an under-studied anthropogenic pressure on arid coastal environments, where sparse vegetation and slow natural recovery limit conventional impact assessment. Despite the recent expansion of heavy-mineral extraction along the Mauritanian coast, no spatio-temporal analysis has quantified its effects on land cover
[...] Read more.
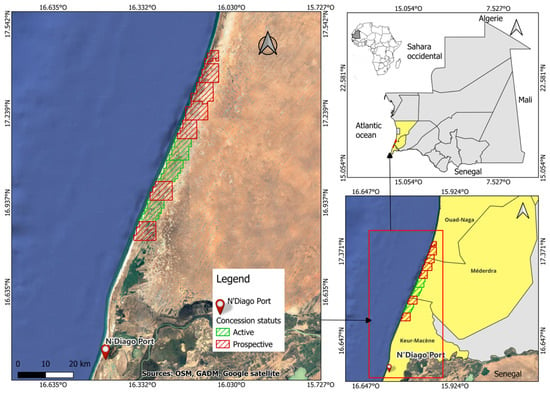
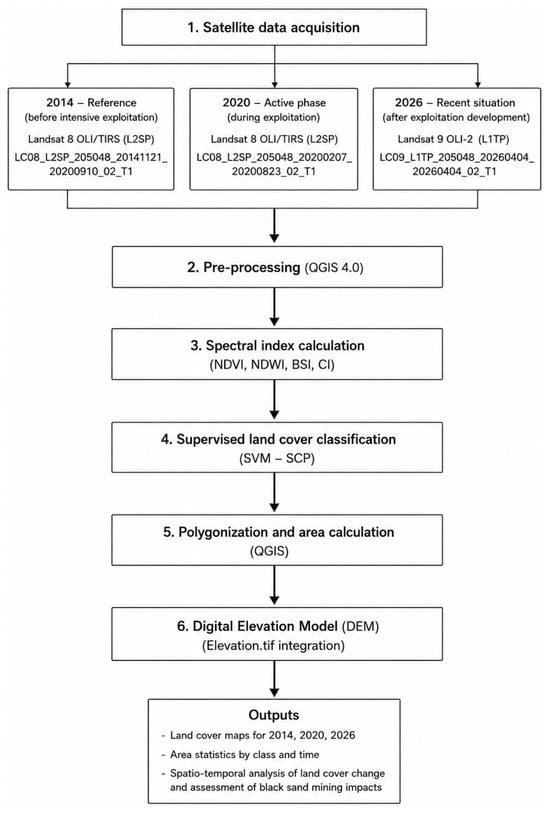
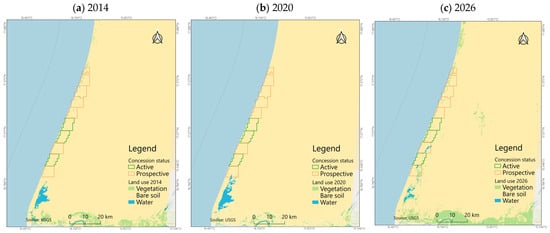
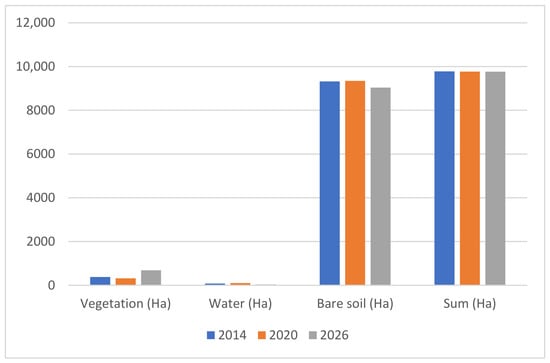
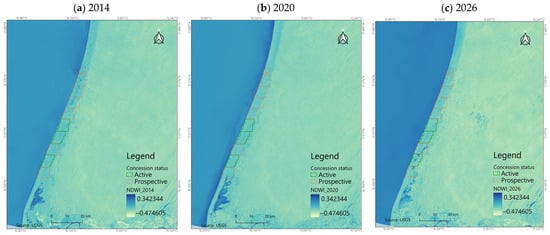
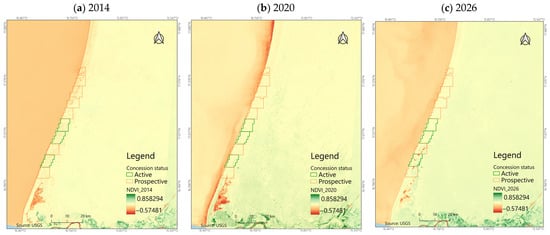
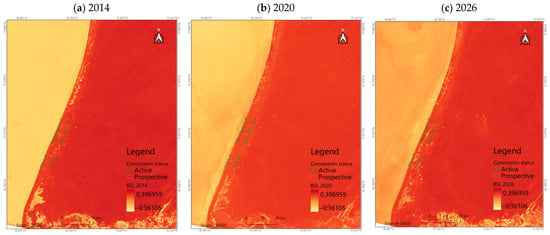
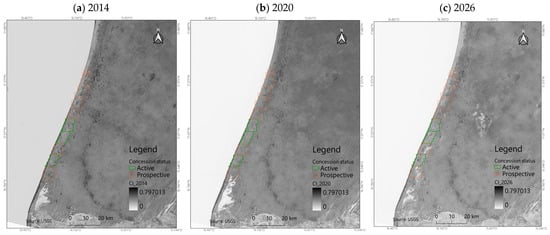
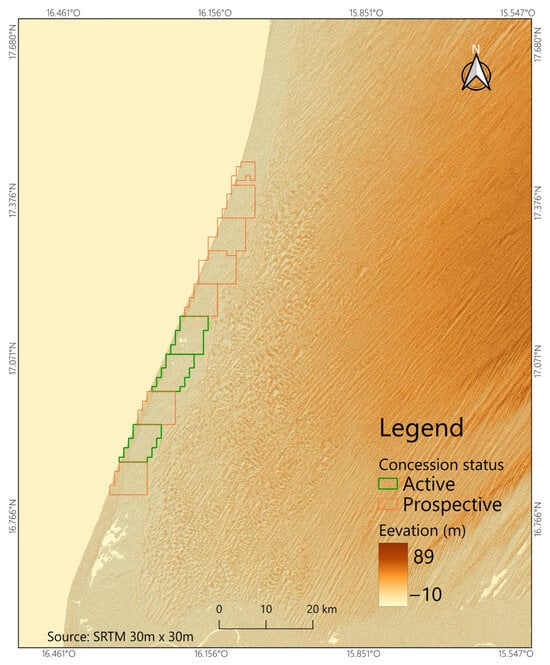
Black-sand mining is an under-studied anthropogenic pressure on arid coastal environments, where sparse vegetation and slow natural recovery limit conventional impact assessment. Despite the recent expansion of heavy-mineral extraction along the Mauritanian coast, no spatio-temporal analysis has quantified its effects on land cover and surface-water dynamics in the N’Diago region. We analysed the N’Diago–LGUWYCHICH coastal sector (south-western Mauritania) using three Landsat scenes (2014, 2020, and 2026) in QGIS (free and open-source Geographic Information System), four spectral indices (NDVI-Normalized Difference Vegetation Index, NDWI-Normalized Difference Water Index, BSI- Bare Soil Index, and CI -Coloration Index), supervised Support Vector Machine classification and a 30 m SRTM Digital Elevation Model over a 97.82 ha area of interest. Bare soil dominated the landscape at every date (92.6–95.7%) and vegetation stayed below 7%, indicating that canopy-based metrics underestimate disturbance in this setting. The clearest change was hydrological: an inland water body shrank from 1.02 ha in 2020 to 0.40 ha in 2026, a 60.6% loss. This individual inland water body, measured directly and independently from the NDWI index, is our primary hydrological observation: the wet feature was smaller in the 2026 image than in the 2020 image and was located near the mapped concession areas, but the available data do not establish the cause of this change. Similar bare-soil and colour index values (BSI ≈ 0.23, CI ≈ 0.79–0.80) were observed in the processed images, while residual seasonal and radiometric differences between the Landsat 8 and DOS-corrected Landsat 9 products cannot be excluded; BSI and CI are treated only as candidate or contextual spectral patterns, so any delineation of the disturbed footprint is provisional and requires confirmation from independent field data. This study illustrates a low-cost exploratory workflow that may support preliminary monitoring in data-scarce arid coastal settings, pending validation with denser time series and field observations.
Full article

Figure 1
Open AccessArticle
Integrating Geographic Information System and Logistic Regression for Forest Fire Susceptibility Mapping in Chom Thong District, Chiang Mai Province, Thailand
by
Ratchaphon Samphutthanont and Worawit Suppawimut
Geographies 2026, 6(3), 75; https://doi.org/10.3390/geographies6030075 - 5 Aug 2026
Abstract
Forest fires are a major environmental concern in Northern Thailand, contributing to ecosystem degradation, biodiversity loss, and seasonal air pollution. This study identified the environmental factors influencing forest fire occurrence and developed a forest fire susceptibility map using an integrated Geographic Information System
[...] Read more.
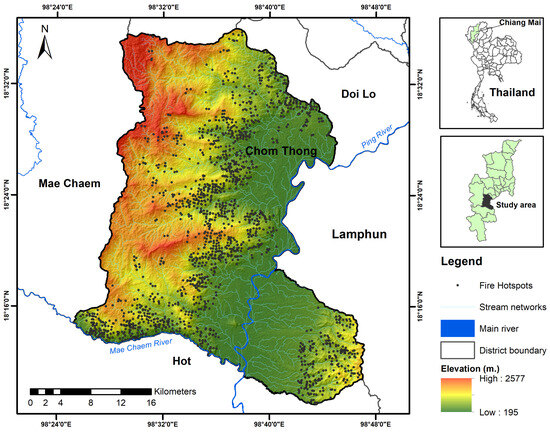
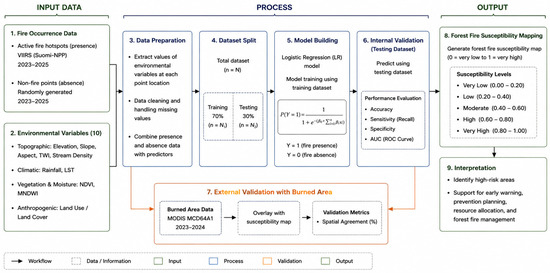
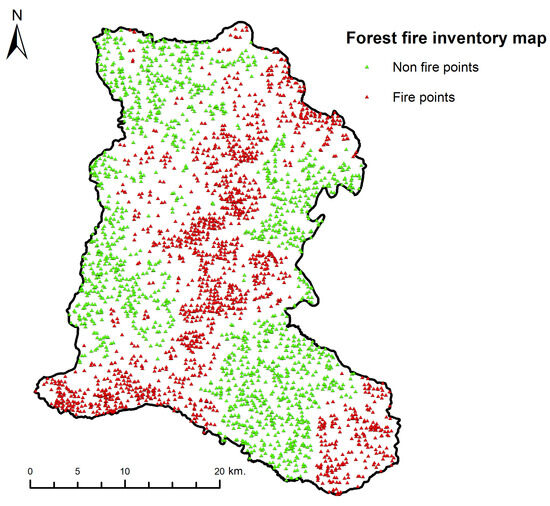
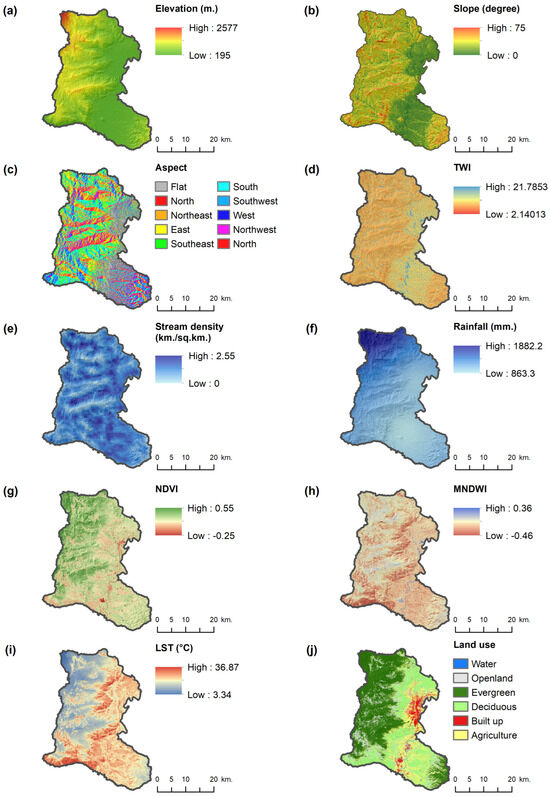
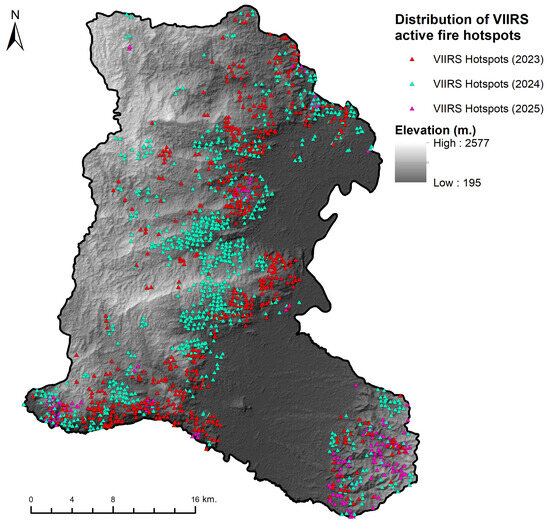
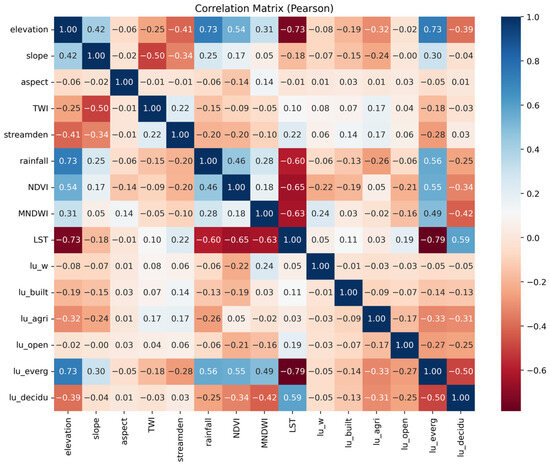
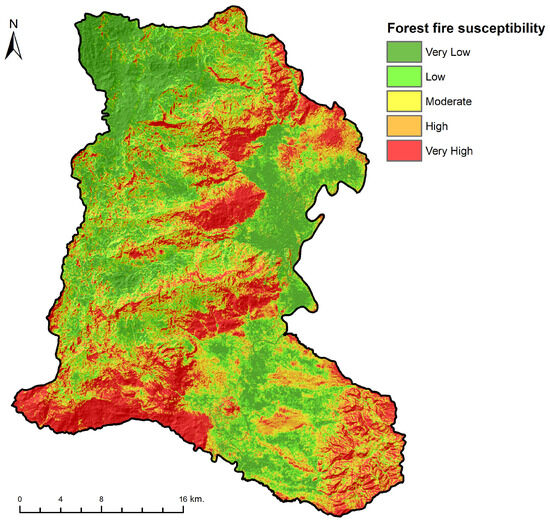
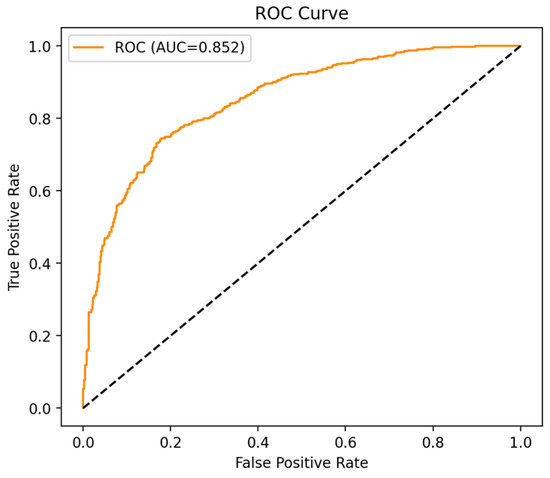
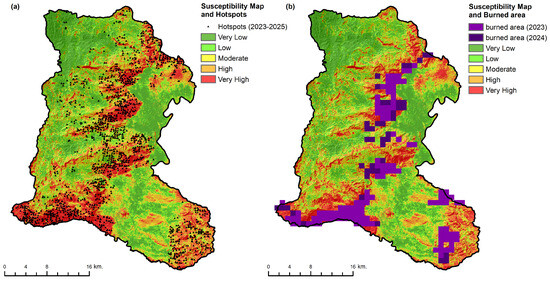
Forest fires are a major environmental concern in Northern Thailand, contributing to ecosystem degradation, biodiversity loss, and seasonal air pollution. This study identified the environmental factors influencing forest fire occurrence and developed a forest fire susceptibility map using an integrated Geographic Information System (GIS) and Logistic Regression (LR) framework in Chom Thong District, Chiang Mai Province, Thailand. Fire occurrence data were derived from Visible Infrared Imaging Radiometer Suite (VIIRS) active fire hotspots detected by the Suomi National Polar-orbiting Partnership satellite (Suomi-NPP satellite) during 2023–2025. A total of 1674 hotspots were identified (616 in 2023, 889 in 2024, and 169 in 2025). Ten environmental variables, including elevation, slope, aspect, Topographic Wetness Index (TWI), stream density, rainfall, Normalized Difference Vegetation Index (NDVI), Modified Normalized Difference Water Index (MNDWI), Land Surface Temperature (LST), and land-use, were analyzed. The LR model was trained using 2293 training samples (70%) and validated using 983 samples (30%). The results revealed that slope, rainfall, stream density, and LST were significant predictors of forest fire occurrence, with deciduous and evergreen forests exhibiting the highest susceptibility among land-use classes. The resulting forest fire susceptibility map classified 235.12 km2 (21.16%) and 204.16 km2 (18.38%) of the district as very high and high susceptibility, respectively, primarily in mountainous forest areas. The model achieved an overall accuracy of 77.5% and an Area Under the Curve (AUC) value of 0.852, indicating good predictive performance. Furthermore, the proposed Geographic Information System-Logistic Regression (GIS-LR) framework provides an interpretable and transferable approach for forest fire susceptibility assessment and generates spatial information that can support forest fire prevention, resource allocation, and environmental management in Northern Thailand and other fire-prone regions.
Full article
(This article belongs to the Special Issue Selected Papers from the 2nd International Conference on Disaster Risk Management for Strengthening Resilience and Sustainability in Communities 2026)
►▼
Show Figures

Figure 1
Open AccessArticle
Measuring Temporal Socioeconomic Resilience to Earthquakes Using the Adjusted Mazziotta–Pareto Index: Evidence from Indonesia
by
Melti Roza Adry, Akhmad Fauzi, Bambang Juanda and Andrea Emma Pravitasari
Geographies 2026, 6(3), 74; https://doi.org/10.3390/geographies6030074 - 4 Aug 2026
Abstract
►▼
Show Figures
Indonesia is one of the world’s most seismically active countries, experiencing frequent earthquakes that make assessing regional resilience essential for disaster risk reduction. This study dynamically evaluates socioeconomic resilience in 28 regencies/municipalities affected by destructive earthquakes between 2016 and 2022. Resilience was quantified
[...] Read more.
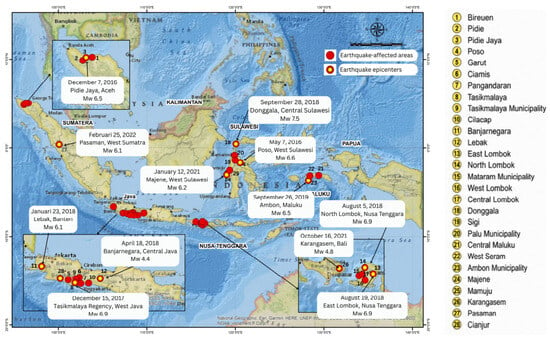
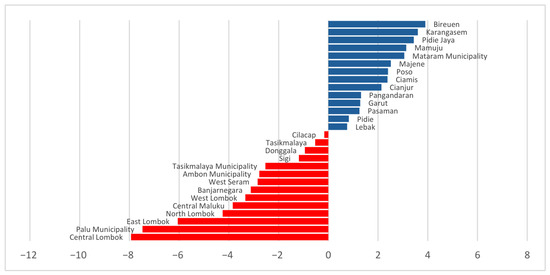
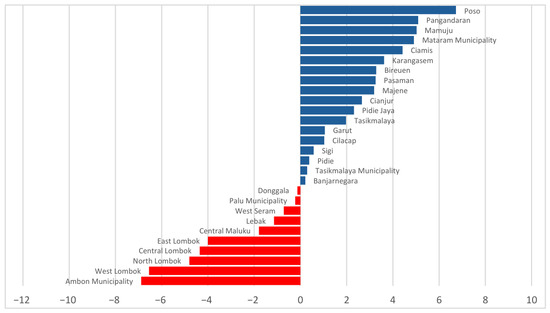
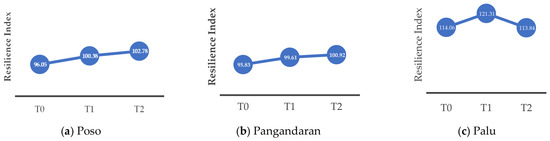
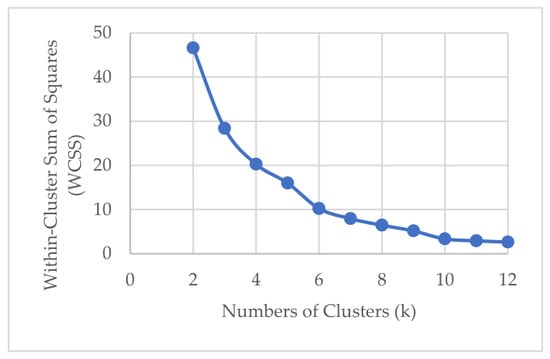
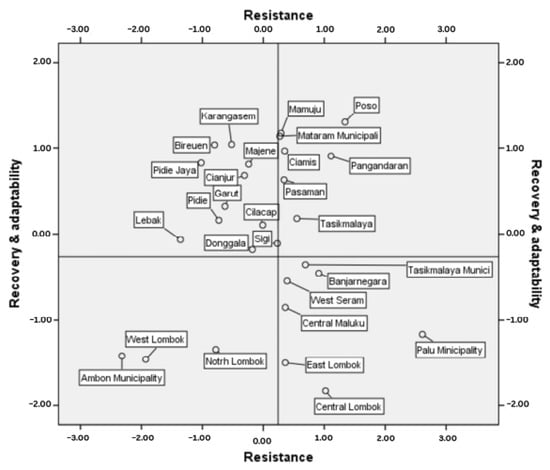
Indonesia is one of the world’s most seismically active countries, experiencing frequent earthquakes that make assessing regional resilience essential for disaster risk reduction. This study dynamically evaluates socioeconomic resilience in 28 regencies/municipalities affected by destructive earthquakes between 2016 and 2022. Resilience was quantified using the Adjusted Mazziotta–Pareto Index (AMPI) at three periods: pre-event (T0), during the event (T1), and post-event (T2). Index changes were interpreted as resistance (Δ1 = T1 − T0), recovery (Δ2 = T2 − T1), and adaptive capacity (Δ3 = T2 − T0). Results show substantial regional differences in resilience trajectories: some areas experienced only minor declines during the earthquake, while others were heavily affected but recovered quickly. Cluster analysis revealed distinct typologies, including consistently high-resilience regions, rapid-recovery regions, and persistently vulnerable regions. These disparities are associated with variation in economic capacity, social vulnerability, labor market conditions, and access to health services. Overall, the findings highlight the value of a multidimensional, time-sensitive approach to measuring socioeconomic resilience. The study advances an AMPI-based temporal measurement framework and offers policy insights for development planning and disaster mitigation.
Full article

Figure 1
Open AccessArticle
RTK-GNSS Characterization of Raised Coastal Terrace-like Morphology Along Southern Java, Indonesia
by
Eko Yulianto, Purna Sulastya Putra, Septriono Hari Nugroho, Agus Men Riyanto, Putri Ayu Isnaini, Yumei Charmenia and Edi Hidayat
Geographies 2026, 6(3), 73; https://doi.org/10.3390/geographies6030073 - 4 Aug 2026
Abstract
►▼
Show Figures
The southern coast of Java, Indonesia, is situated along the active Sunda subduction margin where raised coastal landforms may record the combined influence of relative sea-level change, wave processes, sedimentation, and vertical land motion. This study presents field-based RTK-GNSS topographic profiles from four
[...] Read more.
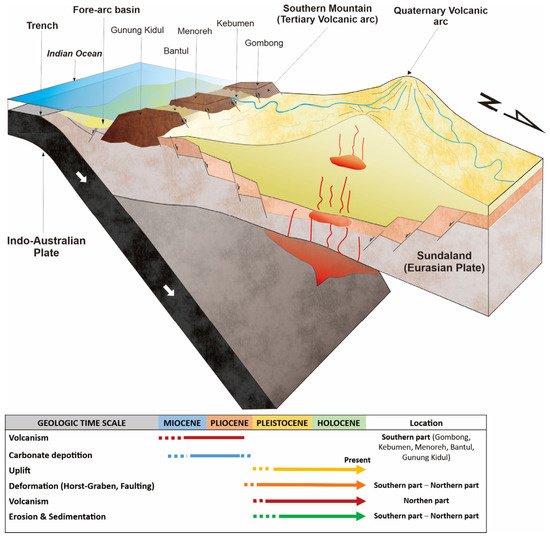
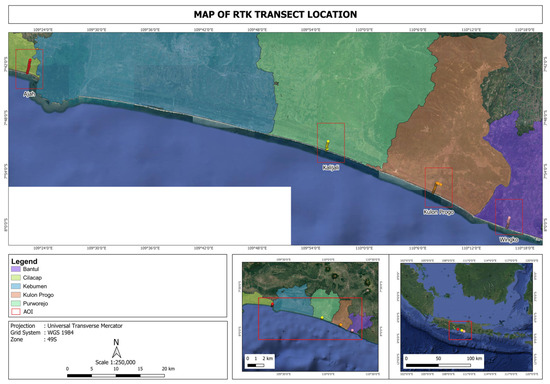
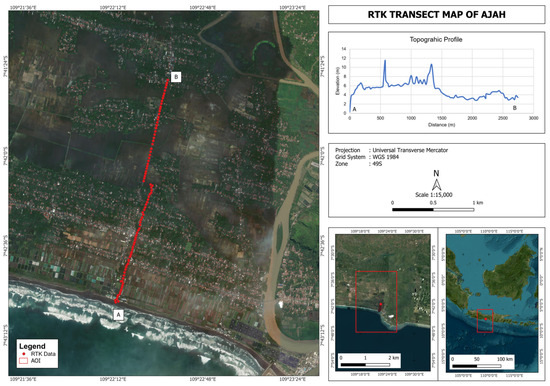
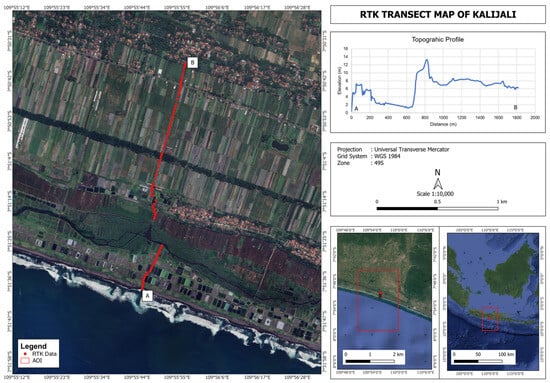
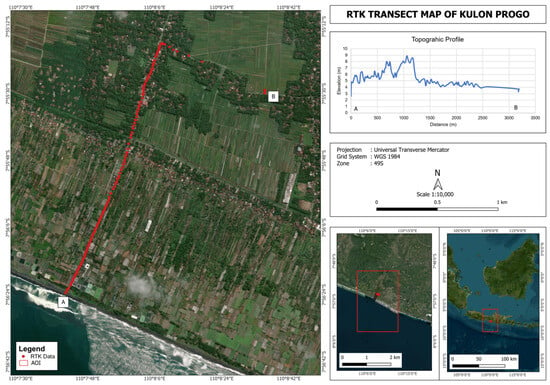
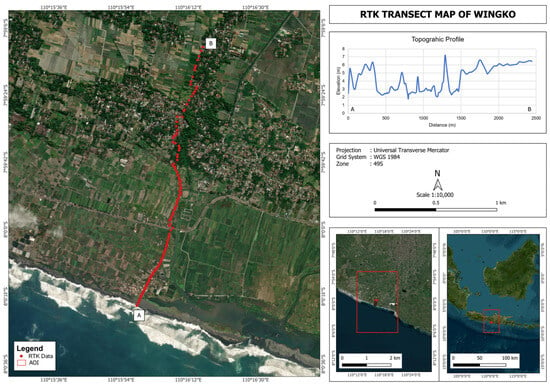
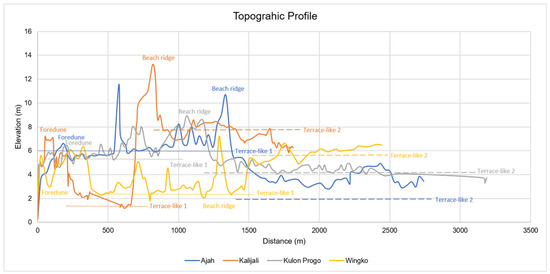
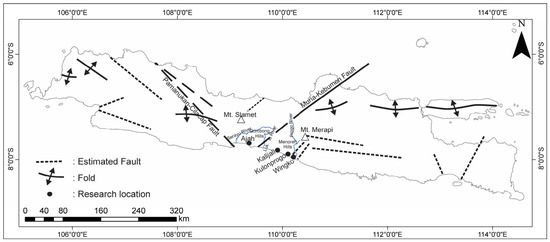
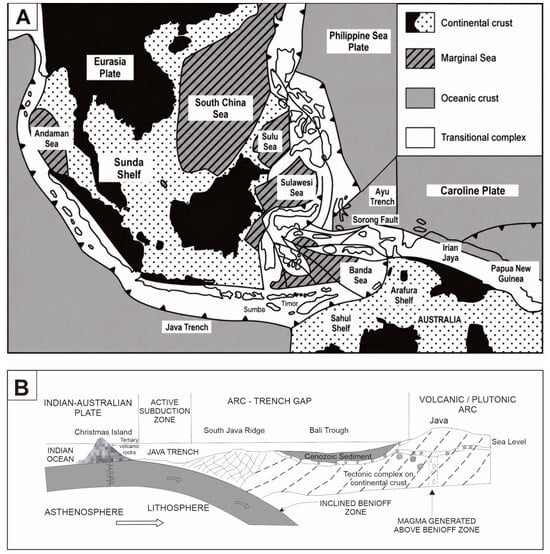
The southern coast of Java, Indonesia, is situated along the active Sunda subduction margin where raised coastal landforms may record the combined influence of relative sea-level change, wave processes, sedimentation, and vertical land motion. This study presents field-based RTK-GNSS topographic profiles from four coastal sites: Pantai Ajah, Kalijali, Kulon Progo, and Wingko. Profiles were used to locate terrace treads, risers, slope breaks, residual topographic highs, and possible raised coastal surfaces. The results show spatially varying coastal morphology. Pantai Ajah has a marked riser and probable terrace tread at about 7–8.5 m elevation. Kalijali shows a lower terrace-like surface at about 4–5 m, an upper surface at about 7–9 m, and a higher local topographic high at about 12–13 m. Kulon Progo is characterized by a low-elevation coastal surface that is only weakly expressed in the topography, whereas Wingko contains a distinct slope break and a broad landward surface at approximately 5–6.5 m elevation. Across the four profiles, broad low-gradient surfaces recur within two elevation ranges, approximately 4–6.5 m and 7–9 m. These ranges are treated as provisional morphometric groupings rather than correlated or coeval terrace levels. Higher isolated elevations are described as ridge-like or residual topographic highs whose origin and age remain unresolved. No direct chronological or sedimentological constraints are currently available, so correlations with Holocene or older sea-level highstands are only tentative. The results show the usefulness of RTK-GNSS profiling for the documentation of local coastal terrace morphology and for the identification of priority sites for future dating, sedimentological analysis, and coastal-hazard assessment.
Full article

Figure 1
Open AccessArticle
Asymmetric Seasonal Warming and Land Cover Change in a Tropical Coastal City: Multi-Temporal Evidence from Chattogram, Bangladesh
by
Shaikh Mahfuz Alam, Md Obidul Haque, Jayedi Aman, Shrabone Das Boishakhe and Muhammad Moniruzzaman
Geographies 2026, 6(3), 72; https://doi.org/10.3390/geographies6030072 - 3 Aug 2026
Abstract
►▼
Show Figures
Rapid urbanization is reshaping land surface conditions and local thermal environments in fast-growing coastal cities. This study examines how Land Use Land Cover (LULC) transformation influenced seasonal land surface temperature (LST) dynamics in Chattogram City Corporation (CCC), Bangladesh, over 2004–2024. Multi-temporal Landsat imagery
[...] Read more.
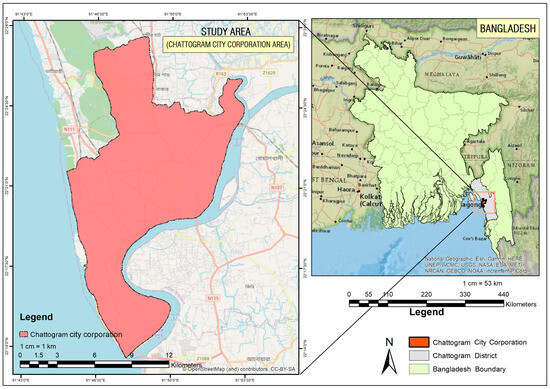
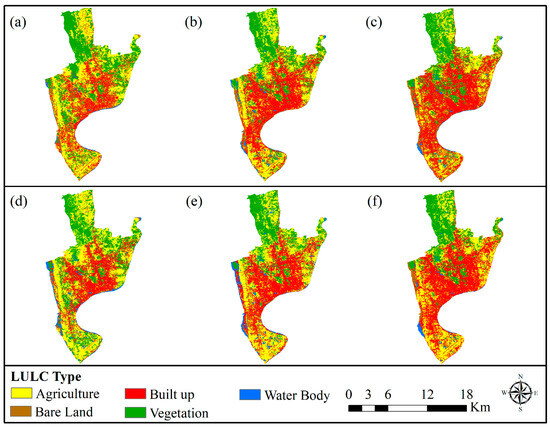
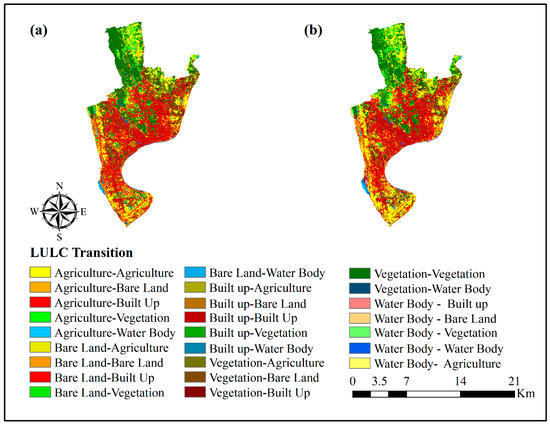
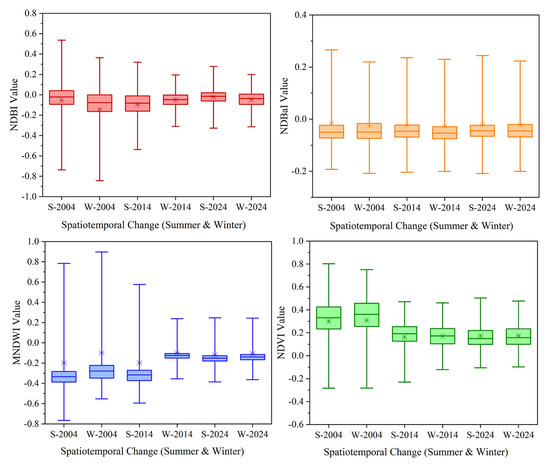
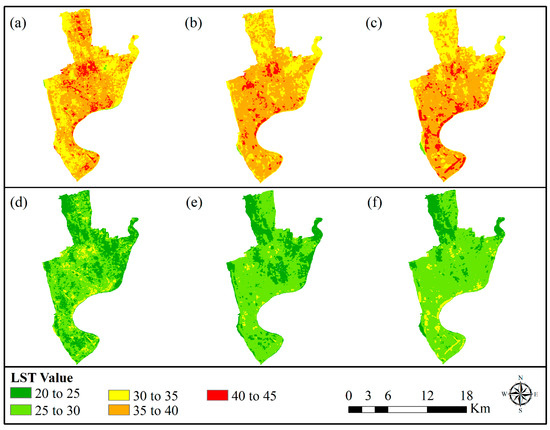
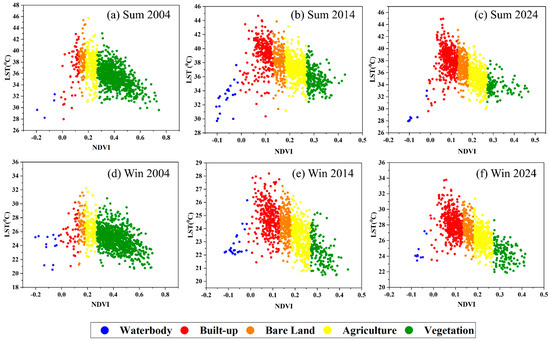
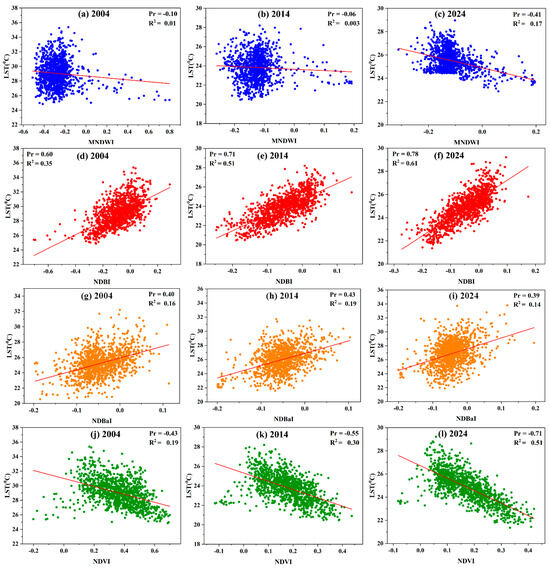
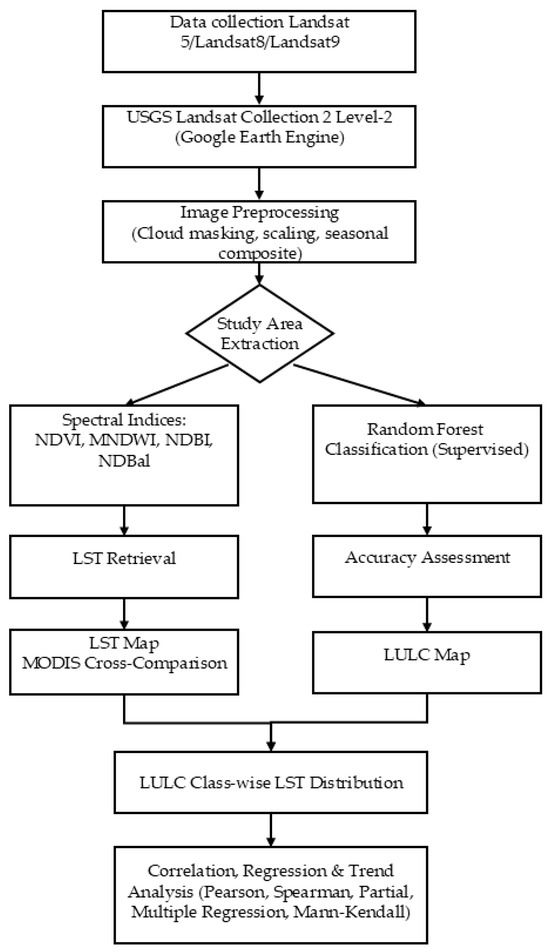
Rapid urbanization is reshaping land surface conditions and local thermal environments in fast-growing coastal cities. This study examines how Land Use Land Cover (LULC) transformation influenced seasonal land surface temperature (LST) dynamics in Chattogram City Corporation (CCC), Bangladesh, over 2004–2024. Multi-temporal Landsat imagery was analyzed using a Random Forest classifier, and spectral indices (NDVI, NDBI, NDBaI, MNDWI) were derived to characterize surface biophysical conditions. Built-up land expanded by 27.71 km2, largely replacing agricultural and vegetated areas. Summer mean LST rose from 36.08 °C to 36.50 °C, while winter LST rose from 25.25 °C to 26.97 °C. Only the winter warming trend is statistically significant; the summer change falls within the ±1–2 °C retrieval uncertainty of Landsat-derived LST. The summer–winter thermal gap consequently narrowed from 10.83 °C to 9.53 °C, indicating that urbanization-driven warming in this tropical coastal city is disproportionately concentrated in the cool dry season. Partial correlation and multiple regression analyses confirm that built-up intensity (NDBI) is the dominant driver of surface warming, while vegetation (NDVI) exerts a consistent cooling influence. Water bodies showed contrasting seasonal trends, with winter extent declining alongside a slight summer increase. These findings highlight the critical role of vegetation and water bodies in moderating urban heat and provide data-driven insights for climate-responsive planning in rapidly urbanizing coastal cities.
Full article

Figure 1
Open AccessArticle
Warming Trends and Changing Precipitation Extremes in the Eastern Greater Himalaya: A Spatio-Temporal Analysis (1981–2025)
by
Karishma Sarma, Ujjal Deka Baruah and Anoop Kumar Shukla
Geographies 2026, 6(3), 71; https://doi.org/10.3390/geographies6030071 - 28 Jul 2026
Abstract
►▼
Show Figures
Rainfall variability plays a significant role in modulating both aquatic and socioeconomic systems in the Eastern Himalayas. Among the longitudinal ranges of the Himalayas, the Greater Himalaya is considered the most vulnerable due to its high climatic sensitivity and steep topography. Given this
[...] Read more.
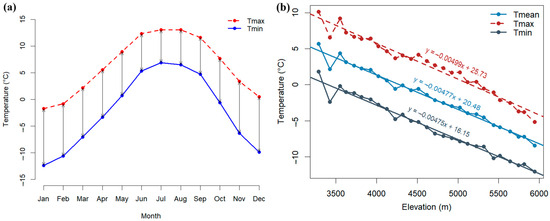
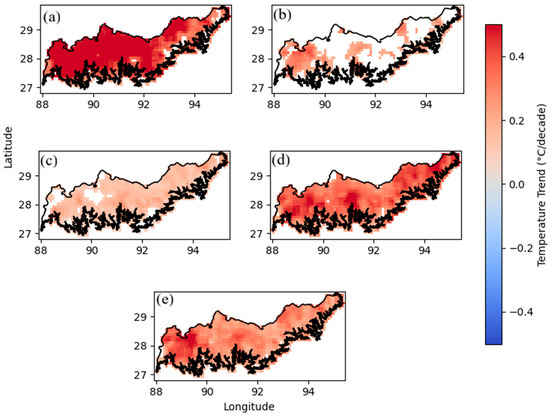
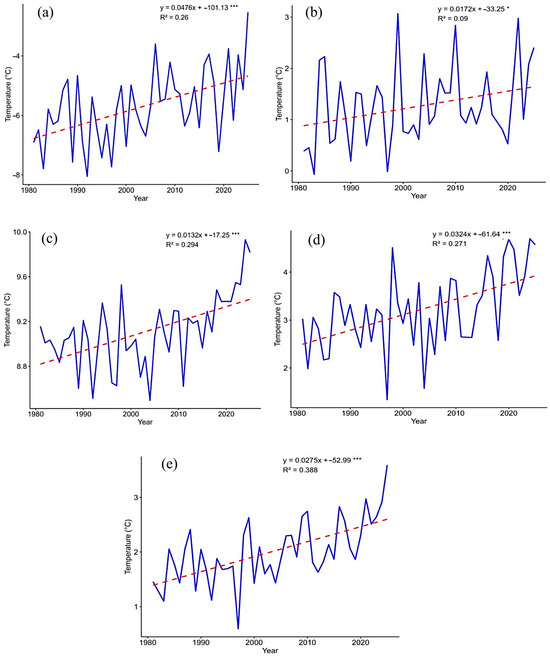
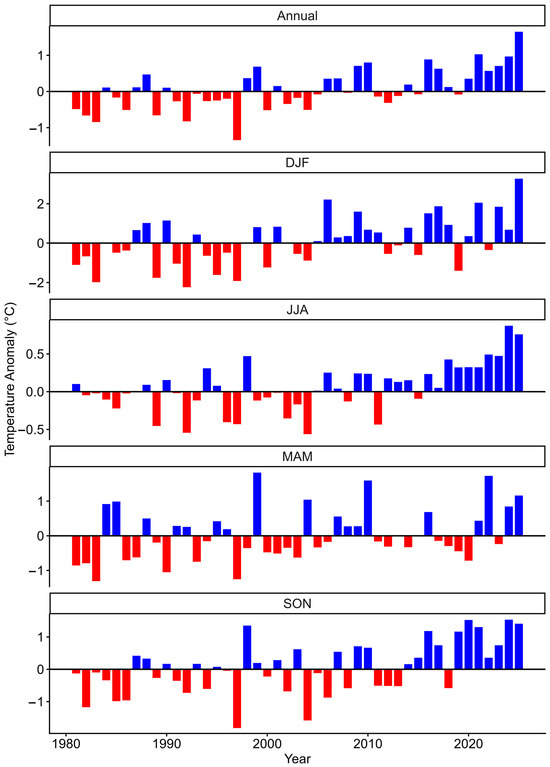
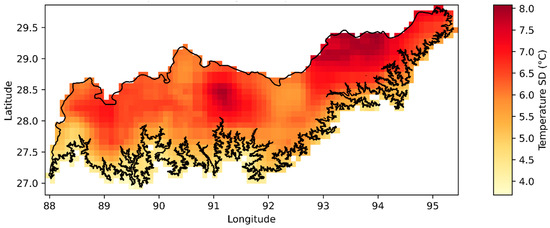
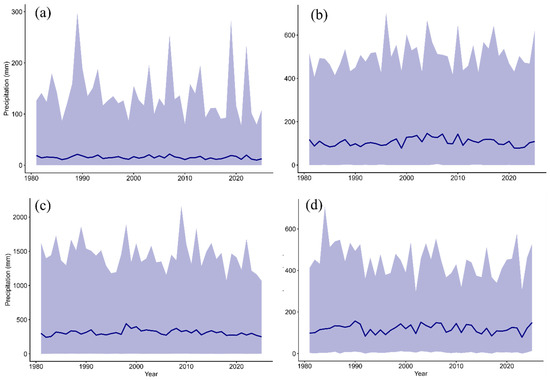
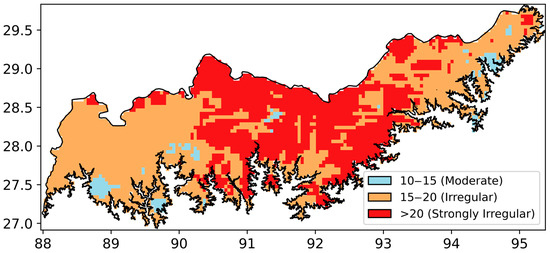
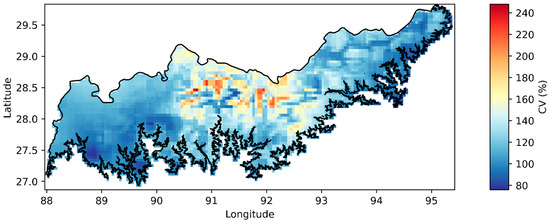
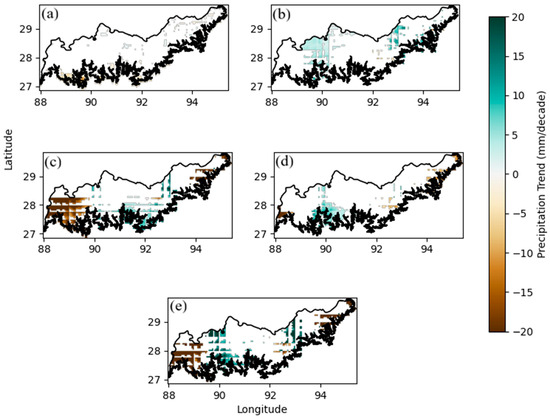
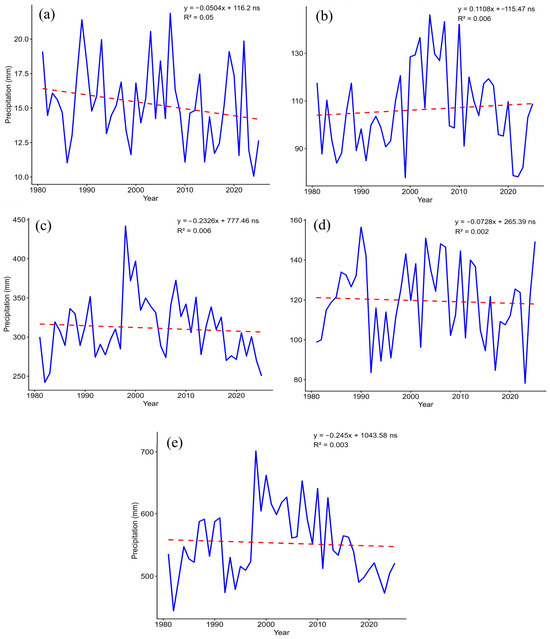
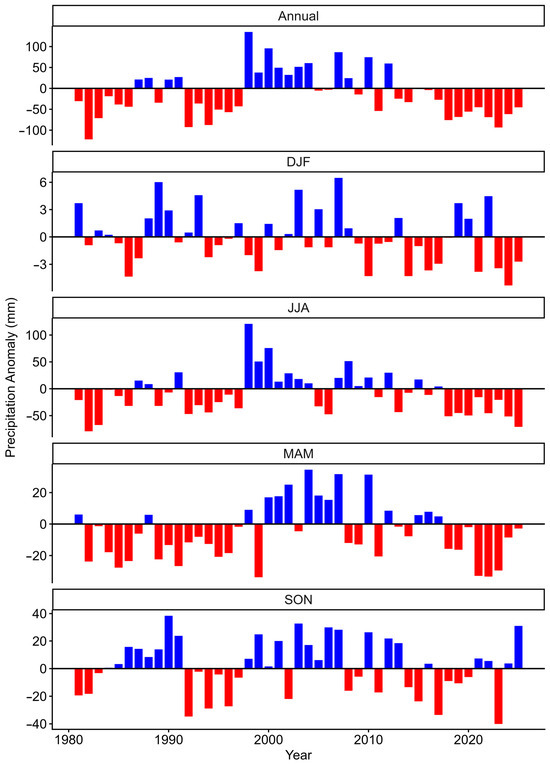
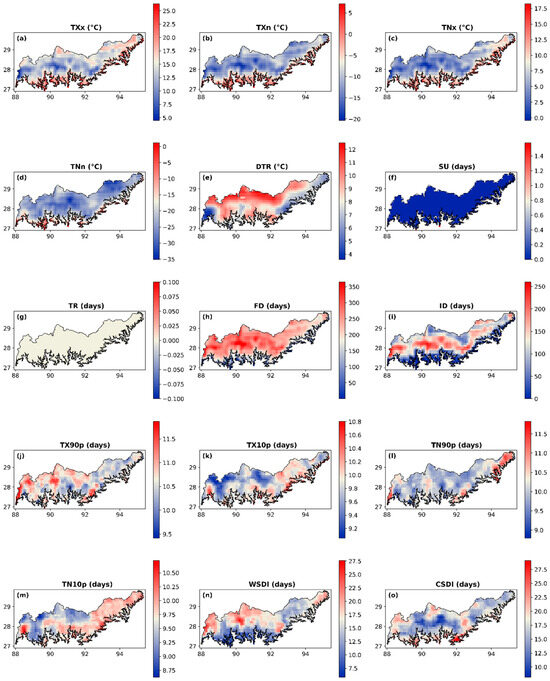
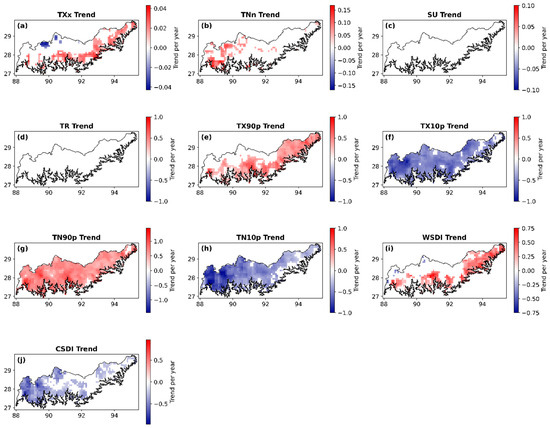
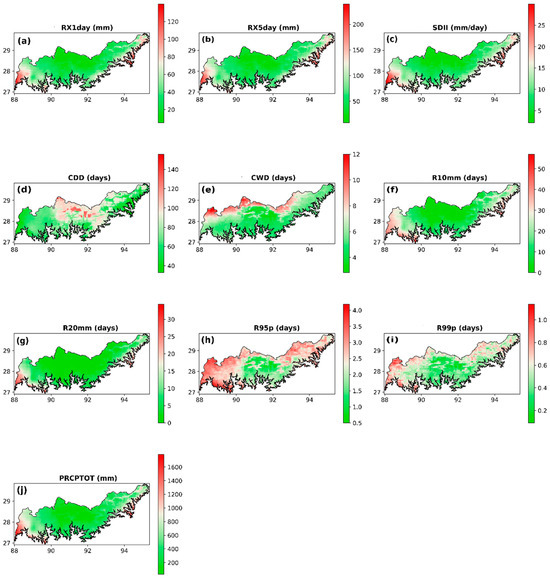
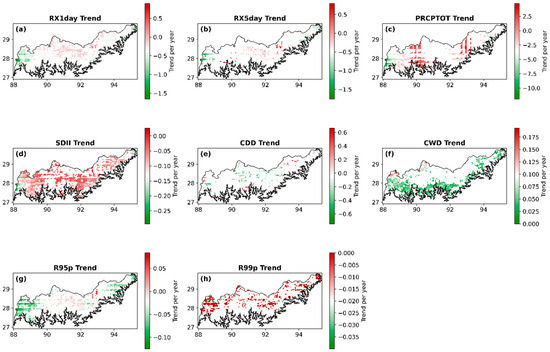
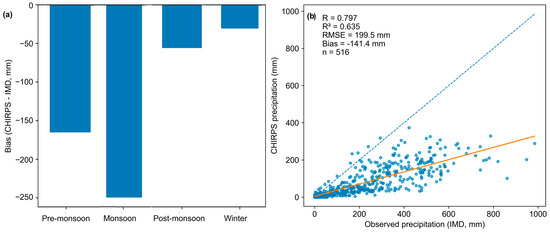
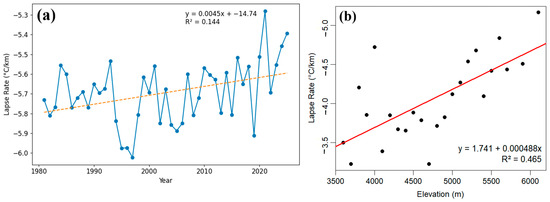
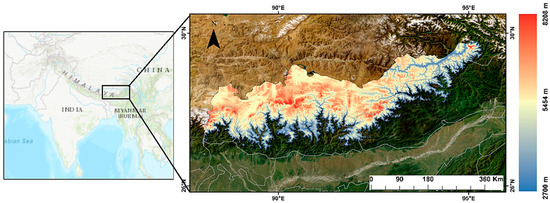
Rainfall variability plays a significant role in modulating both aquatic and socioeconomic systems in the Eastern Himalayas. Among the longitudinal ranges of the Himalayas, the Greater Himalaya is considered the most vulnerable due to its high climatic sensitivity and steep topography. Given this importance, the present study investigates the spatial patterns of temperature and precipitation, their trends, and the occurrence of extreme events over Eastern Greater Himalaya (EGH) during 1981–2025. High-resolution gridded datasets for temperature (0.1° × 0.1°) from ERA5-Land and precipitation (0.05° × 0.05°) from CHIRPS are used. The significance and magnitude of trends are quantified using the Mann–Kendall test and Sen’s slope, respectively. The temperature in EGH is increasing at ~0.27 °C per decade, with the most pronounced increase during winter (>0.4–0.5 °C per decade). Temperature extremes show a clear shift toward warmer conditions, with an increasing frequency of warm days and nights (TX90p: ~0.29; TN90p: ~0.64), along with rising intensity (TXx: ~0.007 °C/year; TNn: ~0.04 °C/year) and a decline in cold extremes. Precipitation exhibits high spatial variability (<500 mm to >2000 mm) but weak and statistically not significant long-term trends. The monsoon contributes the highest precipitation (~1200–2000 mm), with a shift toward drier conditions after 2010–2015. Extreme precipitation indices show declining trends in daily maximum (RX1day: ~5–140 mm), maximum 5-day (RX5day: ~8.4–240 mm), total (PRCPTOT: ~−0.23 mm/year) and intensity of (SDII: ~−0.041 mm/day) precipitation. This research indicates a significant climate shift in EGH with rapid warming along with uncertain precipitation patterns, which may have implications for water resources, aquatic systems, and dependent communities.
Full article

Figure 1
Highly Accessed Articles
Latest Books
E-Mail Alert
News
1 September 2026
MDPI INSIGHTS: The CEO’s Letter #38 – 2 Million Published Articles, Outstanding Reviewers, Michele Parrinello Award, AIS 2026 & WSF-12
31 August 2026
Meet Us at the 3D GeoInfo | SDSC | LADM & 3D LA 2026, 28 September–2 October 2026, Sofia, Bulgaria
Topics
Topic in
Geographies, Geomatics, IJGI, Land, Urban Science, Sustainability
Spatial Decision Support Systems for Urban Sustainability
Topic Editors: Shivanand Balram, Raja Sengupta, Jorge RochaDeadline: 16 October 2026
Topic in
Earth, Land, RSEE, Smart Cities, Economies, World, Geographies
Australasian Cities at the Crossroads: Navigating Legacy, Innovation & Sustainability
Topic Editors: Mirko Guaralda, Alessio Russo, Sara Alidoust, Sébastien DarchenDeadline: 31 December 2026
Topic in
Land, IJGI, Urban Science, Geographies, Geomatics, Environments
Innovative Approaches in Geospatial Analysis and Modeling of Urban Environments
Topic Editors: Shivanand Balram, Eric Vaz, Suzana DragicevicDeadline: 31 March 2027
Topic in
IJERPH, IJGI, Remote Sensing, Informatics, Geographies, Sustainability
Applications of Spatial Science and Technology in Health Research, 2nd Edition
Topic Editors: Peng Jia, Yansong BaoDeadline: 31 May 2027
Special Issues
Special Issue in
Geographies
Reimagining Cultural and Educational Spaces: Land, Learning and Sustainability in the Digital–Intelligent Age
Guest Editors: Xu Huang, Chun ChenDeadline: 30 September 2026
Special Issue in
Geographies
In Search of Lost Landforms and Landscapes
Guest Editors: Andrea Ferrando, Alessio Valente, Francesco FacciniDeadline: 30 November 2026
Special Issue in
Geographies
Feature Papers of Geographies in 2026
Guest Editors: Eliseo Clementini, Pedro CabralDeadline: 31 December 2026
Special Issue in
Geographies
Selected Papers from the 2nd International Conference on Disaster Risk Management for Strengthening Resilience and Sustainability in Communities 2026
Guest Editors: Jompob Waewsak, Praneed SongwathanaDeadline: 31 December 2026