Remote Sens. 2021, 13(4), 681; https://doi.org/10.3390/rs13040681 - 13 Feb 2021
Cited by 21 | Viewed by 4649
Abstract
Agricultural land abandonment is an increasing problem in Europe. The Comunitat Valenciana Region (Spain) is one of the most important citrus producers in Europe suffering this problem. This region characterizes by small sized citrus plots and high spatial fragmentation which makes necessary to
[...] Read more.
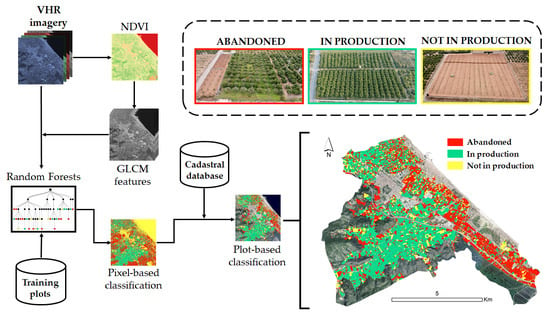
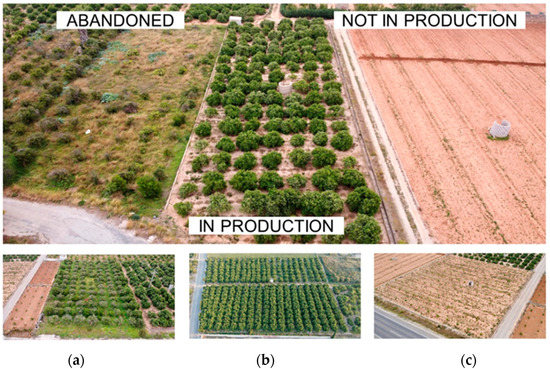
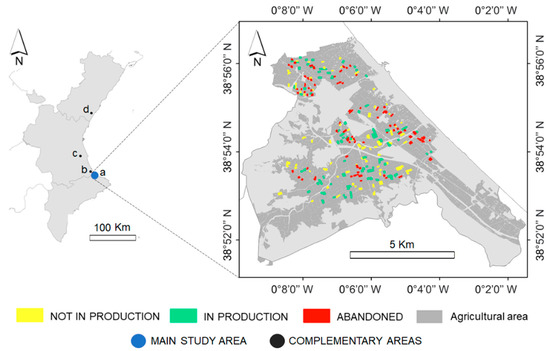
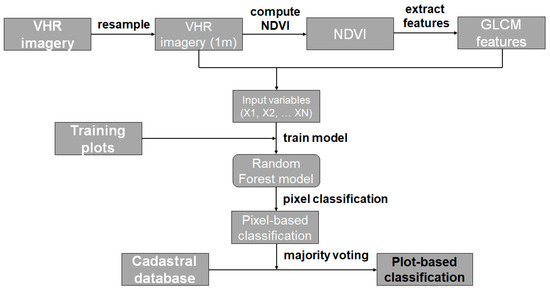
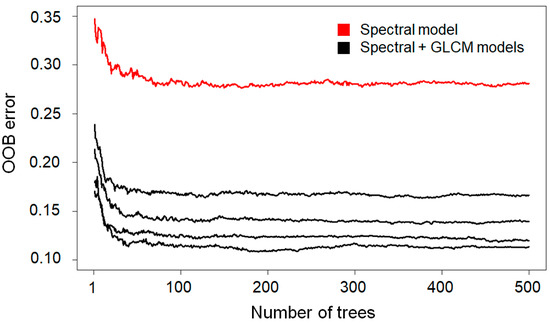
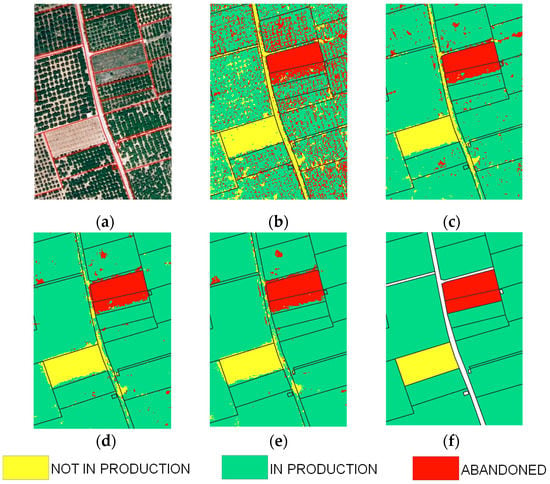
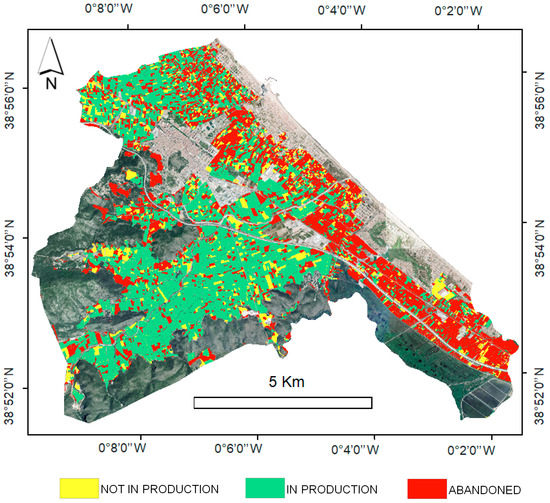
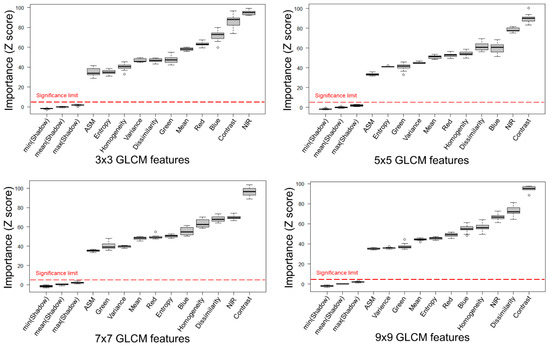
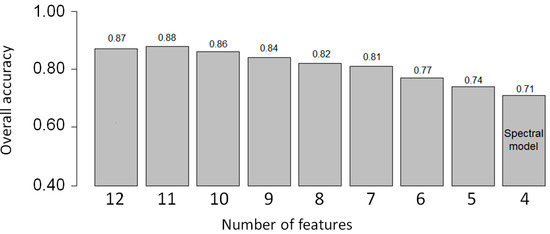
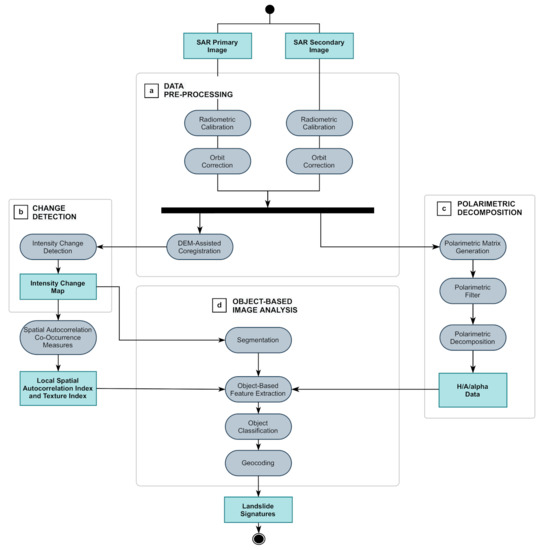
Agricultural land abandonment is an increasing problem in Europe. The Comunitat Valenciana Region (Spain) is one of the most important citrus producers in Europe suffering this problem. This region characterizes by small sized citrus plots and high spatial fragmentation which makes necessary to use Very High-Resolution images to detect abandoned plots. In this paper spectral and Gray Level Co-Occurrence Matrix (GLCM)-based textural information derived from the Normalized Difference Vegetation Index (NDVI) are used to map abandoned citrus plots in Oliva municipality (eastern Spain). The proposed methodology is based on three general steps: (a) extraction of spectral and textural features from the image, (b) pixel-based classification of the image using the Random Forest algorithm, and (c) assignment of a single value per plot by majority voting. The best results were obtained when extracting the texture features with a 9 × 9 window size and the Random Forest model showed convergence around 100 decision trees. Cross-validation of the model showed an overall accuracy of the pixel-based classification of 87% and an overall accuracy of the plot-based classification of 95%. All the variables used are statistically significant for the classification, however the most important were contrast, dissimilarity, NIR band (720 nm), and blue band (620 nm). According to our results, 31% of the plots classified as citrus in Oliva by current methodology are abandoned. This is very important to avoid overestimating crop yield calculations by public administrations. The model was applied successfully outside the main study area (Oliva municipality); with a slightly lower accuracy (92%). This research provides a new approach to map small agricultural plots, especially to detect land abandonment in woody evergreen crops that have been little studied until now.
Full article
(This article belongs to the Special Issue Urban Landscapes and Global Environmental Challenges: Monitoring and Modelling Using Remote Sensing)
►
Show Figures
Graphical abstract


