Remote Sens. 2021, 13(2), 180; https://doi.org/10.3390/rs13020180 - 7 Jan 2021
Cited by 31 | Viewed by 4028
Abstract
The degradation of the frozen soil in the Qinghai–Tibetan Plateau (QTP) caused by climate warming has attracted extensive worldwide attention due to its significant effects on the ecosystem and hydrological processes. In this study, we propose an effective approach to estimate the spatial
[...] Read more.
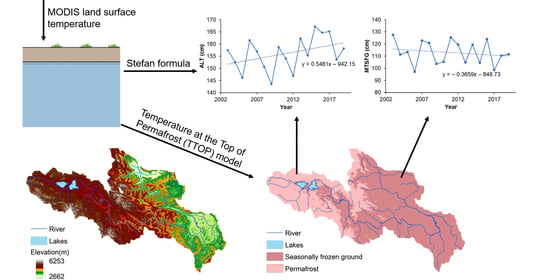
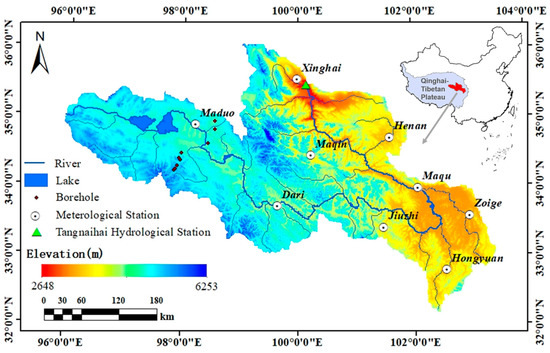
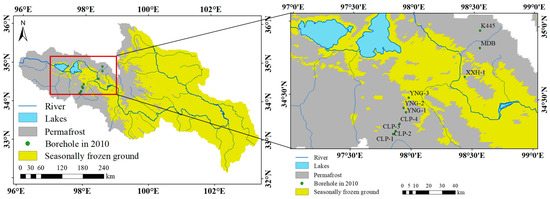
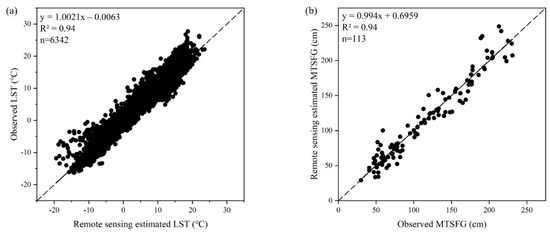
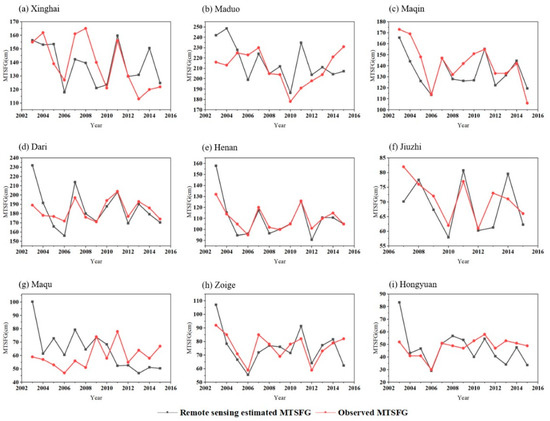
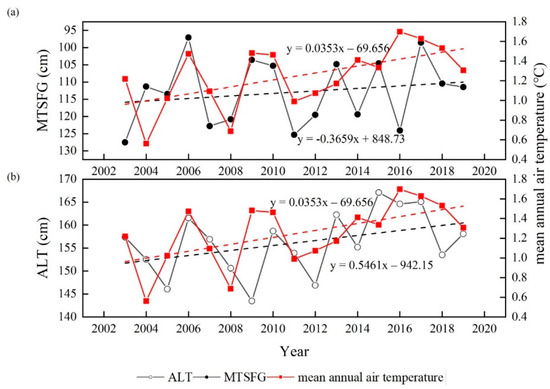
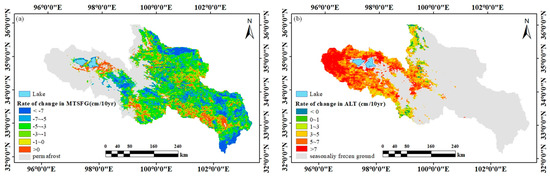
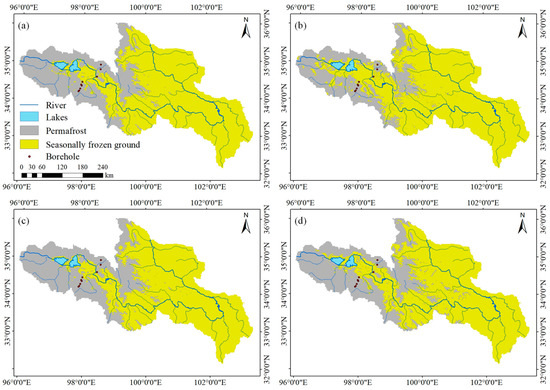
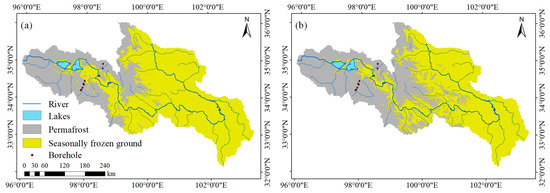
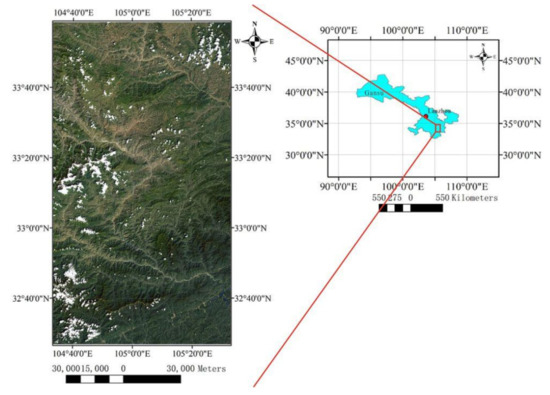
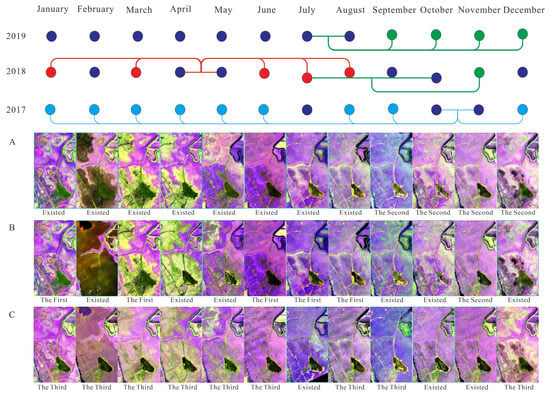
The degradation of the frozen soil in the Qinghai–Tibetan Plateau (QTP) caused by climate warming has attracted extensive worldwide attention due to its significant effects on the ecosystem and hydrological processes. In this study, we propose an effective approach to estimate the spatial distribution and changes in the frozen soil using the moderate-resolution imaging spectroradiometer (MODIS) land surface temperature products as inputs. A comparison with in-situ observations suggests that this method can accurately estimate the mean daily land surface temperature, the spatial distribution of the permafrost, and the maximum thickness of the seasonally-frozen ground in the source region of the Yellow River, located in the northeastern area of the QTP. The results of The Temperature at the Top of the Permafrost model indicates that the area of permafrost in the source region of the Yellow River decreased by 4.82% in the period from 2003 to 2019, with an increase in the areal mean air temperature of 0.35 °C/10 years. A high spatial heterogeneity in the frozen soil changes was revealed. The basin-averaged active layer thickness of the permafrost increased at a rate of 5.46 cm/10 years, and the basin-averaged maximum thickness of the seasonally-frozen ground decreased at a rate of 3.66 cm/10 years. The uncertainties in calculating the mean daily land surface temperature and the soil’s thermal conductivity were likely to influence the accuracy of the estimation of the spatial distribution of the permafrost and the maximum thickness of the seasonally-frozen ground, which highlight the importance of the better integration of field observations and multi-source remote sensing data in order to improve the modelling of frozen soil in the future. Overall, the approach proposed in this study may contribute to the improvement of the application of the MODIS land surface temperature data in the study of frozen soil changes in large catchments with limited in-situ observations in the QTP.
Full article
(This article belongs to the Special Issue Remote Sensing Applications for Hydrogeography and Climatology)
►
Show Figures
Graphical abstract


