Remote Sens. 2021, 13(24), 5063; https://doi.org/10.3390/rs13245063 - 14 Dec 2021
Cited by 12 | Viewed by 3920
Abstract
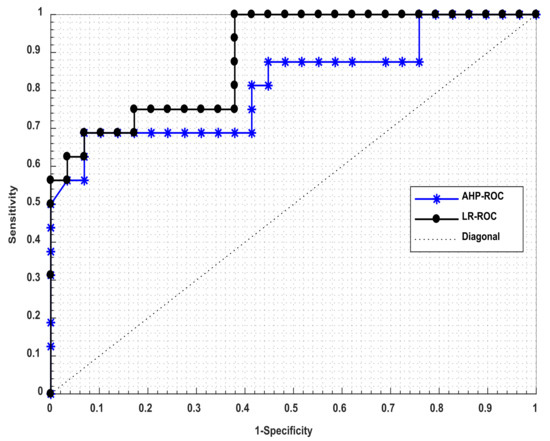
The current study presents a detailed assessment of risk zones related to karst collapse in Wuhan by analytical hierarchy process (AHP) and logistic regression (LR) models. The results showed that the LR model was more accurate with an area under the receiver operating
[...] Read more.
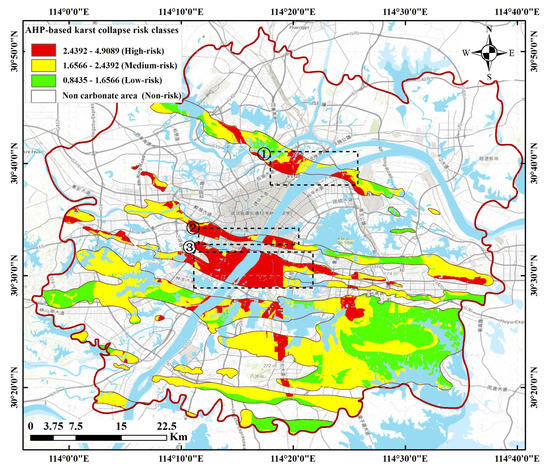
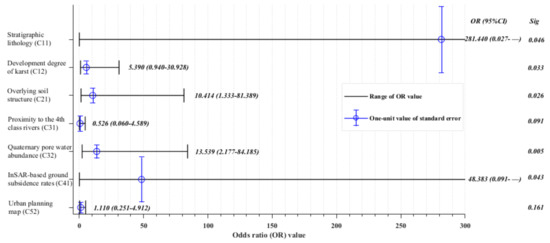
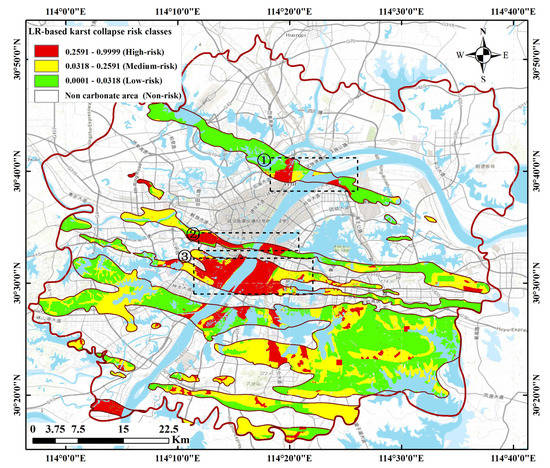
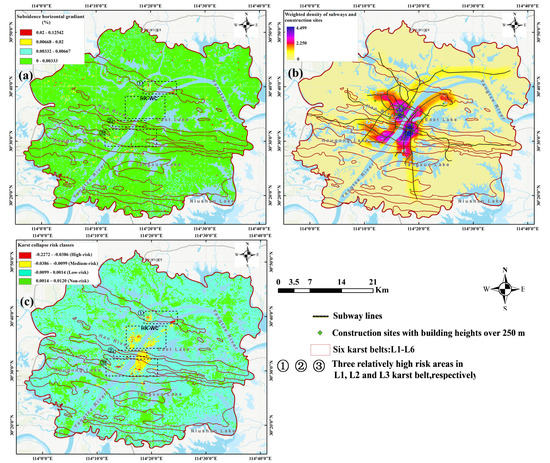
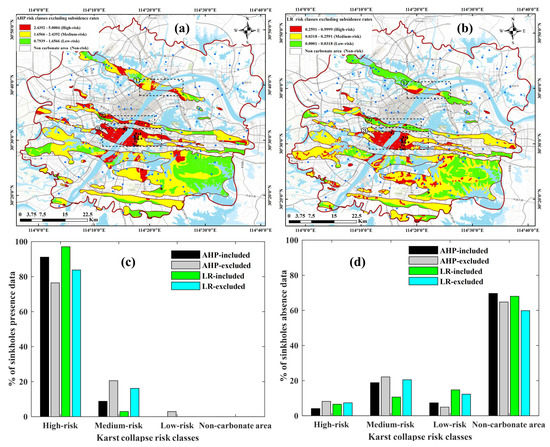
The current study presents a detailed assessment of risk zones related to karst collapse in Wuhan by analytical hierarchy process (AHP) and logistic regression (LR) models. The results showed that the LR model was more accurate with an area under the receiver operating characteristic (ROC) curve of 0.911 compared to 0.812 derived from the AHP model. Both models performed well in identifying high-risk zones with only a 3% discrepancy in area. However, for the medium- and low-risk classes, although the spatial distribution of risk zoning results were similar between two approaches, the spatial extent of the risk areas varied between final models. The reliability of both methods were reduced significantly by excluding the InSAR-based ground subsidence map from the analysis, with the karst collapse presence falling into the high-risk zone being reduced by approximately 14%, and karst collapse absence falling into the karst area being increased by approximately 6.5% on the training samples. To evaluate the practicality of using only results from ground subsidence maps for the risk zonation, the results of AHP and LR are compared with a weighted angular distortion (WAD) method for karst risk zoning in Wuhan. We find that the areas with relatively large subsidence horizontal gradient values within the karst belts are generally spatially consistent with high-risk class areas identified by the AHP- and LR-based approaches. However, the WAD-based approach cannot be used alone as an ideal karst collapse risk assessment model as it does not include geological and natural factors into the risk zonation.
Full article
(This article belongs to the Topic High-Resolution Earth Observation Systems, Technologies, and Applications)
►
Show Figures
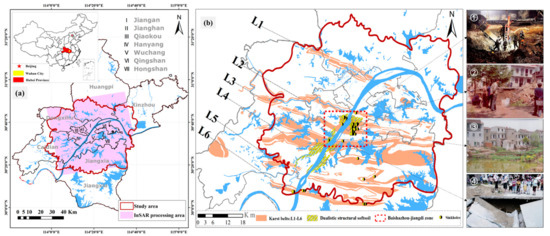
Figure 1


