Remote Sens. 2021, 13(20), 4100; https://doi.org/10.3390/rs13204100 - 13 Oct 2021
Cited by 36 | Viewed by 8413
Abstract
The Copernicus Sentinel-2 mission operated by the European Space Agency (ESA) provides comprehensive and continuous multi-spectral observations of all the Earth’s land surface since mid-2015. Clouds and cloud shadows significantly decrease the usability of optical satellite data, especially in agricultural applications; therefore, an
[...] Read more.
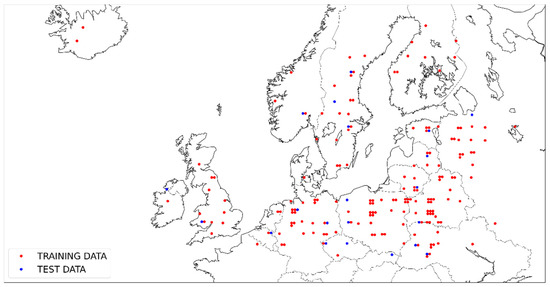
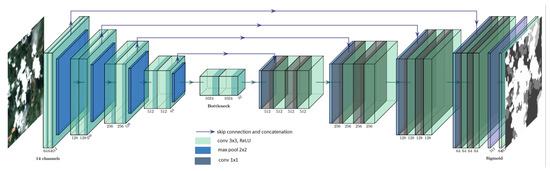
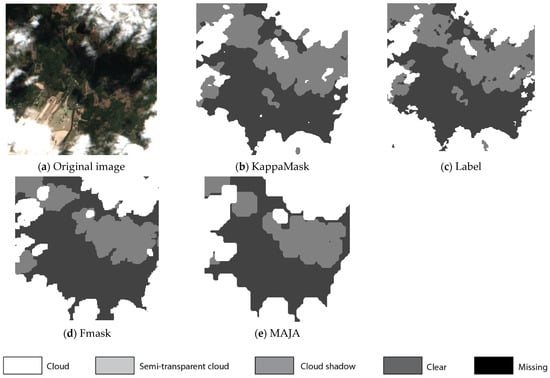
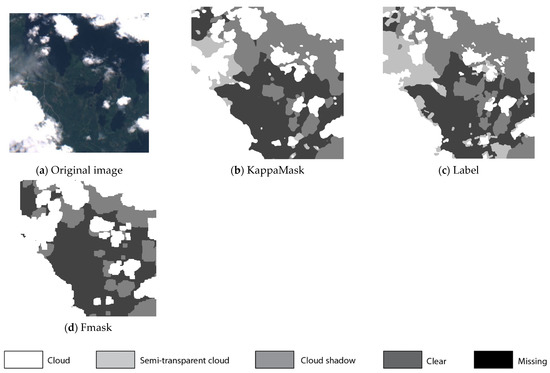
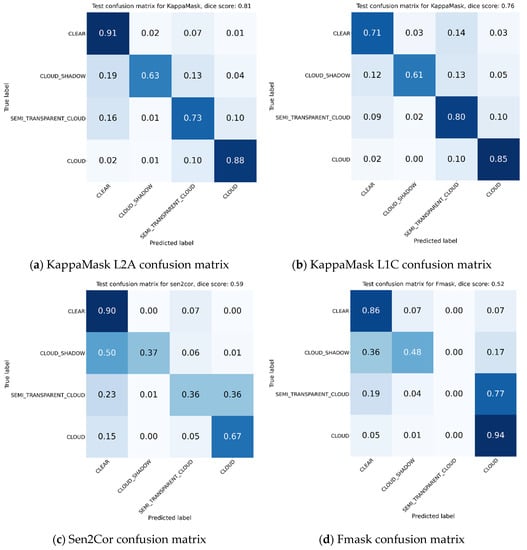
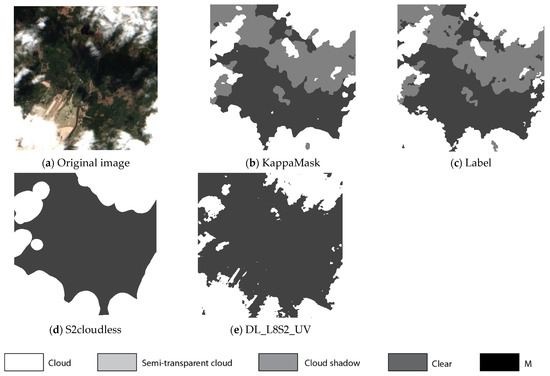
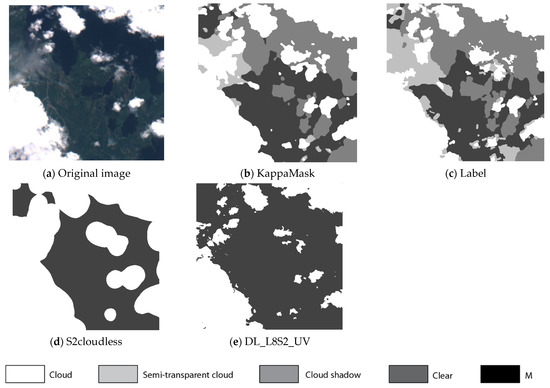
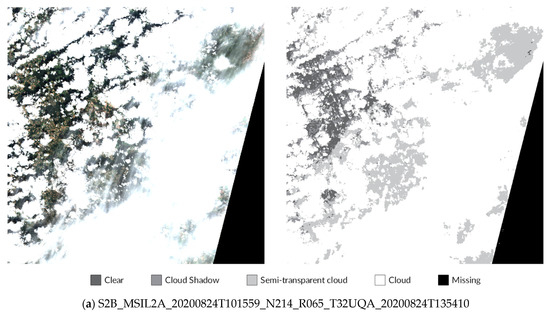
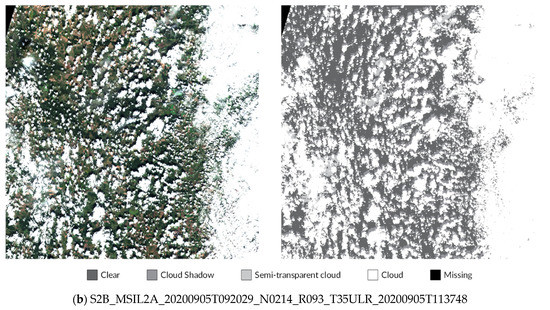
The Copernicus Sentinel-2 mission operated by the European Space Agency (ESA) provides comprehensive and continuous multi-spectral observations of all the Earth’s land surface since mid-2015. Clouds and cloud shadows significantly decrease the usability of optical satellite data, especially in agricultural applications; therefore, an accurate and reliable cloud mask is mandatory for effective EO optical data exploitation. During the last few years, image segmentation techniques have developed rapidly with the exploitation of neural network capabilities. With this perspective, the KappaMask processor using U-Net architecture was developed with the ability to generate a classification mask over northern latitudes into the following classes: clear, cloud shadow, semi-transparent cloud (thin clouds), cloud and invalid. For training, a Sentinel-2 dataset covering the Northern European terrestrial area was labelled. KappaMask provides a 10 m classification mask for Sentinel-2 Level-2A (L2A) and Level-1C (L1C) products. The total dice coefficient on the test dataset, which was not seen by the model at any stage, was 80% for KappaMask L2A and 76% for KappaMask L1C for clear, cloud shadow, semi-transparent and cloud classes. A comparison with rule-based cloud mask methods was then performed on the same test dataset, where Sen2Cor reached 59% dice coefficient for clear, cloud shadow, semi-transparent and cloud classes, Fmask reached 61% for clear, cloud shadow and cloud classes and Maja reached 51% for clear and cloud classes. The closest machine learning open-source cloud classification mask, S2cloudless, had a 63% dice coefficient providing only cloud and clear classes, while KappaMask L2A, with a more complex classification schema, outperformed S2cloudless by 17%.
Full article
(This article belongs to the Special Issue Computer Vision and Deep Learning for Remote Sensing Applications)
►
Show Figures
Figure 1


