Next Issue
Volume 10, June
Previous Issue
Volume 10, April
 
 
remotesensing-logo

Journal Browser

Journal Browser

Remote Sens., Volume 10, Issue 5 (May 2018) – 148 articles

Cover Story (view full-size image): 
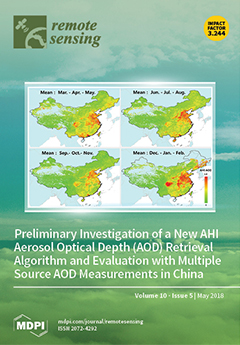
The Advanced Himawari Imager (AHI), on board the Japanese Himawari-8 geostationary weather satellite, provides an opportunity to observe the diurnal changes in aerosol properties over the Asia-Pacific region. Using the hourly observation data from AHI, a new dark target algorithm was preliminarily proposed to retrieve the aerosol optical depth (AOD) at 1 km and 5 km resolutions over mainland China. The comparison and validation results show that our AHI AOD data demonstrate good agreement with the ground-based and satellite AOD measurements (AERONET AOD, MODIS DT AOD and MODIS DB AOD), but with a slight overestimation. Generally, the preliminary AHI AOD data well reflects the spatial and temporal variation characteristics of aerosol properties in China. View Paper here.
  • Issues are regarded as officially published after their release is announced to the table of contents alert mailing list.
  • You may sign up for e-mail alerts to receive table of contents of newly released issues.
  • PDF is the official format for papers published in both, html and pdf forms. To view the papers in pdf format, click on the "PDF Full-text" link, and use the free Adobe Reader to open them.
Order results
Result details
Section
Select all
Export citation of selected articles as:
13 pages, 23574 KiB  
Technical Note
Annual New Production of Phytoplankton Estimated from MODIS-Derived Nitrate Concentration in the East/Japan Sea
by Huitae Joo, Dabin Lee, Seung Hyun Son and Sang Heon Lee
Remote Sens. 2018, 10(5), 806; https://doi.org/10.3390/rs10050806 - 22 May 2018
Cited by 6 | Viewed by 4948
Abstract
Our main objective in this study was to determine the inter-annual variation of the annual new production in the East/Japan Sea (EJS), which was estimated from MODIS-aqua satellite-derived sea surface nitrate (SSN). The new production was extracted from northern (>40° N) and southern [...] Read more.
Our main objective in this study was to determine the inter-annual variation of the annual new production in the East/Japan Sea (EJS), which was estimated from MODIS-aqua satellite-derived sea surface nitrate (SSN). The new production was extracted from northern (>40° N) and southern (>40° N) part of EJS based on Sub Polar Front (SPF). Based on the SSN concentrations derived from satellite data, we found that the annual new production (Mean ± S.D = 85.6 ± 10.1 g C m−2 year−1) in the northern part of the EJS was significantly higher (t-test, p < 0.01) than that of the southern part of the EJS (Mean ± S.D = 65.6 ± 3.9 g C m−2 year−1). Given the relationships between the new productions and sea surface temperature (SST) in this study, the new production could be more susceptible in the northern part than the southern part of the EJS under consistent SST warming. Since the new production estimated in this study is only based on the nitrate inputs into the euphotic depths during the winter, new productions from additional nitrate sources (e.g., the nitrate upward flux through the MLD and atmospheric deposition) should be considered for estimating the annual new production. Full article
(This article belongs to the Special Issue Remote Sensing of Ocean Colour)
Show Figures

Figure 1

18 pages, 5928 KiB  
Article
Estimation of Vegetable Crop Parameter by Multi-temporal UAV-Borne Images
by Thomas Moeckel, Supriya Dayananda, Rama Rao Nidamanuri, Sunil Nautiyal, Nagaraju Hanumaiah, Andreas Buerkert and Michael Wachendorf
Remote Sens. 2018, 10(5), 805; https://doi.org/10.3390/rs10050805 - 22 May 2018
Cited by 57 | Viewed by 8194
Abstract
3D point cloud analysis of imagery collected by unmanned aerial vehicles (UAV) has been shown to be a valuable tool for estimation of crop phenotypic traits, such as plant height, in several species. Spatial information about these phenotypic traits can be used to [...] Read more.
3D point cloud analysis of imagery collected by unmanned aerial vehicles (UAV) has been shown to be a valuable tool for estimation of crop phenotypic traits, such as plant height, in several species. Spatial information about these phenotypic traits can be used to derive information about other important crop characteristics, like fresh biomass yield, which could not be derived directly from the point clouds. Previous approaches have often only considered single date measurements using a single point cloud derived metric for the respective trait. Furthermore, most of the studies focused on plant species with a homogenous canopy surface. The aim of this study was to assess the applicability of UAV imagery for capturing crop height information of three vegetables (crops eggplant, tomato, and cabbage) with a complex vegetation canopy surface during a complete crop growth cycle to infer biomass. Additionally, the effect of crop development stage on the relationship between estimated crop height and field measured crop height was examined. Our study was conducted in an experimental layout at the University of Agricultural Science in Bengaluru, India. For all the crops, the crop height and the biomass was measured at five dates during one crop growth cycle between February and May 2017 (average crop height was 42.5, 35.5, and 16.0 cm for eggplant, tomato, and cabbage). Using a structure from motion approach, a 3D point cloud was created for each crop and sampling date. In total, 14 crop height metrics were extracted from the point clouds. Machine learning methods were used to create prediction models for vegetable crop height. The study demonstrates that the monitoring of crop height using an UAV during an entire growing period results in detailed and precise estimates of crop height and biomass for all three crops (R2 ranging from 0.87 to 0.97, bias ranging from −0.66 to 0.45 cm). The effect of crop development stage on the predicted crop height was found to be substantial (e.g., median deviation increased from 1% to 20% for eggplant) influencing the strength and consistency of the relationship between point cloud metrics and crop height estimates and, thus, should be further investigated. Altogether the results of the study demonstrate that point cloud generated from UAV-based RGB imagery can be used to effectively measure vegetable crop biomass in larger areas (relative error = 17.6%, 19.7%, and 15.2% for eggplant, tomato, and cabbage, respectively) with a similar accuracy as biomass prediction models based on measured crop height (relative error = 21.6, 18.8, and 15.2 for eggplant, tomato, and cabbage). Full article
Show Figures

Graphical abstract

23 pages, 2350 KiB  
Article
Performance Assessment of the COMET Cloud Fractional Cover Climatology across Meteosat Generations
by Jędrzej S. Bojanowski, Reto Stöckli, Anke Duguay-Tetzlaff, Stephan Finkensieper and Rainer Hollmann
Remote Sens. 2018, 10(5), 804; https://doi.org/10.3390/rs10050804 - 22 May 2018
Cited by 10 | Viewed by 5221
Abstract
The CM SAF Cloud Fractional Cover dataset from Meteosat First and Second Generation (COMET, https://doi.org/10.5676/EUM_SAF_CM/CFC_METEOSAT/V001) covering 1991–2015 has been recently released by the EUMETSAT Satellite Application Facility for Climate Monitoring (CM SAF). COMET is derived from the MVIRI and SEVIRI imagers aboard geostationary [...] Read more.
The CM SAF Cloud Fractional Cover dataset from Meteosat First and Second Generation (COMET, https://doi.org/10.5676/EUM_SAF_CM/CFC_METEOSAT/V001) covering 1991–2015 has been recently released by the EUMETSAT Satellite Application Facility for Climate Monitoring (CM SAF). COMET is derived from the MVIRI and SEVIRI imagers aboard geostationary Meteosat satellites and features a Cloud Fractional Cover (CFC) climatology in high temporal (1 h) and spatial (0.05° × 0.05°) resolution. The CM SAF long-term cloud fraction climatology is a unique long-term dataset that resolves the diurnal cycle of cloudiness. The cloud detection algorithm optimally exploits the limited information from only two channels (broad band visible and thermal infrared) acquired by older geostationary sensors. The underlying algorithm employs a cyclic generation of clear sky background fields, uses continuous cloud scores and runs a naïve Bayesian cloud fraction estimation using concurrent information on cloud state and variability. The algorithm depends on well-characterized infrared radiances (IR) and visible reflectances (VIS) from the Meteosat Fundamental Climate Data Record (FCDR) provided by EUMETSAT. The evaluation of both Level-2 (instantaneous) and Level-3 (daily and monthly means) cloud fractional cover (CFC) has been performed using two reference datasets: ground-based cloud observations (SYNOP) and retrievals from an active satellite instrument (CALIPSO/CALIOP). Intercomparisons have employed concurrent state-of-the-art satellite-based datasets derived from geostationary and polar orbiting passive visible and infrared imaging sensors (MODIS, CLARA-A2, CLAAS-2, PATMOS-x and CC4CL-AVHRR). Averaged over all reference SYNOP sites on the monthly time scale, COMET CFC reveals (for 0–100% CFC) a mean bias of −0.14%, a root mean square error of 7.04% and a trend in bias of −0.94% per decade. The COMET shortcomings include larger negative bias during the Northern Hemispheric winter, lower precision for high sun zenith angles and high viewing angles, as well as an inhomogeneity around 1995/1996. Yet, we conclude that the COMET CFC corresponds well to the corresponding SYNOP measurements, and it is thus useful to extend in both space and time century-long ground-based climate observations. Full article
(This article belongs to the Special Issue Assessment of Quality and Usability of Climate Data Records)
Show Figures

Graphical abstract

17 pages, 1550 KiB  
Article
Correcting Measurement Error in Satellite Aerosol Optical Depth with Machine Learning for Modeling PM2.5 in the Northeastern USA
by Allan C. Just, Margherita M. De Carli, Alexandra Shtein, Michael Dorman, Alexei Lyapustin and Itai Kloog
Remote Sens. 2018, 10(5), 803; https://doi.org/10.3390/rs10050803 - 22 May 2018
Cited by 59 | Viewed by 7943
Abstract
Satellite-derived estimates of aerosol optical depth (AOD) are key predictors in particulate air pollution models. The multi-step retrieval algorithms that estimate AOD also produce quality control variables but these have not been systematically used to address the measurement error in AOD. We compare [...] Read more.
Satellite-derived estimates of aerosol optical depth (AOD) are key predictors in particulate air pollution models. The multi-step retrieval algorithms that estimate AOD also produce quality control variables but these have not been systematically used to address the measurement error in AOD. We compare three machine-learning methods: random forests, gradient boosting, and extreme gradient boosting (XGBoost) to characterize and correct measurement error in the Multi-Angle Implementation of Atmospheric Correction (MAIAC) 1 × 1 km AOD product for Aqua and Terra satellites across the Northeastern/Mid-Atlantic USA versus collocated measures from 79 ground-based AERONET stations over 14 years. Models included 52 quality control, land use, meteorology, and spatially-derived features. Variable importance measures suggest relative azimuth, AOD uncertainty, and the AOD difference in 30–210 km moving windows are among the most important features for predicting measurement error. XGBoost outperformed the other machine-learning approaches, decreasing the root mean squared error in withheld testing data by 43% and 44% for Aqua and Terra. After correction using XGBoost, the correlation of collocated AOD and daily PM2.5 monitors across the region increased by 10 and 9 percentage points for Aqua and Terra. We demonstrate how machine learning with quality control and spatial features substantially improves satellite-derived AOD products for air pollution modeling. Full article
(This article belongs to the Special Issue Aerosol Remote Sensing)
Show Figures

Graphical abstract

13 pages, 16498 KiB  
Article
Combining TerraSAR-X and Landsat Images for Emergency Response in Urban Environments
by Shiran Havivi, Ilan Schvartzman, Shimrit Maman, Stanley R. Rotman and Dan G. Blumberg
Remote Sens. 2018, 10(5), 802; https://doi.org/10.3390/rs10050802 - 21 May 2018
Cited by 13 | Viewed by 4816
Abstract
Rapid damage mapping following a disaster event, especially in an urban environment, is critical to ensure that the emergency response in the affected area is rapid and efficient. This work presents a new method for mapping damage assessment in urban environments. Based on [...] Read more.
Rapid damage mapping following a disaster event, especially in an urban environment, is critical to ensure that the emergency response in the affected area is rapid and efficient. This work presents a new method for mapping damage assessment in urban environments. Based on combining SAR and optical data, the method is applicable as support during initial emergency planning and rescue operations. The study focuses on the urban areas affected by the Tohoku earthquake and subsequent tsunami event in Japan that occurred on 11 March 2011. High-resolution TerraSAR-X (TSX) images of before and after the event, and a Landsat 5 image before the event were acquired. The affected areas were analyzed with the SAR data using only one interferometric SAR (InSAR) coherence map. To increase the damage mapping accuracy, the normalized difference vegetation index (NDVI) was applied. The generated map, with a grid size of 50 m, provides a quantitative assessment of the nature and distribution of the damage. The damage mapping shows detailed information about the affected area, with high overall accuracy (89%), and high Kappa coefficient (82%) and, as expected, it shows total destruction along the coastline compared to the inland region. Full article
(This article belongs to the Special Issue Ten Years of TerraSAR-X—Scientific Results)
Show Figures

Graphical abstract

34 pages, 4255 KiB  
Article
Unsupervised Nonlinear Hyperspectral Unmixing Based on Bilinear Mixture Models via Geometric Projection and Constrained Nonnegative Matrix Factorization
by Bin Yang, Bin Wang and Zongmin Wu
Remote Sens. 2018, 10(5), 801; https://doi.org/10.3390/rs10050801 - 21 May 2018
Cited by 14 | Viewed by 4344
Abstract
Bilinear mixture model-based methods have recently shown promising capability in nonlinear spectral unmixing. However, relying on the endmembers extracted in advance, their unmixing accuracies decrease, especially when the data is highly mixed. In this paper, a strategy of geometric projection has been provided [...] Read more.
Bilinear mixture model-based methods have recently shown promising capability in nonlinear spectral unmixing. However, relying on the endmembers extracted in advance, their unmixing accuracies decrease, especially when the data is highly mixed. In this paper, a strategy of geometric projection has been provided and combined with constrained nonnegative matrix factorization for unsupervised nonlinear spectral unmixing. According to the characteristics of bilinear mixture models, a set of facets are determined, each of which represents the partial nonlinearity neglecting one endmember. Then, pixels’ barycentric coordinates with respect to every endmember are calculated in several newly constructed simplices using a distance measure. In this way, pixels can be projected into their approximate linear mixture components, which reduces greatly the impact of collinearity. Different from relevant nonlinear unmixing methods in the literature, this procedure effectively facilitates a more accurate estimation of endmembers and abundances in constrained nonnegative matrix factorization. The updated endmembers are further used to reconstruct the facets and get pixels’ new projections. Finally, endmembers, abundances, and pixels’ projections are updated alternately until a satisfactory result is obtained. The superior performance of the proposed algorithm in nonlinear spectral unmixing has been validated through experiments with both synthetic and real hyperspectral data, where traditional and state-of-the-art algorithms are compared. Full article
(This article belongs to the Section Remote Sensing Image Processing)
Show Figures

Graphical abstract

23 pages, 41039 KiB  
Article
Hyperspectral and Multispectral Image Fusion via Deep Two-Branches Convolutional Neural Network
by Jingxiang Yang, Yong-Qiang Zhao and Jonathan Cheung-Wai Chan
Remote Sens. 2018, 10(5), 800; https://doi.org/10.3390/rs10050800 - 21 May 2018
Cited by 147 | Viewed by 10514
Abstract
Enhancing the spatial resolution of hyperspectral image (HSI) is of significance for applications. Fusing HSI with a high resolution (HR) multispectral image (MSI) is an important technology for HSI enhancement. Inspired by the success of deep learning in image enhancement, in this paper, [...] Read more.
Enhancing the spatial resolution of hyperspectral image (HSI) is of significance for applications. Fusing HSI with a high resolution (HR) multispectral image (MSI) is an important technology for HSI enhancement. Inspired by the success of deep learning in image enhancement, in this paper, we propose a HSI-MSI fusion method by designing a deep convolutional neural network (CNN) with two branches which are devoted to features of HSI and MSI. In order to exploit spectral correlation and fuse the MSI, we extract the features from the spectrum of each pixel in low resolution HSI, and its corresponding spatial neighborhood in MSI, with the two CNN branches. The extracted features are then concatenated and fed to fully connected (FC) layers, where the information of HSI and MSI could be fully fused. The output of the FC layers is the spectrum of the expected HR HSI. In the experiment, we evaluate the proposed method on Airborne Visible Infrared Imaging Spectrometer (AVIRIS), and Environmental Mapping and Analysis Program (EnMAP) data. We also apply it to real Hyperion-Sentinel data fusion. The results on the simulated and the real data demonstrate that the proposed method is competitive with other state-of-the-art fusion methods. Full article
(This article belongs to the Special Issue Multisensor Data Fusion in Remote Sensing)
Show Figures

Graphical abstract

20 pages, 15120 KiB  
Article
Delineating Urban Boundaries Using Landsat 8 Multispectral Data and VIIRS Nighttime Light Data
by Xingyu Xue, Zhoulu Yu, Shaochun Zhu, Qiming Zheng, Melanie Weston, Ke Wang, Muye Gan and Hongwei Xu
Remote Sens. 2018, 10(5), 799; https://doi.org/10.3390/rs10050799 - 21 May 2018
Cited by 23 | Viewed by 6243
Abstract
Administering an urban boundary (UB) is increasingly important for curbing disorderly urban land expansion. The traditionally manual digitalization is time-consuming, and it is difficult to connect UB in the urban fringe due to the fragmented urban pattern in daytime data. Nighttime light (NTL) [...] Read more.
Administering an urban boundary (UB) is increasingly important for curbing disorderly urban land expansion. The traditionally manual digitalization is time-consuming, and it is difficult to connect UB in the urban fringe due to the fragmented urban pattern in daytime data. Nighttime light (NTL) data is a powerful tool used to map the urban extent, but both the blooming effect and the coarse spatial resolution make the urban product unable to meet the requirements of high-precision urban study. In this study, precise UB is extracted by a practical and effective method using NTL data and Landsat 8 data. Hangzhou, a megacity experiencing rapid urban sprawl, was selected to test the proposed method. Firstly, the rough UB was identified by the search mode of the concentric zones model (CZM) and the variance-based approach. Secondly, a buffer area was constructed to encompass the precise UB that is near the rough UB within a certain distance. Finally, the edge detection method was adopted to obtain the precise UB with a spatial resolution of 30 m. The experimental results show that a good performance was achieved and that it solved the largest disadvantage of the NTL data-blooming effect. The findings indicated that cities with a similar level of socio-economic status can be processed together when applied to larger-scale applications. Full article
(This article belongs to the Special Issue Remote Sensing of Night Lights – Beyond DMSP)
Show Figures

Graphical abstract

31 pages, 161658 KiB  
Article
Evolution and Controls of Large Glacial Lakes in the Nepal Himalaya
by Umesh K. Haritashya, Jeffrey S. Kargel, Dan H. Shugar, Gregory J. Leonard, Katherine Strattman, C. Scott Watson, David Shean, Stephan Harrison, Kyle T. Mandli and Dhananjay Regmi
Remote Sens. 2018, 10(5), 798; https://doi.org/10.3390/rs10050798 - 21 May 2018
Cited by 78 | Viewed by 12432
Abstract
Glacier recession driven by climate change produces glacial lakes, some of which are hazardous. Our study assesses the evolution of three of the most hazardous moraine-dammed proglacial lakes in the Nepal Himalaya—Imja, Lower Barun, and Thulagi. Imja Lake (up to 150 m deep; [...] Read more.
Glacier recession driven by climate change produces glacial lakes, some of which are hazardous. Our study assesses the evolution of three of the most hazardous moraine-dammed proglacial lakes in the Nepal Himalaya—Imja, Lower Barun, and Thulagi. Imja Lake (up to 150 m deep; 78.4 × 10⁶ m3 volume; surveyed in October 2014) and Lower Barun Lake (205 m maximum observed depth; 112.3 × 10⁶ m3 volume; surveyed in October 2015) are much deeper than previously measured, and their readily drainable volumes are slowly growing. Their surface areas have been increasing at an accelerating pace from a few small supraglacial lakes in the 1950s/1960s to 1.33 km2 and 1.79 km2 in 2017, respectively. In contrast, the surface area (0.89 km2) and volume of Thulagi lake (76 m maximum observed depth; 36.1 × 10⁶ m3; surveyed in October 2017) has remained almost stable for about two decades. Analyses of changes in the moraine dams of the three lakes using digital elevation models (DEMs) quantifies the degradation of the dams due to the melting of their ice cores and hence their natural lowering rates as well as the potential for glacial lake outburst floods (GLOFs). We examined the likely future evolution of lake growth and hazard processes associated with lake instability, which suggests faster growth and increased hazard potential at Lower Barun lake. Full article
Show Figures

Graphical abstract

18 pages, 6597 KiB  
Article
Automated Extraction of Surface Water Extent from Sentinel-1 Data
by Wenli Huang, Ben DeVries, Chengquan Huang, Megan W. Lang, John W. Jones, Irena F. Creed and Mark L. Carroll
Remote Sens. 2018, 10(5), 797; https://doi.org/10.3390/rs10050797 - 21 May 2018
Cited by 151 | Viewed by 14249
Abstract
Accurately quantifying surface water extent in wetlands is critical to understanding their role in ecosystem processes. However, current regional- to global-scale surface water products lack the spatial or temporal resolution necessary to characterize heterogeneous or variable wetlands. Here, we proposed a fully automatic [...] Read more.
Accurately quantifying surface water extent in wetlands is critical to understanding their role in ecosystem processes. However, current regional- to global-scale surface water products lack the spatial or temporal resolution necessary to characterize heterogeneous or variable wetlands. Here, we proposed a fully automatic classification tree approach to classify surface water extent using Sentinel-1 synthetic aperture radar (SAR) data and training datasets derived from prior class masks. Prior classes of water and non-water were generated from the Shuttle Radar Topography Mission (SRTM) water body dataset (SWBD) or composited dynamic surface water extent (cDSWE) class probabilities. Classification maps of water and non-water were derived over two distinct wetlandscapes: the Delmarva Peninsula and the Prairie Pothole Region. Overall classification accuracy ranged from 79% to 93% when compared to high-resolution images in the Prairie Pothole Region site. Using cDSWE class probabilities reduced omission errors among water bodies by 10% and commission errors among non-water class by 4% when compared with results generated by using the SWBD water mask. These findings indicate that including prior water masks that reflect the dynamics in surface water extent (i.e., cDSWE) is important for the accurate mapping of water bodies using SAR data. Full article
(This article belongs to the Special Issue Remote Sensing for Flood Mapping and Monitoring of Flood Dynamics)
Show Figures

Figure 1

19 pages, 3387 KiB  
Article
Performance of Solar-Induced Chlorophyll Fluorescence in Estimating Water-Use Efficiency in a Temperate Forest
by Xiaoliang Lu, Zhunqiao Liu, Yuyu Zhou, Yaling Liu and Jianwu Tang
Remote Sens. 2018, 10(5), 796; https://doi.org/10.3390/rs10050796 - 20 May 2018
Cited by 4 | Viewed by 4132
Abstract
Water-use efficiency (WUE) is a critical variable describing the interrelationship between carbon uptake and water loss in land ecosystems. Different WUE formulations (WUEs) including intrinsic water use efficiency (WUEi), inherent water use efficiency (IWUE), and underlying water use efficiency (uWUE) have [...] Read more.
Water-use efficiency (WUE) is a critical variable describing the interrelationship between carbon uptake and water loss in land ecosystems. Different WUE formulations (WUEs) including intrinsic water use efficiency (WUEi), inherent water use efficiency (IWUE), and underlying water use efficiency (uWUE) have been proposed. Based on continuous measurements of carbon and water fluxes and solar-induced chlorophyll fluorescence (SIF) at a temperate forest, we analyze the correlations between SIF emission and the different WUEs at the canopy level by using linear regression (LR) and Gaussian processes regression (GPR) models. Overall, we find that SIF emission has a good potential to estimate IWUE and uWUE, especially when a combination of different SIF bands and a GPR model is used. At an hourly time step, canopy-level SIF emission can explain as high as 65% and 61% of the variances in IWUE and uWUE. Specifically, we find that (1) a daily time step by averaging hourly values during daytime can enhance the SIF-IWUE correlations, (2) the SIF-IWUE correlations decrease when photosynthetically active radiation and air temperature exceed their optimal biological thresholds, (3) a low Leaf Area Index (LAI) has a negative effect on the SIF-IWUE correlations due to large evaporation fluxes, (4) a high LAI in summer also reduces the SIF-IWUE correlations most likely due to increasing scattering and (re)absorption of the SIF signal, and (5) the observation time during the day has a strong impact on the SIF-IWUE correlations and SIF measurements in the early morning have the lowest power to estimate IWUE due to the large evaporation of dew. This study provides a new way to evaluate the stomatal regulation of plant-gas exchange without complex parameterizations. Full article
(This article belongs to the Special Issue Remote Sensing in Forest Hydrology)
Show Figures

Graphical abstract

24 pages, 6153 KiB  
Article
Vertical Structure Anomalies of Oceanic Eddies and Eddy-Induced Transports in the South China Sea
by Wenjin Sun, Changming Dong, Wei Tan, Yu Liu, Yijun He and Jun Wang
Remote Sens. 2018, 10(5), 795; https://doi.org/10.3390/rs10050795 - 20 May 2018
Cited by 35 | Viewed by 6991
Abstract
Using satellite altimetry sea surface height anomalies (SSHA) and Argo profiles, we investigated eddy’s statistical characteristics, 3-D structures, eddy-induced physical parameter changes, and heat/freshwater transports in the South China Sea (SCS). In total, 31,744 cyclonic eddies (CEs, snapshot) and 29,324 anticyclonic eddies (AEs) [...] Read more.
Using satellite altimetry sea surface height anomalies (SSHA) and Argo profiles, we investigated eddy’s statistical characteristics, 3-D structures, eddy-induced physical parameter changes, and heat/freshwater transports in the South China Sea (SCS). In total, 31,744 cyclonic eddies (CEs, snapshot) and 29,324 anticyclonic eddies (AEs) were detected in the SCS between 1 January 2005 and 31 December 2016. The composite analysis has uncovered that changes in physical parameters modulated by eddies are mainly confined to the upper 400 m. The maximum change of temperature (T), salinity (S) and potential density (σθ) within the composite CE reaches −1.5 °C at about 70 m, 0.1 psu at about 50 m, and 0.5 kg m−3 at about 60 m, respectively. In contrast, the maximum change of T, S and σθ in the composite AE reaches 1.6 °C (about 110 m), −0.1 psu (about 70 m), and −0.5 kg m−3 (about 90 m), respectively. The maximum swirl velocity within the composite CE and AE reaches 0.3 m s−1. The zonal freshwater transport induced by CEs and AEs is (373.6 ± 9.7)×103 m3 s−1 and (384.2 ± 10.8)×103 m3 s−1, respectively, contributing up to (8.5 ± 0.2)% and (8.7 ± 0.2)% of the annual mean transport through the Luzon Strait. Full article
(This article belongs to the Section Ocean Remote Sensing)
Show Figures

Graphical abstract

14 pages, 20077 KiB  
Article
Efficient Ground Surface Displacement Monitoring Using Sentinel-1 Data: Integrating Distributed Scatterers (DS) Identified Using Two-Sample t-Test with Persistent Scatterers (PS)
by Roghayeh Shamshiri, Hossein Nahavandchi, Mahdi Motagh and Andy Hooper
Remote Sens. 2018, 10(5), 794; https://doi.org/10.3390/rs10050794 - 19 May 2018
Cited by 31 | Viewed by 6539
Abstract
Combining persistent scatterers (PS) and distributed scatterers (DS) is important for effective displacement monitoring using time-series of SAR data. However, for large stacks of synthetic aperture radar (SAR) data, the DS analysis using existing algorithms becomes a time-consuming process. Moreover, the whole procedure [...] Read more.
Combining persistent scatterers (PS) and distributed scatterers (DS) is important for effective displacement monitoring using time-series of SAR data. However, for large stacks of synthetic aperture radar (SAR) data, the DS analysis using existing algorithms becomes a time-consuming process. Moreover, the whole procedure of DS selection should be repeated as soon as a new SAR acquisition is made, which is challenging considering the short repeat-observation of missions such as Sentinel-1. SqueeSAR is an approach for extracting signals from DS, which first applies a spatiotemporal filter on images and optimizes DS, then incorporates information from both optimized DS and PS points into interferometric SAR (InSAR) time-series analysis. In this study, we followed SqueeSAR and implemented a new approach for DS analysis using two-sample t-test to efficiently identify neighboring pixels with similar behaviour. We evaluated the performance of our approach on 50 Sentinel-1 images acquired over Trondheim in Norway between January 2015 and December 2016. A cross check on the number of the identified neighboring pixels using the Kolmogorov–Smirnov (KS) test, which is employed in the SqueeSAR approach, and the t-test shows that their results are strongly correlated. However, in comparison to KS-test, the t-test is less computationally intensive (98% faster). Moreover, the results obtained by applying the tests under different SAR stack sizes from 40 to 10 show that the t-test is less sensitive to the number of images. Full article
(This article belongs to the Special Issue Imaging Geodesy and Infrastructure Monitoring)
Show Figures

Graphical abstract

19 pages, 5988 KiB  
Article
On the Desiccation of the South Aral Sea Observed from Spaceborne Missions
by Alka Singh, Ali Behrangi, Joshua B. Fisher and John T. Reager
Remote Sens. 2018, 10(5), 793; https://doi.org/10.3390/rs10050793 - 19 May 2018
Cited by 25 | Viewed by 6240
Abstract
The South Aral Sea has been massively affected by the implementation of a mega-irrigation project in the region, but ground-based observations have monitored the Sea poorly. This study is a comprehensive analysis of the mass balance of the South Aral Sea and its [...] Read more.
The South Aral Sea has been massively affected by the implementation of a mega-irrigation project in the region, but ground-based observations have monitored the Sea poorly. This study is a comprehensive analysis of the mass balance of the South Aral Sea and its basin, using multiple instruments from ground and space. We estimate lake volume, evaporation from the lake, and the Amu Darya streamflow into the lake using strengths offered by various remote-sensing data. We also diagnose the attribution behind the shrinking of the lake and its possible future fate. Terrestrial water storage (TWS) variations observed by the Gravity Recovery and Climate Experiment (GRACE) mission from the Aral Sea region can approximate water level of the East Aral Sea with good accuracy (1.8% normalized root mean square error (RMSE), and 0.9 correlation) against altimetry observations. Evaporation from the lake is back-calculated by integrating altimetry-based lake volume, in situ streamflow, and Global Precipitation Climatology Project (GPCP) precipitation. Different evapotranspiration (ET) products (Global Land Data Assimilation System (GLDAS), the Water Gap Hydrological Model (WGHM)), and Moderate-Resolution Imaging Spectroradiometer (MODIS) Global Evapotranspiration Project (MOD16) significantly underestimate the evaporation from the lake. However, another MODIS based Priestley-Taylor Jet Propulsion Laboratory (PT-JPL) ET estimate shows remarkably high consistency (0.76 correlation) with our estimate (based on the water-budget equation). Further, streamflow is approximated by integrating lake volume variation, PT-JPL ET, and GPCP datasets. In another approach, the deseasonalized GRACE signal from the Amu Darya basin was also found to approximate streamflow and predict extreme flow into the lake by one or two months. They can be used for water resource management in the Amu Darya delta. The spatiotemporal pattern in the Amu Darya basin shows that terrestrial water storage (TWS) in the central region (predominantly in the primary irrigation belt other than delta) has increased. This increase can be attributed to enhanced infiltration, as ET and vegetation index (i.e., normalized difference vegetation index (NDVI)) from the area has decreased. The additional infiltration might be an indication of worsening of the canal structures and leakage in the area. The study shows how altimetry, optical images, gravimetric and other ancillary observations can collectively help to study the desiccating Aral Sea and its basin. A similar method can be used to explore other desiccating lakes. Full article
(This article belongs to the Special Issue Satellite Altimetry for Earth Sciences)
Show Figures

Graphical abstract

19 pages, 14541 KiB  
Article
Remotely Sensing the Morphometrics and Dynamics of a Cold Region Dune Field Using Historical Aerial Photography and Airborne LiDAR Data
by Carson A. Baughman, Benjamin M. Jones, Karin L. Bodony, Daniel H. Mann, Chris F. Larsen, Emily Himelstoss and Jeremy Smith
Remote Sens. 2018, 10(5), 792; https://doi.org/10.3390/rs10050792 - 19 May 2018
Cited by 19 | Viewed by 5345
Abstract
This study uses an airborne Light Detection and Ranging (LiDAR) survey, historical aerial photography and historical climate data to describe the character and dynamics of the Nogahabara Sand Dunes, a sub-Arctic dune field in interior Alaska’s discontinuous permafrost zone. The Nogahabara Sand Dunes [...] Read more.
This study uses an airborne Light Detection and Ranging (LiDAR) survey, historical aerial photography and historical climate data to describe the character and dynamics of the Nogahabara Sand Dunes, a sub-Arctic dune field in interior Alaska’s discontinuous permafrost zone. The Nogahabara Sand Dunes consist of a 43-km2 area of active transverse and barchanoid dunes within a 3200-km2 area of vegetated dune and sand sheet deposits. The average dune height in the active portion of the dune field is 5.8 m, with a maximum dune height of 28 m. Dune spacing is variable with average crest-to-crest distances for select transects ranging from 66–132 m. Between 1952 and 2015, dunes migrated at an average rate of 0.52 m a−1. Dune movement was greatest between 1952 and 1978 (0.68 m a−1) and least between 1978 and 2015 (0.43 m a−1). Dunes migrated predominantly to the southeast; however, along the dune field margin, net migration was towards the edge of the dune field regardless of heading. Better constraining the processes controlling dune field dynamics at the Nogahabara dunes would provide information that can be used to model possible reactivation of more northerly dune fields and sand sheets in response to climate change, shifting fire regimes and permafrost thaw. Full article
(This article belongs to the Special Issue Remote Sensing of Dynamic Permafrost Regions)
Show Figures

Graphical abstract

15 pages, 9929 KiB  
Article
Spatiotemporal Analysis of Landsat-8 and Sentinel-2 Data to Support Monitoring of Dryland Ecosystems
by Neal J. Pastick, Bruce K. Wylie and Zhuoting Wu
Remote Sens. 2018, 10(5), 791; https://doi.org/10.3390/rs10050791 - 19 May 2018
Cited by 39 | Viewed by 7388
Abstract
Drylands are the habitat and source of livelihood for about two fifths of the world’s population and are highly susceptible to climate and anthropogenic change. To understand the vulnerability of drylands to changing environmental conditions, land managers need to effectively monitor rates of [...] Read more.
Drylands are the habitat and source of livelihood for about two fifths of the world’s population and are highly susceptible to climate and anthropogenic change. To understand the vulnerability of drylands to changing environmental conditions, land managers need to effectively monitor rates of past change and remote sensing offers a cost-effective means to assess and manage these vast landscapes. Here, we present a novel approach to accurately monitor land-surface phenology in drylands of the Western United States using a regression tree modeling framework that combined information collected by the Operational Land Imager (OLI) onboard Landsat 8 and the Multispectral Instrument (MSI) onboard Sentinel-2. This highly-automatable approach allowed us to precisely characterize seasonal variations in spectral vegetation indices with substantial agreement between observed and predicted values (R2 = 0.98; Mean Absolute Error = 0.01). Derived phenology curves agreed with independent eMODIS phenological signatures of major land cover types (average r-value = 0.86), cheatgrass cover (average r-value = 0.96), and growing season proxies for vegetation productivity (R2 = 0.88), although a systematic bias towards earlier maturity and senescence indicates enhanced monitoring capabilities associated with the use of harmonized Landsat-8 Sentinel-2 data. Overall, our results demonstrate that observations made by the MSI and OLI can be used in conjunction to accurately characterize land-surface phenology and exclusion of imagery from either sensor drastically reduces our ability to monitor dryland environments. Given the declines in MODIS performance and forthcoming decommission with no equivalent replacement planned, data fusion approaches that integrate observations from multispectral sensors will be needed to effectively monitor dryland ecosystems. While the synthetic image stacks are expected to be locally useful, the technical approach can serve a wide variety of applications such as invasive species and drought monitoring, habitat mapping, production of phenology metrics, and land-cover change modeling. Full article
(This article belongs to the Special Issue Remote Sensing of Arid/Semiarid Lands)
Show Figures

Graphical abstract

21 pages, 4714 KiB  
Article
An Image Fusion Method Based on Image Segmentation for High-Resolution Remotely-Sensed Imagery
by Hui Li, Linhai Jing, Yunwei Tang and Liming Wang
Remote Sens. 2018, 10(5), 790; https://doi.org/10.3390/rs10050790 - 19 May 2018
Cited by 11 | Viewed by 4830
Abstract
Fusion of high spatial resolution (HSR) multispectral (MS) and panchromatic (PAN) images has become a research focus with the development of HSR remote sensing technology. In order to reduce the spectral distortions of fused images, current image fusion methods focus on optimizing the [...] Read more.
Fusion of high spatial resolution (HSR) multispectral (MS) and panchromatic (PAN) images has become a research focus with the development of HSR remote sensing technology. In order to reduce the spectral distortions of fused images, current image fusion methods focus on optimizing the approach used to extract spatial details from the PAN band, or on the optimization of the models employed during the injection of spatial details into the MS bands. Due to the resolution difference between the MS and PAN images, there is a large amount of mixed pixels (MPs) existing in the upsampled MS images. The fused versions of these MPs remain mixed, although they may correspond to pure PAN pixels. This is one of the reasons for spectral distortions of fusion products. However, few methods consider spectral distortions introduced by the mixed fused spectra of MPs. In this paper, an image fusion method based on image segmentation was proposed to improve the fused spectra of MPs. The MPs were identified and then fused to be as close as possible to the spectra of pure pixels, in order to reduce spectral distortions caused by fused MPs and improve the quality of fused products. A fusion experiment, using three HSR datasets recorded by WorldView-2, WorldView-3 and GeoEye-1, respectively, was implemented to compare the proposed method with several other state-of-the-art fusion methods, such as haze- and ratio-based (HR), adaptive Gram–Schmidt (GSA) and smoothing filter-based intensity modulation (SFIM). Fused products generated at the original and degraded scales were assessed using several widely-used quantitative quality indexes. Visual inspection was also employed to compare the fused images produced using the original datasets. It was demonstrated that the proposed method offers the lowest spectral distortions and more sharpened boundaries between different image objects than other methods, especially for boundaries between vegetation and non-vegetation objects. Full article
(This article belongs to the Section Remote Sensing Image Processing)
Show Figures

Graphical abstract

21 pages, 1962 KiB  
Article
Evaluation of a Bayesian Algorithm to Detect Burned Areas in the Canary Islands’ Dry Woodlands and Forests Ecoregion Using MODIS Data
by Francisco Guindos-Rojas, Manuel Arbelo, José R. García-Lázaro, José A. Moreno-Ruiz and Pedro A. Hernández-Leal
Remote Sens. 2018, 10(5), 789; https://doi.org/10.3390/rs10050789 - 19 May 2018
Cited by 9 | Viewed by 4083
Abstract
Burned Area (BA) is deemed as a primary variable to understand the Earth’s climate system. Satellite remote sensing data have allowed for the development of various burned area detection algorithms that have been globally applied to and assessed in diverse ecosystems, ranging from [...] Read more.
Burned Area (BA) is deemed as a primary variable to understand the Earth’s climate system. Satellite remote sensing data have allowed for the development of various burned area detection algorithms that have been globally applied to and assessed in diverse ecosystems, ranging from tropical to boreal. In this paper, we present a Bayesian algorithm (BY-MODIS) that detects burned areas in a time series of Moderate Resolution Imaging Spectroradiometer (MODIS) images from 2002 to 2012 of the Canary Islands’ dry woodlands and forests ecoregion (Spain). Based on daily image products MODIS, MOD09GQ (250 m), and MOD11A1 (1 km), the surface spectral reflectance and the land surface temperature, respectively, 10 day composites were built using the maximum temperature criterion. Variables used in BY-MODIS were the Global Environment Monitoring Index (GEMI) and Burn Boreal Forest Index (BBFI), alongside the NIR spectral band, all of which refer to the previous year and the year the fire took place in. Reference polygons for the 14 fires exceeding 100 hectares and identified within the period under analysis were developed using both post-fire LANDSAT images and official information from the forest fires national database by the Ministry of Agriculture and Fisheries, Food and Environment of Spain (MAPAMA). The results obtained by BY-MODIS can be compared to those by official burned area products, MCD45A1 and MCD64A1. Despite that the best overall results correspond to MCD64A1, BY-MODIS proved to be an alternative for burned area mapping in the Canary Islands, a region with a great topographic complexity and diverse types of ecosystems. The total burned area detected by the BY-MODIS classifier was 64.9% of the MAPAMA reference data, and 78.6% according to data obtained from the LANDSAT images, with the lowest average commission error (11%) out of the three products and a correlation (R2) of 0.82. The Bayesian algorithm—originally developed to detect burned areas in North American boreal forests using AVHRR archival data Long-Term Data Record—can be successfully applied to a lower latitude forest ecosystem totally different from the boreal ecosystem and using daily time series of satellite images from MODIS with a 250 m spatial resolution, as long as a set of training areas adequately characterising the dynamics of the forest canopy affected by the fire is defined. Full article
(This article belongs to the Special Issue Remote Sensing of Wildfire)
Show Figures

Figure 1

16 pages, 5653 KiB  
Letter
SMAP Soil Moisture Change as an Indicator of Drought Conditions
by Rajasekaran Eswar, Narendra N. Das, Calvin Poulsen, Ali Behrangi, John Swigart, Mark Svoboda, Dara Entekhabi, Simon Yueh, Bradley Doorn and Jared Entin
Remote Sens. 2018, 10(5), 788; https://doi.org/10.3390/rs10050788 - 19 May 2018
Cited by 38 | Viewed by 6326
Abstract
Soil moisture is considered a key variable in drought analysis. The soil moisture dynamics given by the change in soil moisture between two time periods can provide information on the intensification or improvement of drought conditions. The aim of this work is to [...] Read more.
Soil moisture is considered a key variable in drought analysis. The soil moisture dynamics given by the change in soil moisture between two time periods can provide information on the intensification or improvement of drought conditions. The aim of this work is to analyze how the soil moisture dynamics respond to changes in drought conditions over multiple time intervals. The change in soil moisture estimated from the Soil Moisture Active Passive (SMAP) satellite observations was compared with the United States Drought Monitor (USDM) and the Standardized Precipitation Index (SPI) over the contiguous United States (CONUS). The results indicated that the soil moisture change over 13-week and 26-week intervals is able to capture the changes in drought intensity levels in the USDM, and the change over a four-week interval correlated well with the one-month SPI values. This suggested that a short-term negative soil moisture change may indicate a lack of precipitation, whereas a persistent long-term negative soil moisture change may indicate severe drought conditions. The results further indicate that the inclusion of soil moisture change will add more value to the existing drought-monitoring products. Full article
Show Figures

Figure 1

21 pages, 12732 KiB  
Article
Aerial and Ground Based Sensing of Tolerance to Beet Cyst Nematode in Sugar Beet
by Samuel Joalland, Claudio Screpanti, Hubert Vincent Varella, Marie Reuther, Mareike Schwind, Christian Lang, Achim Walter and Frank Liebisch
Remote Sens. 2018, 10(5), 787; https://doi.org/10.3390/rs10050787 - 19 May 2018
Cited by 41 | Viewed by 6667
Abstract
The rapid development of image-based phenotyping methods based on ground-operating devices or unmanned aerial vehicles (UAV) has increased our ability to evaluate traits of interest for crop breeding in the field. A field site infested with beet cyst nematode (BCN) and planted with [...] Read more.
The rapid development of image-based phenotyping methods based on ground-operating devices or unmanned aerial vehicles (UAV) has increased our ability to evaluate traits of interest for crop breeding in the field. A field site infested with beet cyst nematode (BCN) and planted with four nematode susceptible cultivars and five tolerant cultivars was investigated at different times during the growing season. We compared the ability of spectral, hyperspectral, canopy height- and temperature information derived from handheld and UAV-borne sensors to discriminate susceptible and tolerant cultivars and to predict the final sugar beet yield. Spectral indices (SIs) related to chlorophyll, nitrogen or water allowed differentiating nematode susceptible and tolerant cultivars (cultivar type) from the same genetic background (breeder). Discrimination between the cultivar types was easier at advanced stages when the nematode pressure was stronger and the plants and canopies further developed. The canopy height (CH) allowed differentiating cultivar type as well but was much more efficient from the UAV compared to manual field assessment. Canopy temperatures also allowed ranking cultivars according to their nematode tolerance level. Combinations of SIs in multivariate analysis and decision trees improved differentiation of cultivar type and classification of genetic background. Thereby, SIs and canopy temperature proved to be suitable proxies for sugar yield prediction. The spectral information derived from handheld and the UAV-borne sensor did not match perfectly, but both analysis procedures allowed for discrimination between susceptible and tolerant cultivars. This was possible due to successful detection of traits related to BCN tolerance like chlorophyll, nitrogen and water content, which were reduced in cultivars with a low tolerance to BCN. The high correlation between SIs and final sugar beet yield makes the UAV hyperspectral imaging approach very suitable to improve farming practice via maps of yield potential or diseases. Moreover, the study shows the high potential of multi- sensor and parameter combinations for plant phenotyping purposes, in particular for data from UAV-borne sensors that allow for standardized and automated high-throughput data extraction procedures. Full article
Show Figures

Graphical abstract

25 pages, 2171 KiB  
Article
Machine Learning Regression Approaches for Colored Dissolved Organic Matter (CDOM) Retrieval with S2-MSI and S3-OLCI Simulated Data
by Ana Belen Ruescas, Martin Hieronymi, Gonzalo Mateo-Garcia, Sampsa Koponen, Kari Kallio and Gustau Camps-Valls
Remote Sens. 2018, 10(5), 786; https://doi.org/10.3390/rs10050786 - 19 May 2018
Cited by 65 | Viewed by 8355
Abstract
The colored dissolved organic matter (CDOM) variable is the standard measure of humic substance in waters optics. CDOM is optically characterized by its spectral absorption coefficient, a C D O M at at reference wavelength (e.g., ≈ 440 nm). Retrieval of CDOM is [...] Read more.
The colored dissolved organic matter (CDOM) variable is the standard measure of humic substance in waters optics. CDOM is optically characterized by its spectral absorption coefficient, a C D O M at at reference wavelength (e.g., ≈ 440 nm). Retrieval of CDOM is traditionally done using bio-optical models. As an alternative, this paper presents a comparison of five machine learning methods applied to Sentinel-2 and Sentinel-3 simulated reflectance ( R r s ) data for the retrieval of CDOM: regularized linear regression (RLR), random forest regression (RFR), kernel ridge regression (KRR), Gaussian process regression (GPR) and support vector machines (SVR). Two different datasets of radiative transfer simulations are used for the development and training of the machine learning regression approaches. Statistics comparison with well-established polynomial regression algorithms shows optimistic results for all models and band combinations, highlighting the good performance of the methods, especially the GPR approach, when all bands are used as input. Application to an atmospheric corrected OLCI image using the reflectance derived form the alternative neural network (Case 2 Regional) is also shown. Python scripts and notebooks are provided to interested users. Full article
(This article belongs to the Special Issue Remote Sensing of Ocean Colour)
Show Figures

Graphical abstract

27 pages, 4966 KiB  
Article
Remotely Sensing the Biophysical Drivers of Sardinella aurita Variability in Ivorian Waters
by Jean-Baptiste Kassi, Marie-Fanny Racault, Brice A. Mobio, Trevor Platt, Shubha Sathyendranath, Dionysios E. Raitsos and Kouadio Affian
Remote Sens. 2018, 10(5), 785; https://doi.org/10.3390/rs10050785 - 18 May 2018
Cited by 13 | Viewed by 5915
Abstract
The coastal regions of the Gulf of Guinea constitute one of the major marine ecosystems, producing essential living marine resources for the populations of Western Africa. In this region, the Ivorian continental shelf is under pressure from various anthropogenic sources, which have put [...] Read more.
The coastal regions of the Gulf of Guinea constitute one of the major marine ecosystems, producing essential living marine resources for the populations of Western Africa. In this region, the Ivorian continental shelf is under pressure from various anthropogenic sources, which have put the regional fish stocks, especially Sardinella aurita, the dominant pelagic species in Ivorian industrial fishery landings, under threat from overfishing. Here, we combine in situ observations of Sardinella aurita catch, temperature, and nutrient profiles, with remote-sensing ocean-color observations, and reanalysis data of wind and sea surface temperature, to investigate relationships between Sardinella aurita catch and oceanic primary producers (including biomass and phenology of phytoplankton), and between Sardinella aurita catch and environmental conditions (including upwelling index, and turbulent mixing). We show that variations in Sardinella aurita catch in the following year may be predicted, with a confidence of 78%, based on a bilinear model using only physical variables, and with a confidence of 40% when using only biological variables. However, the physics-based model alone is not sufficient to explain the mechanism driving the year-to-year variations in Sardinella aurita catch. Based on the analysis of the relationships between biological variables, we demonstrate that in the Ivorian continental shelf, during the study period 1998–2014, population dynamics of Sardinella aurita, and oceanic primary producers, may be controlled, mainly by top-down trophic interactions. Finally, based on the predictive models constructed here, we discuss how they can provide powerful tools to support evaluation and monitoring of fishing activity, which may help towards the development of a Fisheries Information and Management System. Full article
(This article belongs to the Special Issue Remote Sensing of Ocean Colour)
Show Figures

Graphical abstract

18 pages, 3355 KiB  
Article
Hyperspectral Measurement of Seasonal Variation in the Coverage and Impacts of an Invasive Grass in an Experimental Setting
by Yuxi Guo, Sarah Graves, S. Luke Flory and Stephanie Bohlman
Remote Sens. 2018, 10(5), 784; https://doi.org/10.3390/rs10050784 - 18 May 2018
Cited by 6 | Viewed by 4162
Abstract
Hyperspectral remote sensing can be a powerful tool for detecting invasive species and their impact across large spatial scales. However, remote sensing studies of invasives rarely occur across multiple seasons, although the properties of invasives often change seasonally. This may limit the detection [...] Read more.
Hyperspectral remote sensing can be a powerful tool for detecting invasive species and their impact across large spatial scales. However, remote sensing studies of invasives rarely occur across multiple seasons, although the properties of invasives often change seasonally. This may limit the detection of invasives using remote sensing through time. We evaluated the ability of hyperspectral measurements to quantify the coverage of a plant invader and its impact on senesced plant coverage and canopy equivalent water thickness (EWT) across seasons. A portable spectroradiometer was used to collect data in a field experiment where uninvaded plant communities were experimentally invaded by cogongrass, a non-native perennial grass, or maintained as an uninvaded reference. Vegetation canopy characteristics, including senesced plant material, the ratio of live to senesced plants, and canopy EWT varied across the seasons and showed different temporal patterns between the invaded and reference plots. Partial least square regression (PLSR) models based on a single season had a limited predictive ability for data from a different season. Models trained with data from multiple seasons successfully predicted invasive plant coverage and vegetation characteristics across multiple seasons and years. Our results suggest that if seasonal variation is accounted for, the hyperspectral measurement of invaders and their effects on uninvaded vegetation may be scaled up to quantify effects at landscape scales using airborne imaging spectrometers. Full article
Show Figures

Graphical abstract

18 pages, 3202 KiB  
Article
Deep Cube-Pair Network for Hyperspectral Imagery Classification
by Wei Wei, Jinyang Zhang, Lei Zhang, Chunna Tian and Yanning Zhang
Remote Sens. 2018, 10(5), 783; https://doi.org/10.3390/rs10050783 - 18 May 2018
Cited by 30 | Viewed by 6857
Abstract
Advanced classification methods, which can fully utilize the 3D characteristic of hyperspectral image (HSI) and generalize well to the test data given only limited labeled training samples (i.e., small training dataset), have long been the research objective for HSI classification problem. Witnessing the [...] Read more.
Advanced classification methods, which can fully utilize the 3D characteristic of hyperspectral image (HSI) and generalize well to the test data given only limited labeled training samples (i.e., small training dataset), have long been the research objective for HSI classification problem. Witnessing the success of deep-learning-based methods, a cube-pair-based convolutional neural networks (CNN) classification architecture is proposed to cope this objective in this study, where cube-pair is used to address the small training dataset problem as well as preserve the 3D local structure of HSI data. Within this architecture, a 3D fully convolutional network is further modeled, which has less parameters compared with traditional CNN. Provided the same amount of training samples, the modeled network can go deeper than traditional CNN and thus has superior generalization ability. Experimental results on several HSI datasets demonstrate that the proposed method has superior classification results compared with other state-of-the-art competing methods. Full article
Show Figures

Graphical abstract

20 pages, 1193 KiB  
Article
Natural Forest Mapping in the Andes (Peru): A Comparison of the Performance of Machine-Learning Algorithms
by Luis Alberto Vega Isuhuaylas, Yasumasa Hirata, Lenin Cruyff Ventura Santos and Noemi Serrudo Torobeo
Remote Sens. 2018, 10(5), 782; https://doi.org/10.3390/rs10050782 - 18 May 2018
Cited by 34 | Viewed by 6397
Abstract
The Andes mountain forests are sparse relict populations of tree species that grow in association with local native shrubland species. The identification of forest conditions for conservation in areas such as these is based on remote sensing techniques and classification methods. However, the [...] Read more.
The Andes mountain forests are sparse relict populations of tree species that grow in association with local native shrubland species. The identification of forest conditions for conservation in areas such as these is based on remote sensing techniques and classification methods. However, the classification of Andes mountain forests is difficult because of noise in the reflectance data within land cover classes. The noise is the result of variations in terrain illumination resulting from complex topography and the mixture of different land cover types occurring at the sub-pixel level. Considering these issues, the selection of an optimum classification method to obtain accurate results is very important to support conservation activities. We carried out comparative non-parametric statistical analyses on the performance of several classifiers produced by three supervised machine-learning algorithms: Random Forest (RF), Support Vector Machine (SVM), and k-Nearest Neighbor (kNN). The SVM and RF methods were not significantly different in their ability to separate Andes mountain forest and shrubland land cover classes, and their best classifiers showed a significantly better classification accuracy (AUC values 0.81 and 0.79 respectively) than the one produced by the kNN method (AUC value 0.75) because the latter was more sensitive to noisy training data. Full article
(This article belongs to the Special Issue Mountain Remote Sensing)
Show Figures

Graphical abstract

26 pages, 28077 KiB  
Article
Region Merging Considering Within- and Between-Segment Heterogeneity: An Improved Hybrid Remote-Sensing Image Segmentation Method
by Yongji Wang, Qingyan Meng, Qingwen Qi, Jian Yang and Ying Liu
Remote Sens. 2018, 10(5), 781; https://doi.org/10.3390/rs10050781 - 18 May 2018
Cited by 30 | Viewed by 5648
Abstract
Image segmentation is an important process and a prerequisite for object-based image analysis, but segmenting an image into meaningful geo-objects is a challenging problem. Recently, some scholars have focused on hybrid methods that employ initial segmentation and subsequent region merging since hybrid methods [...] Read more.
Image segmentation is an important process and a prerequisite for object-based image analysis, but segmenting an image into meaningful geo-objects is a challenging problem. Recently, some scholars have focused on hybrid methods that employ initial segmentation and subsequent region merging since hybrid methods consider both boundary and spatial information. However, the existing merging criteria (MC) only consider the heterogeneity between adjacent segments to calculate the merging cost of adjacent segments, thus limiting the goodness-of-fit between segments and geo-objects because the homogeneity within segments and the heterogeneity between segments should be treated equally. To overcome this limitation, in this paper a hybrid remote-sensing image segmentation method is employed that considers the objective heterogeneity and relative homogeneity (OHRH) for MC during region merging. In this paper, the OHRH method is implemented in five different study areas and then compared to our region merging method using the objective heterogeneity (OH) method, as well as the full lambda-schedule algorithm (FLSA). The unsupervised evaluation indicated that the OHRH method was more accurate than the OH and FLSA methods, and the visual results showed that the OHRH method could distinguish both small and large geo-objects. The segments showed greater size changes than those of the other methods, demonstrating the superiority of considering within- and between-segment heterogeneity in the OHRH method. Full article
(This article belongs to the Special Issue Pattern Analysis and Recognition in Remote Sensing)
Show Figures

Graphical abstract

19 pages, 4935 KiB  
Article
Comparing Landsat and RADARSAT for Current and Historical Dynamic Flood Mapping
by Ian Olthof and Simon Tolszczuk-Leclerc
Remote Sens. 2018, 10(5), 780; https://doi.org/10.3390/rs10050780 - 18 May 2018
Cited by 19 | Viewed by 6910
Abstract
Mapping the historical occurrence of flood water in time and space provides information that can be used to help mitigate damage from future flood events. In Canada, flood mapping has been performed mainly from RADARSAT imagery in near real-time to enhance situational awareness [...] Read more.
Mapping the historical occurrence of flood water in time and space provides information that can be used to help mitigate damage from future flood events. In Canada, flood mapping has been performed mainly from RADARSAT imagery in near real-time to enhance situational awareness during an emergency, and more recently from Landsat to examine historical surface water dynamics from the mid-1980s to present. Here, we seek to integrate the two data sources for both operational and historical flood mapping. A main challenge of a multi-sensor approach is ensuring consistency between surface water mapped from sensors that fundamentally interact with the target differently, particularly in areas of flooded vegetation. In addition, automation of workflows that previously relied on manual interpretation is increasingly needed due to large data volumes contained within satellite image archives. Despite differences between data received from both sensors, common approaches to surface water and flooded vegetation mapping including multi-channel classification and region growing can be applied with sensor-specific adaptations for each. Historical open water maps from 202 Landsat scenes spanning the years 1985–2016 generated previously were enhanced to improve flooded vegetation mapping along the Saint John River in New Brunswick, Canada. Open water and flooded vegetation maps were created over the same region from 181 RADARSAT 1 and 2 scenes acquired between 2003–2016. Comparisons of maps from different sensors and hydrometric data were performed to examine consistency and robustness of products derived from different sensors. Simulations reveal that the methodology used to map open water from dual-pol RADARSAT 2 is insensitive to up to about 20% training error. Landsat depicts open water inundation well, while flooded vegetation can be reliably mapped in leaf-off conditions. RADARSAT mapped approximately 8% less open water area than Landsat and 0.5% more flooded vegetation, while the combined area of open water and flooded vegetation agreed to within 0.2% between sensors. Derived historical products depicting inundation frequency and trends were also generated from each sensor’s time-series of surface water maps and compared. Full article
(This article belongs to the Special Issue Remote Sensing for Flood Mapping and Monitoring of Flood Dynamics)
Show Figures

Graphical abstract

27 pages, 12203 KiB  
Article
DenseNet-Based Depth-Width Double Reinforced Deep Learning Neural Network for High-Resolution Remote Sensing Image Per-Pixel Classification
by Yiting Tao, Miaozhong Xu, Zhongyuan Lu and Yanfei Zhong
Remote Sens. 2018, 10(5), 779; https://doi.org/10.3390/rs10050779 - 18 May 2018
Cited by 45 | Viewed by 6867
Abstract
Deep neural networks (DNNs) face many problems in the very high resolution remote sensing (VHRRS) per-pixel classification field. Among the problems is the fact that as the depth of the network increases, gradient disappearance influences classification accuracy and the corresponding increasing number of [...] Read more.
Deep neural networks (DNNs) face many problems in the very high resolution remote sensing (VHRRS) per-pixel classification field. Among the problems is the fact that as the depth of the network increases, gradient disappearance influences classification accuracy and the corresponding increasing number of parameters to be learned increases the possibility of overfitting, especially when only a small amount of VHRRS labeled samples are acquired for training. Further, the hidden layers in DNNs are not transparent enough, which results in extracted features not being sufficiently discriminative and significant amounts of redundancy. This paper proposes a novel depth-width-reinforced DNN that solves these problems to produce better per-pixel classification results in VHRRS. In the proposed method, densely connected neural networks and internal classifiers are combined to build a deeper network and balance the network depth and performance. This strengthens the gradients, decreases negative effects from gradient disappearance as the network depth increases and enhances the transparency of hidden layers, making extracted features more discriminative and reducing the risk of overfitting. In addition, the proposed method uses multi-scale filters to create a wider neural network. The depth of the filters from each scale is controlled to decrease redundancy and the multi-scale filters enable utilization of joint spatio-spectral information and diverse local spatial structure simultaneously. Furthermore, the concept of network in network is applied to better fuse the deeper and wider designs, making the network operate more smoothly. The results of experiments conducted on BJ02, GF02, geoeye and quickbird satellite images verify the efficacy of the proposed method. The proposed method not only achieves competitive classification results but also proves that the network can continue to be robust and perform well even while the amount of labeled training samples is decreasing, which fits the small training samples situation faced by VHRRS per-pixel classification. Full article
(This article belongs to the Section Remote Sensing Image Processing)
Show Figures

Graphical abstract

16 pages, 5077 KiB  
Article
Assessing Texture Features to Classify Coastal Wetland Vegetation from High Spatial Resolution Imagery Using Completed Local Binary Patterns (CLBP)
by Minye Wang, Xianyun Fei, Yuanzhi Zhang, Zhou Chen, Xiaoxue Wang, Jin Yeu Tsou, Dawei Liu and Xia Lu
Remote Sens. 2018, 10(5), 778; https://doi.org/10.3390/rs10050778 - 17 May 2018
Cited by 31 | Viewed by 5417
Abstract
Coastal wetland vegetation is a vital component that plays an important role in environmental protection and the maintenance of the ecological balance. As such, the efficient classification of coastal wetland vegetation types is key to the preservation of wetlands. Based on its detailed [...] Read more.
Coastal wetland vegetation is a vital component that plays an important role in environmental protection and the maintenance of the ecological balance. As such, the efficient classification of coastal wetland vegetation types is key to the preservation of wetlands. Based on its detailed spatial information, high spatial resolution imagery constitutes an important tool for extracting suitable texture features for improving the accuracy of classification. In this paper, a texture feature, Completed Local Binary Patterns (CLBP), which is highly suitable for face recognition, is presented and applied to vegetation classification using high spatial resolution Pléiades satellite imagery in the central zone of Yancheng National Natural Reservation (YNNR) in Jiangsu, China. To demonstrate the potential of CLBP texture features, Grey Level Co-occurrence Matrix (GLCM) texture features were used to compare the classification. Using spectral data alone and spectral data combined with texture features, the image was classified using a Support Vector Machine (SVM) based on vegetation types. The results show that CLBP and GLCM texture features yielded an accuracy 6.50% higher than that gained when using only spectral information for vegetation classification. However, CLBP showed greater improvement in terms of classification accuracy than GLCM for Spartina alterniflora. Furthermore, for the CLBP features, CLBP_magnitude (CLBP_m) was more effective than CLBP_sign (CLBP_s), CLBP_center (CLBP_c), and CLBP_s/m or CLBP_s/m/c. These findings suggest that the CLBP approach offers potential for vegetation classification in high spatial resolution images. Full article
Show Figures

Figure 1

18 pages, 4651 KiB  
Article
Characterizing Tropical Forest Cover Loss Using Dense Sentinel-1 Data and Active Fire Alerts
by Johannes Reiche, Rob Verhoeven, Jan Verbesselt, Eliakim Hamunyela, Niels Wielaard and Martin Herold
Remote Sens. 2018, 10(5), 777; https://doi.org/10.3390/rs10050777 - 17 May 2018
Cited by 46 | Viewed by 14546
Abstract
Fire use for land management is widespread in natural tropical and plantation forests, causing major environmental and economic damage. Recent studies combining active fire alerts with annual forest-cover loss information identified fire-related forest-cover loss areas well, but do not provide detailed understanding on [...] Read more.
Fire use for land management is widespread in natural tropical and plantation forests, causing major environmental and economic damage. Recent studies combining active fire alerts with annual forest-cover loss information identified fire-related forest-cover loss areas well, but do not provide detailed understanding on how fires and forest-cover loss are temporally related. Here, we combine Sentinel-1-based, near real-time forest cover information with Visible Infrared Imaging Radiometer Suite (VIIRS) active fire alerts, and for the first time, characterize the temporal relationship between fires and tropical forest-cover loss at high temporal detail and medium spatial scale. We quantify fire-related forest-cover loss and separate fires that predate, coincide with, and postdate forest-cover loss. For the Province of Riau, Indonesia, dense Sentinel-1 C-band Synthetic Aperture Radar data with guaranteed observations of at least every 12 days allowed for confident and timely forest-cover-loss detection in natural and plantation forest with user’s and producer’s accuracy above 95%. Forest-cover loss was detected and confirmed within 22 days in natural forest and within 15 days in plantation forest. This difference can primarily be related to different change processes and dynamics in natural and plantation forest. For the period between 1 January 2016 and 30 June 2017, fire-related forest-cover loss accounted for about one third of the natural forest-cover loss, while in plantation forest, less than ten percent of the forest-cover loss was fire-related. We found clear spatial patterns of fires predating, coinciding with, or postdating forest-cover loss. Only the minority of fires in natural and plantation forest temporally coincided with forest-cover loss (13% and 16%) and can thus be confidently attributed as direct cause of forest-cover loss. The majority of the fires predated (64% and 58%) or postdated forest-cover loss (23% and 26%), and should be attributed to other key land management practices. Detailed and timely information on how fires and forest cover loss are temporally related can support tropical forest management, policy development, and law enforcement to reduce unsustainable and illegal fire use in the tropics. Full article
(This article belongs to the Section Forest Remote Sensing)
Show Figures

Graphical abstract

Previous Issue
Next Issue
Back to TopTop