Article

Remotely Sensing the Morphometrics and Dynamics of a Cold Region Dune Field Using Historical Aerial Photography and Airborne LiDAR Data

1
Alaska Science Center, U.S. Geological Survey, Anchorage, AK 99508, USA
2
Koyukuk National Wildlife Refuge, Galena, AK 99741, USA
3
Department of Geoscience, University of Alaska Fairbanks, Fairbanks, AK 99775, USA
4
Geophysical Institute, University of Alaska Fairbanks, Fairbanks, AK 99775, USA
5
Woods Hole Science Center, U.S. Geological Survey, Woods Hole, MA 02543, USA
6
Kodiak Mapping Inc., Palmer, Alaska 99645, USA
*
Author to whom correspondence should be addressed.
Remote Sens. 2018, 10(5), 792; https://doi.org/10.3390/rs10050792
Submission received: 7 April 2018 / Revised: 5 May 2018 / Accepted: 17 May 2018 / Published: 19 May 2018
(This article belongs to the Special Issue Remote Sensing of Dynamic Permafrost Regions)

Abstract

:
This study uses an airborne Light Detection and Ranging (LiDAR) survey, historical aerial photography and historical climate data to describe the character and dynamics of the Nogahabara Sand Dunes, a sub-Arctic dune field in interior Alaska’s discontinuous permafrost zone. The Nogahabara Sand Dunes consist of a 43-km2 area of active transverse and barchanoid dunes within a 3200-km2 area of vegetated dune and sand sheet deposits. The average dune height in the active portion of the dune field is 5.8 m, with a maximum dune height of 28 m. Dune spacing is variable with average crest-to-crest distances for select transects ranging from 66–132 m. Between 1952 and 2015, dunes migrated at an average rate of 0.52 m a−1. Dune movement was greatest between 1952 and 1978 (0.68 m a−1) and least between 1978 and 2015 (0.43 m a−1). Dunes migrated predominantly to the southeast; however, along the dune field margin, net migration was towards the edge of the dune field regardless of heading. Better constraining the processes controlling dune field dynamics at the Nogahabara dunes would provide information that can be used to model possible reactivation of more northerly dune fields and sand sheets in response to climate change, shifting fire regimes and permafrost thaw.

Graphical Abstract

1. Introduction

Active dune fields and sand sheets occur on all seven continents of the globe and cover an area of approximately 5,000,000 km2 [1]. Sand dunes and sand sheets (sand bodies lacking dune topography) are the direct product of the transport and accumulation of wind-driven sand into bedforms [2,3]. The formation and transformation of dunes and sand sheets represent a landscape response to dynamic global and regional climatic change, ecological succession and disturbance events [4,5]. For example, large, now-inactive Pleistocene-aged dune fields and sand sheets found across the globe suggest that increased availability of fine-grain material and atmospheric conditions conducive to aeolian transport were characteristic of that time [6]. Changes in precipitation, vegetation and ice-sheet extent through the Holocene led to stabilization of these features [6]. In this way, modern active dune fields, especially in cold climates, can serve as a valuable proxy for the study of past and present landscape change with respect to climate [6,7].
Approximately 100,000 km2 of active and stable aeolian sand deposits occur in the Arctic and sub-Arctic today [6]. Compared to temperate and tropical region dunes, these cold-climate dunes reside in boreal ecosystems with environmental conditions including non-arid climate, periglacial histories, the presence of permafrost and/or seasonally-frozen ground and dynamic fire regimes [8]. Surface moisture is an important attribute governing sand movement [9], and permafrost has the potential to influence dune movement and structure through interactions with soil moisture. Interactions between blowing sand and snow can also produce unique niveo-eolian features including laminated interbedding and hummocky terrain following snow melt [2]. While dry sand, even if below freezing, would not be inhibited, as is the case on Mars and in Antarctica where permafrost is common [10], exposed frozen ground can immobilize sand and inhibit saltation [11]. The influence of these conditions on sand-dune morphology, especially in regards to permafrost and seasonally-frozen sediment, remains poorly studied compared to warm-climate dunes.
Today, dormant sand dunes and sand sheets underlay extensive sections of Alaska [12,13]. Active inland dune fields are confined to the ~62-km2 Great Kobuk Sand Dunes (GKSD), 8-km2 Little Kobuk Sand Dunes (LKSD) and the ~43-km2 Nogahabara Sand Dunes [14,15]. This study describes the morphometry and dynamics of the Nogahabara dunes using a recent airborne LiDAR dataset, historical aerial photographs and climate data analysis. To the authors’ knowledge, this is the first LiDAR dataset dedicated to a sub-Arctic dune field. This study quantifies a number of physical characteristics of the Nogahabara Sand Dunes, including dune crest height, orientation, spacing and migration rate for two time frames since 1952. These datasets allow for characterization and comparison between this cold-climate dune field and temperate dune fields for which comparable data are available. Available historical weather records were summarized to assess if changes in climate in Alaska since the early 1950s can explain changes in dune-crest migration rates in the Nogahabara dune field. Given the abundance of stabilized, cold-region sand dunes and sand sheets, this study provides useful information pertaining to active and stable cold-climate dunes with respect to ongoing climate change, increases in the frequency and severity of wildfires in Arctic and Boreal regions and permafrost thaw. These results could provide insight for other cold-climate dunes on Earth, as well as extraterrestrial bodies including Mars.

Study Area

The Nogahabara dunes represent one of the many sub-Arctic dune fields found in the Northern Hemisphere [6,12,16,17,18,19,20,21]; however, it is one of only two active inland dune fields found in Alaska [14]. The dunes are roughly 43 km2 in area [22] and located in the discontinuous permafrost zone about 460 km west-northwest of Fairbanks, Alaska (Figure 1). The dunes lie within the Koyukuk Wilderness Area and the Koyukuk National Wildlife Refuge (Figure 1). The region was unglaciated during the Last Glacial Maximum [23]. Land cover consists of a successional mosaic of boreal vegetation shaped by interactions between wildfire, sediment transport from river flooding and the occurrence of discontinuous permafrost [24,25]. The modern climate is sub-Arctic. The nearby village of Galena (90 km to the south-southeast) has a mean annual air temperatures (MAAT) of −3.27 °C (1981–2010). Mean annual precipitation as measured in Galena between 1981 and 2010 is 310 mm (http://climate.gi.alaska.edu/Climate/Normals). Seasonal weather varies from average summer highs of over 20 °C in July to winter lows exceeding −40 °C typically in January.
Dunes in various states of activity make up the greater Nogahabara Sand Dunes area. Transverse dunes are asymmetrical linear dunes oriented at right angles to prevailing winds. Barchan dunes are crescent shaped with their crescent tips pointed down-wind. Distinct barchan dunes are absent in Nogahabara; however, two circular portions of active dunes are comprised of clearly discernable dunes that resemble a complex combination of transverse and barchanoid dune forms [22]. Dunes most resembling transverse dunes span portions of the active dune field with their slipfaces oriented predominantly to the southeast (Figure 2). There is a deflation zone southeast of the centroid of the larger of the two active areas [22] where dune orientation is more erratic. The transition from dune to forest is marked by a large slipface that runs the complete circumference of the active dune fields ([22]; Figure 3a). The sole mechanical analysis of the dunes yielded a modal grain size of 2.75 on the Krumbien phi scale (~0.149 mm), and earlier surveys suggested that the grain size was sorted from west to east with finer grains located to the east [22]. Sparse vegetation can be found throughout the active dunes and includes patches of open spruce (Figure 3b). Early reports stated that dune migration was to the northeast and east or southeast [26,27]. Later aerial photointerpretation suggested the major transport direction to be to the west and northwest with a secondary summer direction to the east [22].
Lobes of inactive and recently stabilized dunes protrude from the active field (Figure 2 and Figure 3c). These stabilized dunes are more vegetated with forest of varying ages following repeated wildfire. Transverse barchanoid dune forms are still clearly discernable especially in winter suggesting periods of recent stabilization or reactivation. Large scalloped scarps mark the boundary between these stabilized dunes and adjacent forests. One southern lobe of stabilized dunes exhibits unusual rosette-like bedforms (Figure 2) where transverse dune forms radiate out from a central point in the lobe. Rosette dunes have been described elsewhere along the Koyukuk River and in other stabilized Alaskan dune fields including the Shaw Creek Sand Dunes, Tetlin Sand Dunes and Kantishna Sand Dunes [22,28].
The Koyukuk River Valley region (3200 km2) consists of stabilized longitudinal and parabolic dunes, as well as sand sheet deposits suggested to be glacio-fluvial in origin ([15]. Radiocarbon dates from calcretes presumed to have formed during periods of dune activation suggest that Nogahabara dune field formation had occurred by 10.5–8.1 ka [29]. Sequential paleosols, as well as 190–640 ± 60 C14-year-old spruce forests preserved and exposed within the active dune field reveal more recent cycles of dune stabilization and reactivation [30].
The dunes are particularly important because they contain unique assemblages of plants thought to represent relict Beringia flora [31]. A disjunct Asian sedge (Carex sabulosa) occurring in the dunes is listed as critically imperiled in Alaska and Canada. Alaskan bugseed (Corispermum hyssopifolium) also occurs in the dunes and has been listed as vulnerable due to its restricted range in Alaska [32]. Yukon lupine (Lupinus kuschei) is a globally vulnerable species primarily found in the Yukon Territories, but with disjunct populations in the dunes. Additionally the dunes are the habitat for rare and/or endemic subspecies of animals including an endemic sandy tiger beetle (Cicindela limbata nogahabarensis) [33] and the rare Alaska tiny shrew (Sorex yukonicus).

2. Materials and Methods

2.1. Remote Sensing Data

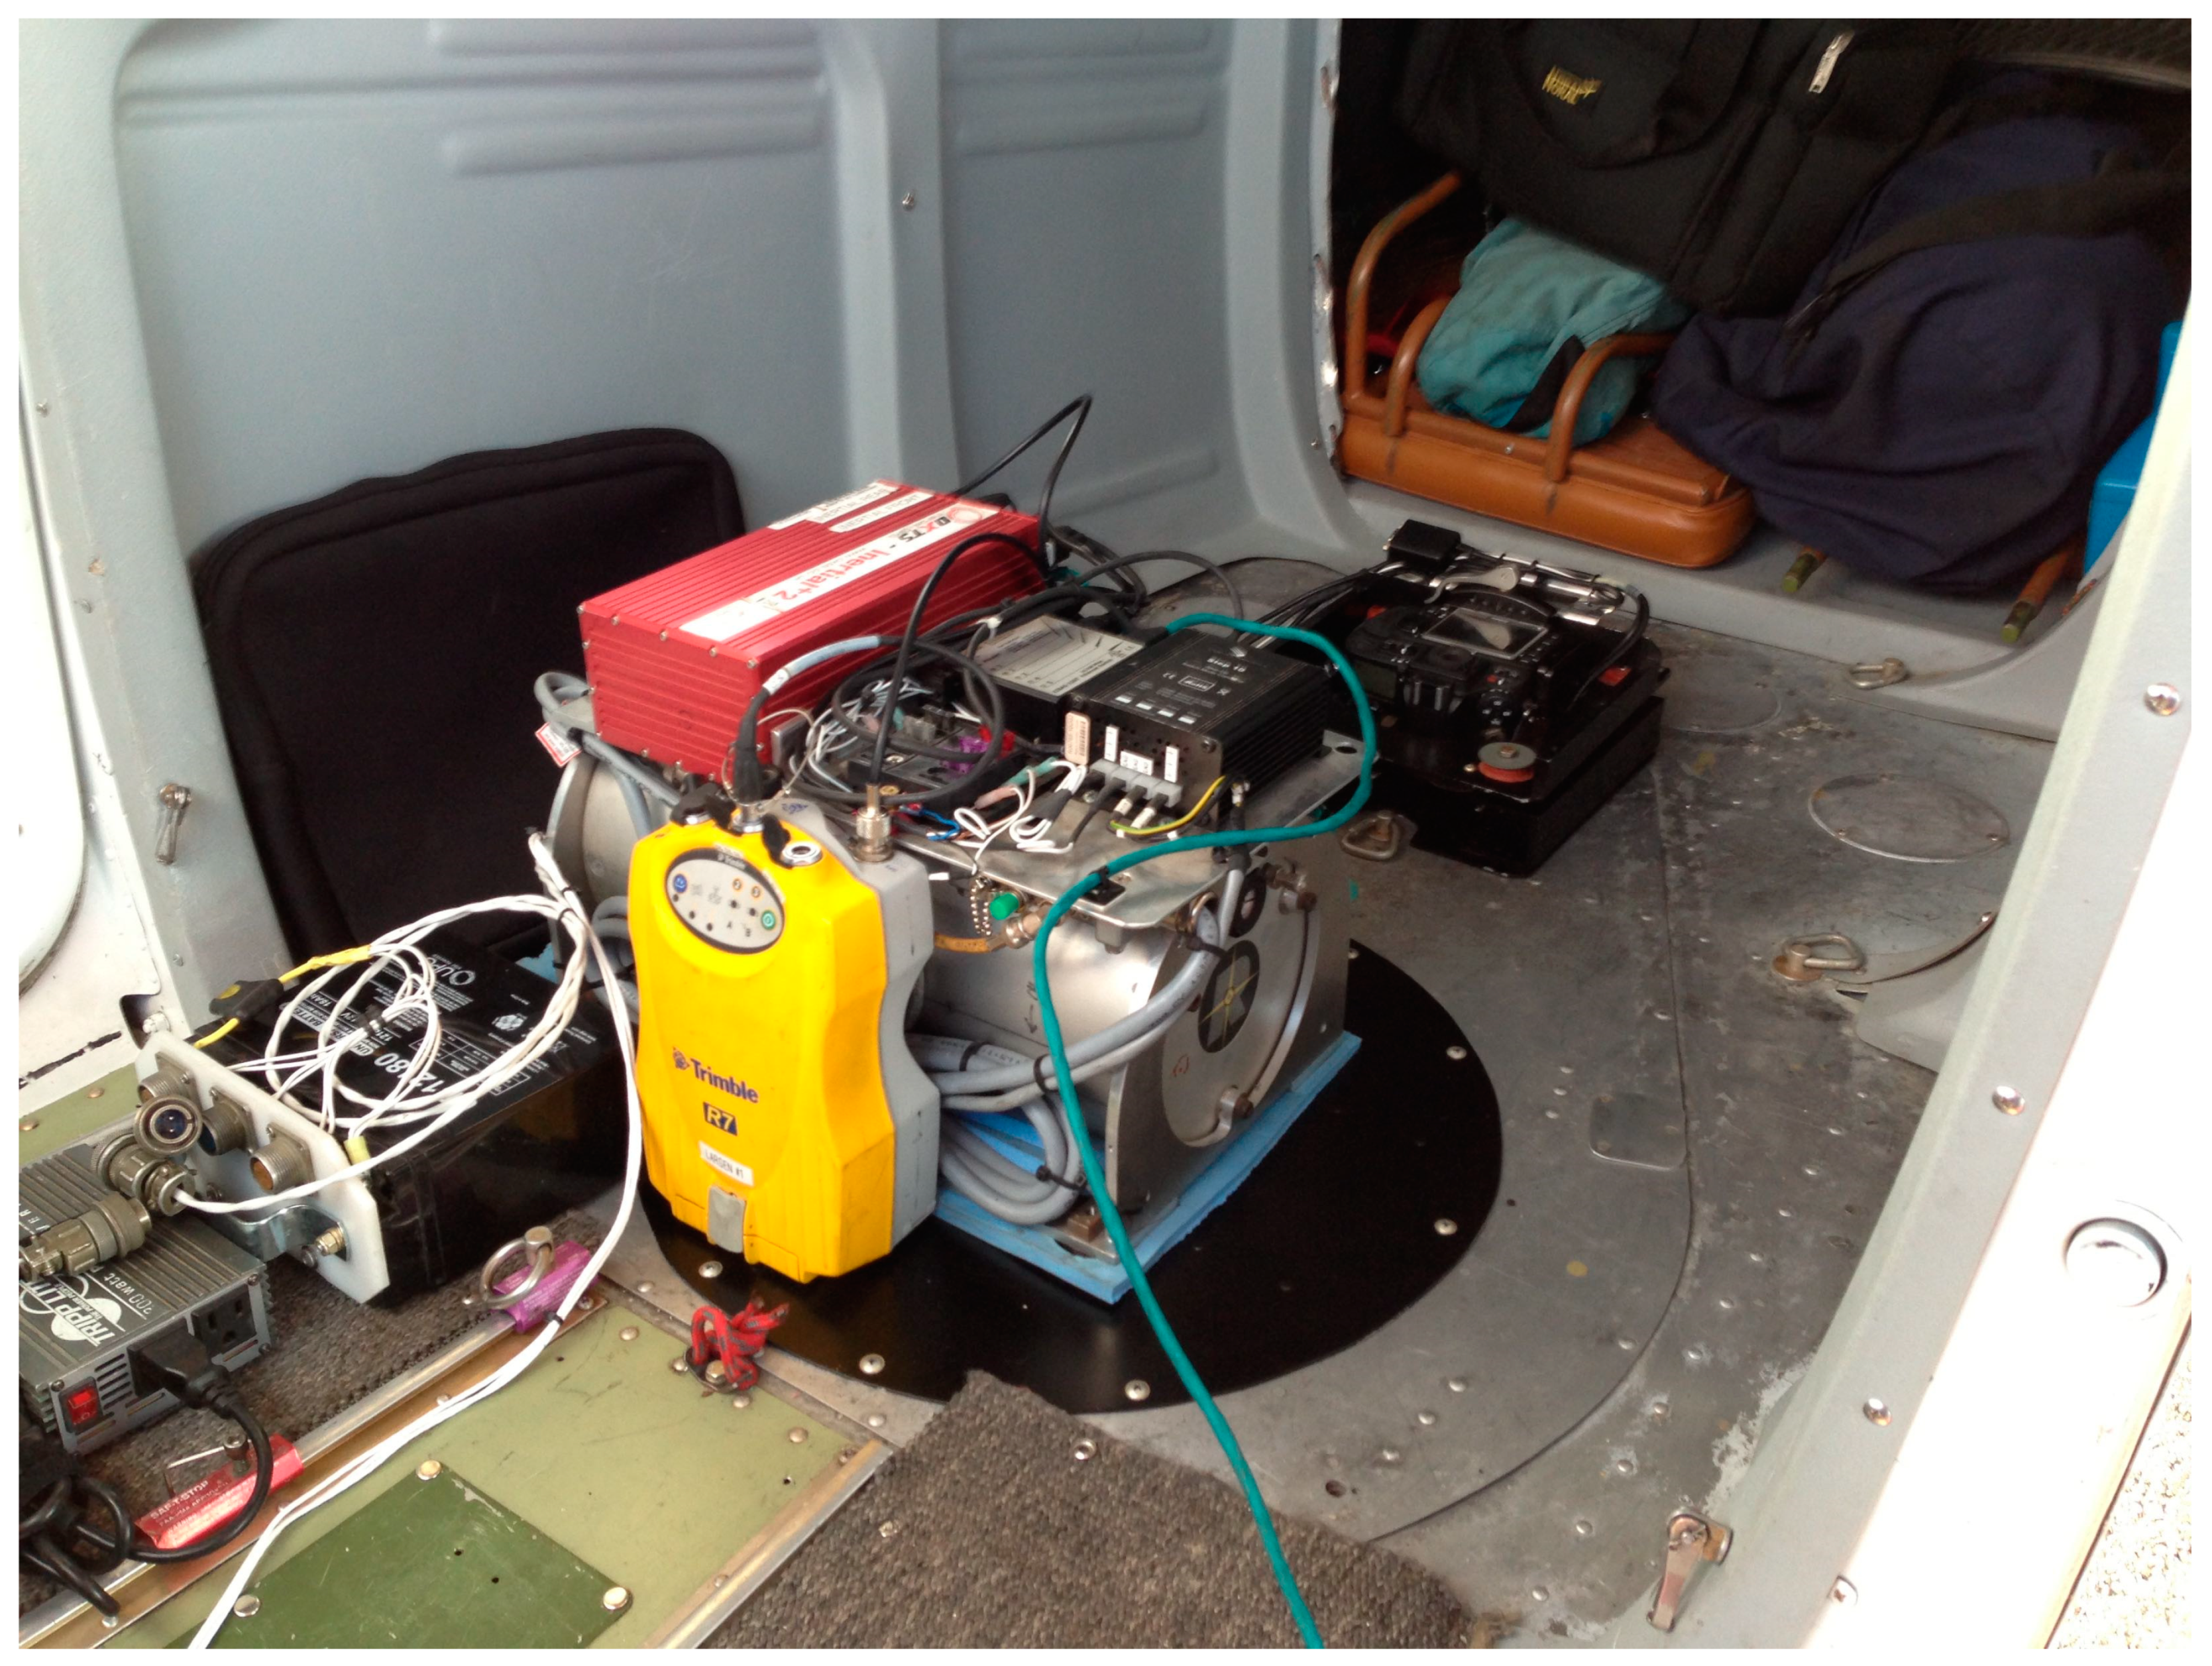
2.1.1. Airborne LiDAR and Orthophotography

In September 2015, airborne LiDAR data were collected over the dune field using a Riegl brand LMS-Q240i laser scanner. The scanner was set to 10,000 laser shots per second and a ±30 degree beam sweep. The LiDAR scanner was rigidly attached to an OXTS brand Inertial+2 GPS/IMU unit. A Trimble R7 GPS receiver fed into the GPS/IMU unit (Figure 4). The raw data were processed into a point-cloud that represented land surface returns. The point cloud data were further processed to remove low level noise along adjacent flight lines to create a more suitable representation of the land surface. In a Micro-station/TerraSolid software environment, both TerraScan and TerraModeler were utilized to analyze and classify the raw point cloud. During this process, the point cloud data were classified to achieve a pseudo-bare earth digital elevation model using a combination of automated bare-earth algorithms and comprehensive manual cross-section edits. The corrected and processed point cloud data were converted to a 2-m resolution DEM for further analysis. Aerial photography was simultaneously collected using a Nikon D800 paired with the same GPS/IMU unit as used with the LiDAR scanner to produce an orthomosaic with a final horizontal resolution of 10 cm.

2.1.2. Historical Aerial Photos

Historical aerial photographs were used to assess dune migration rates from July 1952, July 1978 and September 2015. Black and white areal imagery (1:42,000) was acquired on 5 July 1952 from a 6400-m elevation, and color infrared imagery (1:61,016) was acquired on 27 June 1978 from an 18,289-m elevation. Both the 1952 image (ARCGAL000160099) and 1978 image (AR6386000900145) were downloaded from the USGS EarthExplorer website (http://earthexplorer.usgs.gov/). Image resolution of the three aerial photo scenes was 0.6 m (1952), 0.9 m (1978) and 0.1 m (2015). Each image was independently georegistered based on the 2015 orthophoto mosaic using ArcMap 10.2.2. Twenty ground control points were established across each scene using living trees, shrubs and stable bluff faces. All georegistration achieved an RMS error less than 2 m.

2.2. Climate Data Analysis

Local climate data are unavailable for the dunes; thus, data are summarized for the villages of Galena and Huslia (90-km and 45-km distance, respectively). Hourly weather records for Galena (September 1942–December 2016) and Huslia (1994–2016) were acquired from the National Climate Data Center (https://gis.ncdc.noaa.gov/maps/ncei/cdo/hourly). Hourly temperature data were summarized into mean daily temperatures (MDT), thawing degree days (TDD) and freezing degree days (FDD). All available MDT were used to calculate MAAT. Annual means for air temperature, and annual total FDDs and TDDs were derived for all calendar years with at least some data available for all twelve months. Significant data gaps existed within the Galena weather record for 1 November 1945–31 May 1953 and 1 January 1972–31 December 1972. Subsequently, the years 1942, 1945–1952 and 1972 were excluded from annual summaries. Temperature data from 2000 and 2001 were also excluded on the basis of being inflated for unknown reasons. Data from 2004 were excluded from Huslia’s annual summaries due to missing data for February 2004–December 2004.
Wind speed and direction are available for Galena and Huslia beginning in 1942 and 1994, respectively. Using the Bagnold logarithmic wind profile equation [34] and an anemometer height of 10 m, wind speeds below 6.5 m/s were estimated to be insufficient to transport sand particles characteristic of Nogahabara. Wind speeds in excess of 6.5 m/s and their respective direction were summarized to produce wind roses for three periods corresponding to the aerial photograph intervals (1942–1945, 1953–1978 and 1978–2015) and divided by season; winter (January, February and December), spring (March–May), summer (June–August) and fall (September–November).

2.3. Dune Feature Characterization

Physical measurements including spacing, heading and length can provide a means to characterize the field-scale organization of an active or inactive dune field [10]. A known dune ridge location is required for these parameters. Dune ridge locations were programmatically delineated for September 2015 using ArcMap 10.2.2. The ArcMap spatial-analyst curvature toolset calculated the surface curvature of the LiDAR-derived DEM at 2-m resolution. A positive curvature indicates the surface is upwardly convex at that cell. A negative curvature indicates the surface is upwardly concave at that cell. A value of 0 indicates the surface is flat. The spatial-analyst filter tool and an LOW filter type were used to smooth the curvature raster twice. The smoothed raster was reclassified into three natural breaks (jenks) classes. The two lowest classes were reclassified as NoData, and the uppermost class (1.08–28.08) was reclassified as 1 to identify convex dune ridge areas. The resultant raster was converted to a polygon feature utilizing the simplified polygon option in ArcMap. The spatial-statistics-calculate-area tool calculated the area (m2) for all polygons. All polygons with areas less than 300 m2 were deleted after visual comparison showed they were too small to contain dune features with definable ridges. Following small feature deletion, the cartography-smooth-polygon tool was used to smooth the remaining polygons in conjunction with a PEAK smoothing algorithm at 50-m resolution. The union tool filled donut holes within the polygons with the ‘gaps allowed’ option unchecked. The automated filling of gaps erroneously filled some inter-dune spaces, so manual detection and deletion of those resultant polygons was needed. Next, the eliminate tool was implemented to dissolve filled donut-hole polygons into their larger host polygons. All vertices of the resultant shapefile were converted to points using the feature vertices-to-points tool. From these points, Thiessen polygons were created. This process indirectly delineates the centerline of each polygon and is the basis for final dune ridge location. The Thiessen polygon features were converted to simple lines, and then only lines that fell completely within polygons demarcating the ridge areas were retained. Subsequent comparison of dune ridge lines with the base DEM provided validation of the proper location of the ridge. Dune ridges were considered properly located when they aligned with the maximum elevation of the dune.
Dune height was determined using the spatial-analyst aggregate tool and the minimum DEM cell values at a 50-cell (100-m) resolution. This process generated a reduced-resolution DEM of the greater Nogahabara study area and effectively removed small-scale topographic features from the raster. The data-management resample tool was applied to the aggregate raster to return to a 1-cell (2-m) resolution using bilinear-resampling techniques. Dune height was calculated as the difference between this resampled raster (identical in resolution and extent to the original DEM) and the original DEM.

2.4. Dune Migration Analysis

Dune migration rates were estimated within ten active and three inactive randomly selected subsample areas (Figure 2) using the digital shoreline analysis system (DSAS Version 4.3). This approach (DSAS) has been used to track river bank erosion, thermokarst lake expansion and a multitude of coastal settings [35,36,37]. Each subsampling area was roughly 0.6 km by 0.7 km. Slipface position was used as a consistent proxy to measure changes in dune position between the three sets of imagery as has been used in several previous studies [38,39,40,41]. The line where the slipface meets the inter-dune space was digitized utilizing the high contrast between sunlit slipfaces and indirectly illuminated inter-dune spaces. Both the 1952 and 1978 imagery appear to have been taken when the Sun angle was near 150 degrees. To achieve consistent dune delineation conditions in 2015, a hillshade raster was derived using the LiDAR DEM and identical solar conditions with a Sun angle of 150 degrees and a solar altitude of 44 degrees.
The base of dune ridge slipfaces were digitized for the 1952 and 1978 georeferenced imagery and the 2015 hillshade DEM within an ArcMap edit session. The scale of view was maintained between 1:1000 and 1:3000 as features were traced. An average digitizing uncertainty was determined for each year by tracing a dune feature ten times, then measuring the residual distances between traces. This assessment was performed both for a portion of the dunes where there was high contrast (significant overlap in all ten traces) and on a section where there was low contrast (more variability between the ten traces). The digitizing uncertainty in high and low contrast areas was averaged together to get the associated digitizing uncertainty. The 2015 LiDAR had a position uncertainty of 8 cm (in the x and the y dimension) and a digitizing error of 2 m (1 pixel). The 1978 aerial photo imagery had a root mean square (RMS) registration uncertainty of 1.62 m and a digitizing uncertainty of 2 m (2.2 pixels). The 1952 air photo imagery had a RMS registration uncertainty of 1.18 m and a digitizing uncertainty of 3 m (5 pixels). The total positional error for dune ridges within each year was determined via summation in quadrature of the individual uncertainties (2.0 m for 2015, 3.04 m for 1978 and 3.43 m for 1952).
The digital shoreline analysis system (DSAS Version 4.3) was used to first establish measurement locations at 50-m spacing for all major dunes identified within selected subsampling areas and then to calculate dune migration statistics [42]. End point rates were calculated for three periods within the active dune features; 1952–1978, 1978–2015 and 1952–2015. Poor resolution of the 1952 imagery in the vegetated, inactive dune field only allowed for analysis of features between 1978 and 2015. Within each time frame, the standard deviation of the migration rate was calculated by finding the square root of the sum of the squares of each of the two dune crest positional errors and dividing that value by the number of years within the respective time frame.

3. Results

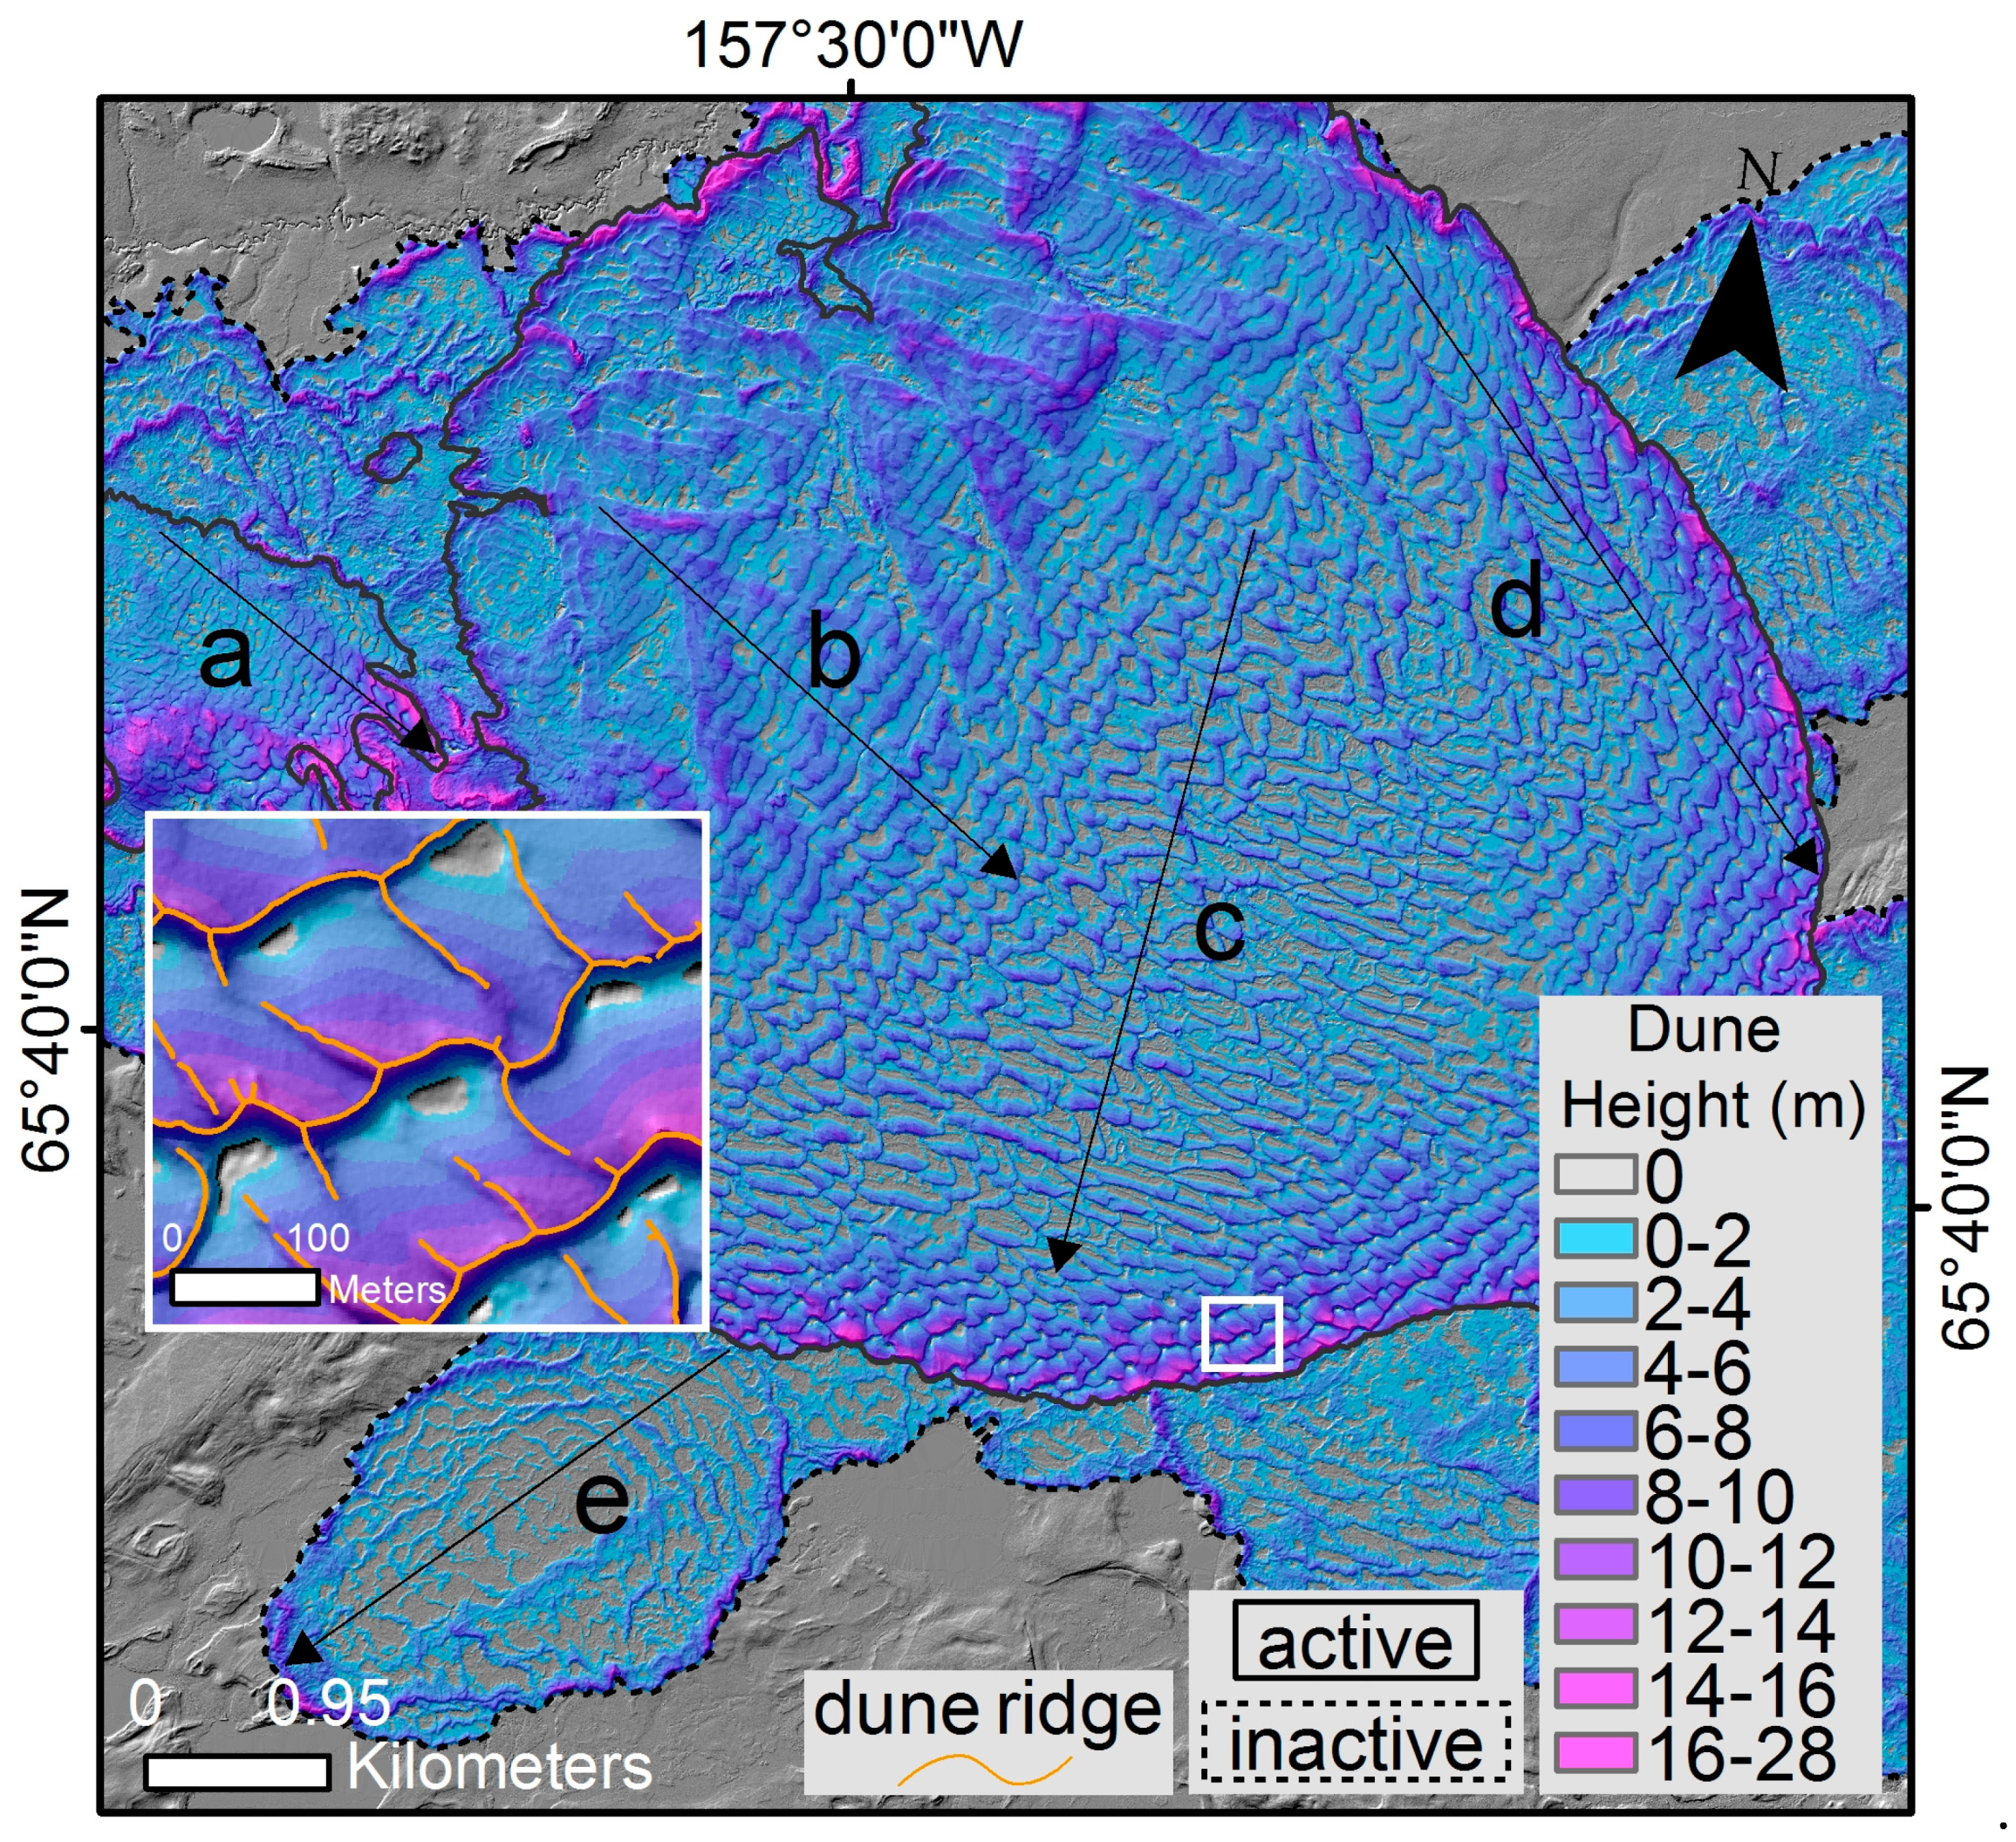
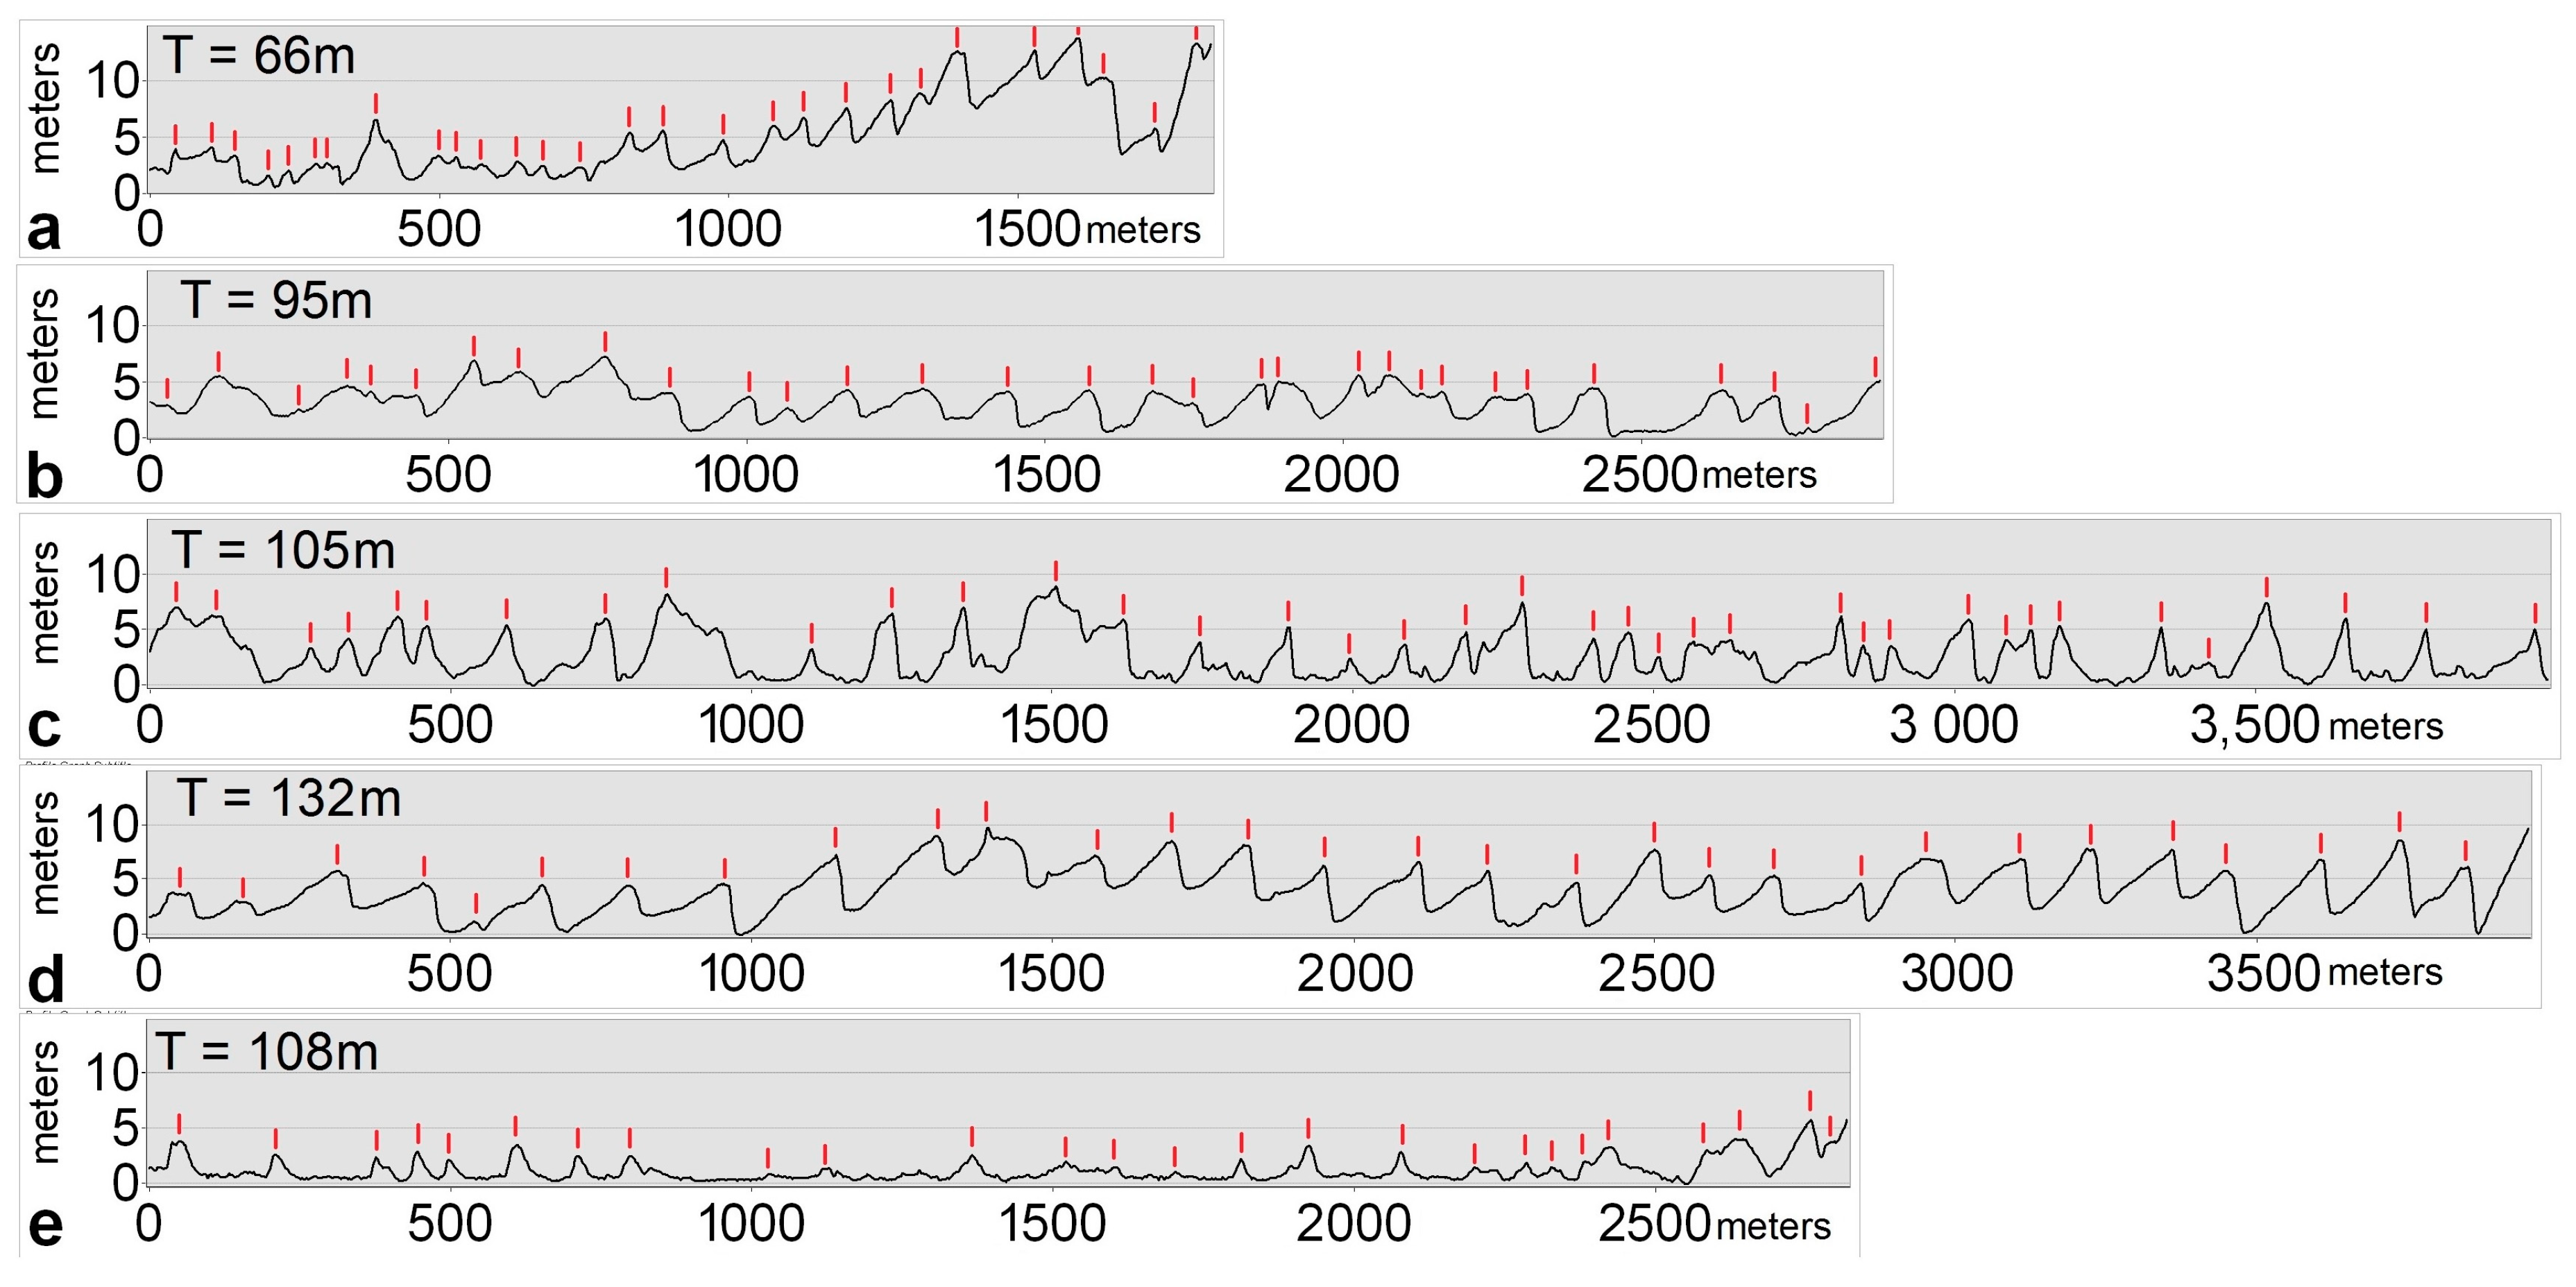
3.1. Dune Characteristics

The LiDAR data provided a digital elevation model at an unprecedented scale for this location. This allowed for visualization and mapping of dune forms in and surrounding the Nogahabara Sand Dunes. Active dunes and immediately adjacent inactive dunes overlie three interpreted relic longitudinal dunes of unknown age (Figure 2). These dunes are oriented with their long axis at approximately 45 degrees. Within the active dune field, ten secondary dunes underlie the modern active dune crests (Figure 2). These secondary dunes are oriented at roughly 138 degrees. Their historical migration direction would have been to the southwest or northeast. The present-day active dune field currently occupies 42.5 km2 when delimited by near-zero percent vegetation cover along the margins; shrubs, sedges, mosses and spruce trees remain sparsely scattered across the dunes. Active primary dune features are numerous and highly variable with 654.6 km and 765.9 km of dune crest features delimited within the active and inactive dunes, respectively.
Active dune heights averaged 5.8 m with a maximum dune height of 28.1 m. Inactive dune heights averaged 4.9 m with a maximum of 22.1 m (Figure 5). These maximum dune heights occurred on the western portion of the active dunes fields and are due to a combination of accumulated sand overlying poorly-defined near surface bedrock. Mean crest-to-crest spacing is variable throughout the dune field. Dune spacing was very regular within some portions of the active dune field (Transects b, c, d) and irregular in others (Transects a, e). Four transects within the active dunes had average dune spacing that ranged from 66 m to 132 m (Figure 6).

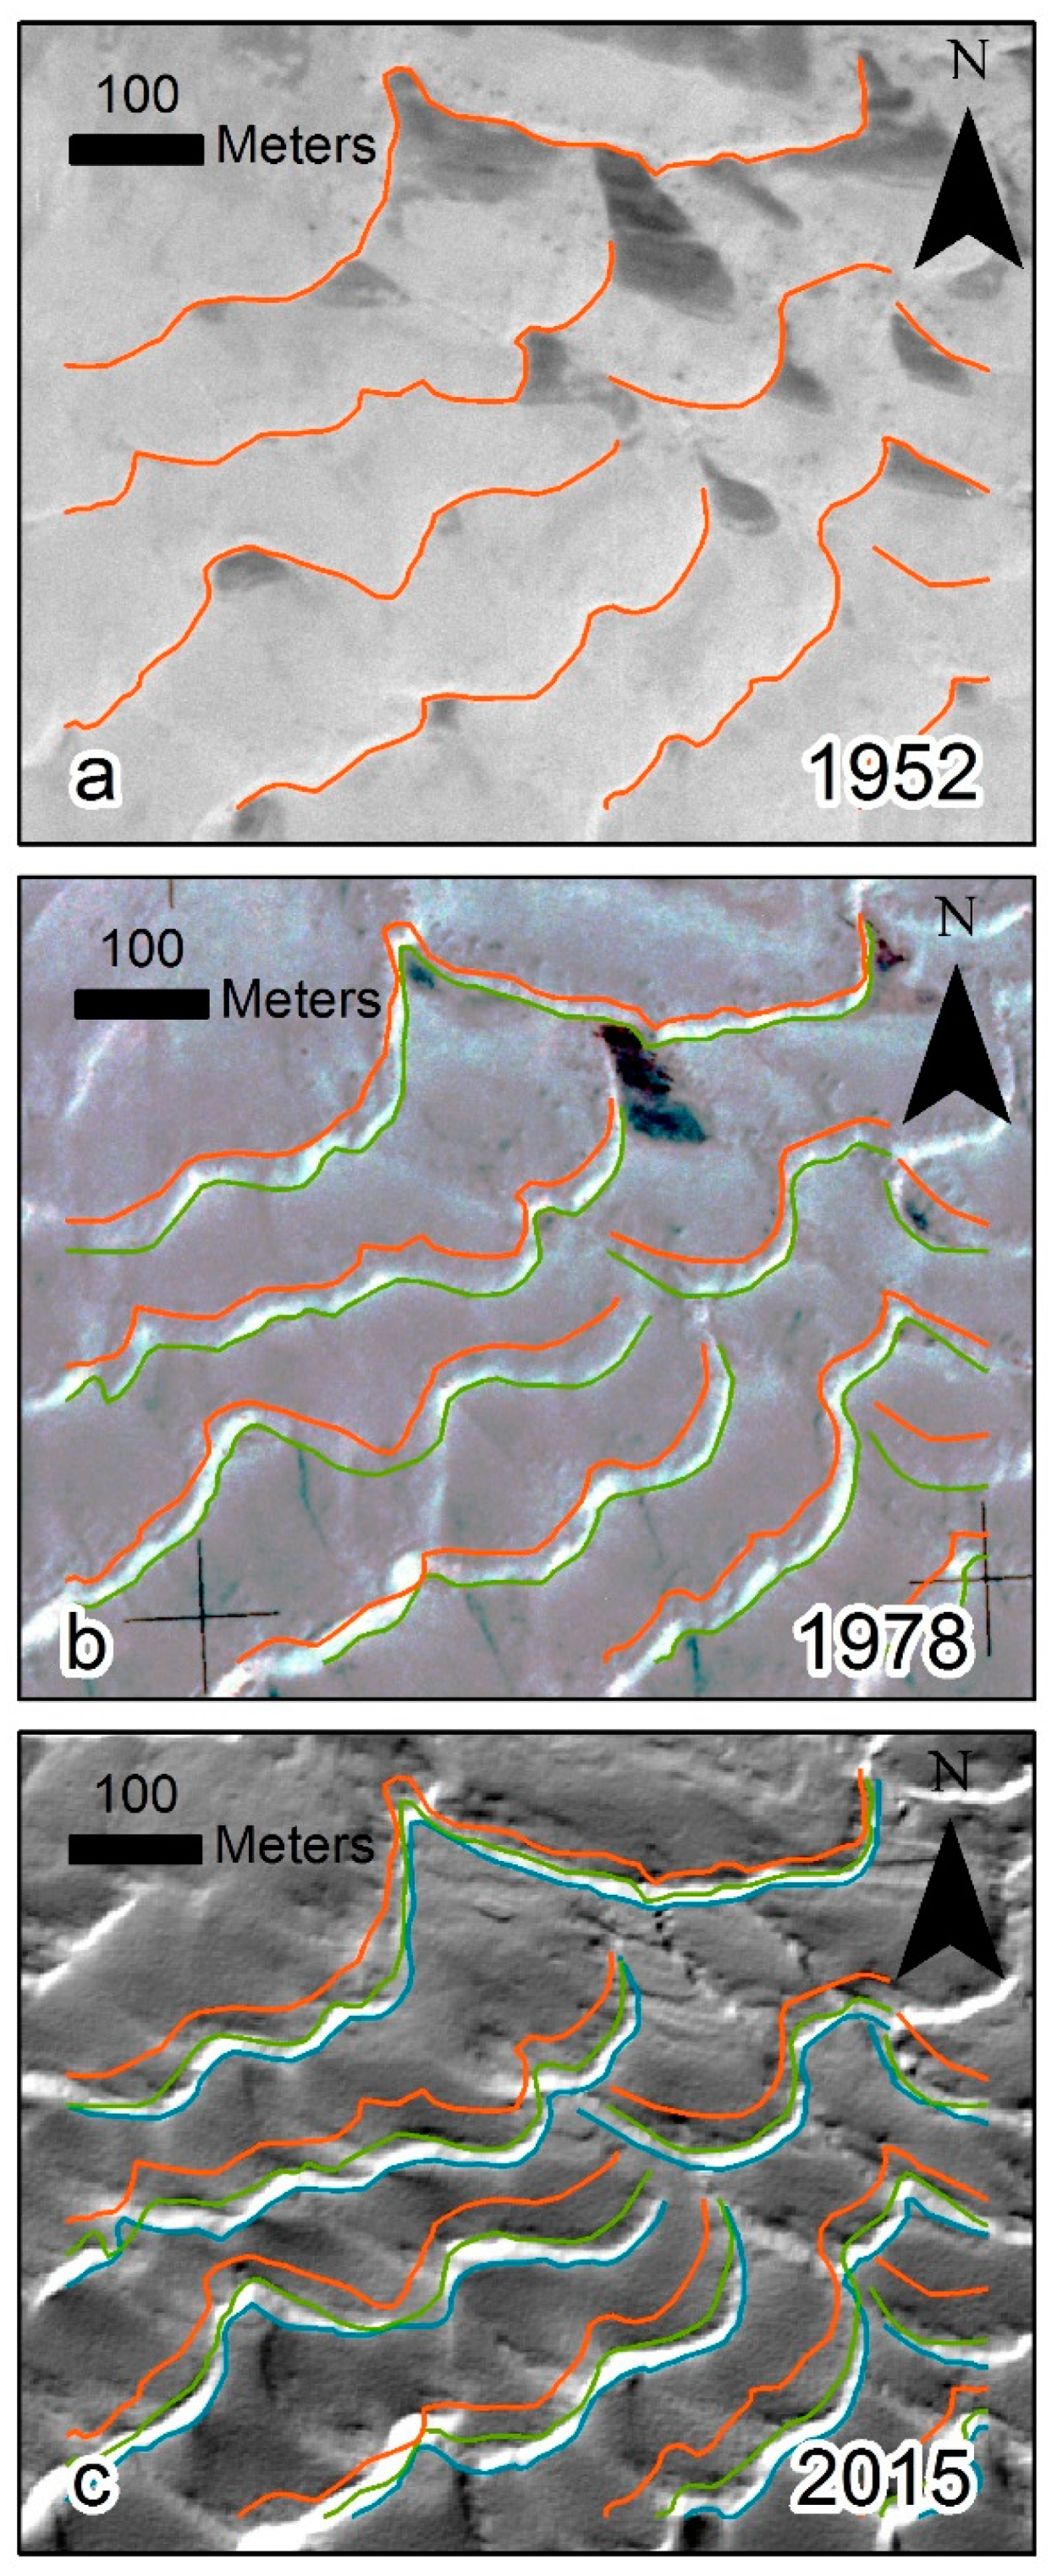
3.2. Migration Rates

Between 1952 and 2015, active dunes in the Nogahabara dune field migrated on average, to the southeast or south, at a rate of 0.52 ± 0.21 m a−1 (Figure 7, Table 1). Two prominent dune headings are visible in the mapped dune crests. While the majority of the dunes migrated to the southeast, roughly at 165°, a central, semi-deflated portion of the dunes has a mean dune heading of approximately 200° (Figure 2). This is the same region Koster et al.’s [22] mapping efforts described as having linear arrangements of blowouts. Additionally, dune crests located near the periphery of the active dune field migrated toward the edge of the dune field regardless of heading. This migration gives the impression of the expansion of the dune field outward into the surrounding forest.
Dune migration rates are spatially variable (Table 1). The three greatest average migration rates for individual subsample areas were 0.84 ± 0.06 m a−1 (Region a62), 0.81 ± 0.06 m a−1 (Region a83) and 0.80 ± 0.06 m a−1 (Region a109; Table 1). These higher rates were associated with migration directions between 120° and 125°. The three lowest average migration rates of individual subsample areas were 0.25 ± 0.06 m a−1 (Region a128), 0.32 ± 0.06 m a−1 (Region a67) and 0.33 ± 0.06 m a−1 (Region a45) and were associated with dunes migrating to the south (200°) and north (340°), respectively. Within inactive dunes, migration rates were estimated to be near zero (0.06 ± 0.06 m a−1) and give a good indication of the total error in interpretive and georegistration measurements (Table 2). No large-scale dune activation or stabilization was observed between 1952 and 2015. Portions of the dune field that appeared active or stable in 1952 remained in the same state through the period of study.
Dune migration rates were also variable temporally. Dune migration rates between 1952 and 1978 averaged 0.68 ± 0.31 m a−1, but between 1978 and 2015, the average migration rate decreased to 0.43 ± 0.16 m a−1. Between 1952 and 1978, the greatest migration rate was 1.13 ± 0.18 m a−1 (Region a62), while the lowest migration rate was 0.32 ± 0.18 m a−1 (Region a128). Between 1978 and 2015, the greatest migration rate was 0.63 ± 0.09 m a−1 (Region a62), while the lowest migration rate was 0.21 ± 0.09 m a−1 (Region a128). Some subsample areas saw a marked change in migration rates between time periods, while others (Regions a93, a26) remained near constant (Table 1).

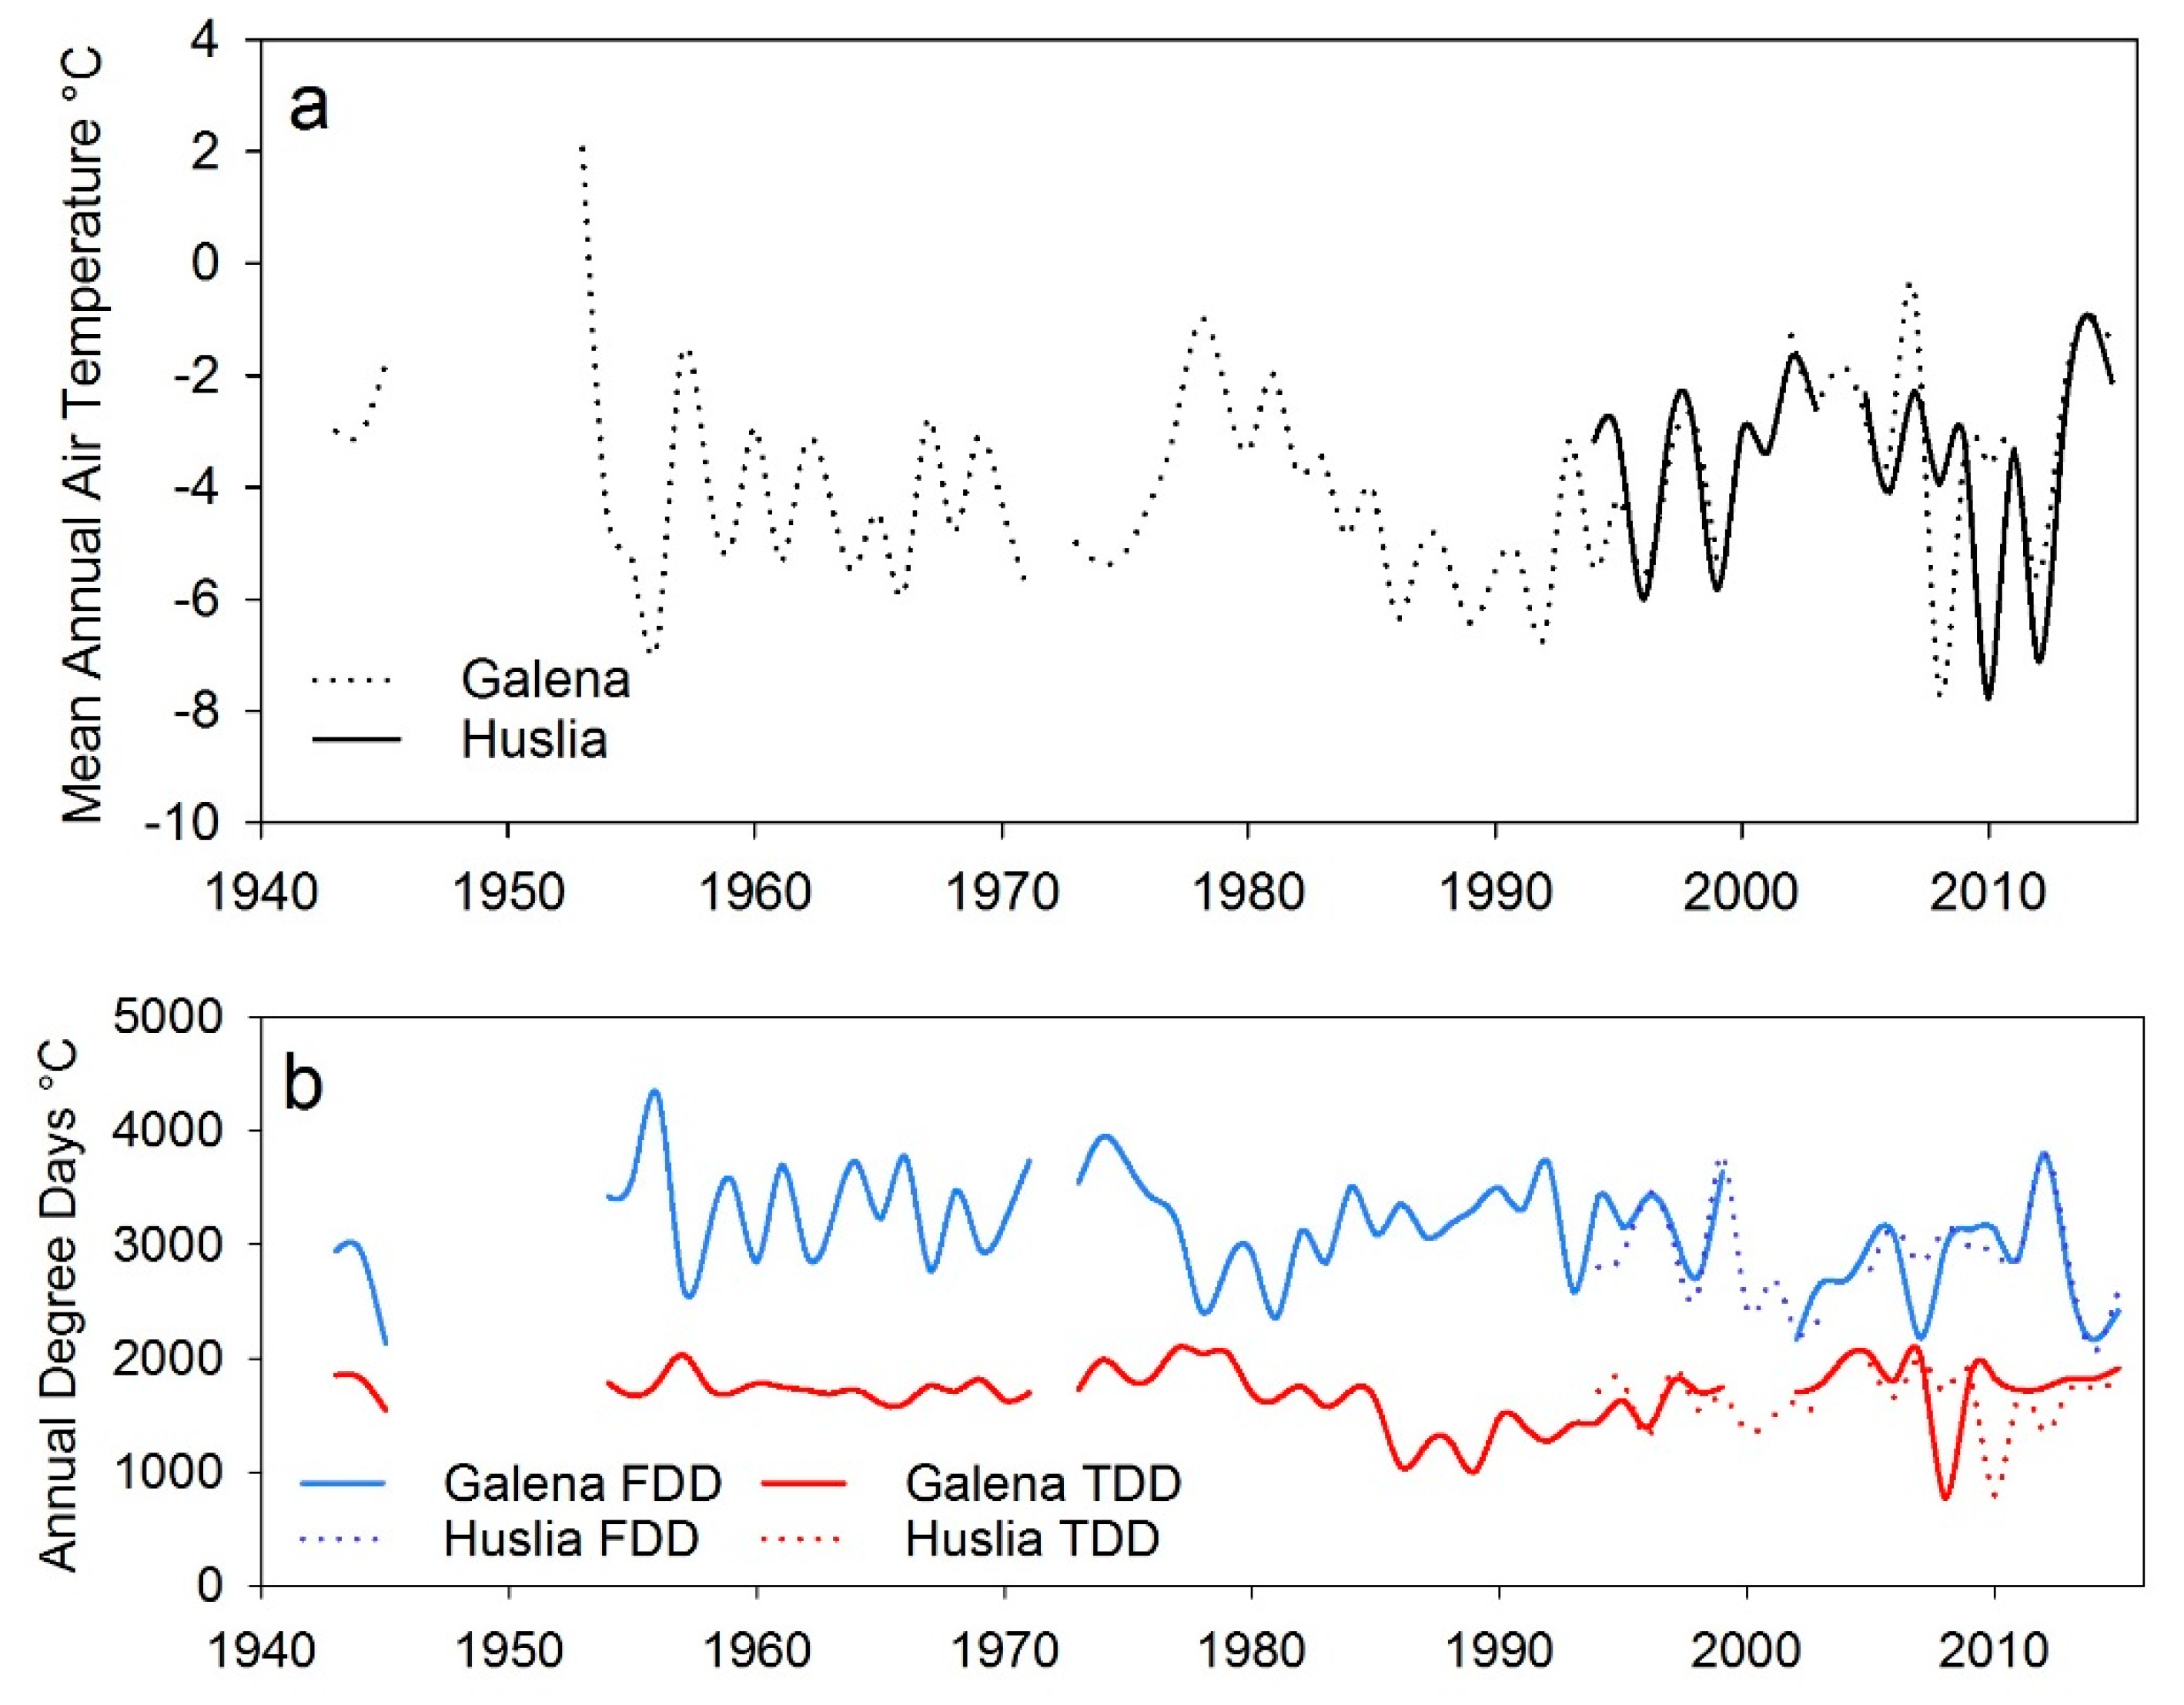
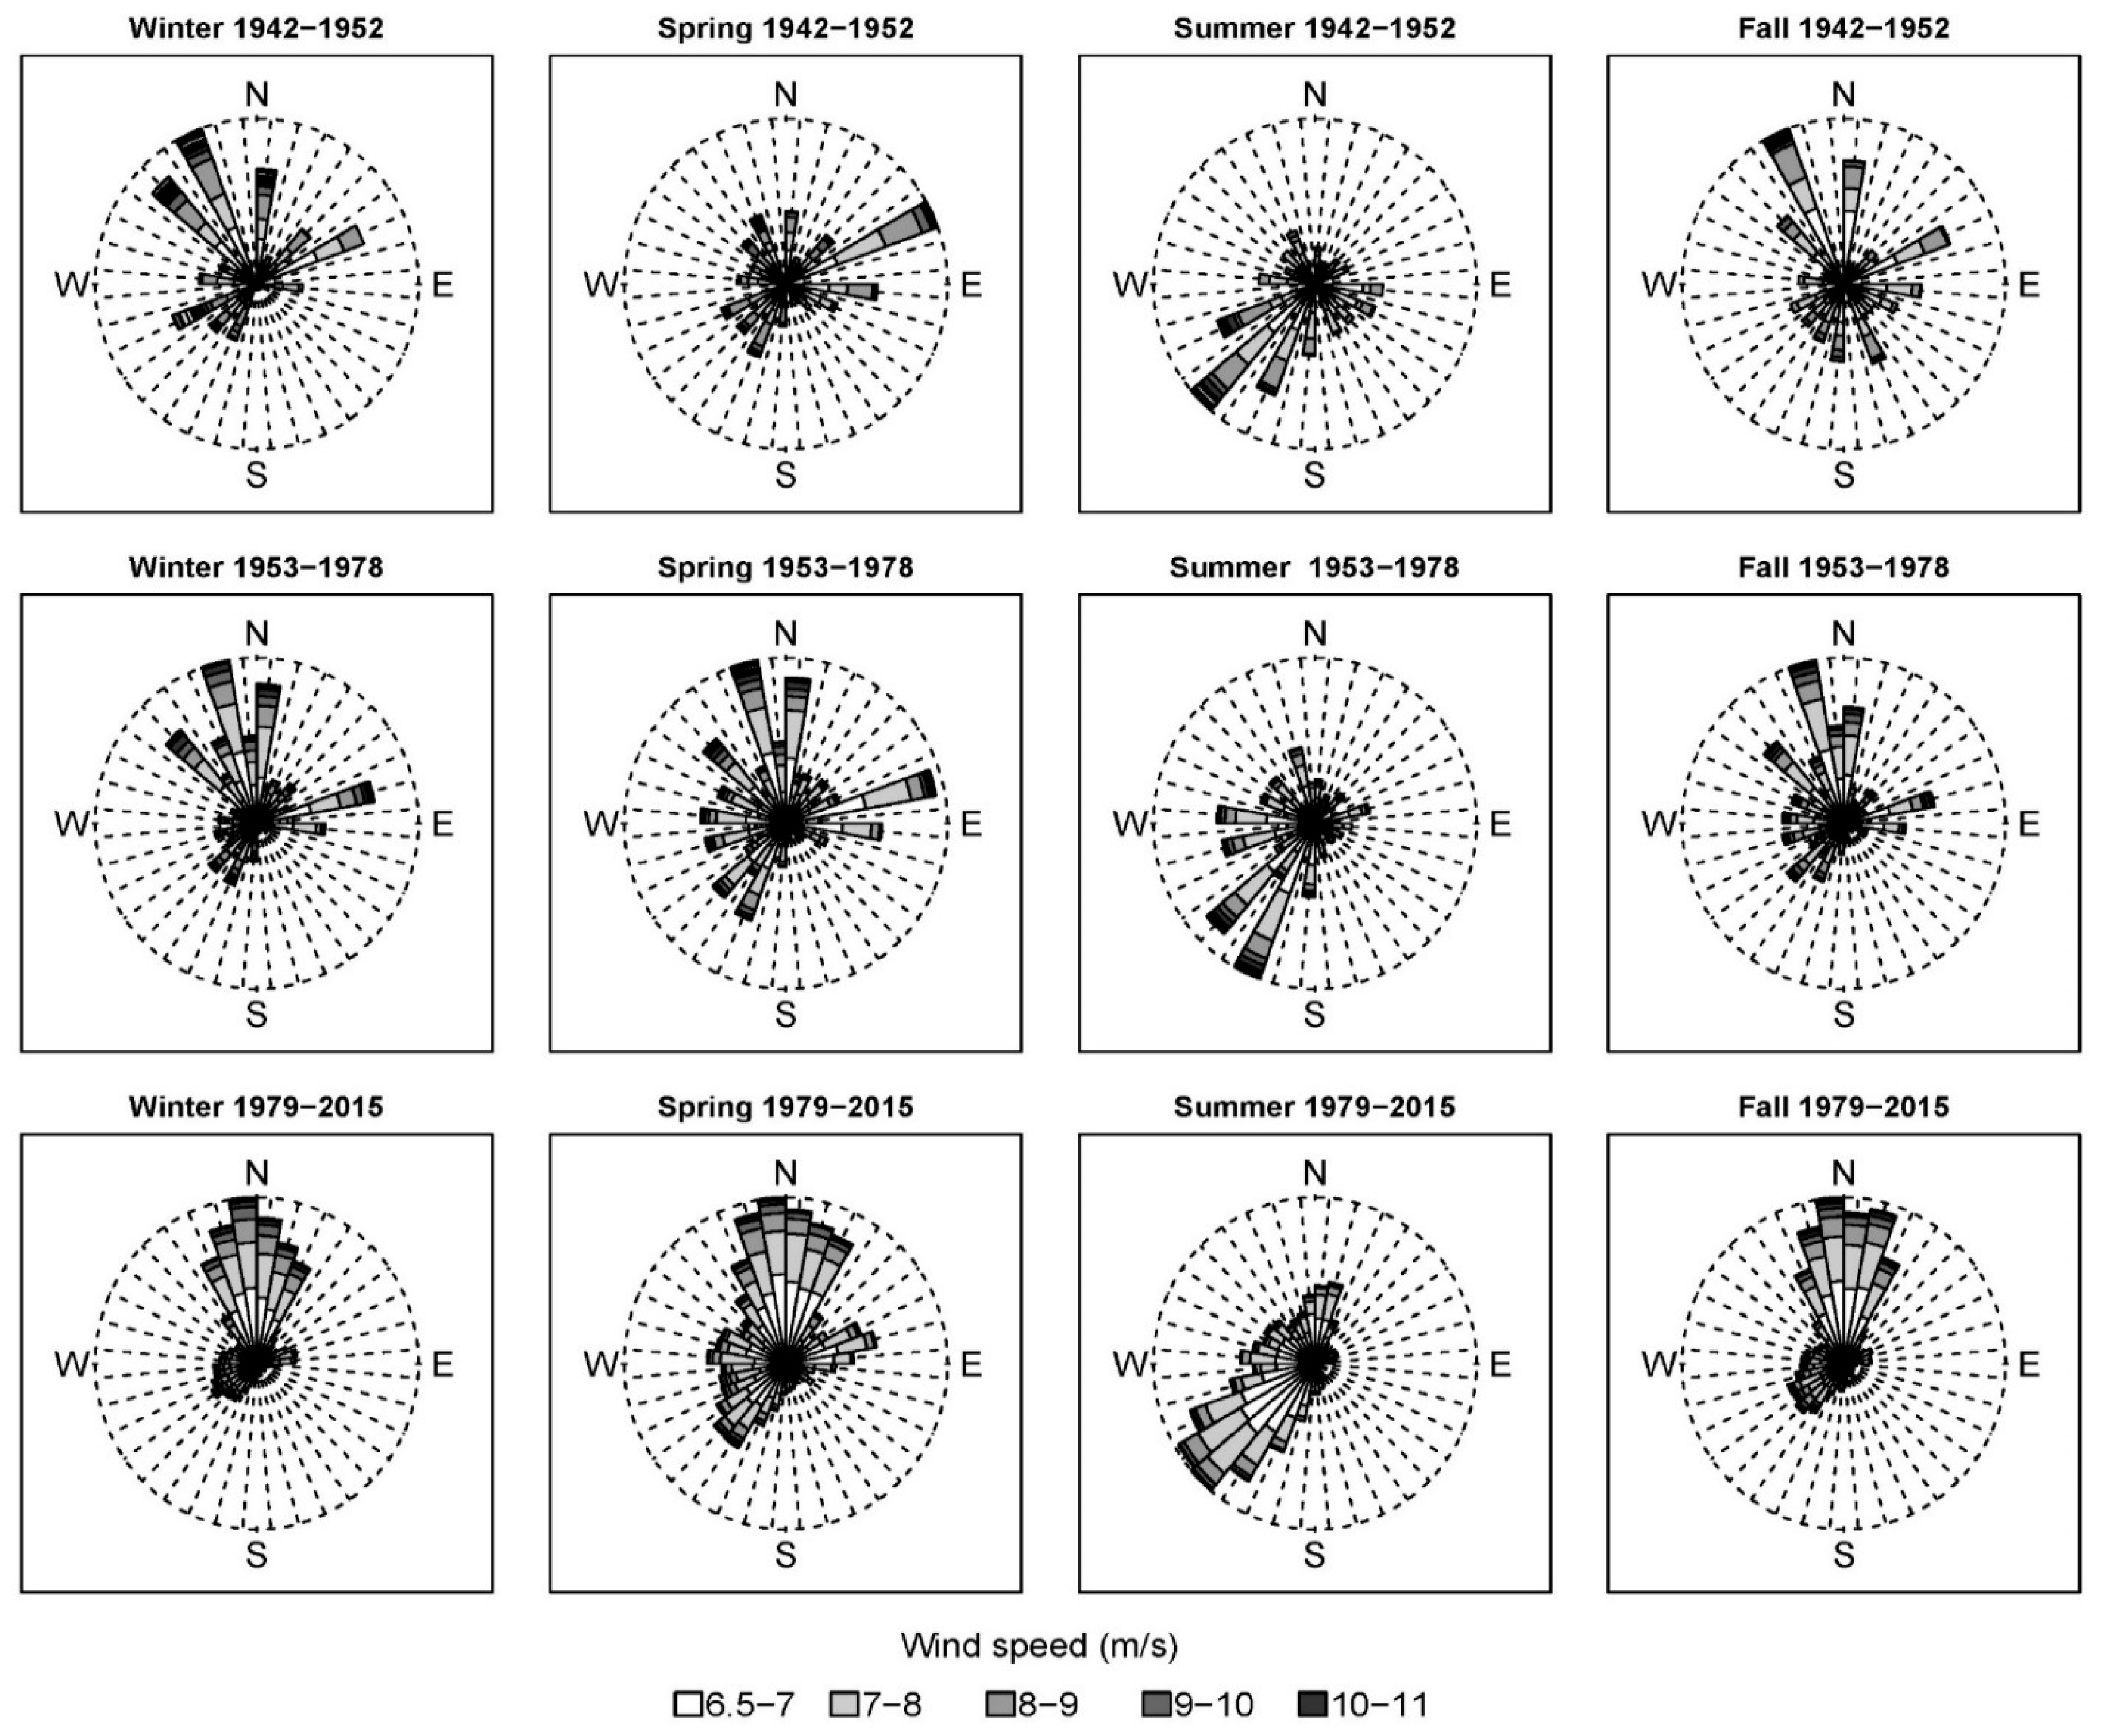
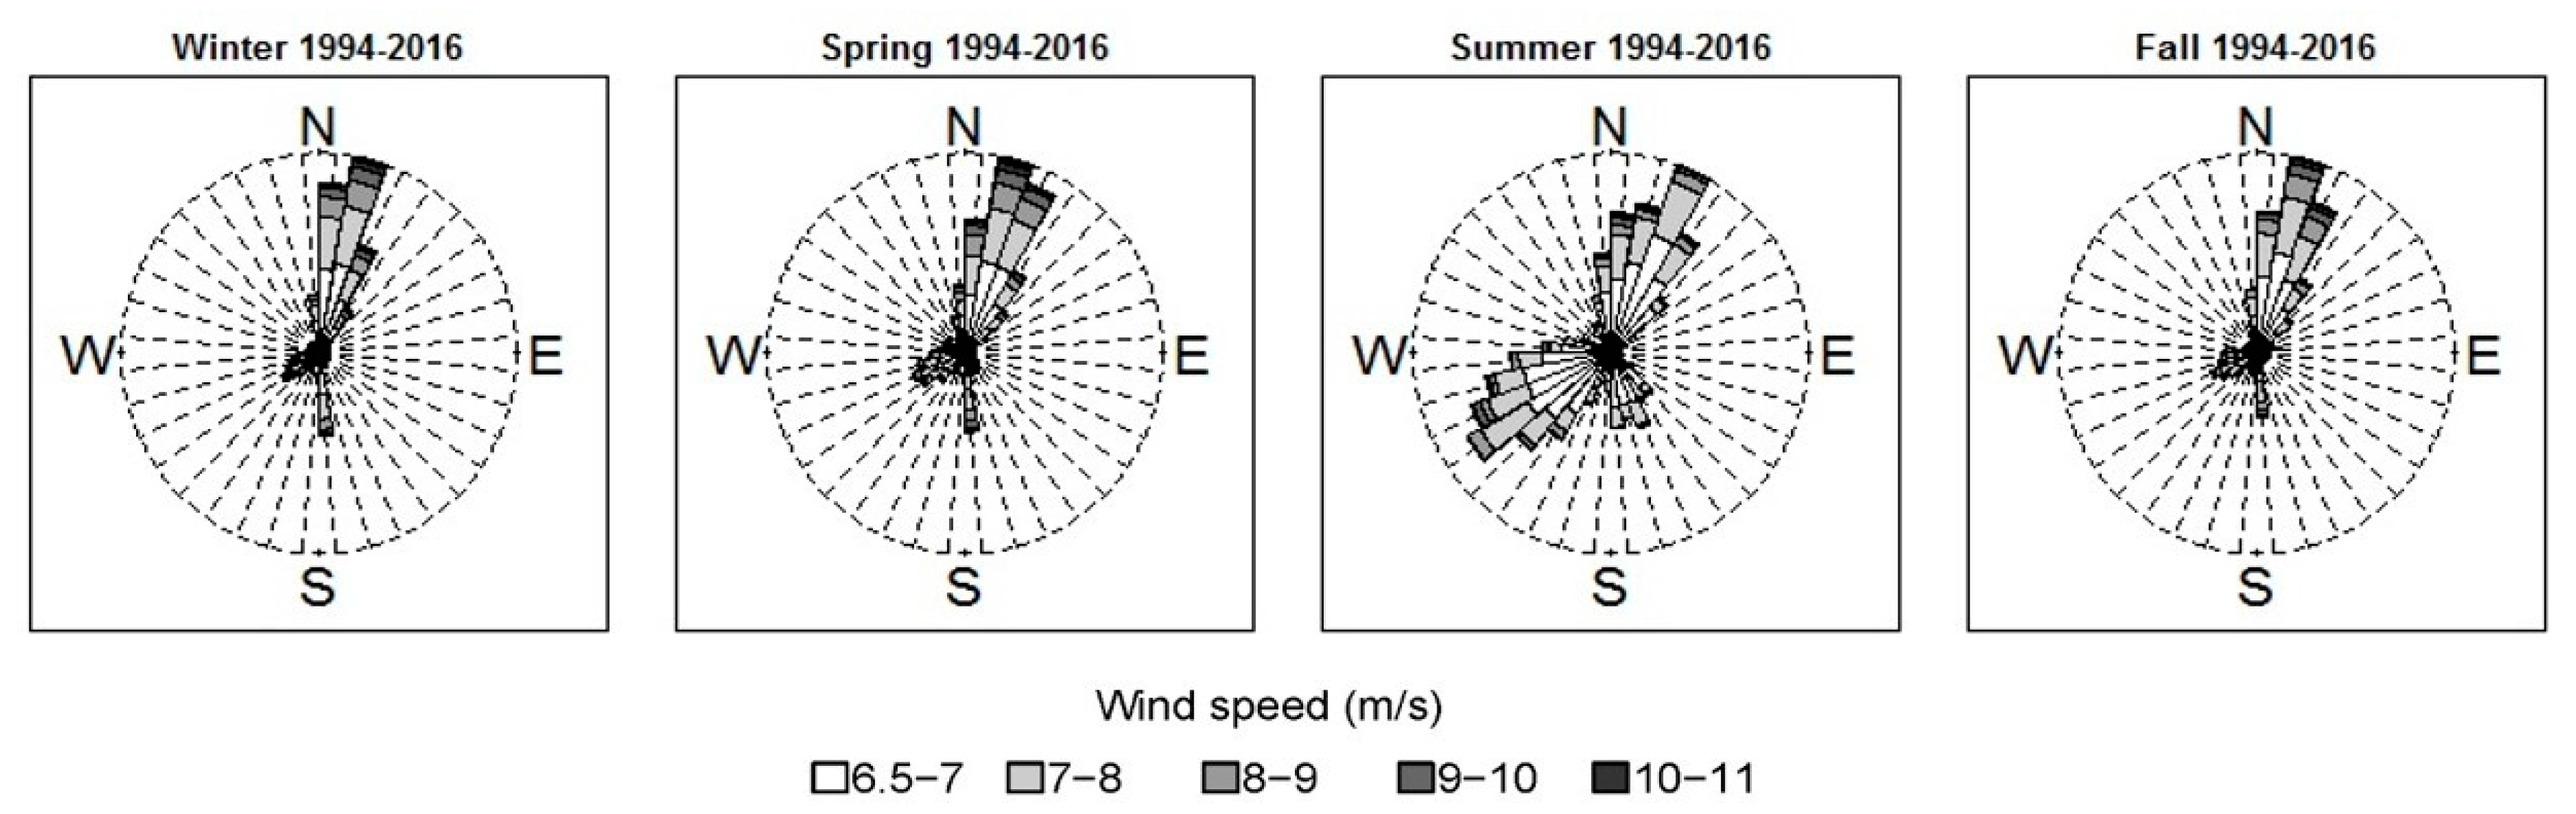
3.3 Historical Climate Conditions

Mean annual air temperature for the Nogahabara region as indicated by the Galena and Huslia weather records has fluctuated between 0 and −6 °C, but shows no overall trend (Figure 8a). There was a slight negative trend in freezing degree days measured at Galena, but little to no change in thawing degree days (Figure 8b). Temperature records in Huslia are not long enough to determine regional trends with confidence, but MAAT at Huslia closely tracks Galena MAAT.
In Galena, the prevailing winds are from the north throughout most of the year with a marked change during summer months when winds emanate from the southwest (Figure 9). In Huslia, annual winds are also variable with the prevailing winds emanating from the north/northeast, except in summer, when winds can also emanate from the southwest (Figure 10). In Galena, predominant seasonal winds appear to have remained consistent in their origins since 1942. Some small deviation may be explained by missing data from the earlier half of the record. Data are most consistent through the 1979–2015 period and best depict the seasonal trends in wind speed and direction (Figure 9). Huslia wind speed and direction are slightly different from Galena possibly due to regional topographic differences. While these data are the best proxy for wind conditions at the Nogahabara Sand Dunes, their marked differences suggest that conditions at Nogahabara could be different and emphasizes the need and value of direct measurements.

4. Discussion

4.1. Morphology and Dynamics of Dunes in Cold vs. Temperate Regions

Cold-climate dunes often possess unique origins and seasonal controls on sediment transport not present in warm-climate dune fields. Many cold-climate dunes owe their origins to sediment produced from glacial and glacio-fluvial transport, as well as glacier-dependent wind regimes [43]. Modern cold-climate dunes, with the exception of polar dunes, experience less aridity than warm-climate dunes. Therefore, summer rainfall and winter snow accumulations are more likely for these systems, which can reduce sediment transport rates and produce unique bedding patterns [44].
Attributes of the Nogahabara dunes align with the existing knowledge of cold climate dunes. The non-arid climate is attested by the surrounding spruce forests and wetlands. Dune migration rates at Nogahabara are slow compared to warm-climate dunes (Table 3) and similar to the nearby GKSD. These slow rates are due to seasonal rains and winter snow cover [45]. Seasonal snow cover barricades sand from transporting winds, and seasonally-frozen water near the ground surface immobilizes most of the sand during long winters. Warm-season rains also play a role in minimizing the sand that is available to be lofted by wind. This agrees with other observations that Arctic dunes have slower migration rates than warm-climate dunes [10,46]. Interestingly, the maximum migration rate of Nogahabara dunes (nearly 1.0 m a−1) is comparable to some warm-temperate [38] and arid low latitude dune migration rates [47,48]. This suggests sediment transport events within Nogahabara may be brief and intense in order to ‘keep pace’ with dunes in locations where sediment transport is possible nearly year-round. Clearly, the present climate is not capable of promoting the large migration rates (>10 m a−1) found in other arid mid- and low-latitude dune fields [40,49,50,51].
Dune migration rates appear to have been greater before 1978. The decrease in migration rates after 1978 corresponds with a slight negative trend in freezing degree days as measured at Galena. This slightly cooler period may have also experienced reduced winter precipitation, which would have promoted greater winter-time sand transport. Such conditions are thought to have promoted dune activation throughout Alaska during the Pleistocene. Future detailed measurements of local air temperature, precipitation, ground temperature and sand transport at Nogahabara Sand Dunes would help validate this hypothesis.
Alternating wind directions through the seasons, similar to those documented for Galena and Huslia, may be a unique attribute responsible for shaping dune orientation, slowing overall migration rates and producing the distinct radiating dune ridges of the Nogahabara Sand Dunes. The dominant, sand-transporting winds at the GKSD are polar easterlies from November–April [45] and are reflected by consistent dune orientation. In the case of Nogahabara dunes, the dominant sand-transporting winds emanate from the northwest, as indicated by the orientation of the majority of active dunes. Like Galena, winds must be seasonally or spatially variable across the dune field to produce dune migration in every direction, particularly along the margins. This variability produces dunes that appear to be migrating “off” the active dune field in a radial fashion, which may be the foundation for the distinctive rosette dune features in the region and the circular nature of the Nogahabara dunes. A similar process was proposed for rosette dunes found near Dune Lake, Alaska, in the Yukon-Kuskokwin River region [28]. Finally, a complex history of wind direction since the Pleistocene appears to have produced multiple episodes of dune formation at Nogahabara. The secondary dunes persisting in the active field suggest that prominent winds were historically from the northeast or southwest; significantly different from today. The larger relict longitudinal (or elongated parabolic) dunes also suggest a northeasterly wind with sediment transport to the southwest [27].
In total, the patterns and processes found at the Nogahabara Sand Dunes and other cold climate dune fields provide an excellent planetary analog site for studying how a water cycle influences sand transport under conditions similar to those of Martian polar deserts, especially ancient Mars, which studies suggest was warmer and wetter than the planet is today [52].

4.2. Cold Region Dunes and Permafrost

With the possible exception of elongated parabolic type dunes (hairpin dunes) described from the GKSD, no specific dune forms characteristic of, or restricted to, periglacial and/or permafrost environments have been observed [59]. Within the GKSD, no permafrost has been found within the active dune field to date, and the field is characterized by typical transverse and barchan-like dunes. Even when permafrost is present as is the case in Victoria Valley [10], where permafrost occurs 0.3–0.5 m below the dune surface, many classic dune forms are common. Many sub-Arctic dunes do not possess permafrost despite occurring within a permafrost zone. The Hietatievat dune field of northern Finland was found to be free of permafrost due to thick winter snow cover [60].

4.3. Potential Role of Fire, Permafrost Loss and Climate Change on Interior Alaska, Dune Field Activation and Ecosystem Impacts

Large areas of land in Alaska have the potential to experience sand dune reactivation given sufficient climate and landscape disturbance. Massive, now-dormant sand sheets cover Alaska’s Coastal Plain, and Pleistocene-aged loess deposits are common within the interior of Alaska (Figure 1). While these deposits are relicts of the vastly different climate of the Pleistocene and early Holocene [12,61], there are historical instances of dune reactivation following removal of sufficient amounts of overlying vegetation by physical or climactic events [54]. Climate alone can require centuries to reactivate dunes [62]. A combination of climate-induced drying and fire can more rapidly activate dunes. In the GKSD, disruption of vegetation led to permafrost thaw, which promoted sand transport out of canoe-shaped blow-outs [63]. This pattern is observed at the Nogahabara dunes in recently-burned areas (Figure 11). Fire has played a role in dune reactivation or deflation in northern Lapland [64], Finnish Lapland [20], eastern Canada [65] and the Great Lakes region [66]. Burning is one of a suite of factors implicated in dune reactivation in both the American Midwest [67] and on the Dutch coast [68]. Alternatively, an increase in air temperature and precipitation could lead to a continuation of inactivation of the large and active sand dunes that became dormant during the Pleistocene-Holocene transition. Increased snow cover and rain fall could further slow sediment transport, permitting the establishment of litter and vegetation cover and the overall colonization of now active dune fields.
Loss of permafrost or seasonally-frozen ground within inactive dune environments could also lead to reactivation. Seasonally-frozen sand may limit the annual availability of sediment for wind transport [6,69] and at the very least can preserve prehistoric aeolian deposits [5]. Such mechanisms are proposed for the GKSD where semipermeable soil horizons may perch water tables, thereby increasing near surface soil moisture [70]. The role of permafrost and seasonal frost in dune geomorphology is insufficiently described [6], but potentially significant. In addition to landscape change on Earth, the terrestrial relationships between sand-dune morphology and permafrost has been valuable for interpreting sand-dune morphology on extraterrestrial bodies including Mars [46].
Little is known about when the relict sand dunes, sand sheets and loess accumulations found throughout Alaska were last active and for how long; nor is it exactly understood what environmental factors caused dune activation or how they might respond to predicted changing climatic conditions. Climate models for Alaska predict a warmer and drier climate, as well as increased fire frequency and burn severity [8]. The Arctic and sub-Arctic have already experienced thirty years of climate warming [71] and are expected to undergo further warming at rates greater than the rest of the planet [72]. Investigating the interrelations of fire, permafrost, snow and sand dune morphology at the Nogahabara Sand Dunes and elsewhere in the Arctic could provide important insight for management decisions, species conservation and future landscape dynamics in Alaska and other cold-climate dunes on Earth. The use of bio-physical models that model vegetation, permafrost, snow and fire responses to climate, as well as the resulting mobility of sand dunes [73] could help develop predictive models of sand dune response to climate change and better model change in areas characterized by eolian deposits.

5. Conclusions

This study sought to characterize the Nogahabara dune field as it occurs today, to quantify how active the dunes have been over the past 60 years and to examine possible drivers of sand dune activity in the region. A key component of this study was the acquisition of LiDAR data and their incorporation with a mix of historical remote sensing datasets to facilitate this land change study. Using a LiDAR-derived DEM and a GIS, we automated precise dune crest delineation as an objective way to quantify dune spacing and orientation. We also used these data to estimate and depict dune height across the field. Most significantly, we utilized 1952 black and white aerial imagery, 1978 color infrared aerial imagery and the 2015 LiDAR to examine dune migration rates within the Nogahabara Sand Dunes over the past 60 years. To date, no migration rates have previously been estimated for Nogahabara. While some studies had estimated dune migration direction, these estimates often disagreed and were based solely on the appearance of the dunes. Our study quantifies the last 60 years of dune movement and demonstrates the variety of dune migration directions at Nogahabara. While we detected variation in dune migration rates through time, our assessment of potential climatic drivers was inconclusive. Finally, the combination of LiDAR and orthophoto data collected over dunes offers one of the most detailed and up-to-date geospatial datasets for the dunes and immediate area and represents the first LiDAR campaign dedicated to a sub-Arctic dune field. It is hoped that these data will continue to improve our understanding of this, as well as other cold-climate dune systems.

Author Contributions

B.M.J. and K.L.B. conceived of and designed the experiments. C.F.L. performed the LiDAR acquisition. C.A.B. and B.M.J. analyzed the data. E.H., D.H.M. and J.S. contributed analysis tools. C.A.B. and B.M.J. wrote the paper.

Acknowledgments

Funding for this research was provided by the U.S. Geological Survey Land Change Science and Land Remote Sensing programs, the U.S. Fish and Wildlife Service and the University of Alaska Fairbanks. Any use of trade, product or firm names is for descriptive purposes only and does not imply endorsement by the U.S. Government.

Conflicts of Interest

The authors declare no conflicts of interest.

References

  1. Thomas, D.S.G.; Wiggs, G.F.S. Aeolian system responses to global change: Challenges of scale, process and temporal integration. Earth Surf. Process. Landf. 2008, 33, 1396–1418. [Google Scholar] [CrossRef]
  2. French, H.M. Periglacial geomorphology. Prog. Phys. Geogr. 1979, 3, 264–273. [Google Scholar] [CrossRef]
  3. Pye, K.; Tsoar, H. Aeolian Sand and Sand Dunes; Springer Science & Business Media: Berlin, Germany, 2008; ISBN 978-3-540-85910-9. [Google Scholar]
  4. Tsoar, H. The ecological background, deterioration and reclamation of desert dune sand. Agric. Ecosyst. Environ. 1990, 33, 147–170. [Google Scholar] [CrossRef]
  5. Wolfe, S.; Bond, J.; Lamothe, M. Dune stabilization in central and southern Yukon in relation to early Holocene environmental change, northwestern North America. Quat. Sci. Rev. 2011, 30, 324–334. [Google Scholar] [CrossRef]
  6. Koster, E.A. Ancient and modern cold-climate aeolian sand deposition: A review. J. Quat. Sci. 1988, 3, 69–83. [Google Scholar] [CrossRef]
  7. Wolfe, S.A.; Huntley, D.J.; Ollerhead, J. Relict Late Wisconsinan dune fields of the northern Great Plains, Canada. Géogr. Phys. Quat. 2004, 58, 323. [Google Scholar] [CrossRef] [Green Version]
  8. Chapin, F.S.; Oswood, M.W.; Van Cleve, K.; Viereck, L.A.; Verbyla, D.L. (Eds.) Alaska’s Changing Boreal Forest; Long-Term Ecological Research Network Series; Oxford University Press: Oxford, UK, 2006; ISBN 0-19-534832-X. [Google Scholar]
  9. Wiggs, G.F.S.; Baird, A.J.; Atherton, R.J. The dynamic effects of moisture on the entrainment and transport of sand by wind. Geomorphology 2004, 59, 13–30. [Google Scholar] [CrossRef]
  10. Bourke, M.C.; Ewing, R.C.; Finnegan, D.; McGowan, H.A. Sand dune movement in the Victoria Valley, Antarctica. Geomorphology 2009, 109, 148–160. [Google Scholar] [CrossRef]
  11. McKenna-Neuman, C.M. Role of Sublimation in Particle Supply for Aeolian Transport in Cold Environments. Geogr. Ann. Ser. A Phys. Geogr. 1990, 72, 329–335. [Google Scholar] [CrossRef]
  12. Lea, P.D.; Waythomas, C.F. Late-pleistocene eolian sand sheets in Alaska. Quat. Res. 1990, 34, 269–281. [Google Scholar] [CrossRef]
  13. Wolfe, S.A.; Gillis, A.; Robertson, L. Late Quaternary Eolian Deposits of Northern North America: Age and Extent; Geological Survey of Canada, Open File 6006; Geological Survey of Canada: Ottawa, ON, Canada, 2009.
  14. Mann, D.H.; Heiser, P.A.; Finney, B.P. Holocene history of the Great Kobuk Sand Dunes, Northwestern Alaska. Quat. Sci. Rev. 2002, 21, 709–731. [Google Scholar] [CrossRef]
  15. Galloway, J.P.; Koster, E.A. Comparison of Grain-Size Statistics from Two Northern Alaska Dune Fields; U.S. Geological Survey: Reston, VA, USA, 1984.
  16. Black, R.F. Eolian deposits of Alaska. Arctic 1951, 4, 89–111. [Google Scholar] [CrossRef]
  17. David, P.P. Stabilized dune ridges in northern Saskatchewan. Can. J. Earth Sci. 1981, 18, 286–310. [Google Scholar] [CrossRef]
  18. Kasse, C.K. Sandy aeolian deposits and environments and their relation to climate during the Last Glacial Maximum and Lateglacial in northwest and central Europe. Prog. Phys. Geogr. 2002, 26, 507–532. [Google Scholar] [CrossRef]
  19. Mountney, N.P.; Russell, A.J. Sedimentology of cold-climate aeolian sandsheet deposits in the Askja region of northeast Iceland. Sediment. Geol. 2004, 166, 223–244. [Google Scholar] [CrossRef]
  20. Seppälä, M. Aeolian Sediments in the Quaternary Record Deflation and redeposition of sand dunes in finnish lapland. Quat. Sci. Rev. 1995, 14, 799–809. [Google Scholar] [CrossRef]
  21. Willemse, N.W.; Koster, E.A.; Hoogakker, B.; van Tatenhove, F.G.M. A continuous record of Holocene eolian activity in West Greenland. Quat. Res. 2003, 59, 322–334. [Google Scholar] [CrossRef]
  22. Koster, E.A.; Galloway, J.P.; Pronk, T. Photo-Interpretation Map of Surficial Deposits and Landforms of the Nogahabara Sand Dunes and Part of the Koyukuk Lowland, Alaska; Open-File Report 84-10; U.S. Geological Survey: Reston, VA, USA, 1984.
  23. Manley, W.F.; Kaufman, D.S. Alaska PaleoGlacier Atlas. Available online: http://instaar.colorado.edu/groups/QGISL/ak_paleoglacier_atlas/ (accessed on 31 October 2016).
  24. Pastick, N.J.; Jorgenson, M.T.; Wylie, B.K.; Nield, S.J.; Johnson, K.D.; Finley, A.O. Distribution of near-surface permafrost in Alaska: Estimates of present and future conditions. Remote Sens. Environ. 2015, 168, 301–315. [Google Scholar] [CrossRef]
  25. USFWS. Koyukuk National Wildlife Refuge, Northern Unit of Innoko National Wildlife Refuge, Comprehensive Conservation Plan, Environmental Impact statement and Wilderness Review: Draft; U.S. Fish and Wildlife Service, Region 7: Anchorage, AK, USA, 1986.
  26. Cass, J.T. Reconnaissance Geologic Map of the Kateel River Quadrangle, Alaska; IMAP; U.S. Geological Survey: Reston, VA, USA, 1957.
  27. Patton, W.W., Jr. Regional Geology of the Kateel River Quadrangle, Alaska; IMAP; U.S. Geological Survey: Reston, VA, USA, 1966.
  28. Collins, F. A Vegetated Dune Field in Central Alaska; U.S. Geological Survey: Reston, VA, USA, 1985.
  29. Galloway, J.P.; Huebner, M.; Lipkin, R.; Dijkmans, J.W.A. Early Holocene Calcretes from the Subarctic Active Nogahabara Sand Dune Field, Northern Alaska. In Geologic Studies in Alaska by the U.S. Geological Survey, 1990; United States Goverment Printing Office: Washington, DC, USA, 1992. [Google Scholar]
  30. Farquharson, L. Nogahabara Reconnaissance and Initial Findings, Notes from the August 2011 Field Trip; Department of Geology, University of Alaska Fairbanks: Fairbanks, AK, USA, 2011; p. 16. [Google Scholar]
  31. USFWS. Alaska—Koyukuk National Wildlife Refuge. Available online: https://www.fws.gov/alaska/nwr/koyukuk/sanddunes.htm (accessed on 25 August 2016).
  32. NatureServe. NatureServe Explorer: Species Name Criteria—All Species—Scientific or Informal Taxonomy, Species—Informal Names. Available online: http://explorer.natureserve.org/servlet/NatureServe?init=Species (accessed on 25 August 2016).
  33. Knisley, C.B.; Woodcock, M.R.; Vogler, A.P. A new subspecies of Cicindela limbata (Coleoptera: Cicindelidae) from Alaska, and further review of the maritima group by using mitochondrial DNA analysis. Ann. Entomol. Soc. Am. 2008, 101, 277–288. [Google Scholar] [CrossRef]
  34. Bagnold, R.A. The Physics of Blown Sand and Desert Dunes; Courier Corporation: Chelmsford, MA, USA, 1941; ISBN 978-0-486-14119-0. [Google Scholar]
  35. Jones, B.M.; Arp, C.D.; Jorgenson, M.T.; Hinkel, K.M.; Schmutz, J.A.; Flint, P.L. Increase in the rate and uniformity of coastline erosion in Arctic Alaska. Cryosphere 2009, 36. [Google Scholar] [CrossRef]
  36. Choné, G.; Biron, P.M. Assessing the Relationship between River Mobility and Habitat. River Res. Appl. 2016, 32, 528–539. [Google Scholar] [CrossRef]
  37. Jones, B.M.; Grosse, G.; Arp, C.D.; Jones, M.C.; Walter Anthony, K.M.; Romanovsky, V.E. Modern thermokarst lake dynamics in the continuous permafrost zone, northern Seward Peninsula, Alaska. Biogeosciences 2011, 116, G00M03. [Google Scholar] [CrossRef]
  38. Bailey, S.D.; Bristow, C.S. Migration of parabolic dunes at Aberffraw, Anglesey, north Wales. Geomorphology 2004, 59, 165–174. [Google Scholar] [CrossRef]
  39. Dong, P. Automated measurement of sand dune migration using multi-temporal lidar data and GIS. Int. J. Remote Sens. 2015, 36, 5426–5447. [Google Scholar] [CrossRef]
  40. Redsteer, M.H.; Bogle, R.C.; Vogle, J.M. Monitoring and Analysis of Sand Dune Movement and Growth on the Navajo Nation, Southwestern United States. Available online: http://pubs.usgs.gov/fs/2011/3085/ (accessed on 29 November 2016).
  41. Wolfe, S.A.; Lemmen, D.S. Monitoring of dune activity in the Great Sand Hills region, Saskatchewan. In Holocene Climate and Environmental Change in the Palliser Triangle: A Geoscientific Context for Evaluation the Impacts of Climate Change on the Southern Canadian Prairies; Geological Survey of Canada: Ottawa, ON, Canada, 1999; Volume 534, pp. 199–210. [Google Scholar]
  42. Thieler, E.R.; Himmelstoss, E.A.; Zichichi, J.L.; Ergul, A. Digital Shoreline Analysis System (DSAS) Version 4.0—An ArcGIS Extension for Calculating Shoreline Change; version 4.2; U.S. Geological Survey Open-File Report 2008-1278; U.S. Geological Survey: Reston, VA, USA, 2012.
  43. Wolfe, S.A. High-latitude dune fields. In Encyclopedia of Quaternary Sciences; Elsevier Publishing: New York, NY, USA, 2006; pp. 599–607. [Google Scholar]
  44. Arens, S.M.; Slings, Q.; de Vries, C.N. Mobility of a remobilised parabolic dune in Kennemerland, The Netherlands. Geomorphology 2004, 59, 175–188. [Google Scholar] [CrossRef]
  45. Dinwiddie, C.L.; Michaels, T.I.; Hooper, D.M.; Stillman, D.E. Environmental Conditions and Meteorologic Context for Modification of the Great Kobk Sand Dunes, Northwestern Alaska. In Proceedings of the Conference: 3rd International Planetary Dunes Workshop: Remote Sensing and Image Analysis of Planetary Dunes, Flagstaff, AZ, USA, 12–15 June 2012; ResearchGate: Berlin, Germany, 2012. [Google Scholar]
  46. Dinwiddie, C.L.; McGinnis, R.N.; Stillman, D.E.; Bjella, K.L.; Grimm, R.E. Geophysical Mars analog studies of multiphase water in the Great Kobuk Sand Dunes, northwestern Alaska. In Proceedings of the 42nd Lunar and Planetary Science Conference, Woodlands, TX, USA, 7–11 March 2011; Volume 42, p. 2501. [Google Scholar]
  47. Ewing, R.C.; Kocurek, G.A. Aeolian dune interactions and dune-field pattern formation: White Sands Dune Field, New Mexico. Sedimentology 2010, 57, 1199–1219. [Google Scholar] [CrossRef]
  48. Sweet, M.L.; Nielson, J.; Havholm, K.; Farrelley, J. Algodones dune field of southeastern California: Case history of a migrating modern dune field. Sedimentology 1988, 35, 939–952. [Google Scholar] [CrossRef]
  49. Hermas, E.; Leprince, S.; El-Magd, I.A. Retrieving sand dune movements using sub-pixel correlation of multi-temporal optical remote sensing imagery, northwest Sinai Peninsula, Egypt. Remote Sens. Environ. 2012, 121, 51–60. [Google Scholar] [CrossRef]
  50. Jimenez, J.A.; Maia, L.P.; Serra, J.; Morais, J. Aeolian dune migration along the Ceará coast, north-eastern Brazil. Sedimentology 1999, 46, 689–701. [Google Scholar] [CrossRef]
  51. Long, J.T.; Sharp, R.P. Barchan-dune movement in Imperial Valley, California. Geol. Soc. Am. Bull. 1973, 75, 49–56. [Google Scholar] [CrossRef]
  52. Carter, J.; Loizeau, D.; Mangold, N.; Poulet, F.; Bibring, J. Widespread surface weathering on early Mars: A case for a warmer and wetter climate. Icarus 2015, 248, 373–382. [Google Scholar] [CrossRef]
  53. Necsoiu, M.; Leprince, S.; Hooper, D.M.; Dinwiddie, C.L.; McGinnis, R.N.; Walter, G.R. Monitoring migration rates of an active subarctic dune field using optical imagery. Remote Sens. Environ. 2009, 113, 2441–2447. [Google Scholar] [CrossRef]
  54. Hugenholtz, C.H.; Wolfe, S.A. Recent stabilization of active sand dunes on the Canadian prairies and relation to recent climate variations. Geomorphology 2005, 68, 131–147. [Google Scholar] [CrossRef]
  55. Yao, Z.Y.; Wang, T.; Han, Z.W.; Zhang, W.M.; Zhao, A.G. Migration of sand dunes on the northern Alxa Plateau, Inner Mongolia, China. J. Arid Environ. 2007, 70, 80–93. [Google Scholar] [CrossRef]
  56. Marín, L.; Forman, S.L.; Valdez, A.; Bunch, F. Twentieth century dune migration at the Great Sand Dunes National Park and Preserve, Colorado, relation to drought variability. Geomorphology 2005, 70, 163–183. [Google Scholar] [CrossRef]
  57. Haynes, C.V. Bagnold’s barchan: A 57-yr record of dune movement in the eastern Sahara and implications for dune origin and paleoclimate since Neolithic times. Quat. Res. 1989, 32, 153–167. [Google Scholar] [CrossRef]
  58. Barnes, J. Barchan dunes on the Kuiseb River Delta, Namibia. South Afr. Geogr. J. 2001, 83, 283–292. [Google Scholar] [CrossRef]
  59. Koster, E.A.; Dijkmans, J.W.A. Niveo-aeolian deposits and denivation forms, with special reference to the great Kobuk Sand Dunes, Northwestern Alaska. Earth Surf. Process. Landf. 1988, 13, 153–170. [Google Scholar] [CrossRef]
  60. King, L.; Seppälä, M. Permafrost thickness and distribution in Finnish Lapland; Results of geoelectrical soundings. Polarforschung 1987, 57, 127–147. [Google Scholar]
  61. Carter, L. A Pleistocene sand sea on the Alaskan Arctic coastal plain. In USGS Staff—Published Research; U.S. Geological Survey: Reston, VA, USA, 1981. [Google Scholar]
  62. Wolfe, S.A.; Huntley, D.J.; David, P.P.; Ollerhead, J.; Sauchyn, D.J.; MacDonald, G.M. Late 18th century drought-induced sand dune activity, Great Sand Hills, Saskatchewan. Can. J. Earth Sci. 2001, 38, 105–117. [Google Scholar] [CrossRef]
  63. Dijkmans, J.W.A.; Koster, E.A. Morphological development of dunes in a subarctic environment, Central Kobuk Valley, northwestern Alaska. Geogr. Ann. Ser. A Phys. Geogr. 1990, 72, 93–109. [Google Scholar] [CrossRef]
  64. Käyhkö, J.A.; Worsley, P.; Pye, K.; Clarke, M.L. A revised chronology for aeolian activity in subarctic Fennoscandia during the Holocene. Holocene 1999, 9, 195–205. [Google Scholar] [CrossRef]
  65. Filion, L.; Morisset, P. Eolian landforms along the eastern coast of Hudson Bay, Northern Québec. Nordicana 1983, 47, 73–94. [Google Scholar]
  66. Arbogast, A.F.; Packman, S.C. Middle-Holocene mobilization of aeolian sand in western upper Michigan and the potential relationship with climate and fire. Holocene 2004, 14, 464–471. [Google Scholar] [CrossRef]
  67. Mangan, J.M.; Overpeck, J.T.; Webb, R.S.; Wessman, C.; Goetz, A.F.H. Response of Nebraska Sand Hills natural vegetation to drought, fire, grazing, and plant functional type shifts as simulated by the century model. Clim. Chang. 2004, 63, 49–90. [Google Scholar] [CrossRef]
  68. Arens, S.M.; Geelen, L.H.W.T. Dune landscape rejuvenation by intended destabilisation in the Amsterdam water supply dunes. J. Coast. Res. 2006, 22, 1094–1107. [Google Scholar] [CrossRef]
  69. Niessen, A.C.; Koster, E.A.; Galloway, J.P. Periglacial Sand Dunes and Eolian Sand Sheets; An Annotated Bibliography; Open-File Report; U.S. Geological Survey: Reston, VA, USA, 1984.
  70. Dinwiddie, C.L.; McGinnis, R.N.; Stillman, D.E.; Grimm, R.E.; Bjella, K.L. Late-winter phase state of water in the Great Kobuk Sand Dunes, Alaska, and testable hypotheses for ba perching mechanism. In Proceedings of the Fifth International Conference on Mars Polar Science and Exploration, Fairbanks, AK, USA, 12–16 September 2011; Volume 1623, p. 6035. [Google Scholar]
  71. Serreze, M.C.; Walsh, J.E.; Chapin, F.S.; Osterkamp, T.; Dyurgerov, M.; Romanovsky, V.; Oechel, W.C.; Morison, J.; Zhang, T.; Barry, R.G. Observational evidence of recent change in the northern high-latitude environment. Clim. Chang. 2000, 46, 159–207. [Google Scholar] [CrossRef]
  72. Hinzman, L.D.; Kane, D.L. Potential repsonse of an Arctic watershed during a period of global warming. J. Geophys. Res. 1992, 97, 2811–2820. [Google Scholar] [CrossRef]
  73. Hugenholtz, C.H.; Wolfe, S.A. Biogeomorphic model of dunefield activation and stabilization on the northern Great Plains. Geomorphology 2005, 70, 53–70. [Google Scholar] [CrossRef]
Figure 1. Location of Nogahabara dunes with respect to Alaska and other major inactive dune fields or sand sheets including Great Kobuk Sand Dunes (GKSD) and Little Kobuk Sand Dunes (LKSD). Permafrost extent based on Pastick et al., 2015. Aeolian deposits based on Karlstrom, 1964; Jorgenson et al., 2008.
Remotesensing 10 00792 g001
Figure 2. Active Nogahabara Sand Dune (brown region within the solid line) and surrounding inactive lobes (green regions within the broken line) addressed in this study. Yellow squares denote where dune migration rates were subsampled. Subsample area i41 is located on a rosette dune feature. All graphics overlie 2015 LiDAR-derived DEM.
Remotesensing 10 00792 g002
Figure 3. (a) Western portion of the Nogahabara Dune field where dunes are migrating to the southwest; (b) ground view of wind-affected sand, sparse vegetation and scattered trees representative of the Nogahabara sand dunes; (c) Oblique view of active and recently stabilized sand deposits.
Remotesensing 10 00792 g003
Figure 4. Configuration of the LiDAR scanner (silver), GPS (yellow) and camera (black, background) within the aircraft. LiDAR scanner and camera are pointing through portholes in the belly of the aircraft.
Remotesensing 10 00792 g004
Figure 5. Dune height derived from methods described in Section 2.3. Transects a–e delineate elevation profiles depicted in Figure 6. The inset image depicts results from automated dune ridge identification. The base image is the LiDAR-derived DEM.
Remotesensing 10 00792 g005
Figure 6. (ad) The variety of mean dune spacing (T = transect length (m)/dune ridges (n)) from within the active dunes; (e) dune spacing within an inactive rosette dune feature. Red lines indicate dunes identified by the authors for each transect.
Remotesensing 10 00792 g006
Figure 7. Time series of dune migration within the a9 subsample area (see Figure 2). At this location, dune migration is to the southeast (~140°). (a) The dunes as they appear in the 1952 imagery and the digitized slipface position (orange line); (b) the same region as seen in the 1978 imagery and the digitized slipface position (green line) relative to the 1952 position (orange line); (c) the same region as seen in the 2015 LiDAR DEM and the digitized slipface location (blue line) relative to the 1978 (green) and 1952 (orange) locations.
Remotesensing 10 00792 g007
Figure 8. Climate summaries for Galena and Huslia including (a) mean annual air temperature and (b) annual totals of freezing and thawing degree days. FDD, freezing degree days; TDD, thawing degree days.
Remotesensing 10 00792 g008
Figure 9. Wind roses summarizing seasonal patterns of winds in excess of 6.5 m/s for the three study periods. Winter captures January, February and December. Spring captures March, April and May. Summer captures June, July and August. Fall captures September, October and November. Station ID: WBAN-26501.
Remotesensing 10 00792 g009
Figure 10. Wind roses summarizing seasonal patterns of winds in excess of 6.5 m/s for Huslia, AK. 1994–2016. Station ID: WBAN-26552.
Remotesensing 10 00792 g010
Figure 11. (a) Oblique aerial view of Nogahabara Sand Dunes and surrounding forest; (b) blow-out feature within the previously inactive dune field following the 2015 fire.
Remotesensing 10 00792 g011
Table 1. Dune ridge characteristics from active subsample areas (n = 10).
Subsample Area
Physical Dune Featuresa128a130a109a93a83a67a62a45a26a21a9AVG.
total active dune length (m)39014124.95933523940365708543067846157646255815396
active migration features6131191196141511910
mean dune height (m)7.395.34.54.95.37.13.66.35.166
min dune height (m)0.51.20.80.81.51.11.40.60.50.611
max dune height (m)18.118.811.49.19.713.913.69.220.110.514.414
dune height stdev (m)4.63.72.21.61.62.721.63.222.33
mean dune heading (°)34020/140125360/110120rosette12036/200250180140165
1952–1978 mig rate (ma−1) ♠0.320.451.050.551.110.431.130.480.370.670.930.68
1978–2015 mig rate (ma−1) ◊0.210.40.590.590.60.250.630.220.390.40.420.43
1952–2015 mig rate (ma−1) *0.250.410.80.570.810.320.840.330.390.510.640.52
♠ stdev = ±0.18, ◊ stdev = ±0.09, * stdev = ±0.06. stdev is derived from the error associated with image resolution and digitizing error, hence the identical stdev values within each time frame. Migration rate truncated to “mig rate”.
Table 2. Dune ridge characteristics from inactive subsample areas (n = 3).
Subsample Area
Physical Dune Featuresi77i50i41AVG.
total active dune length (m)7052839555587002
active migration features4586
mean dune height (m)353.144
min dune height (m)0.60.70.61
max dune height (m)7.511.710.110
dune height stdev (m)1.12.21.82
mean dune heading (°)165NA315240
1978–2015 mig rate (ma−1) ◊0.090.040.040.06
◊ stdev = ±0.09 stdev is derived from the error associated with image resolution and digitizing error, hence the identical stdev values within each time frame. Migration rate truncated to “mig rate”.
Table 3. Migration rates for cold and warm climate dunes.
Dune FieldlatitudeKoeppen-Geiger ClimateRate (m a−1)Citation
Great Kobuk67°00′NPolar (polar tundra)0.5–1.5[53]
Nogahabara65°41′NPolar (polar tundra)0.5–0.8this study
Zuid-Kennemerland53°23′NWarm Temperate (fully humid warm summer)0–6[44]
Aberffraw53°11′NWarm Temperate (fully humid warm summer)1[38]
Tunstall Sand Hills51°09′NArid (steppe, cold arid)10[54]
Alxa Plateau40°30′NArid (winter dry, cold arid)5.3[55]
Great Sand Dunes37°47′NArid (steppe, cold arid)1.9–10.5[56]
Grand Falls Dune Field35°25′NArid (steppe, cold arid)35[40]
Imperial Valley33°00′NArid (winter dry, hot arid)25[51]
White Sands32°48′NArid (steppe, cold arid)1–7[47]
Agodones33°00′NArid (desert, hot arid)0.08[48]
Sinai Peninsula30°30′NArid (desert, hot arid)11.9[49]
Eastern Sahara20°55′NArid (desert, hot arid)7.5[57]
Ceará Coast3°30′SEquatorial (summer dry)17.5[50]
Kuiseb River Delta22°56′SArid (desert, cold air)4.2–18.9[58]
Victoria Valley77°22′SPolar (fully humid)1.5[10]

