Atmosphere 2023, 14(4), 715; https://doi.org/10.3390/atmos14040715 - 14 Apr 2023
Cited by 4 | Viewed by 3852
Abstract
Using ERA5 reanalysis data and the tropical cyclone (TC) best track datasets from the China Meteorological Administration and Joint Typhoon Warning Center (from 1979 to 2021), TC-induced low-level winds near Taiwan Island are statistically analyzed. This study mainly concerns TC activity, low-level wind
[...] Read more.
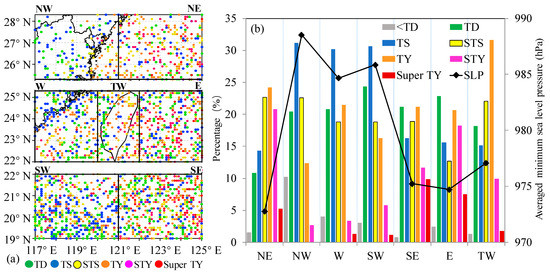
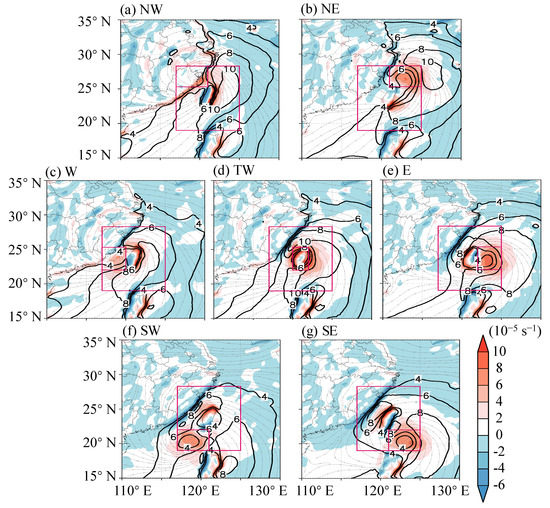
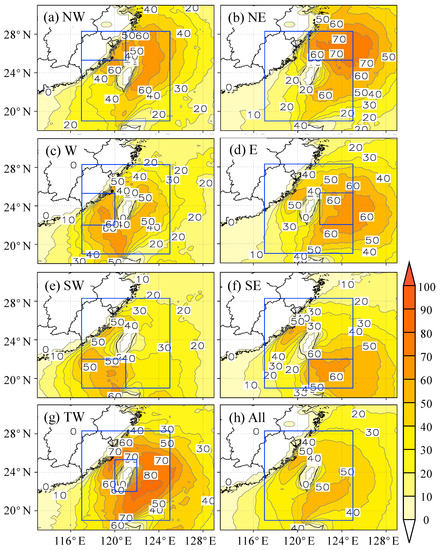
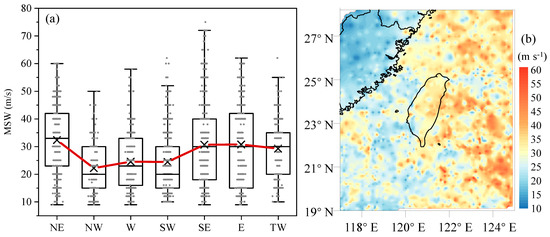
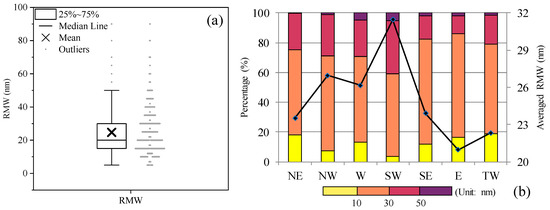
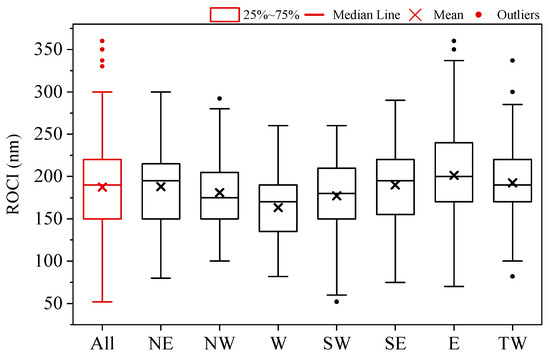
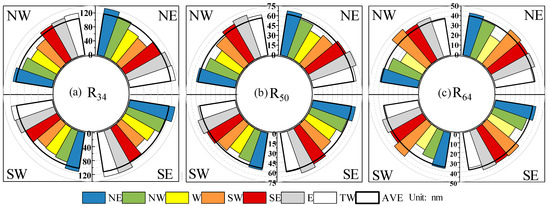
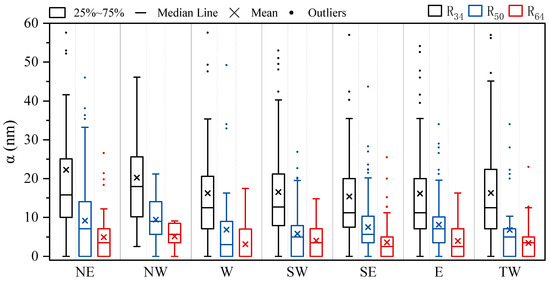
Using ERA5 reanalysis data and the tropical cyclone (TC) best track datasets from the China Meteorological Administration and Joint Typhoon Warning Center (from 1979 to 2021), TC-induced low-level winds near Taiwan Island are statistically analyzed. This study mainly concerns TC activity, low-level wind fields around Taiwan Island under TCs, and the detailed characteristics of TC wind structure. Results show that on average, 8.3 TCs enter the study region near Taiwan Island every year mainly from May to November, with more frequent and stronger TCs on the eastern and southern sides of Taiwan Island. For TC centers located at different positions around Taiwan Island, positive and negative vertical vorticity belts alternate between Taiwan Island and the TC center. Moreover, stronger and more frequent TC-induced winds mainly occur on the eastern side of Taiwan Island and the north of Taiwan Strait. TCs to the east of Taiwan Island have stronger maximum sustained wind than those on the western side of the island. Radii of the maximum wind (RMW) for TCs around Taiwan Island range from 5 to 90 nautical mile (nm, 9.3 to 116.7 km) with a mean value of 24.7 nm (44.4 km). Moreover, the RMWs of TCs are the largest (smallest) when the TC centers are located to the southwest (east) of the island. In addition, the outer sizes of TC winds vary from 52 to 360 nm (17.2 to 666.7 km) in the study region, with 187.4 nm (347.1 km) on average, and smaller values for TCs on the western side of the island. The average radii of severe winds, including R34, R50, and R64, are largest in the northeast quadrant and smallest in the southwest quadrant of the TC. The higher the specific wind speed is, the smaller the TC radius and the more symmetric its wind circle. These statistical results may provide references for TC gale forecasting and wind-resistant design for offshore engineering to mitigate TC-induced wind hazards.
Full article
(This article belongs to the Special Issue Feature Papers in Meteorological Science)
►
Show Figures
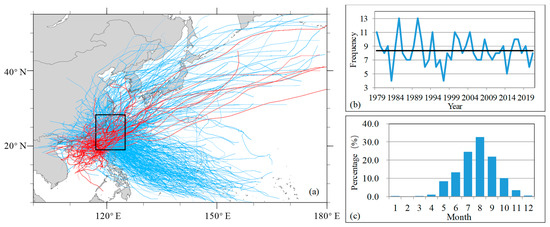
Figure 1


