Atmosphere 2021, 12(1), 20; https://doi.org/10.3390/atmos12010020 - 25 Dec 2020
Cited by 18 | Viewed by 3157
Abstract
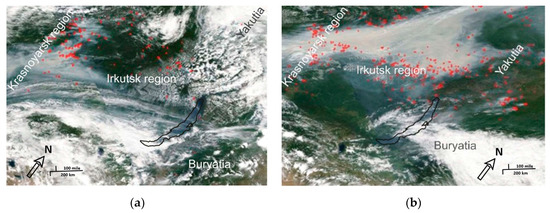
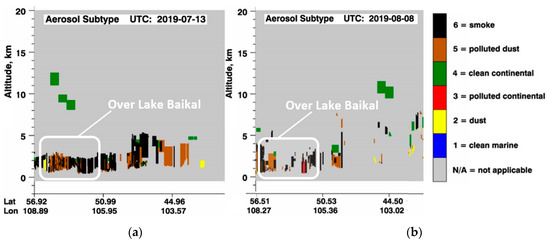
Lake Baikal—a unique ecosystem on a global scale—is undoubtedly of great interest for a comprehensive study of its ecosystem. In recent years, one of the most significant sources of atmospheric pollution in the Baikal region was the emission of smoke aerosol and trace
[...] Read more.
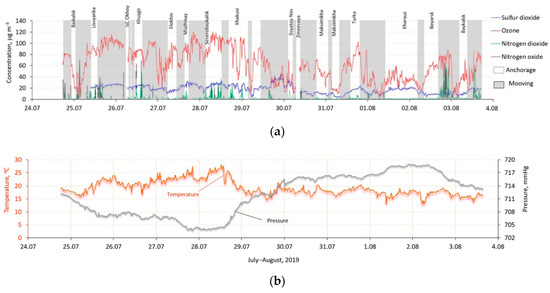
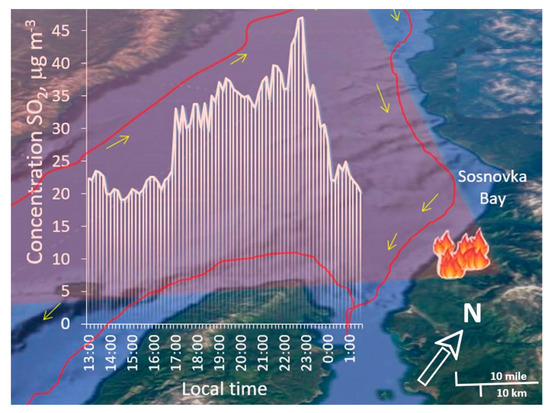
Lake Baikal—a unique ecosystem on a global scale—is undoubtedly of great interest for a comprehensive study of its ecosystem. In recent years, one of the most significant sources of atmospheric pollution in the Baikal region was the emission of smoke aerosol and trace gases from forest fires, the number of which is increasing in the region. The transport and accumulation of aerosol and small gas impurities over water area of Lake Baikal is observed every summer due to forest fires occurring in the boreal forests of Siberia. The atmosphere above the lake covers a huge area (31,500 km2) and is still a little-studied object. This article presents the results of experimental studies of ground-level ozone, sulfur dioxide, and nitrogen oxides in the atmosphere over Lake Baikal, carried out on a research vessel during the boreal forest fires in Siberia in the summer of 2019.
Full article
(This article belongs to the Special Issue Air Pollution Estimation)
►
Show Figures
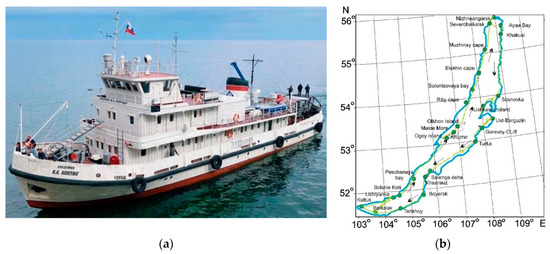
Figure 1


