by
Pradeep Wagle 1,* , Vijaya G. Kakani 2, Prasanna H. Gowda 3, Xiangming Xiao 4, Brian K. Northup 1, James P. S. Neel 1, Patrick J. Starks 1, Jean L. Steiner 5 and Stacey A. Gunter 1
, Vijaya G. Kakani 2, Prasanna H. Gowda 3, Xiangming Xiao 4, Brian K. Northup 1, James P. S. Neel 1, Patrick J. Starks 1, Jean L. Steiner 5 and Stacey A. Gunter 1
1
Grazinglands Research Laboratory, United States of Department of Agriculture-Agricultural Research Service (USDA-ARS), El Reno, OK 73036, USA
2
Department of Plant and Soil Sciences, Oklahoma State University, Stillwater, OK 74077, USA
3
United States of Department of Agriculture-Agricultural Research Service (USDA-ARS) Southeast Area, Stoneville, MS 38776, USA
4
Department of Microbiology and Plant Biology, Center for Spatial Analysis, University of Oklahoma, Norman, OK 73019, USA
5
Department of Agronomy, Kansas State University, Manhattan, KS 66506, USA
Remote Sens. 2022, 14(11), 2620; https://doi.org/10.3390/rs14112620 - 31 May 2022
Cited by 9 | Viewed by 3137
Abstract
Carbon dioxide (CO2) fluxes and evapotranspiration (ET) during the non-growing season can contribute significantly to the annual carbon and water budgets of agroecosystems. Comparative studies of vegetation phenology and the dynamics of CO2 fluxes and ET during the dormant season
[...] Read more.
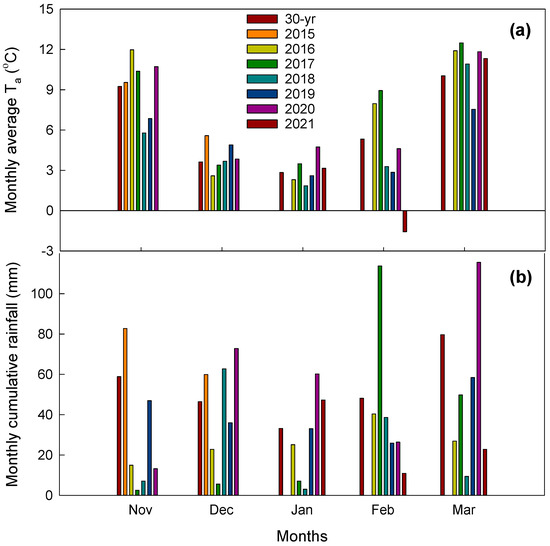
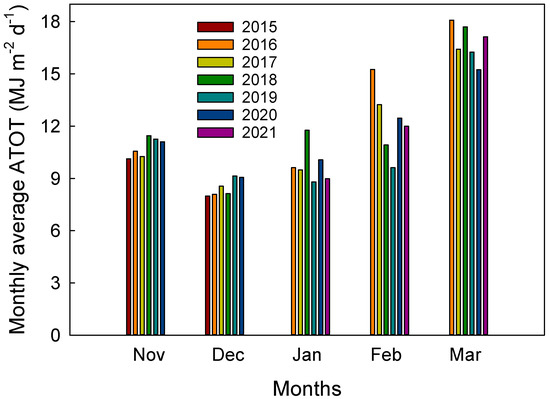
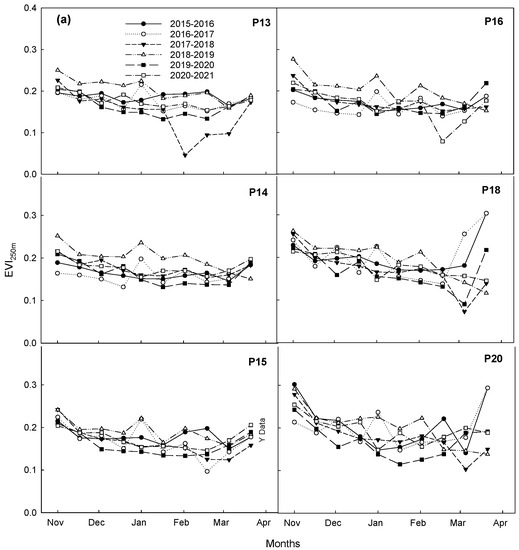
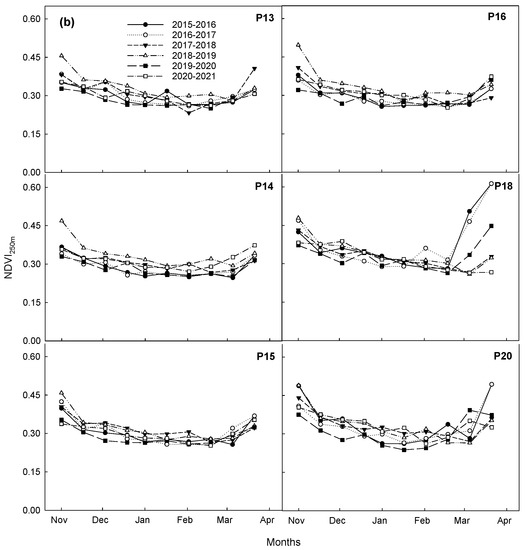
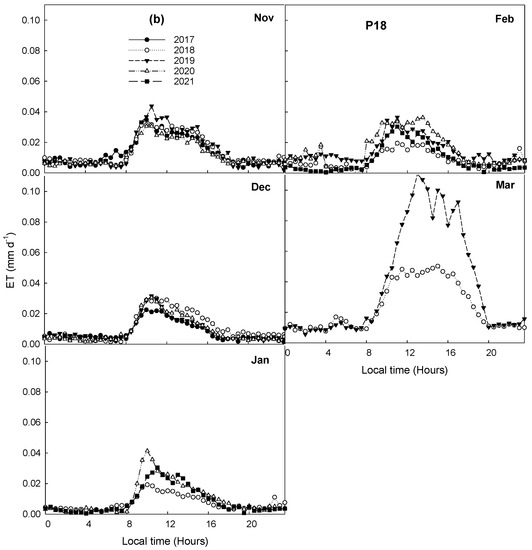
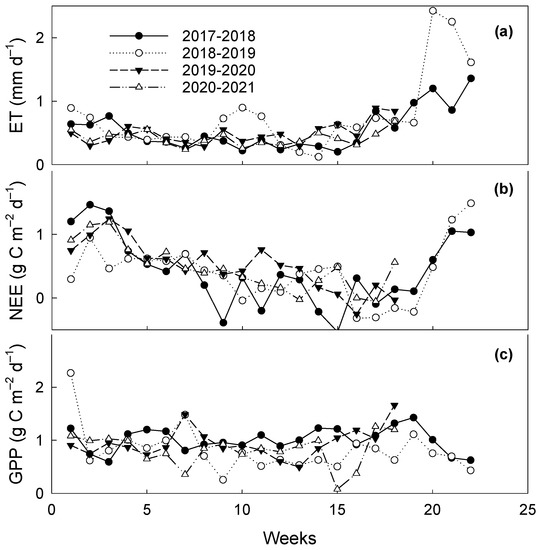
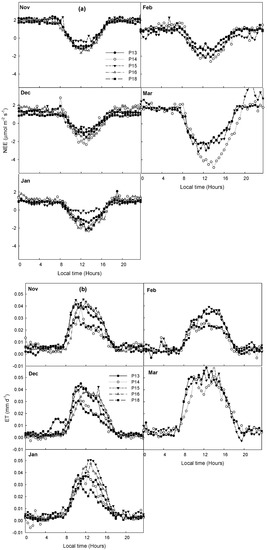
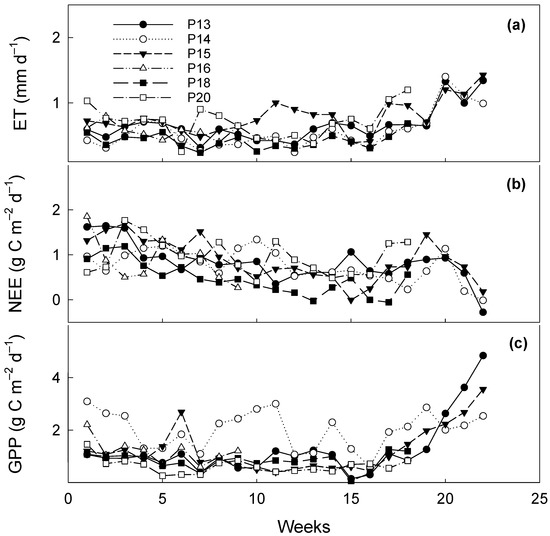
Carbon dioxide (CO2) fluxes and evapotranspiration (ET) during the non-growing season can contribute significantly to the annual carbon and water budgets of agroecosystems. Comparative studies of vegetation phenology and the dynamics of CO2 fluxes and ET during the dormant season of native tallgrass prairies from different landscape positions under the same climatic regime are scarce. Thus, this study compared the dynamics of satellite-derived vegetation phenology (as captured by the enhanced vegetation index (EVI) and the normalized difference vegetation index (NDVI)) and eddy covariance (EC)-measured CO2 fluxes and ET in six differently managed native tallgrass prairie pastures during dormant seasons (November through March). During December–February, vegetation phenology (EVI and NDVI) and the dynamics of eddy fluxes were comparable across all pastures in most years. Large discrepancies in fluxes were observed during March (the time of the initiation of growth of dominant warm-season grasses) across years and pastures due to the influence of weather conditions and management practices. The results illustrated the interactive effects between prescribed spring burns and rainfall on vegetation phenology (i.e., positive and negative impacts of prescribed spring burns under non-drought and drought conditions, respectively). The EVI better tracked the phenology of tallgrass prairie during the dormant season than did NDVI. Similar EVI and NDVI values for the periods when flux magnitudes were different among pastures and years, most likely due to the satellite sensors’ inability to fully observe the presence of some cool-season C3 species under residues, necessitated a multi-level validation approach of using ground-truth observations of species composition, EC measurements, PhenoCam (digital) images, and finer-resolution satellite data to further validate the vegetation phenology derived from the Moderate Resolution Imaging Spectroradiometer (MODIS) during dormant seasons. This study provides novel insights into the dynamics of vegetation phenology, CO2 fluxes, and ET of tallgrass prairie during the dormant season in the U.S. Southern Great Plains.
Full article
(This article belongs to the Special Issue New Developments in Remote Sensing for the Environment)
▼
Show Figures

Graphical abstract


