Remote Sens. 2021, 13(9), 1801; https://doi.org/10.3390/rs13091801 - 5 May 2021
Cited by 55 | Viewed by 6815
Abstract
The accurate delineation of urban agglomeration boundary is conductive to not only the better understanding of the development relationship between cities in urban agglomeration but also to the guidance of regional functions as well as the formulation of regional management policies. At the
[...] Read more.
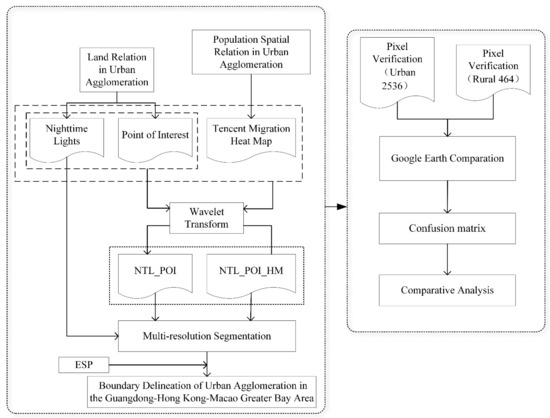
The accurate delineation of urban agglomeration boundary is conductive to not only the better understanding of the development relationship between cities in urban agglomeration but also to the guidance of regional functions as well as the formulation of regional management policies. At the same time, the fusion of land relations and urban internal relations can greatly improve the accuracy of the delineation of urban agglomeration boundary. Still, for all that, previous studies delineated the boundary only from the perspective of land relations. In this study, firstly, wavelet transform is used to fuse Night-time Light data (NTL), POI (Point of Interest) data and Tencent Migration data, respectively. Then, the image is segmented by multiresolution segmentation to delineate the urban agglomeration boundary of GBA. Finally, the results are verified. The results show that the accuracy of urban agglomeration boundary delineated by NTL data is 85.57%, with the Kappa value as 0.6256, respectively. While, after fusing POI data, the accuracy is 88.97%, with the Kappa value as 0.7011, respectively. What is more, the accuracy of delineating urban agglomeration boundary by continuous fusion of population movement data reaches 93.60%, and that of Kappa value as 0.8155. Therefore, it can be concluded that compared with delineating the boundary of urban agglomeration only based on land relations, the fusion of population movement data of urban agglomerations by wavelet transform strengthens the interconnection between cities in urban agglomeration and contributes to the accurate division of urban agglomeration boundaries. What is more, such accurate delineation not only has important practical value for optimizing the spatial structure of urban agglomerations, but also assists in the formulation of regional management and development planning policies.
Full article
(This article belongs to the Special Issue Applications of AI and Remote Sensing in Urban Systems)
►
Show Figures
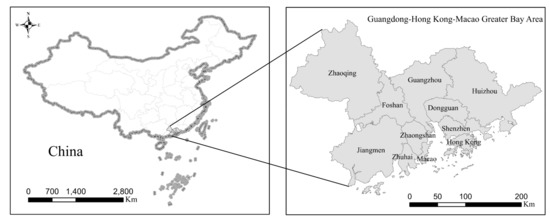
Figure 1


