Next Issue
Volume 7, April
Previous Issue
Volume 7, February


ISPRS Int. J. Geo-Inf., Volume 7, Issue 3 (March 2018) – 48 articles

Cover Story (view full-size image): 
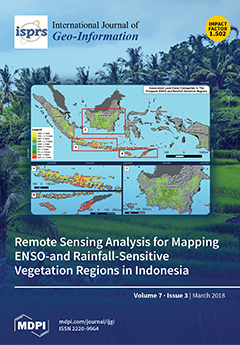
Ongoing global warming has increased the frequency and magnitude of ENSO which has affected the region of Asia-Pacific, including Indonesia. Multiple, long time-series remote sensing observations from 1993 to 2012, evaluating indicators such as the Normalized Difference Vegetation Index (NDVI), Enhanced Vegetation Index (EVI), and Vegetation Optical Depth (VOD), were combined with measurements of the climate index and of the Multivariate ENSO Index (MEI) and with the examination of CHIRPS rainfall data to identify climate-sensitive regions. The analysis identified savanna in Indonesia as the most sensitive biome to ENSO and precipitation. Further cross-correlation analysis determined the progression of ENSO, affecting rainfall and vegetation, in the climate-sensitive region. The identified region can be kept under monitoring to timely plan mitigation actions and reduce the negative impact of ENSO on [...] Read more.
  • Issues are regarded as officially published after their release is announced to the table of contents alert mailing list.
  • You may sign up for e-mail alerts to receive table of contents of newly released issues.
  • PDF is the official format for papers published in both, html and pdf forms. To view the papers in pdf format, click on the "PDF Full-text" link, and use the free Adobe Reader to open them.
Order results
Result details
Select all
Export citation of selected articles as:
15 pages, 57113 KiB  
Article
Procedural Generation of Large-Scale Forests Using a Graph-Based Neutral Landscape Model
by Jiaqi Li, Xiaoyan Gu, Xinchi Li, Junzhong Tan and Jiangfeng She
ISPRS Int. J. Geo-Inf. 2018, 7(3), 127; https://doi.org/10.3390/ijgi7030127 - 20 Mar 2018
Cited by 3 | Viewed by 6473
Abstract
Specifying the positions and attributes of plants (e.g., species, size, and height) during the procedural generation of large-scale forests in virtual geographic environments is challenging, especially when reflecting the characteristics of vegetation distributions. To address this issue, a novel graph-based neutral landscape model [...] Read more.
Specifying the positions and attributes of plants (e.g., species, size, and height) during the procedural generation of large-scale forests in virtual geographic environments is challenging, especially when reflecting the characteristics of vegetation distributions. To address this issue, a novel graph-based neutral landscape model (NLM) is proposed to generate forest landscapes with varying compositions and configurations. Our model integrates a set of class-level landscape metrics and generates more realistic and variable landscapes compared with existing NLMs controlled by limited global-level landscape metrics. To produce patches with particular sizes and shapes, a region adjacency graph is transformed from a cluster map that is generated based upon percolation theory; subsequently, optimal neighboring nodes in the graph are merged under restricted growth conditions from a source node. The locations of seeds are randomly placed and their species are classified according to the generated forest landscapes to obtain the final tree distributions. The results demonstrate that our method can generate realistic vegetation distributions representing different spatial patterns of species with a time efficiency that satisfies the requirements for constructing large-scale virtual forests. Full article
Show Figures

Figure 1

21 pages, 2627 KiB  
Article
Mining Individual Similarity by Assessing Interactions with Personally Significant Places from GPS Trajectories
by Mengke Yang, Chengqi Cheng and Bo Chen
ISPRS Int. J. Geo-Inf. 2018, 7(3), 126; https://doi.org/10.3390/ijgi7030126 - 19 Mar 2018
Cited by 17 | Viewed by 4571
Abstract
Human mobility is closely associated with places. Due to advancements in GPS devices and related sensor technologies, an unprecedented amount of tracking data has been generated in recent years, thus providing a new way to investigate the interactions between individuals and places, which [...] Read more.
Human mobility is closely associated with places. Due to advancements in GPS devices and related sensor technologies, an unprecedented amount of tracking data has been generated in recent years, thus providing a new way to investigate the interactions between individuals and places, which are vital for depicting individuals’ characteristics. In this paper, we propose a framework for mining individual similarity based on long-term trajectory data. In contrast to most existing studies, which have focused on the sequential properties of individuals’ visits to public places, this paper emphasizes the essential role of the spatio-temporal interactions between individuals and their personally significant places. Specifically, rather than merely using public geographic databases, which include only public places and lack personal meanings, we attempt to interpret the semantics of places that are significant to individuals from the perspectives of personal behavior. Next, we propose a new individual similarity measurement that incorporates both the spatio-temporal and semantic properties of individuals’ visits to significant places. By experimenting on real-world GPS datasets, we demonstrate that our approach is more capable of distinguishing individuals and characterizing individual features than the previous methods. Additionally, we show that our approach can be used to effectively measure individual similarity and to aggregate individuals into meaningful subgroups. Full article
(This article belongs to the Special Issue Place-Based Research in GIScience and Geoinformatics)
Show Figures

Figure 1

23 pages, 1081 KiB  
Article
Digital Story Mapping to Advance Educational Atlas Design and Enable Student Engagement
by Margo E. Berendsen, Jeffrey D. Hamerlinck and Gerald R. Webster
ISPRS Int. J. Geo-Inf. 2018, 7(3), 125; https://doi.org/10.3390/ijgi7030125 - 19 Mar 2018
Cited by 25 | Viewed by 7709
Abstract
Storytelling is recognized as a valid and important method of communicating information and knowledge gleaned from volumes of ever-accumulating data. Practices of data-driven storytelling in journalism and geovisual analytics have contributed to the development of geovisual stories; also called story maps. The benefits [...] Read more.
Storytelling is recognized as a valid and important method of communicating information and knowledge gleaned from volumes of ever-accumulating data. Practices of data-driven storytelling in journalism and geovisual analytics have contributed to the development of geovisual stories; also called story maps. The benefits of student-focused multi-thematic atlases and digital storytelling methods in education can also be realized in story maps. An online, interactive version of the original paper version of the Wyoming Student Atlas was developed using story mapping technology. Studies on best practices for data-driven storytelling and web map interaction were used to inform the transition of the atlas from a traditional paper format to a collection of story maps. Evaluation of the atlas story maps for educational purposes was conducted by observing students from multiple classrooms as they used the story maps in a lesson. The students and educators responded to a survey after using the story maps. Results of the survey show positive responses to the atlas story maps, including ease of use and preference over a traditional paper atlas. However, certain types of interaction with the map resulted in increased negative or uncertain responses from students concerning their perception of the atlas story maps. Full article
(This article belongs to the Special Issue Storytelling with Geographic Data)
Show Figures

Figure 1

10 pages, 727 KiB  
Article
Factors Affecting the Number of Visitors in National Parks in the Czech Republic, Germany and Austria
by Josef Stemberk, Josef Dolejs, Petra Maresova and Kamil Kuca
ISPRS Int. J. Geo-Inf. 2018, 7(3), 124; https://doi.org/10.3390/ijgi7030124 - 19 Mar 2018
Cited by 18 | Viewed by 4281
Abstract
In the context of national-level strategies, the importance of tourism in national parks is on the rise. The objective of this study is to investigate the relationship between the number of visitors to national parks and five variables: area, number of employees, budget, [...] Read more.
In the context of national-level strategies, the importance of tourism in national parks is on the rise. The objective of this study is to investigate the relationship between the number of visitors to national parks and five variables: area, number of employees, budget, average employee salary and number of researchers in 12 national parks in the Czech Republic, Germany and Austria. Analysis of factors influencing the number of visitors to national parks uses the method of retrospective analysis of the data contained in internal documents and questionnaires among managers of national parks. The number of candidate predictors is relatively high when compared with the number of observations. Due to this fact, the Gilmour method for statistical analysis is used. Statistical results represented by the parameter β2 for number of employees is −33,016 (95% CI, −50,592–−15,441) and by the parameter β3 for budget is 0.586 (95% CI, 0.295–0.878), showing that the number of visitors increases with budget, while it decreases with the number of employees. The results of this study are a useful starting point for managers in their efforts to focus on developing key areas in an appropriate way. In conclusion, results show that increasing the economic benefits accruing from national parks regional policy could aim at a qualitative upgrading of tourist services, increased marketing of the unique national park label and the promotion of a diverse regional supply base. Full article
Show Figures

Figure 1

14 pages, 1383 KiB  
Article
Storytelling in Interactive 3D Geographic Visualization Systems
by Matthias Thöny, Raimund Schnürer, René Sieber, Lorenz Hurni and Renato Pajarola
ISPRS Int. J. Geo-Inf. 2018, 7(3), 123; https://doi.org/10.3390/ijgi7030123 - 19 Mar 2018
Cited by 33 | Viewed by 7076
Abstract
The objective of interactive geographic maps is to provide geographic information to a large audience in a captivating and intuitive way. Storytelling helps to create exciting experiences and to explain complex or otherwise hidden relationships of geospatial data. Furthermore, interactive 3D applications offer [...] Read more.
The objective of interactive geographic maps is to provide geographic information to a large audience in a captivating and intuitive way. Storytelling helps to create exciting experiences and to explain complex or otherwise hidden relationships of geospatial data. Furthermore, interactive 3D applications offer a wide range of attractive elements for advanced visual story creation and offer the possibility to convey the same story in many different ways. In this paper, we discuss and analyze storytelling techniques in 3D geographic visualizations so that authors and developers working with geospatial data can use these techniques to conceptualize their visualization and interaction design. Finally, we outline two examples which apply the given concepts. Full article
(This article belongs to the Special Issue Storytelling with Geographic Data)
Show Figures

Figure 1

19 pages, 3373 KiB  
Article
Single-Frequency Kinematic Performance Comparison between Galileo, GPS, and GLONASS Satellite Positioning Systems Using an MMS-Generated Trajectory as a Reference: Preliminary Results
by Eufemia Tarantino, Antonio Novelli, Raffaela Cefalo, Tatiana Sluga and Agostino Tommasi
ISPRS Int. J. Geo-Inf. 2018, 7(3), 122; https://doi.org/10.3390/ijgi7030122 - 18 Mar 2018
Cited by 5 | Viewed by 4244
Abstract
The initial Galileo satellite positioning services, started on December 15, 2016, became available with a formal announcement by the European Commission. This first step toward the Galileo system Full Operational Capability (FOC) has allowed many researchers to test the new system. The aim [...] Read more.
The initial Galileo satellite positioning services, started on December 15, 2016, became available with a formal announcement by the European Commission. This first step toward the Galileo system Full Operational Capability (FOC) has allowed many researchers to test the new system. The aim of this paper is to illustrate the results and the conclusions of a kinematic test involving a GNSS (Global Navigation Satellite System) multi-constellation receiver able to acquire the Galileo Open Service (OS) signal. The produced outputs were compared to a reference trajectory obtained from a Mobile Mapping System (MMS) implementing integrated high-performance GPS/INS measurements. By exploiting the CUI (command user interface) of the open source library RTKLIB, a reduced operative status was simulated for GPS and GLONASS. Specifically, all the possible operative combinations were tested and, when possible, statistically assessed. This was necessary to offer a fair comparison among the tested constellations. The results, referred to the reference trajectory, show that the new European system is characterized by a better planimetric performance with respect to the other systems, whereas, from an altimetric point of view, the GPS and GLONASS systems perform better. Full article
Show Figures

Figure 1

19 pages, 8245 KiB  
Article
Efficient Method for POI/ROI Discovery Using Flickr Geotagged Photos
by Chiao-Ling Kuo, Ta-Chien Chan, I-Chun Fan and Alexander Zipf
ISPRS Int. J. Geo-Inf. 2018, 7(3), 121; https://doi.org/10.3390/ijgi7030121 - 16 Mar 2018
Cited by 38 | Viewed by 7840
Abstract
In the era of big data, ubiquitous Flickr geotagged photos have opened a considerable opportunity for discovering valuable geographic information. Point of interest (POI) and region of interest (ROI) are significant reference data that are widely used in geospatial applications. This study aims [...] Read more.
In the era of big data, ubiquitous Flickr geotagged photos have opened a considerable opportunity for discovering valuable geographic information. Point of interest (POI) and region of interest (ROI) are significant reference data that are widely used in geospatial applications. This study aims to develop an efficient method for POI/ROI discovery from Flickr. Attractive footprints in photos with a local maximum that is beneficial for distinguishing clusters are first exploited. Pattern discovery is combined with a novel algorithm, the spatial overlap (SO) algorithm, and the naming and merging method is conducted for attractive footprint clustering. POI and ROI, which are derived from the peak value and range of clusters, indicate the most popular location and range for appreciating attractions. The discovered ROIs have a particular spatial overlap available which means the satisfied region of ROIs can be shared for appreciating attractions. The developed method is demonstrated in two study areas in Taiwan: Tainan and Taipei, which are the oldest and densest cities, respectively. Results show that the discovered POI/ROIs nearly match the official data in Tainan, whereas more commercial POI/ROIs are discovered in Taipei by the algorithm than official data. Meanwhile, our method can address the clustering issue in a dense area. Full article
Show Figures

Graphical abstract

14 pages, 2301 KiB  
Article
A Co-Citation and Cluster Analysis of Scientometrics of Geographic Information Ontology
by Yu Liu, Lin Li, Hang Shen, Hui Yang and Feng Luo
ISPRS Int. J. Geo-Inf. 2018, 7(3), 120; https://doi.org/10.3390/ijgi7030120 - 16 Mar 2018
Cited by 8 | Viewed by 4515
Abstract
Geographic information ontology represents an effective means of expressing geographic concepts and relationships between them. As an emerging field of study, it has drawn the attention of increasing numbers of scholars worldwide. In this study, both co-citation and cluster analysis methods of scientometrics [...] Read more.
Geographic information ontology represents an effective means of expressing geographic concepts and relationships between them. As an emerging field of study, it has drawn the attention of increasing numbers of scholars worldwide. In this study, both co-citation and cluster analysis methods of scientometrics are used to perform a comprehensive analysis of the papers on the topic of geographic information ontology indexed by the Web of Science (WoS) and published between 2001 and 2016. The results show that the history of the study of geographic information ontology can be divided roughly into three periods. Computer science and mathematics play important roles in this field of study. The International Journal of Geographical Information Science is an important periodical that provides knowledge resources for the study of geographic information ontology. The papers of Gruber TR and Guarino N are referenced most frequently, as well as that of Smith B., who formally introduced information ontology to the field of geographic information science. Providing personalized and intelligent geographic information services for users is an important focus of geographic information ontology. Full article
Show Figures

Figure 1

15 pages, 2140 KiB  
Article
A Multiresolution Grid Structure Applied to Seafloor Shape Modeling
by Wojciech Maleika, Michał Koziarski and Paweł Forczmański
ISPRS Int. J. Geo-Inf. 2018, 7(3), 119; https://doi.org/10.3390/ijgi7030119 - 16 Mar 2018
Cited by 8 | Viewed by 4550
Abstract
This paper proposes a method of creating a multiresolution depth grid containing bathymetric data describing a stretch of sea floor. The included literature review presents current solutions in the area of the creation of digital terrain models (DTMs) focusing on methods employing regular [...] Read more.
This paper proposes a method of creating a multiresolution depth grid containing bathymetric data describing a stretch of sea floor. The included literature review presents current solutions in the area of the creation of digital terrain models (DTMs) focusing on methods employing regular grids, with a discussion on the strong and weak points of such an approach. As a basis for the investigations, some important recommendations from the International Hydrographic Organization are provided and are related to the accuracy of created models. The authors propose a novel method of storing DTM data, involving multiresolution depth grids. The paper presents the characteristics of this method, numerical algorithms of a conversion between a regular grid and the multiresolution one, and experiments on typical seafloor surfaces. The results are discussed, focusing on the data reduction rate and the variable resolution of the grid structure. The proposed method can be applied in Geographical Information Systems, especially for the purposes of solving sea survey problems. Full article
Show Figures

Figure 1

11 pages, 6625 KiB  
Short Note
Validation of Pleiades Tri-Stereo DSM in Urban Areas
by Emmanouil Panagiotakis, Nektarios Chrysoulakis, Vasiliki Charalampopoulou and Dimitris Poursanidis
ISPRS Int. J. Geo-Inf. 2018, 7(3), 118; https://doi.org/10.3390/ijgi7030118 - 15 Mar 2018
Cited by 33 | Viewed by 6045
Abstract
We present an accurate digital surface model (DSM) derived from high-resolution Pleiades-1B 0.5 m panchromatic tri-stereo images, covering an area of 400 km2 over the Athens Metropolitan Area. Remote sensing and photogrammetry tools were applied, resulting in a 1 m × 1 [...] Read more.
We present an accurate digital surface model (DSM) derived from high-resolution Pleiades-1B 0.5 m panchromatic tri-stereo images, covering an area of 400 km2 over the Athens Metropolitan Area. Remote sensing and photogrammetry tools were applied, resulting in a 1 m × 1 m posting DSM over the study area. The accuracy of the produced DSM was evaluated against measured elevations by a differential Global Positioning System (d-GPS) and a reference DSM provided by the National Cadaster and Mapping Agency S.A. Different combinations of stereo and tri-stereo images were used and tested on the quality of the produced DSM. Results revealed that the DSM produced by the tri-stereo analysis has a root mean square error (RMSE) of 1.17 m in elevation, which lies within the best reported in the literature. On the other hand, DSMs derived by standard analysis of stereo-pairs from the same sensor were found to perform worse. Line profile data showed similar patterns between the reference and produced DSM. Pleiades tri-stereo high-quality DSM products have the necessary accuracy to support applications in the domains of urban planning, including climate change mitigation and adaptation, hydrological modelling, and natural hazards, being an important input for simulation models and morphological analysis at local scales. Full article
Show Figures

Graphical abstract

17 pages, 2687 KiB  
Article
Graph-Based Matching of Points-of-Interest from Collaborative Geo-Datasets
by Tessio Novack, Robin Peters and Alexander Zipf
ISPRS Int. J. Geo-Inf. 2018, 7(3), 117; https://doi.org/10.3390/ijgi7030117 - 15 Mar 2018
Cited by 22 | Viewed by 6029
Abstract
Several geospatial studies and applications require comprehensive semantic information from points-of-interest (POIs). However, this information is frequently dispersed across different collaborative mapping platforms. Surprisingly, there is still a research gap on the conflation of POIs from this type of geo-dataset. In this paper, [...] Read more.
Several geospatial studies and applications require comprehensive semantic information from points-of-interest (POIs). However, this information is frequently dispersed across different collaborative mapping platforms. Surprisingly, there is still a research gap on the conflation of POIs from this type of geo-dataset. In this paper, we focus on the matching aspect of POI data conflation by proposing two matching strategies based on a graph whose nodes represent POIs and edges represent matching possibilities. We demonstrate how the graph is used for (1) dynamically defining the weights of the different POI similarity measures we consider; (2) tackling the issue that POIs should be left unmatched when they do not have a corresponding POI on the other dataset and (3) detecting multiple POIs from the same place in the same dataset and jointly matching these to the corresponding POI(s) from the other dataset. The strategies we propose do not require the collection of training samples or extensive parameter tuning. They were statistically compared with a “naive”, though commonly applied, matching approach considering POIs collected from OpenStreetMap and Foursquare from the city of London (England). In our experiments, we sequentially included each of our methodological suggestions in the matching procedure and each of them led to an increase in the accuracy in comparison to the previous results. Our best matching result achieved an overall accuracy of 91%, which is more than 10% higher than the accuracy achieved by the baseline method. Full article
Show Figures

Figure 1

16 pages, 3054 KiB  
Article
Progressive Amalgamation of Building Clusters for Map Generalization Based on Scaling Subgroups
by Xianjin He, Xinchang Zhang and Jie Yang
ISPRS Int. J. Geo-Inf. 2018, 7(3), 116; https://doi.org/10.3390/ijgi7030116 - 15 Mar 2018
Cited by 8 | Viewed by 4765
Abstract
Map generalization utilizes transformation operations to derive smaller-scale maps from larger-scale maps, and is a key procedure for the modelling and understanding of geographic space. Studies to date have largely applied a fixed tolerance to aggregate clustered buildings into a single object, resulting [...] Read more.
Map generalization utilizes transformation operations to derive smaller-scale maps from larger-scale maps, and is a key procedure for the modelling and understanding of geographic space. Studies to date have largely applied a fixed tolerance to aggregate clustered buildings into a single object, resulting in the loss of details that meet cartographic constraints and may be of importance for users. This study aims to develop a method that amalgamates clustered buildings gradually without significant modification of geometry, while preserving the map details as much as possible under cartographic constraints. The amalgamation process consists of three key steps. First, individual buildings are grouped into distinct clusters by using the graph-based spatial clustering application with random forest (GSCARF) method. Second, building clusters are decomposed into scaling subgroups according to homogeneity with regard to the mean distance of subgroups. Thus, hierarchies of building clusters can be derived based on scaling subgroups. Finally, an amalgamation operation is progressively performed from the bottom-level subgroups to the top-level subgroups using the maximum distance of each subgroup as the amalgamating tolerance instead of using a fixed tolerance. As a consequence of this step, generalized intermediate scaling results are available, which can form the multi-scale representation of buildings. The experimental results show that the proposed method can generate amalgams with correct details, statistical area balance and orthogonal shape while satisfying cartographic constraints (e.g., minimum distance and minimum area). Full article
Show Figures

Figure 1

16 pages, 11854 KiB  
Article
Spatial Transformation of Equality – Generalized Travelling Salesman Problem to Travelling Salesman Problem
by Mohammed Zia, Ziyadin Cakir and Dursun Zafer Seker
ISPRS Int. J. Geo-Inf. 2018, 7(3), 115; https://doi.org/10.3390/ijgi7030115 - 15 Mar 2018
Cited by 8 | Viewed by 4253
Abstract
The Equality-Generalized Travelling Salesman Problem (E-GTSP), which is an extension of the Travelling Salesman Problem (TSP), is stated as follows: given groups of points within a city, like banks, supermarkets, etc., find a minimum cost Hamiltonian cycle that visits each group exactly once. [...] Read more.
The Equality-Generalized Travelling Salesman Problem (E-GTSP), which is an extension of the Travelling Salesman Problem (TSP), is stated as follows: given groups of points within a city, like banks, supermarkets, etc., find a minimum cost Hamiltonian cycle that visits each group exactly once. It can model many real-life combinatorial optimization scenarios more efficiently than TSP. This study presents five spatially driven search-algorithms for possible transformation of E-GTSP to TSP by considering the spatial spread of points in a given urban city. Presented algorithms are tested over 15 different cities, classified by their street-network’s fractal-dimension. Obtained results denote that the R-Search algorithm, which selects the points from each group based on their radial separation with respect to the start–end point, is the best search criterion for any E-GTSP to TSP conversion modelled for a city street network. An 8.8% length error has been reported for this algorithm. Full article
Show Figures

Figure 1

16 pages, 6345 KiB  
Article
Accuracy Assessment of Different Digital Surface Models
by Ugur Alganci, Baris Besol and Elif Sertel
ISPRS Int. J. Geo-Inf. 2018, 7(3), 114; https://doi.org/10.3390/ijgi7030114 - 15 Mar 2018
Cited by 94 | Viewed by 9459
Abstract
Digital elevation models (DEMs), which can occur in the form of digital surface models (DSMs) or digital terrain models (DTMs), are widely used as important geospatial information sources for various remote sensing applications, including the precise orthorectification of high-resolution satellite images, 3D spatial [...] Read more.
Digital elevation models (DEMs), which can occur in the form of digital surface models (DSMs) or digital terrain models (DTMs), are widely used as important geospatial information sources for various remote sensing applications, including the precise orthorectification of high-resolution satellite images, 3D spatial analyses, multi-criteria decision support systems, and deformation monitoring. The accuracy of DEMs has direct impacts on specific calculations and process chains; therefore, it is important to select the most appropriate DEM by considering the aim, accuracy requirement, and scale of each study. In this research, DSMs obtained from a variety of satellite sensors were compared to analyze their accuracy and performance. For this purpose, freely available Advanced Spaceborne Thermal Emission and Reflection Radiometer (ASTER) 30 m, Shuttle Radar Topography Mission (SRTM) 30 m, and Advanced Land Observing Satellite (ALOS) 30 m resolution DSM data were obtained. Additionally, 3 m and 1 m resolution DSMs were produced from tri-stereo images from the SPOT 6 and Pleiades high-resolution (PHR) 1A satellites, respectively. Elevation reference data provided by the General Command of Mapping, the national mapping agency of Turkey—produced from 30 cm spatial resolution stereo aerial photos, with a 5 m grid spacing and ±3 m or better overall vertical accuracy at the 90% confidence interval (CI)—were used to perform accuracy assessments. Gross errors and water surfaces were removed from the reference DSM. The relative accuracies of the different DSMs were tested using a different number of checkpoints determined by different methods. In the first method, 25 checkpoints were selected from bare lands to evaluate the accuracies of the DSMs on terrain surfaces. In the second method, 1000 randomly selected checkpoints were used to evaluate the methods’ accuracies for the whole study area. In addition to the control point approach, vertical cross-sections were extracted from the DSMs to evaluate the accuracies related to land cover. The PHR and SPOT DSMs had the highest accuracies of all of the testing methods, followed by the ALOS DSM, which had very promising results. Comparatively, the SRTM and ASTER DSMs had the worst accuracies. Additionally, the PHR and SPOT DSMs captured man-made objects and above-terrain structures, which indicated the need for post-processing to attain better representations. Full article
Show Figures

Figure 1

19 pages, 6748 KiB  
Article
OSM Data Import as an Outreach Tool to Trigger Community Growth? A Case Study in Miami
by Levente Juhász and Hartwig H. Hochmair
ISPRS Int. J. Geo-Inf. 2018, 7(3), 113; https://doi.org/10.3390/ijgi7030113 - 15 Mar 2018
Cited by 17 | Viewed by 7662
Abstract
This paper presents the results of a study that explored if and how an OpenStreetMap (OSM) data import task can contribute to OSM community growth. Different outreach techniques were used to introduce a building import task to three targeted OSM user groups. First, [...] Read more.
This paper presents the results of a study that explored if and how an OpenStreetMap (OSM) data import task can contribute to OSM community growth. Different outreach techniques were used to introduce a building import task to three targeted OSM user groups. First, existing OSM members were contacted and asked to join the data import project. Second, several local community events were organized with Maptime Miami to engage local mappers in OSM contribution activities. Third, the import task was introduced as an extra credit assignment in two GIS courses at the University of Florida. The paper analyzes spatio-temporal user contributions of these target groups to assess the effectiveness of the different outreach techniques for recruitment and retention of OSM contributors. Results suggest that the type of prospective users that were contacted through our outreach efforts, and their different motivations play a major role in their editing activity. Results also revealed differences in editing patterns between newly recruited users and already established mappers. More specifically, long-term engagement of newly registered OSM mappers did not succeed, whereas already established contributors continued to import and improve data. In general, we found that an OSM data import project can add valuable data to the map, but also that encouraging long-term engagement of new users, whether it be within the academic environment or outside, proved to be challenging. Full article
(This article belongs to the Special Issue Geoinformatics in Citizen Science)
Show Figures

Graphical abstract

15 pages, 3787 KiB  
Article
An Indoor Scene Recognition-Based 3D Registration Mechanism for Real-Time AR-GIS Visualization in Mobile Applications
by Wei Ma, Hanjiang Xiong, Xuefeng Dai, Xianwei Zheng and Yan Zhou
ISPRS Int. J. Geo-Inf. 2018, 7(3), 112; https://doi.org/10.3390/ijgi7030112 - 15 Mar 2018
Cited by 18 | Viewed by 6202
Abstract
Mobile Augmented Reality (MAR) systems are becoming ideal platforms for visualization, permitting users to better comprehend and interact with spatial information. Subsequently, this technological development, in turn, has prompted efforts to enhance mechanisms for registering virtual objects in real world contexts. Most existing [...] Read more.
Mobile Augmented Reality (MAR) systems are becoming ideal platforms for visualization, permitting users to better comprehend and interact with spatial information. Subsequently, this technological development, in turn, has prompted efforts to enhance mechanisms for registering virtual objects in real world contexts. Most existing AR 3D Registration techniques lack the scene recognition capabilities needed to describe accurately the positioning of virtual objects in scenes representing reality. Moreover, the application of such registration methods in indoor AR-GIS systems is further impeded by the limited capacity of these systems to detect the geometry and semantic information in indoor environments. In this paper, we propose a novel method for fusing virtual objects and indoor scenes, based on indoor scene recognition technology. To accomplish scene fusion in AR-GIS, we first detect key points in reference images. Then, we perform interior layout extraction using a Fully Connected Networks (FCN) algorithm to acquire layout coordinate points for the tracking targets. We detect and recognize the target scene in a video frame image to track targets and estimate the camera pose. In this method, virtual 3D objects are fused precisely to a real scene, according to the camera pose and the previously extracted layout coordinate points. Our results demonstrate that this approach enables accurate fusion of virtual objects with representations of real world indoor environments. Based on this fusion technique, users can better grasp virtual three-dimensional representations on an AR-GIS platform. Full article
Show Figures

Figure 1

15 pages, 4899 KiB  
Article
WebGIS for Geography Education: Towards a GeoCapabilities Approach
by Mary Fargher
ISPRS Int. J. Geo-Inf. 2018, 7(3), 111; https://doi.org/10.3390/ijgi7030111 - 15 Mar 2018
Cited by 37 | Viewed by 8685
Abstract
Recent developments in webGIS are transforming how geospatial information can be used in schools. Smart mapping, mobile applications, editable feature services (EFS), and web map services (WMS) are all now more freely available. These have made prior technological, cost and access challenges for [...] Read more.
Recent developments in webGIS are transforming how geospatial information can be used in schools. Smart mapping, mobile applications, editable feature services (EFS), and web map services (WMS) are all now more freely available. These have made prior technological, cost and access challenges for teachers largely redundant but are only part of ensuring that geospatial information is used to its full educational potential in geography education. This paper argues that drawing on a GeoCapabilities approach can enhance teacher’s use of webGIS in deepening their students’ abilities to think and reason with geographical knowledge and ideas. To illustrate this line of argument, a geography curriculum artefact constructed in ArcGIS Online is presented and analysed. The discussion identifies a range of specific educational benefits of geography teachers adopting a GeoCapabilities approach to using webGIS including how powerful disciplinary knowledge (PDK) can be constructed. The discussion also identifies a number of significant implications for teacher education of adopting such a methodology. The paper concludes with recommendations for the future use of webGIS in schools and geography teacher education. Full article
Show Figures

Figure 1

23 pages, 10267 KiB  
Article
Pixel-Wise Classification Method for High Resolution Remote Sensing Imagery Using Deep Neural Networks
by Rui Guo, Jianbo Liu, Na Li, Shibin Liu, Fu Chen, Bo Cheng, Jianbo Duan, Xinpeng Li and Caihong Ma
ISPRS Int. J. Geo-Inf. 2018, 7(3), 110; https://doi.org/10.3390/ijgi7030110 - 14 Mar 2018
Cited by 44 | Viewed by 8794
Abstract
Considering the classification of high spatial resolution remote sensing imagery, this paper presents a novel classification method for such imagery using deep neural networks. Deep learning methods, such as a fully convolutional network (FCN) model, achieve state-of-the-art performance in natural image semantic segmentation [...] Read more.
Considering the classification of high spatial resolution remote sensing imagery, this paper presents a novel classification method for such imagery using deep neural networks. Deep learning methods, such as a fully convolutional network (FCN) model, achieve state-of-the-art performance in natural image semantic segmentation when provided with large-scale datasets and respective labels. To use data efficiently in the training stage, we first pre-segment training images and their labels into small patches as supplements of training data using graph-based segmentation and the selective search method. Subsequently, FCN with atrous convolution is used to perform pixel-wise classification. In the testing stage, post-processing with fully connected conditional random fields (CRFs) is used to refine results. Extensive experiments based on the Vaihingen dataset demonstrate that our method performs better than the reference state-of-the-art networks when applied to high-resolution remote sensing imagery classification. Full article
Show Figures

Figure 1

20 pages, 25595 KiB  
Technical Note
Development of a QGIS Plugin to Obtain Parameters and Elements of Plantation Trees and Vineyards with Aerial Photographs
by Lia Duarte, Pedro Silva and Ana Cláudia Teodoro
ISPRS Int. J. Geo-Inf. 2018, 7(3), 109; https://doi.org/10.3390/ijgi7030109 - 14 Mar 2018
Cited by 24 | Viewed by 14453
Abstract
Unmanned Aerial Vehicle (UAV) imagery allows for a new way of obtaining geographic information. In this work, a Geographical Information System (GIS) open source application was developed in QGIS software that estimates several parameters and metrics on tree crown through image analysis techniques [...] Read more.
Unmanned Aerial Vehicle (UAV) imagery allows for a new way of obtaining geographic information. In this work, a Geographical Information System (GIS) open source application was developed in QGIS software that estimates several parameters and metrics on tree crown through image analysis techniques (image segmentation and image classification) and fractal analysis. The metrics that have been estimated were: area, perimeter, number of trees, distance between trees, and a missing tree check. This methodology was tested on three different plantations: olive, eucalyptus, and vineyard. The application developed is free, open source and takes advantage of QGIS integration with external software. Several tools available from Orfeo Toolbox and Geographic Resources Analysis Support System (GRASS) GIS were employed to generate a classified raster image which allows calculating the metrics referred before. The application was developed in the Python 2.7 language. Also, some functions, modules, and classes from the QGIS Application Programming Interface (API) and PyQt4 API were used. This new plugin is a valuable tool, which allowed for automatizing several parameters and metrics on tree crown using GIS analysis tools, while considering data acquired by UAV. Full article
Show Figures

Figure 1

18 pages, 4072 KiB  
Article
Spatio-Temporal Database of Places Located in the Border Area
by Albina Mościcka and Marta Kuźma
ISPRS Int. J. Geo-Inf. 2018, 7(3), 108; https://doi.org/10.3390/ijgi7030108 - 14 Mar 2018
Cited by 2 | Viewed by 3982
Abstract
As a result of changes in boundaries, the political affiliation of locations also changes. Data on such locations are now collected in datasets with reference to the present or to the past space. Therefore, they can refer to localities that either no longer [...] Read more.
As a result of changes in boundaries, the political affiliation of locations also changes. Data on such locations are now collected in datasets with reference to the present or to the past space. Therefore, they can refer to localities that either no longer exist, have a different name now, or lay outside of the current borders of the country. Moreover, thematic data describing the past are related to events, customs, items that are always “somewhere”. Storytelling about the past is incomplete without knowledge about the places in which the given story has happened. Therefore, the objective of the article is to discuss the concept of spatio-temporal database for border areas as an “engine” for visualization of thematic data in time-oriented geographical space. The paper focuses on studying the place names on the Polish-Ukrainian border, analyzing the changes that have occurred in this area over the past 80 years (where there were three different countries during this period), and defining the changeability rules. As a result of the research, the architecture of spatio-temporal databases is defined, as well as the rules for using them for data geovisualisation in historical context. Full article
(This article belongs to the Special Issue Storytelling with Geographic Data)
Show Figures

Figure 1

14 pages, 8331 KiB  
Article
Fine Resolution Probabilistic Land Cover Classification of Landscapes in the Southeastern United States
by Joseph St. Peter, John Hogland, Nathaniel Anderson, Jason Drake and Paul Medley
ISPRS Int. J. Geo-Inf. 2018, 7(3), 107; https://doi.org/10.3390/ijgi7030107 - 14 Mar 2018
Cited by 9 | Viewed by 4686
Abstract
Land cover classification provides valuable information for prioritizing management and conservation operations across large landscapes. Current regional scale land cover geospatial products within the United States have a spatial resolution that is too coarse to provide the necessary information for operations at the [...] Read more.
Land cover classification provides valuable information for prioritizing management and conservation operations across large landscapes. Current regional scale land cover geospatial products within the United States have a spatial resolution that is too coarse to provide the necessary information for operations at the local and project scales. This paper describes a methodology that uses recent advances in spatial analysis software to create a land cover classification over a large region in the southeastern United States at a fine (1 m) spatial resolution. This methodology used image texture metrics and principle components derived from National Agriculture Imagery Program (NAIP) aerial photographic imagery, visually classified locations, and a softmax neural network model. The model efficiently produced classification surfaces at 1 m resolution across roughly 11.6 million hectares (28.8 million acres) with less than 10% average error in modeled probability. The classification surfaces consist of probability estimates of 13 visually distinct classes for each 1 m cell across the study area. This methodology and the tools used in this study constitute a highly flexible fine resolution land cover classification that can be applied across large extents using standard computer hardware, common and open source software and publicly available imagery. Full article
Show Figures

Figure 1

18 pages, 6676 KiB  
Article
On the Use of Geographic Information in Humanities Research Infrastructure: A Case Study on Cultural Heritage
by Albina Mościcka and Agnieszka Zwirowicz-Rutkowska
ISPRS Int. J. Geo-Inf. 2018, 7(3), 106; https://doi.org/10.3390/ijgi7030106 - 14 Mar 2018
Cited by 6 | Viewed by 4859
Abstract
As an invaluable source of knowledge about the past, cultural heritage may be an important element of the humanities research infrastructure, along with other elements, such as spatial references. Therefore, this paper attempts to provide an answer to the questions concerning the ways [...] Read more.
As an invaluable source of knowledge about the past, cultural heritage may be an important element of the humanities research infrastructure, along with other elements, such as spatial references. Therefore, this paper attempts to provide an answer to the questions concerning the ways in which spatial information can contribute to the development of this infrastructure and the aspects of storytelling based on cultural resources that can be supported by such infrastructure. The objective of the methodology that was used was to combine the aspects that refer to spatial information and cultural items into a single, common issue, and to describe them in a formalized way with use of Unified Modeling Language (UML). As a result, the study presents a proposal of the Humanities Infrastructure Architecture based on spatially-oriented movable cultural items, taking into account their use in the context of interoperability, along with the concept of creating spatial databases that would include movable monuments. The authors also demonstrate that the ISO 19100 series of geographical information standards may be a source of interesting conceptual solutions that may be used in the process of the standardization of geographical information that was recorded in the descriptions of cultural heritage items in form of metadata and data structure descriptions. Full article
(This article belongs to the Special Issue Storytelling with Geographic Data)
Show Figures

Figure 1

24 pages, 16036 KiB  
Article
Multitemporal SAR Data and 2D Hydrodynamic Model Flood Scenario Dynamics Assessment
by Santina Scarpino, Raffaele Albano, Andrea Cantisani, Leonardo Mancusi, Aurelia Sole and Giovanni Milillo
ISPRS Int. J. Geo-Inf. 2018, 7(3), 105; https://doi.org/10.3390/ijgi7030105 - 14 Mar 2018
Cited by 25 | Viewed by 4273
Abstract
The increasing number of floods and the severity of their consequences, which is caused by phenomena, such as climate change and uncontrolled urbanization, create a growing need to develop operational procedures and tools for accurate and timely flood mapping and management. Synthetic Aperture [...] Read more.
The increasing number of floods and the severity of their consequences, which is caused by phenomena, such as climate change and uncontrolled urbanization, create a growing need to develop operational procedures and tools for accurate and timely flood mapping and management. Synthetic Aperture Radar (SAR), with its day, night, and cloud-penetrating capacity, has proven to be a very useful source of information during calibration of hydrodynamic models considered indispensable tools for near real-time flood forecasting and monitoring. The paper begins with the analysis of radar signatures of temporal series of SAR data, by exploiting the short revisit time of the images that are provided by the Cosmo-SkyMed constellation of four satellites, in combination with a Digital Elevation Model for the extraction of flood extent and spatially distributed water depth in a flat area with complex topography during a flood event. These SAR-based hazard maps were then used to perform a bi-dimensional hydraulic model calibration on the November 2010 flood event at the mouth of the Bradano River in Basilicata, Italy. Once the best fit between flood predictions of hydrodynamic models was identified and the efficacy of SAR data in correcting hydrodynamic inconsistencies with regard to reliable assessment of flood extent and water-depth maps was shown by validation with the December 2013 Bradano River event. Based on calibration and validation results, the paper aims to show how the combination of the time series of Synthetic Aperture Radar (SAR) and Digital Elevation Model (DEM) derived water-depth maps with the data from the hydrodynamic model can provide valuable information for flood dynamics monitoring in a flat area with complex topography. Future research should focus on the integration and implementation of the semi-automatic proposed method in an operational system for near real-time flood management. Full article
Show Figures

Figure 1

19 pages, 5126 KiB  
Article
Impacts of Street-Visible Greenery on Housing Prices: Evidence from a Hedonic Price Model and a Massive Street View Image Dataset in Beijing
by Yonglin Zhang and Rencai Dong
ISPRS Int. J. Geo-Inf. 2018, 7(3), 104; https://doi.org/10.3390/ijgi7030104 - 14 Mar 2018
Cited by 116 | Viewed by 9604
Abstract
Street greenery is a component of urban green infrastructure. By forming foundational green corridors in urban ecological systems, street greenery provides vital ecological, social, and cultural functions, and benefits the wellbeing of citizens. However, because of the difficulty of quantifying people’s visual perceptions, [...] Read more.
Street greenery is a component of urban green infrastructure. By forming foundational green corridors in urban ecological systems, street greenery provides vital ecological, social, and cultural functions, and benefits the wellbeing of citizens. However, because of the difficulty of quantifying people’s visual perceptions, the impact of street-visible greenery on housing prices has not been fully studied. Using Beijing, which has a mature real estate market, as an example, this study evaluated 22,331 transactions in 2014 in 2370 private housing estates. We selected 25 variables that were classified into three categories—location, housing, and neighbourhood characteristics—and introduced an index called the horizontal green view index (HGVI) into a hedonic pricing model to measure the value of the visual perception of street greenery in neighbouring residential developments. The results show that (1) Beijing’s homebuyers would like to reside in residential units with a higher HGVI; (2) Beijing’s homebuyers favour larger lakes; and (3) Beijing’s housing prices were impacted by the spatial development patterns of the city centre and multiple business centres. We used computer vision to quantify the street-visible greenery and estimated the economic benefits that the neighbouring visible greenery would have on residential developments in Beijing. This study provides a scientific basis and reference for policy makers and city planners in road greening, and a tool for formulating street greening policy, studying housing price characteristics, and evaluating real estate values. Full article
(This article belongs to the Special Issue Urban Environment Mapping Using GIS)
Show Figures

Figure 1

19 pages, 14311 KiB  
Article
ENSO- and Rainfall-Sensitive Vegetation Regions in Indonesia as Identified from Multi-Sensor Remote Sensing Data
by Sanjiwana Arjasakusuma, Yasushi Yamaguchi, Yasuhiro Hirano and Xiang Zhou
ISPRS Int. J. Geo-Inf. 2018, 7(3), 103; https://doi.org/10.3390/ijgi7030103 - 14 Mar 2018
Cited by 12 | Viewed by 6589
Abstract
Ongoing global warming has triggered extreme climate events of increasing magnitude and frequency. Under this effect, a series of extreme climate events such as drought and increased rainfall during the El Nino Southern Oscillation (ENSO) are expected to be amplified in the coming [...] Read more.
Ongoing global warming has triggered extreme climate events of increasing magnitude and frequency. Under this effect, a series of extreme climate events such as drought and increased rainfall during the El Nino Southern Oscillation (ENSO) are expected to be amplified in the coming years. Adequate mapping of regions with climate-sensitive vegetation and its associated time lag is required for appropriate mitigation planning to avoid potential negative ecological impacts towards vegetation. In this study, ENSO and climate indicator time series data, for example, Multivariate ENSO Index (MEI) and Climate Hazards Group InfraRed Precipitation with Stations (CHIRPS) data for rainfall were linked with long-term time series vegetation proxies from remote sensing (RS proxies). ENSO- and rainfall-sensitive areas were identified from each RS proxy using the bivariate Granger test, and the areas identified by multiple RS proxies were taken to identify climate-sensitive regions in Indonesia. Of the biome types in Indonesia, savanna was the most sensitive, with approximately 53% of the total savanna area in Indonesia shown to be sensitive to ENSO and rainfall by two or more RS proxies. Rolling correlation analysis also found that the ENSO effect on the vegetation region after rainfall was positively correlated with the RS proxies with a time lag of +5 months. Therefore, rainfall can be taken as a proxy of the effects of ENSO on the temporal dynamics of sensitive vegetation regions in Indonesia. Full article
(This article belongs to the Special Issue Earth/Community Observations for Climate Change Research)
Show Figures

Graphical abstract

18 pages, 3458 KiB  
Article
Representing Time-Dynamic Geospatial Objects on Virtual Globes Using CZML—Part II: Impact, Comparison, and Future Developments
by Liangfeng Zhu, Zhiwen Li and Zhongliang Wang
ISPRS Int. J. Geo-Inf. 2018, 7(3), 102; https://doi.org/10.3390/ijgi7030102 - 14 Mar 2018
Cited by 11 | Viewed by 7417
Abstract
This is the second and final part of our Cesium Markup Language (CZML) study. Here, we describe the relevant applications, academic influence, and future developments of CZML. Since its emergence in 2011, CZML has become widely used in the geoscientific environment. It is [...] Read more.
This is the second and final part of our Cesium Markup Language (CZML) study. Here, we describe the relevant applications, academic influence, and future developments of CZML. Since its emergence in 2011, CZML has become widely used in the geoscientific environment. It is also having a positive impact on geoscience. Numerous applications use CZML for generating time-dynamic geovisualization, facilitating data interoperability, and promoting spatial data infrastructures. In this paper, we give an overview of the available tools and services, representative applications, as well as the role that CZML plays for geoscientific research. Furthermore, we also discuss key similarities and differences between CZML and KML (Keyhole Markup Language), and outline some of the future improvements for CZML’s research and development. Full article
Show Figures

Figure 1

14 pages, 1735 KiB  
Article
Investigating the Influences of Tree Coverage and Road Density on Property Crime
by Chengming Ye, Yifei Chen and Jonathan Li
ISPRS Int. J. Geo-Inf. 2018, 7(3), 101; https://doi.org/10.3390/ijgi7030101 - 14 Mar 2018
Cited by 17 | Viewed by 4519
Abstract
With the development of Geographic Information Systems (GIS), crime mapping has become an effective approach for investigating the spatial pattern of crime in a defined area. Understanding the relationship between crime and its surrounding environment reveals possible strategies for reducing crime in a [...] Read more.
With the development of Geographic Information Systems (GIS), crime mapping has become an effective approach for investigating the spatial pattern of crime in a defined area. Understanding the relationship between crime and its surrounding environment reveals possible strategies for reducing crime in a neighborhood. The relationship between vegetation density and crime has long been under debate. The convenience of a road network is another important factor that can influence a criminal’s selection of locations. This research is conducted to investigate the correlations between tree coverage and property crime, and road density and property crime in the City of Vancouver. High spatial resolution airborne LiDAR data and road network data collected in 2013 were used to extract tree covered areas for cross-sectional analysis. The independent variables were inserted into Ordinary Least-Squares (OLS) regression, Spatial Lag regression, and Geographically Weighted Regression (GWR) models to examine their relationships to property crime rates. The results of the cross-sectional analysis provide statistical evidence that there are negative correlations between property crime rates and both tree coverage and road density, with the stronger correlations occurring around Downtown Vancouver. Full article
Show Figures

Figure 1

17 pages, 13267 KiB  
Article
Do Charitable Foundations Spend Money Where People Need It Most? A Spatial Analysis of China
by Yongze Song and Linyun Fu
ISPRS Int. J. Geo-Inf. 2018, 7(3), 100; https://doi.org/10.3390/ijgi7030100 - 14 Mar 2018
Cited by 7 | Viewed by 4054
Abstract
Charitable foundations are a critical part of public services. However, there is a large gap between the locations and expenditures of charitable foundations and the real population needs for most nations. Three types of Chinese local charity foundations, i.e., those for poverty, education [...] Read more.
Charitable foundations are a critical part of public services. However, there is a large gap between the locations and expenditures of charitable foundations and the real population needs for most nations. Three types of Chinese local charity foundations, i.e., those for poverty, education and medical assistance, are used as examples to explore the distinct gaps. The spatial distributions of local charity foundations are characterized by spatial scan statistics and spatial autocorrelation models. The local population needs of charitable assistance for poverty, education and medical services are quantified with their respective weighted proxy indexes of the current conditions. Thus, the nonlinear relationships between population needs and the expenditures of local charitable foundations are described with generalized additive models. The results show that both the participation rate and the charity expenditures of the foundations are highly clustered within a few cities where the population needs are relatively small and are furthermore rare among the other cities. The charity expenditures of local foundations are nonlinearly correlated with the current conditions of socioeconomic development, education and medical levels due to the diverse development stages of the cities. This study provides quantitative evidence for local authorities and charitable foundations to make targeted and constructive decisions to gradually reduce the distinct gaps. Full article
Show Figures

Figure 1

19 pages, 5920 KiB  
Article
Extraction of Tourist Destinations and Comparative Analysis of Preferences Between Foreign Tourists and Domestic Tourists on the Basis of Geotagged Social Media Data
by Takashi Nicholas Maeda, Mitsuo Yoshida, Fujio Toriumi and Hirotada Ohashi
ISPRS Int. J. Geo-Inf. 2018, 7(3), 99; https://doi.org/10.3390/ijgi7030099 - 13 Mar 2018
Cited by 29 | Viewed by 8172
Abstract
Inbound tourism plays an important role in local economies. To stimulate local economies, it is necessary to attract foreign tourists to various areas of a country. This research aims to develop a method of extracting the locations of tourist destinations in a country [...] Read more.
Inbound tourism plays an important role in local economies. To stimulate local economies, it is necessary to attract foreign tourists to various areas of a country. This research aims to develop a method of extracting the locations of tourist destinations in a country and to understand what characteristics foreign tourists expect of areas near tourist attractions compared with what domestic tourists expect. In this paper, a tourist destination is defined as a small area that has places of interests for tourists such as historic sites, theme parks, hotels, and restaurants. The methods proposed in this paper are applied to data acquired from Twitter and Foursquare in Japan. The proposed method successfully extracts the locations of tourist destinations and characterizes those locations based on the points of interest in the neighborhood. The results indicate that foreign tourists who come to Japan expect nightlife spots (bars, nightclubs, etc.) to be located in the neighborhood of tourist destinations, in contrast to the expectations of domestic tourists. The proposed methods are applicable to not only Japan, but to any country. Full article
(This article belongs to the Special Issue Geospatial Big Data and Urban Studies)
Show Figures

Figure 1

22 pages, 1994 KiB  
Article
An Approach to Measuring Semantic Relatedness of Geographic Terminologies Using a Thesaurus and Lexical Database Sources
by Zugang Chen, Jia Song and Yaping Yang
ISPRS Int. J. Geo-Inf. 2018, 7(3), 98; https://doi.org/10.3390/ijgi7030098 - 13 Mar 2018
Cited by 14 | Viewed by 3818
Abstract
In geographic information science, semantic relatedness is important for Geographic Information Retrieval (GIR), Linked Geospatial Data, geoparsing, and geo-semantics. But computing the semantic similarity/relatedness of geographic terminology is still an urgent issue to tackle. The thesaurus is a ubiquitous and sophisticated knowledge representation [...] Read more.
In geographic information science, semantic relatedness is important for Geographic Information Retrieval (GIR), Linked Geospatial Data, geoparsing, and geo-semantics. But computing the semantic similarity/relatedness of geographic terminology is still an urgent issue to tackle. The thesaurus is a ubiquitous and sophisticated knowledge representation tool existing in various domains. In this article, we combined the generic lexical database (WordNet or HowNet) with the Thesaurus for Geographic Science and proposed a thesaurus–lexical relatedness measure (TLRM) to compute the semantic relatedness of geographic terminology. This measure quantified the relationship between terminologies, interlinked the discrete term trees by using the generic lexical database, and realized the semantic relatedness computation of any two terminologies in the thesaurus. The TLRM was evaluated on a new relatedness baseline, namely, the Geo-Terminology Relatedness Dataset (GTRD) which was built by us, and the TLRM obtained a relatively high cognitive plausibility. Finally, we applied the TLRM on a geospatial data sharing portal to support data retrieval. The application results of the 30 most frequently used queries of the portal demonstrated that using TLRM could improve the recall of geospatial data retrieval in most situations and rank the retrieval results by the matching scores between the query of users and the geospatial dataset. Full article
Show Figures

Figure 1

Previous Issue
Next Issue
Back to TopTop