Atmosphere 2022, 13(12), 2048; https://doi.org/10.3390/atmos13122048 - 7 Dec 2022
Cited by 3 | Viewed by 2724
Abstract
Precipitation with high spatial and temporal resolution can improve the defense capability of meteorological disasters and provide indispensable instruction and early warning for social public services, such as agriculture, forestry, and transportation. Therefore, a deep learning-based algorithm entitled precipitation retrieval from satellite observations
[...] Read more.
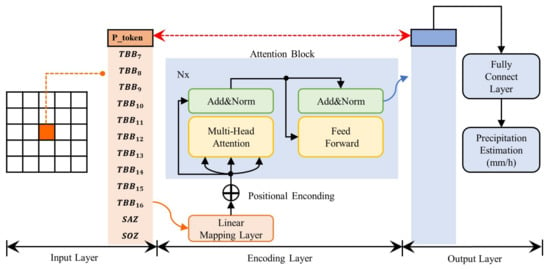
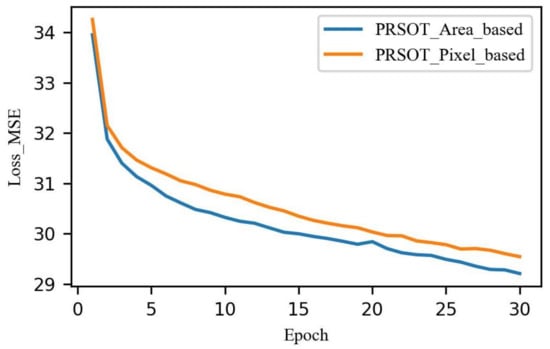
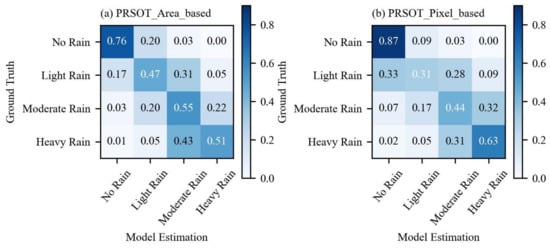
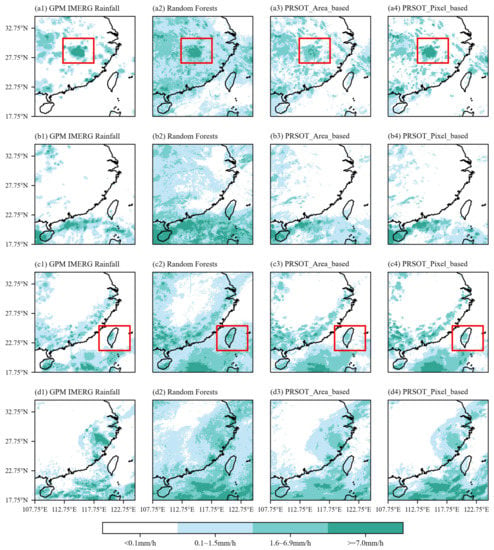
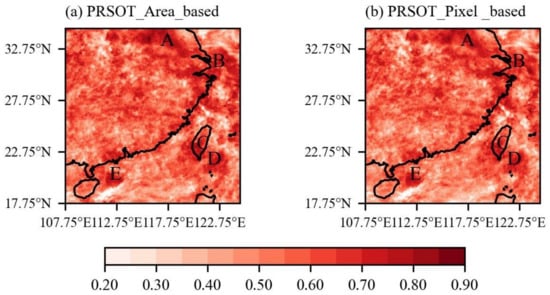
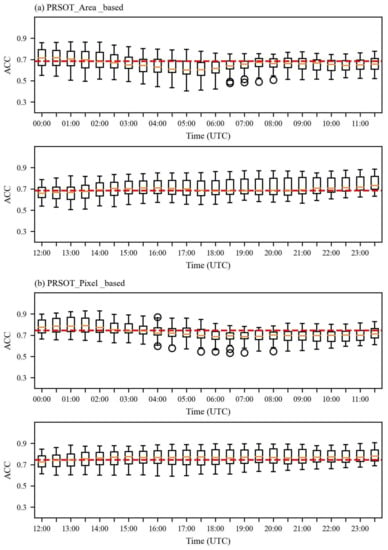
Precipitation with high spatial and temporal resolution can improve the defense capability of meteorological disasters and provide indispensable instruction and early warning for social public services, such as agriculture, forestry, and transportation. Therefore, a deep learning-based algorithm entitled precipitation retrieval from satellite observations based on Transformer (PRSOT) is proposed to fill the observation gap of ground rain gauges and weather radars in deserts, oceans, and other regions. In this algorithm, the multispectral infrared brightness temperatures from Himawari-8, the new-generation geostationary satellite, have been used as predictor variables and the Global Precipitation Measurement (GPM) precipitation product has been employed to train the retrieval model. We utilized two data normalization schemes, area-based and pixel-based normalization, and conducted comparative experiments. Comparing the estimated results with the GPM product on the test set, PRSOT_Pixel_based model achieved a Probability Of Detection (POD) of 0.74, a False Alarm Ratio (FAR) of 0.44 and a Critical Success Index (CSI) of 0.47 for two-class metrics, and an Accuracy (ACC) of 0.75 for multi-class metrics. Pixel-based normalization is more suitable for meteorological data, highlighting the precipitation characteristics and obtaining better comprehensive retrieval performance in visualization and evaluation metrics. In conclusion, the proposed PRSOT model has made a remarkable and essential contribution to precipitation retrieval and outperforms the benchmark machine learning model Random Forests.
Full article
(This article belongs to the Special Issue Identification and Optimization of Retrieval Model in Atmosphere)
►
Show Figures
Figure 1


