Remote Sens. 2021, 13(16), 3114; https://doi.org/10.3390/rs13163114 - 6 Aug 2021
Cited by 17 | Viewed by 3300
Abstract
Glacial lake outburst flood (GLOF) is one of the major natural disasters in the Qinghai-Tibetan Plateau (QTP). On 25 June 2020, the outburst of the Jiwenco Glacial Lake (JGL) in the upper reaches of Nidu river in Jiari County of the QTP reached
[...] Read more.
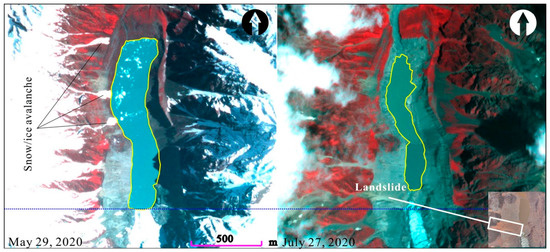
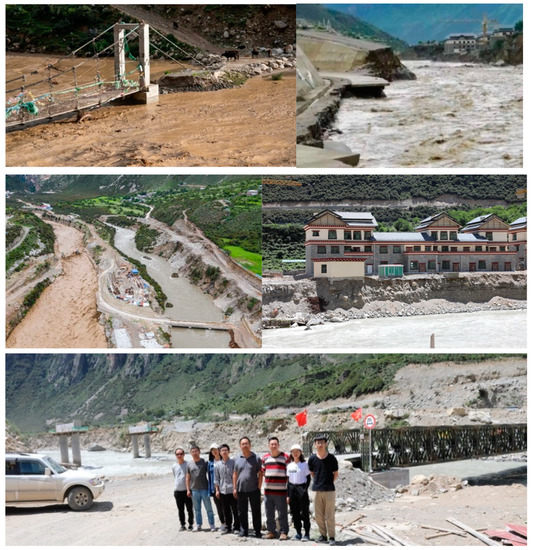
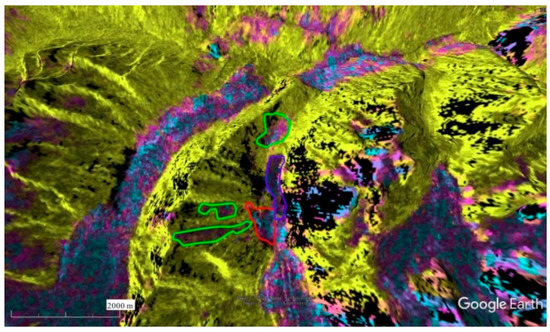
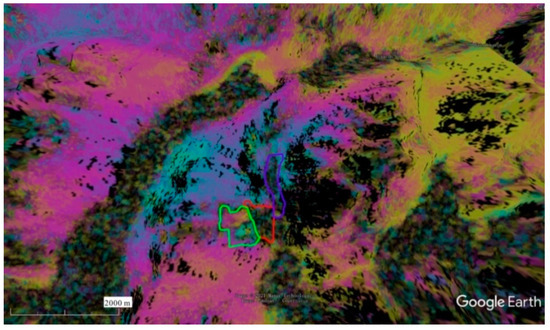
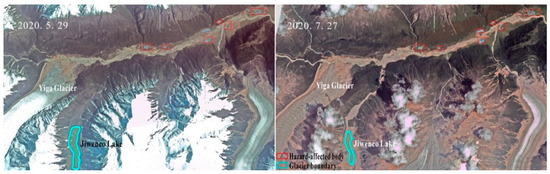
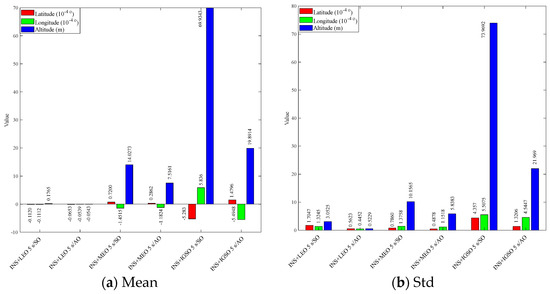
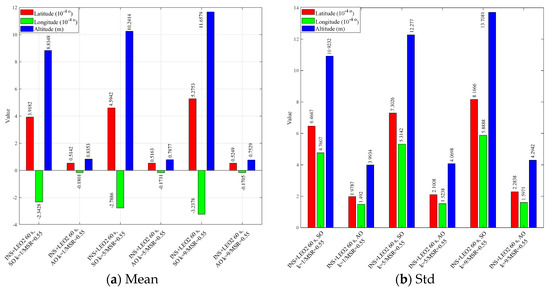
Glacial lake outburst flood (GLOF) is one of the major natural disasters in the Qinghai-Tibetan Plateau (QTP). On 25 June 2020, the outburst of the Jiwenco Glacial Lake (JGL) in the upper reaches of Nidu river in Jiari County of the QTP reached the downstream Niwu Township on 26 June, causing damage to many bridges, roads, houses, and other infrastructure, and disrupting telecommunications for several days. Based on radar and optical image data, the evolution of the JGL before and after the outburst was analyzed. The results showed that the area and storage capacity of the JGL were 0.58 square kilometers and 0.071 cubic kilometers, respectively, before the outburst (29 May), and only 0.26 square kilometers and 0.017 cubic kilometers remained after the outburst (27 July). The outburst reservoir capacity was as high as 5.4 million cubic meters. The main cause of the JGL outburst was the heavy precipitation process before outburst and the ice/snow/landslides entering the lake was the direct inducement. The outburst flood/debris flow disaster also led to many sections of the river and buildings in Niwu Township at high risk. Therefore, it is urgent to pay more attention to glacial lake outburst floods and other low-probability disasters, and early real-time engineering measures should be taken to minimize their potential impacts.
Full article
(This article belongs to the Topic High-Resolution Earth Observation Systems, Technologies, and Applications)
►
Show Figures
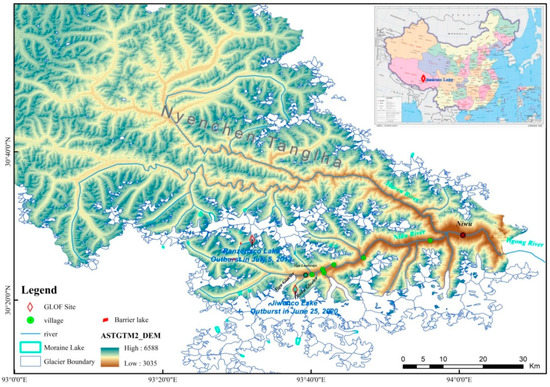
Figure 1


