- Article

This study introduces a multisource, multiscale approach to delineate structural lineaments and assess mineralization controls in Wadi El-Markh, Central Eastern Desert, Egypt. Four datasets (ALOS PALSAR DEM, NISAR L-band SAR, BIOMASS P-band SAR, and aeromagnetic data) were processed using tailored workflows to extract lineaments at complementary depths, from the surface to deep crustal levels. The AP-DEM workflow employed multi-azimuth hill-shading and directional Prewitt filtering. NISAR data were speckle-denoised before directional filtering of the HH and HV polarizations. BIOMASS data underwent polarimetric decomposition followed by directional filtering. Aeromagnetic data were reduced to the pole, analyzed using power-spectrum for depth estimation and regional–residual separation, and then processed using a CET grid-analysis workflow for lineaments extraction and generation of a Contact Occurrence Density (COD) map. Directional analysis revealed sensor-dependent biases: NISAR HH favored an E-W trend, whereas HV yielded a more isotropic distribution; BIOMASS surface scattering highlighted E-W and N-S trends, whereas volume scattering emphasized NW-SE and NE-SW trends. Aeromagnetic data identified both shallow- and deep-seated structures, with a dominant NW-SE trend. GIS-based fuzzy overlay produced a consensus structural complexity map. Validation against 15 known mining sites showed spatial coincidence rates ranging from 60% (AP-DEM and NISAR HH) to 86.7% (BIOMASS volume scattering and fuzzy overlay) for mining sites falling within high-structural-complexity zones. The results establish a reliable framework for identifying structurally controlled mineralization targets in arid terrains.
Minerals
14 September 2026
![(a) Location map of the study area in the Central Eastern Desert of Egypt; (b) geological rock units with known mining sites indicated (modified after [9,46]). Mining sites are superimposed on the geological map; all are related to gold mining; and correspond either to historical gold mines that are still active or have been reactivated, or to extensive artisanal gold excavations developed in recent years in both bedrock-hosted quartz veins and placer sediments.](https://mdpi-res.com/cdn-cgi/image/width=470%2Cheight=317/https://mdpi-res.com/minerals/minerals-16-00939/article_deploy/html/images/minerals-16-00939-ag-550.jpg)
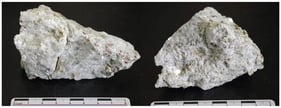
![Intrinsic activation and structural-evolution pathways in representative self-sufficient waste systems: (a) Cu-tailings reactivity and direct tile production [19,39], (b) thermally activated lithium slag [20], (c) thermally activated bauxite residue [21], and (d) pressurized carbonation of red mud [22]. Panel (a) integrates evidence from independent Cu-tailings studies and does not represent a single continuous experimental sequence. Created by the authors based on the cited studies.](https://mdpi-res.com/cdn-cgi/image/width=281%2Cheight=192/https://mdpi-res.com/minerals/minerals-16-00936/article_deploy/html/images/minerals-16-00936-g001-550.jpg)
![(A) Tectonic and geographical location map of the study area; (B) regional tectonic map of the Tethyan Himalayas [61]; (C) geological map of the Cuonadong dome [49].](https://mdpi-res.com/cdn-cgi/image/width=281%2Cheight=192/https://mdpi-res.com/minerals/minerals-16-00933/article_deploy/html/images/minerals-16-00933-g001-550.jpg)
![Spatial distribution of mining and metallurgical waste types in the Cartagena–La Unión Mining District (SE Spain), including location maps and detailed cartographic representation of the study area [21,22]. Colors and numbers (1–9) correspond to the classification of waste types defined in Table 1 and to the process-based scheme presented in Figure 2.](https://mdpi-res.com/cdn-cgi/image/width=281%2Cheight=192/https://mdpi-res.com/minerals/minerals-16-00477/article_deploy/html/images/minerals-16-00477-ag-550.jpg)
![(a) Simplified geological map of south Leinster highlighting the position of the East Carlow Deformation Zone (ECDZ) and its spatial association with spodumene-bearing LCT pegmatites along the south-east margin of the Leinster Granite batholith; (b) inset shows a geological map of the Moylisha pegmatite swarm with the LCT pegmatites hosted by the Tullow Lowlands Unit (TLU). Geological maps contain Irish Public Sector Data (Geological Survey Ireland) [55] licensed under a Creative Commons Attribution 4.0 International (CC BY 4.0).](https://mdpi-res.com/cdn-cgi/image/width=281%2Cheight=192/https://mdpi-res.com/minerals/minerals-16-00467/article_deploy/html/images/minerals-16-00467-g001-550.jpg)

![Geological map of the Ossa Morena Zone with the location of the Preguiça mine (adapted from [6,14]).](https://mdpi-res.com/cdn-cgi/image/width=281%2Cheight=192/https://mdpi-res.com/minerals/minerals-16-00348/article_deploy/html/images/minerals-16-00348-g001-550.jpg)