Next Issue
Volume 6, November
Previous Issue
Volume 6, September


ISPRS Int. J. Geo-Inf., Volume 6, Issue 10 (October 2017) – 29 articles

Cover Story (view full-size image): 
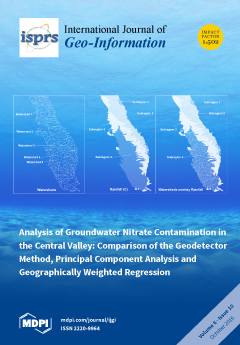
We investigated groundwater nitrate contamination in the Central Valley aquifer, California, USA, in relation to the source variables, aquifer characteristics, and geochemical conditions using three different statistical methods: Geodetector (GED), Principal Component Analysis (PCA) and Geographically Weighted Regression (GWR). Our comparative analysis of the three methods showed that GED was more advantageous, because it was less restrictive on input data, its output was more intuitive to interpret, and it captured all aspects of what the other two methods did. GED detected precipitation, fertilizer, manure, elevation, and clay as significant variables in controlling the spatial distribution of groundwater contamination in the Central Valley aquifer. San Joaquin Basin and Tulare Basin were identified as vulnerable regions with a higher percent of wells containing above 5 mg/L of nitrate. View the paper
  • Issues are regarded as officially published after their release is announced to the table of contents alert mailing list.
  • You may sign up for e-mail alerts to receive table of contents of newly released issues.
  • PDF is the official format for papers published in both, html and pdf forms. To view the papers in pdf format, click on the "PDF Full-text" link, and use the free Adobe Reader to open them.
Order results
Result details
Select all
Export citation of selected articles as:
2487 KiB  
Article
Flow Orientation Analysis for Major Activity Regions Based on Smart Card Transit Data
by Parul Singh, Kyuhyup Oh and Jae-Yoon Jung
ISPRS Int. J. Geo-Inf. 2017, 6(10), 318; https://doi.org/10.3390/ijgi6100318 - 23 Oct 2017
Cited by 3 | Viewed by 4885
Abstract
Analyzing public movement in transportation networks in a city is significant in understanding the life of citizen and making improved city plans for the future. This study focuses on investigating the flow orientation of major activity regions based on smart card transit data. [...] Read more.
Analyzing public movement in transportation networks in a city is significant in understanding the life of citizen and making improved city plans for the future. This study focuses on investigating the flow orientation of major activity regions based on smart card transit data. The flow orientation based on the real movements such as transit data can provide the easiest way of understanding public movement in the complicated transportation networks. First, high inflow regions (HIRs) are identified from transit data for morning and evening peak hours. The morning and evening HIRs are used to represent major activity regions for major daytime activities and residential areas, respectively. Second, the directional orientation of flow is then derived through the directional inflow vectors of the HIRs to show the bias in directional orientation and compare flow orientation among major activity regions. Finally, clustering analysis for HIRs is applied to capture the main patterns of flow orientations in the city and visualize the patterns on the map. The proposed methodology was illustrated with smart card transit data of bus and subway transportation networks in Seoul, Korea. Some remarkable patterns in the distribution of movements and orientations were found inside the city. The proposed methodology is useful since it unfolds the complexity and makes it easy to understand the main movement patterns in terms of flow orientation. Full article
Show Figures

Figure 1

6915 KiB  
Article
INTERLIS Language for Modelling Legal 3D Spaces and Physical 3D Objects by Including Formalized Implementable Constraints and Meaningful Code Lists
by Eftychia Kalogianni, Efi Dimopoulou, Wilko Quak, Michael Germann, Lorenz Jenni and Peter Van Oosterom
ISPRS Int. J. Geo-Inf. 2017, 6(10), 319; https://doi.org/10.3390/ijgi6100319 - 21 Oct 2017
Cited by 18 | Viewed by 5921
Abstract
The Land Administration Domain Model (LADM) is one of the first ISO spatial domain standards, and has been proven one of the best candidates for unambiguously representing 3D Rights, Restrictions and Responsibilities. Consequently, multiple LADM-based country profile implementations have been developed since the [...] Read more.
The Land Administration Domain Model (LADM) is one of the first ISO spatial domain standards, and has been proven one of the best candidates for unambiguously representing 3D Rights, Restrictions and Responsibilities. Consequently, multiple LADM-based country profile implementations have been developed since the approval of LADM as an ISO standard; however, there is still a gap for technical implementations. This paper summarizes LADM implementation approaches distilled from relevant publications available to date. Models based on land administration standards do focus on the legal aspects of urban structures; however, the juridical boundaries in 3D are sometimes (partly) bound by the corresponding physical objects, leading to ambiguous situations. To that end, more integrated approaches are being developed at a conceptual level, and it is evident that the evaluation and validation of 3D legal and physical models—both separately and together in the form of an integrated model—is vital. This paper briefly presents the different approaches to legal and physical integration that have been developed in the last decade, while the need for more explicit relationships between legal and physical notions is highlighted. In this regard, recent experience gained from implementing INTERLIS, the Swiss standard that enables land information system communications, in LADM-based country profiles, suggests the possibility of an integrated LADM/INTERLIS approach. Considering semantic interoperability within integrated models, the need for more formal semantics is underlined by introducing formalization of code lists and explicit definition of constraints. Last but not least, the first results of case studies based on the generic LADM/INTERLIS approach are presented. Full article
(This article belongs to the Special Issue Research and Development Progress in 3D Cadastral Systems)
Show Figures

Figure 1

3839 KiB  
Review
Review of Web Mapping: Eras, Trends and Directions
by Bert Veenendaal, Maria Antonia Brovelli and Songnian Li
ISPRS Int. J. Geo-Inf. 2017, 6(10), 317; https://doi.org/10.3390/ijgi6100317 - 21 Oct 2017
Cited by 61 | Viewed by 21095
Abstract
Web mapping and the use of geospatial information online have evolved rapidly over the past few decades. Almost everyone in the world uses mapping information, whether or not one realizes it. Almost every mobile phone now has location services and every event and [...] Read more.
Web mapping and the use of geospatial information online have evolved rapidly over the past few decades. Almost everyone in the world uses mapping information, whether or not one realizes it. Almost every mobile phone now has location services and every event and object on the earth has a location. The use of this geospatial location data has expanded rapidly, thanks to the development of the Internet. Huge volumes of geospatial data are available and daily being captured online, and are used in web applications and maps for viewing, analysis, modeling and simulation. This paper reviews the developments of web mapping from the first static online map images to the current highly interactive, multi-sourced web mapping services that have been increasingly moved to cloud computing platforms. The whole environment of web mapping captures the integration and interaction between three components found online, namely, geospatial information, people and functionality. In this paper, the trends and interactions among these components are identified and reviewed in relation to the technology developments. The review then concludes by exploring some of the opportunities and directions. Full article
(This article belongs to the Special Issue Web/Cloud Based Mapping and Geoinformation)
Show Figures

Figure 1

3140 KiB  
Article
Monitoring Rural Water Points in Tanzania with Mobile Phones: The Evolution of the SEMA App
by Rob Lemmens, Juma Lungo, Yola Georgiadou and Jeroen Verplanke
ISPRS Int. J. Geo-Inf. 2017, 6(10), 316; https://doi.org/10.3390/ijgi6100316 - 21 Oct 2017
Cited by 6 | Viewed by 7860
Abstract
Development professionals have deployed several mobile phone-based ICT (Information and Communications Technology) platforms in the global South for improving water, health, and education services. In this paper, we focus on a mobile phone-based ICT platform for water services, called Sensors, Empowerment and Accountability [...] Read more.
Development professionals have deployed several mobile phone-based ICT (Information and Communications Technology) platforms in the global South for improving water, health, and education services. In this paper, we focus on a mobile phone-based ICT platform for water services, called Sensors, Empowerment and Accountability in Tanzania (SEMA), developed by our team in the context of an action research project in Tanzania. Water users in villages and district water engineers in local governments may use it to monitor the functionality status of rural water points in the country. We describe the current architecture of the platform’s front-end (the SEMA app) and back-end and elaborate on its deployment in four districts in Tanzania. To conceptualize the evolution of the SEMA app, we use three concepts: transaction-intensiveness, discretion and crowdsourcing. The SEMA app effectively digitized only transaction-intensive tasks in the information flow between water users in villages and district water engineers. Further, it resolved two tensions over time: the tension over what to report (by decreasing the discretion of reporters) and over who should report (by constraining the reporting “crowd”). Full article
(This article belongs to the Special Issue Innovative Geo-Information Tools for Governance)
Show Figures

Figure 1

1179 KiB  
Article
A Framework for Evaluating Stay Detection Approaches
by Cornelia Schneider, Simon Gröchenig, Verena Venek, Michael Leitner and Siegfried Reich
ISPRS Int. J. Geo-Inf. 2017, 6(10), 315; https://doi.org/10.3390/ijgi6100315 - 19 Oct 2017
Cited by 5 | Viewed by 3731
Abstract
In recent years, sensors of mobile devices are increasingly used in the research field of Active and Assisted Living (AAL), in particular, for movement analysis. Questions, such as where users typically stay (and for how long), where they have been or where they [...] Read more.
In recent years, sensors of mobile devices are increasingly used in the research field of Active and Assisted Living (AAL), in particular, for movement analysis. Questions, such as where users typically stay (and for how long), where they have been or where they will most likely be going to, are of utmost importance for implementing smart AAL services. Due to the plethora of application scenarios and varying requirements, the challenge is the identification of an appropriate stay detection approach. Thus, this paper presents a comprehensive framework covering the entire process from data acquisition, pre-processing, parameterization to evaluation so that it can be applied to evaluate various stay detection methods. Additionally, ground truth data as well as application field data are used within the framework. The framework has been validated with three different spatio-temporal clustering approaches (time-based/incremental clustering, extended density based clustering, and a mixed method approach). Using the framework with ground truth data and data from the AAL field, it can be concluded that the time-based/incremental clustering approach is most suitable for this type of AAL applications. Furthermore, using two different datasets has proven successful as it provides additional data for selecting the appropriate method. Finally, the way the framework is designed it might be applied to other domains such as transportation, mobility, or tourism by adapting the pre-selection criteria. Full article
Show Figures

Graphical abstract

12999 KiB  
Article
Rural Road Extraction from High-Resolution Remote Sensing Images Based on Geometric Feature Inference
by Jian Liu, Qiming Qin, Jun Li and Yunpeng Li
ISPRS Int. J. Geo-Inf. 2017, 6(10), 314; https://doi.org/10.3390/ijgi6100314 - 19 Oct 2017
Cited by 36 | Viewed by 5228
Abstract
Road information as a type of basic geographic information is very important for services such as city planning and traffic navigation, as such there is an urgent need for updating road information in a timely manner. Scholars have proposed various methods of extracting [...] Read more.
Road information as a type of basic geographic information is very important for services such as city planning and traffic navigation, as such there is an urgent need for updating road information in a timely manner. Scholars have proposed various methods of extracting roads from remote sensing images, but most of them are not applicable to rural roads with diverse materials, large curvature changes, and a severe shelter problem. In view of these problems, we propose a road extraction method based on geometric feature inference. In this method, we make full use of the linear characteristics of roads, and construct a geometric knowledge base of rural roads using information on selected sample road segments. Based on the knowledge base, we identify the parallel line pairs in images, and further conduct grouping and connection instructed by knowledge reasoning, and finally obtain complete rural roads. The case study in Xiangtan City of China’s Hunan Province validates the performance of the proposed method. Full article
Show Figures

Figure 1

4117 KiB  
Article
An Interactive Planning Support Tool for Addressing Social Acceptance of Renewable Energy Projects in The Netherlands
by Johannes Flacke and Cheryl De Boer
ISPRS Int. J. Geo-Inf. 2017, 6(10), 313; https://doi.org/10.3390/ijgi6100313 - 19 Oct 2017
Cited by 22 | Viewed by 7390
Abstract
The implementation of renewable energy policies is lagging behind in The Netherlands. While several Dutch cities have ambitious goals for reducing greenhouse gas (GHG) emissions, the implementation of renewable energy projects has been rather slow. The main reasons for this are the limited [...] Read more.
The implementation of renewable energy policies is lagging behind in The Netherlands. While several Dutch cities have ambitious goals for reducing greenhouse gas (GHG) emissions, the implementation of renewable energy projects has been rather slow. The main reasons for this are the limited institutional capacities of local decision-makers, low levels of social acceptance of renewable-energy technologies, and limited opportunities for engagement of communities in decision-making processes. In order to address these issues we have developed an interactive planning support tool named COLLAGE for stakeholder participation in local renewable-energy planning. The goal of this paper is to analyze whether the COLLAGE tool helps to increase community engagement in renewable-energy projects and planning by increasing awareness and addressing social learning issues related to renewable-energy options. We tested the tool in a series of workshops with stakeholders and citizens from the city of Enschede, The Netherlands. The workshop results show that the tool helped involve stakeholders and communities in deciding where to locate renewable-energy facilities. It increased community members’ awareness of the benefits of and requirements for renewable energy by disclosing the spatial consequences of overall municipal goals. We conclude that the COLLAGE tool can be an important building block towards new local energy governance. Full article
(This article belongs to the Special Issue Innovative Geo-Information Tools for Governance)
Show Figures

Figure 1

8853 KiB  
Article
Towards 3D Cadastre in Serbia: Development of Serbian Cadastral Domain Model
by Aleksandra Radulović, Dubravka Sladić and Miro Govedarica
ISPRS Int. J. Geo-Inf. 2017, 6(10), 312; https://doi.org/10.3390/ijgi6100312 - 19 Oct 2017
Cited by 28 | Viewed by 7293
Abstract
This paper proposes a Serbian cadastral domain model as the country profile for the real estate cadastre, based on the Land Administration Domain Model (LADM), defined within ISO 19152. National laws and other legal acts were analyzed and the incorrect applications of the [...] Read more.
This paper proposes a Serbian cadastral domain model as the country profile for the real estate cadastre, based on the Land Administration Domain Model (LADM), defined within ISO 19152. National laws and other legal acts were analyzed and the incorrect applications of the law are outlined. The national “Strategy of measures and activities for increasing the quality of services in the field of geospatial data and registration of real property rights in the official state records”, which was adopted in 2017, cites the shortcomings of the existing cadastral information system. The proposed profile can solve several problems with the system, such as the lack of interoperability, mismatch of graphic and alphanumeric data, and lack of an integrated cadastral information system. Based on the existing data, the basic concepts of the Serbian cadastre were extracted and the applicability of LADM was tested on an obtained conceptual model. Upon obtaining positive results, a complete country profile was developed according to valid national laws and rulebooks. A table of mappings of LADM classes and country profile classes is presented in this paper, together with an analysis of the conformance level. The proposed Serbian country profile is completely conformant at the medium level and on several high-level classes. LADM also provides support for three-dimensional (3D) representations and 3D registration of rights, so the creation of a country profile for Serbia is a starting point toward a 3D cadastre. Given the existence of buildings with overlapping rights and restrictions in 3D, considering expanding the spatial profile with 3D geometries is necessary. Possible solutions to these situations were analyzed. Since the two-dimensional (2D) cadastre in Serbia is not fully formed, the proposed solution is to use the 2D model for simple right situations, and the 3D model for more complex situations. Full article
(This article belongs to the Special Issue Research and Development Progress in 3D Cadastral Systems)
Show Figures

Figure 1

21827 KiB  
Article
Road Intersection Detection through Finding Common Sub-Tracks between Pairwise GNSS Traces
by Xingzhe Xie and Wilfried Philips
ISPRS Int. J. Geo-Inf. 2017, 6(10), 311; https://doi.org/10.3390/ijgi6100311 - 18 Oct 2017
Cited by 12 | Viewed by 4078
Abstract
This paper proposes a novel approach to detect road intersections from GNSS traces. Different from the existing methods of detecting intersections directly from the road users’ turning behaviors, the proposed method detects intersections indirectly from common sub-tracks shared by different traces. We first [...] Read more.
This paper proposes a novel approach to detect road intersections from GNSS traces. Different from the existing methods of detecting intersections directly from the road users’ turning behaviors, the proposed method detects intersections indirectly from common sub-tracks shared by different traces. We first compute the local distance matrix for each pair of traces. Second, we apply image processing techniques to find all “sub-paths” in the matrix, which represents good alignment between local common sub-tracks. Lastly, we identify the intersections from the endpoints of the common sub-tracks through Kernel Density Estimation (KDE). Experimental results show that the proposed method outperforms the traditional turning point-based methods in terms of the F-score, and our previous connecting point-based method in terms of computational efficiency. Full article
Show Figures

Figure 1

4439 KiB  
Article
A Content-Based Remote Sensing Image Change Information Retrieval Model
by Caihong Ma, Wei Xia, Fu Chen, Jianbo Liu, Qin Dai, Liyuan Jiang, Jianbo Duan and Wei Liu
ISPRS Int. J. Geo-Inf. 2017, 6(10), 310; https://doi.org/10.3390/ijgi6100310 - 18 Oct 2017
Cited by 16 | Viewed by 4928
Abstract
With the rapid development of satellite remote sensing technology, the size of image datasets in many application areas is growing exponentially and the demand for Land-Cover and Land-Use change remote sensing data is growing rapidly. It is thus becoming hard to efficiently and [...] Read more.
With the rapid development of satellite remote sensing technology, the size of image datasets in many application areas is growing exponentially and the demand for Land-Cover and Land-Use change remote sensing data is growing rapidly. It is thus becoming hard to efficiently and intelligently retrieve the change information that users need from massive image databases. In this paper, content-based image retrieval is successfully applied to change detection, and a content-based remote sensing image change information retrieval model is introduced. First, the construction of a new model framework for change information retrieval from a remote sensing database is described. Then, as the target content cannot be expressed by one kind of feature alone, a multiple-feature, integrated retrieval model is proposed. Thirdly, an experimental prototype system that was set up to demonstrate the validity and practicability of the model is described. The proposed model is a new method of acquiring change detection information from remote sensing imagery and so can reduce the need for image pre-processing and also deal with problems related to seasonal changes, as well as other problems encountered in the field of change detection. Meanwhile, the new model has important implications for improving remote sensing image management and autonomous information retrieval. The experiment results obtained using a Landsat data set show that the use of the new model can produce promising results. A coverage rate and mean average precision of 71% and 89%, respectively, were achieved for the top 20 returned pairs of images. Full article
(This article belongs to the Special Issue Earth/Community Observations for Climate Change Research)
Show Figures

Graphical abstract

6212 KiB  
Article
Machine Learning Classification of Buildings for Map Generalization
by Jaeeun Lee, Hanme Jang, Jonghyeon Yang and Kiyun Yu
ISPRS Int. J. Geo-Inf. 2017, 6(10), 309; https://doi.org/10.3390/ijgi6100309 - 18 Oct 2017
Cited by 31 | Viewed by 8146
Abstract
A critical problem in mapping data is the frequent updating of large data sets. To solve this problem, the updating of small-scale data based on large-scale data is very effective. Various map generalization techniques, such as simplification, displacement, typification, elimination, and aggregation, must [...] Read more.
A critical problem in mapping data is the frequent updating of large data sets. To solve this problem, the updating of small-scale data based on large-scale data is very effective. Various map generalization techniques, such as simplification, displacement, typification, elimination, and aggregation, must therefore be applied. In this study, we focused on the elimination and aggregation of the building layer, for which each building in a large scale was classified as “0-eliminated,” “1-retained,” or “2-aggregated.” Machine-learning classification algorithms were then used for classifying the buildings. The data of 1:1000 scale and 1:25,000 scale digital maps obtained from the National Geographic Information Institute were used. We applied to these data various machine-learning classification algorithms, including naive Bayes (NB), decision tree (DT), k-nearest neighbor (k-NN), and support vector machine (SVM). The overall accuracies of each algorithm were satisfactory: DT, 88.96%; k-NN, 88.27%; SVM, 87.57%; and NB, 79.50%. Although elimination is a direct part of the proposed process, generalization operations, such as simplification and aggregation of polygons, must still be performed for buildings classified as retained and aggregated. Thus, these algorithms can be used for building classification and can serve as preparatory steps for building generalization. Full article
(This article belongs to the Special Issue Machine Learning for Geospatial Data Analysis)
Show Figures

Figure 1

2665 KiB  
Article
Exploring the Role of the Spatial Characteristics of Visible and Near-Infrared Reflectance in Predicting Soil Organic Carbon Density
by Long Guo, Yiyun Chen, Tiezhu Shi, Chang Zhao, Yaolin Liu, Shanqin Wang and Haitao Zhang
ISPRS Int. J. Geo-Inf. 2017, 6(10), 308; https://doi.org/10.3390/ijgi6100308 - 18 Oct 2017
Cited by 10 | Viewed by 5522
Abstract
Soil organic carbon stock plays a key role in the global carbon cycle and the precision agriculture. Visible and near-infrared reflectance spectroscopy (VNIRS) can directly reflect the internal physical construction and chemical substances of soil. The partial least squares regression (PLSR) is a [...] Read more.
Soil organic carbon stock plays a key role in the global carbon cycle and the precision agriculture. Visible and near-infrared reflectance spectroscopy (VNIRS) can directly reflect the internal physical construction and chemical substances of soil. The partial least squares regression (PLSR) is a classical and highly commonly used model in constructing soil spectral models and predicting soil properties. Nevertheless, using PLSR alone may not consider soil as characterized by strong spatial heterogeneity and dependence. However, considering the spatial characteristics of soil can offer valuable spatial information to guarantee the prediction accuracy of soil spectral models. Thus, this study aims to construct a rapid and accurate soil spectral model in predicting soil organic carbon density (SOCD) with the aid of the spatial autocorrelation of soil spectral reflectance. A total of 231 topsoil samples (0–30 cm) were collected from the Jianghan Plain, Wuhan, China. The spectral reflectance (350–2500 nm) was used as auxiliary variable. A geographically-weighted regression (GWR) model was used to evaluate the potential improvement of SOCD prediction when the spatial information of the spectral features was considered. Results showed that: (1) The principal components extracted from PLSR have a strong relationship with the regression coefficients at the average sampling distance (300 m) based on the Moran’s I values. (2) The eigenvectors of the principal components exhibited strong relationships with the absorption spectral features, and the regression coefficients of GWR varied with the geographical locations. (3) GWR displayed a higher accuracy than that of PLSR in predicting the SOCD by VNIRS. This study aimed to help people realize the importance of the spatial characteristics of soil properties and their spectra. This work also introduced guidelines for the application of GWR in predicting soil properties by VNIRS. Full article
Show Figures

Figure 1

1915 KiB  
Article
The Local Colocation Patterns of Crime and Land-Use Features in Wuhan, China
by Han Yue, Xinyan Zhu, Xinyue Ye and Wei Guo
ISPRS Int. J. Geo-Inf. 2017, 6(10), 307; https://doi.org/10.3390/ijgi6100307 - 17 Oct 2017
Cited by 36 | Viewed by 6998
Abstract
Most studies of spatial colocation patterns of crime and land-use features in geographical information science and environmental criminology employ global measures, potentially obscuring spatial inhomogeneity. This study investigated the relationships of three types of crime with 22 types of land-use in Wuhan, China. [...] Read more.
Most studies of spatial colocation patterns of crime and land-use features in geographical information science and environmental criminology employ global measures, potentially obscuring spatial inhomogeneity. This study investigated the relationships of three types of crime with 22 types of land-use in Wuhan, China. First, global colocation patterns were examined. Then, local colocation patterns were examined based on the recently-proposed local colocation quotient, followed by a detailed comparison of the results. Different types of crimes were encouraged or discouraged by different types of land-use features with varying intensity, and the local colocation patterns demonstrated spatial inhomogeneity. Full article
(This article belongs to the Special Issue Place-Based Research in GIScience and Geoinformatics)
Show Figures

Figure 1

9577 KiB  
Article
Overview of the OGC CDB Standard for 3D Synthetic Environment Modeling and Simulation
by Sara Saeedi, Steve Liang, David Graham, Michael F. Lokuta and Mir Abolfazl Mostafavi
ISPRS Int. J. Geo-Inf. 2017, 6(10), 306; https://doi.org/10.3390/ijgi6100306 - 17 Oct 2017
Cited by 9 | Viewed by 7907
Abstract
Recent advances in sensor and platform technologies, such as satellite systems, unmanned aerial vehicles (UAV), manned aerial platforms, and ground-based sensor networks have resulted in massive volumes of data being produced and collected about the earth. Processing, managing, and analyzing these data is [...] Read more.
Recent advances in sensor and platform technologies, such as satellite systems, unmanned aerial vehicles (UAV), manned aerial platforms, and ground-based sensor networks have resulted in massive volumes of data being produced and collected about the earth. Processing, managing, and analyzing these data is one of the main challenges in 3D synthetic representation used in modeling and simulation (M&S) of the natural environment. M&S devices, such as flight simulators, traditionally require a variety of different databases to provide a synthetic representation of the world. M&S often requires integration of data from a variety of sources stored in different formats. Thus, for simulation of a complex synthetic environment, such as a 3D terrain model, tackling interoperability among its components (geospatial data, natural and man-made objects, dynamic and static models) is a critical challenge. Conventional approaches used local proprietary data models and formats. These approaches often lacked interoperability and created silos of content within the simulation community. Therefore, open geospatial standards are increasingly perceived as a means to promote interoperability and reusability for 3D M&S. In this paper, the Open Geospatial Consortium (OGC) CDB Standard is introduced. “CDB” originally referred to Common DataBase, which is currently considered as a name with no abbreviation in the OGC community. The OGC CDB is an international standard for structuring, modeling, and storing geospatial information required in high-performance modeling and simulation applications. CDB defines the core conceptual models, use cases, requirements, and specifications for employing geospatial data in 3D M&S. The main features of the OGC CDB Standard are described as the run-time performance, full plug-and-play interoperable geospatial data store, usefulness in 3D and dynamic simulation environment, ability to integrate proprietary and open-source data formats. Furthermore, compatibility with the OGC standards baseline reduces the complexity of discovering, transforming, and streaming geospatial data into the synthetic environment and makes them more widely acceptable to major geospatial data/software producers. This paper includes an overview of OGC CDB version 1.0, which defines a conceptual model and file structure for the storage, access, and modification of a multi-resolution 3D synthetic environment data store. Finally, this paper presents a perspective of future versions of the OGC CDB and what the steps are for humanizing the OGC CDB standard with the other OGC/ISO standards baseline. Full article
Show Figures

Figure 1

4734 KiB  
Article
Towards Detecting the Crowd Involved in Social Events
by Wei Huang, Hongchao Fan and Alexander Zipf
ISPRS Int. J. Geo-Inf. 2017, 6(10), 305; https://doi.org/10.3390/ijgi6100305 - 16 Oct 2017
Cited by 5 | Viewed by 4208
Abstract
Knowing how people interact with urban environments is fundamental for a variety of fields, ranging from transportation to social science. Despite the fact that human mobility patterns have been a major topic of study in recent years, a challenge to understand large-scale human [...] Read more.
Knowing how people interact with urban environments is fundamental for a variety of fields, ranging from transportation to social science. Despite the fact that human mobility patterns have been a major topic of study in recent years, a challenge to understand large-scale human behavior when a certain event occurs remains due to a lack of either relevant data or suitable approaches. Psychological crowd refers to a group of people who are usually located at different places and show different behaviors, but who are very sensitively driven to take the same act (gather together) by a certain event, which has been theoretically studied by social psychologists since the 19th century. This study aims to propose a computational approach using a machine learning method to model psychological crowds, contributing to the better understanding of human activity patterns under events. Psychological features and mental unity of the crowd are computed to detect the involved individuals. A national event happening across the USA in April, 2015 is analyzed using geotagged tweets as a case study to test our approach. The result shows that 81% of individuals in the crowd can be successfully detected. Through investigating the geospatial pattern of the involved users, not only can the event related users be identified but also those unobserved users before the event can be uncovered. The proposed approach can effectively represent the psychological feature and measure the mental unity of the psychological crowd, which sheds light on the study of large-scale psychological crowd and provides an innovative way to understanding human behavior under events. Full article
Show Figures

Figure 1

2409 KiB  
Article
Assessing Spatial Accessibility of Public and Private Residential Aged Care Facilities: A Case Study in Wuhan, Central China
by Enxiang Cai, Yaolin Liu, Ying Jing, Lei Zhang, Jiwei Li and Chaohui Yin
ISPRS Int. J. Geo-Inf. 2017, 6(10), 304; https://doi.org/10.3390/ijgi6100304 - 16 Oct 2017
Cited by 23 | Viewed by 5533
Abstract
In the increasingly serious aging China, aged service is the provision of one of the most urgent and important public services to citizens, and private facilities has become an important service force with the aged service market opening in China. This study aims [...] Read more.
In the increasingly serious aging China, aged service is the provision of one of the most urgent and important public services to citizens, and private facilities has become an important service force with the aged service market opening in China. This study aims to explore the spatial variation in the accessibility of residential aged care facilities (RACFs) and compared the service capacity of public RACFs and private RACFs. It facilitates RACFs to be allocated rationally in the future and achieve the equalization of aged services. A village-level analysis of spatial access to public and private RACFs by the multi-catchment sizes Gaussian two-step floating catchment area (MCSG2SFCA) method was conducted through a case study in Wuhan City in Central China. The major results are as follows: (1) the accessibility of RACFs in urban areas is better than that in rural areas; (2) the public RACFs still dominate aged care services but the role of private RACFs is important as well; (3) in developed urban areas, the accessibility to private RACFs surpasses that of public ones, and the situation is opposite in rural areas; (4) the capacity of aged care services in Wuhan is not high, meanwhile there is remarkable regional disparity. The accessibility of RACFs in Wuhan is not satisfactory, and there is a significant gap between urban and rural areas. The private RACFs have significantly improved the urban capacity of aged care services, but the role in rural areas is still very weak. Full article
Show Figures

Figure 1

4760 KiB  
Article
A Sightseeing Spot Recommendation System That Takes into Account the Change in Circumstances of Users
by Yuri Mizutani and Kayoko Yamamoto
ISPRS Int. J. Geo-Inf. 2017, 6(10), 303; https://doi.org/10.3390/ijgi6100303 - 15 Oct 2017
Cited by 13 | Viewed by 4188
Abstract
The present study aimed to design, develop, operate and evaluate a sightseeing spot recommendation system for urban sightseeing spots in order to support individual, as well as group sightseeing activities while taking into consideration the user’s needs, which can change according to the [...] Read more.
The present study aimed to design, develop, operate and evaluate a sightseeing spot recommendation system for urban sightseeing spots in order to support individual, as well as group sightseeing activities while taking into consideration the user’s needs, which can change according to the circumstances (each user’s important conditions and sightseeing unit). The system was developed by integrating Web-GIS (Geographic Information Systems), the pairing system, the evaluation system, as well as the recommendation system into a single system, and it was also connected with external SNS (Social Networking Services: Twitter and Facebook). Additionally, the system was operated for four weeks in the central part of Yokohama City in Kanagawa Prefecture, Japan, and the total number of users was 52. Based on the results of the web questionnaire survey, the usefulness of the system when sightseeing was high, and the recommendation function of sightseeing spots, which is an original function, has received mainly good ratings. From the results of the access analysis of users’ log data, it is evident that the system has been used by different types of devices, just as it was designed for, and that the system has been used according to the purpose of the present study, which is to support the sightseeing activities of users. Full article
Show Figures

Figure 1

15086 KiB  
Article
Determination of Areas Susceptible to Landsliding Using Spatial Patterns of Rainfall from Tropical Rainfall Measuring Mission Data, Rio de Janeiro, Brazil
by Renato Fontes Guimarães, Wátila Portela Machado, Osmar Abílio De Carvalho, Júnior, David R. Montgomery, Roberto Arnaldo Trancoso Gomes, Harvey M. Greenberg, Márcio Cataldi and Pedro Coutinho Mendonça
ISPRS Int. J. Geo-Inf. 2017, 6(10), 289; https://doi.org/10.3390/ijgi6100289 - 06 Oct 2017
Cited by 5 | Viewed by 4906
Abstract
Spatial patterns of shallow landslide initiation reflect both spatial patterns of heavy rainfall and areas susceptible to mass movements. We determine the areas most susceptible to shallow landslide occurrence through the calculation of critical soil cohesion and spatial patterns of rainfall derived from [...] Read more.
Spatial patterns of shallow landslide initiation reflect both spatial patterns of heavy rainfall and areas susceptible to mass movements. We determine the areas most susceptible to shallow landslide occurrence through the calculation of critical soil cohesion and spatial patterns of rainfall derived from TRMM (Tropical Rainfall Measuring Mission) data for Paraty County, State of Rio de Janeiro, Brazil. Our methodology involved: (a) creating the digital elevation model (DEM) and deriving attributes such as slope and contributing area; (b) incorporating spatial patterns of rainfall derived from TRMM into the shallow slope stability model SHALSTAB; and (c) quantitative assessment of the correspondence of mapped landslide scars to areas predicted to be most prone to shallow landsliding. We found that around 70% of the landslide scars occurred in less than 10% of the study area identified as potentially unstable. The greatest concentration of landslides occurred in areas where the root strength of vegetation is an important contribution to slope stability in regions of orographically-enhanced rainfall on the coastal topographic flank. This approach helps quantify landslide hazards in areas with similar geomorphological characteristics, but different spatial patterns of rainfall. Full article
Show Figures

Figure 1

4231 KiB  
Article
Analyzing Refugee Migration Patterns Using Geo-tagged Tweets
by Franziska Hübl, Sreten Cvetojevic, Hartwig Hochmair and Gernot Paulus
ISPRS Int. J. Geo-Inf. 2017, 6(10), 302; https://doi.org/10.3390/ijgi6100302 - 02 Oct 2017
Cited by 28 | Viewed by 8403
Abstract
Over the past few years, analysts have begun to materialize the “Citizen as Sensors” principle by analyzing human movements, trends and opinions, as well as the occurrence of events from tweets. This study aims to use geo-tagged tweets to identify and visualize refugee [...] Read more.
Over the past few years, analysts have begun to materialize the “Citizen as Sensors” principle by analyzing human movements, trends and opinions, as well as the occurrence of events from tweets. This study aims to use geo-tagged tweets to identify and visualize refugee migration patterns from the Middle East and Northern Africa to Europe during the initial surge of refugees aiming for Europe in 2015, which was caused by war and political and economic instability in those regions. The focus of this study is on exploratory data analysis, which includes refugee trajectory extraction and aggregation as well as the detection of topical clusters along migration routes using the V-Analytics toolkit. Results suggest that only few refugees use Twitter, limiting the number of extracted travel trajectories to Europe. Iterative exploration of filter parameters, dynamic result mapping, and content analysis were essential for the refinement of trajectory extraction and cluster detection. Whereas trajectory extraction suffers from data scarcity, hashtag-based topical clustering draws a clearer picture about general refugee routes and is able to find geographic areas of high tweet activities on refugee related topics. Identified spatio-temporal clusters can complement migration flow data published by international authorities, which typically come at the aggregated (e.g., national) level. The paper concludes with suggestions to address the scarcity of geo-tagged tweets in order to obtain more detailed results on refugee migration patterns. Full article
Show Figures

Figure 1

4221 KiB  
Article
A Hybrid Process/Thread Parallel Algorithm for Generating DEM from LiDAR Points
by Yibin Ren, Zhenjie Chen, Ge Chen, Yong Han and Yanjie Wang
ISPRS Int. J. Geo-Inf. 2017, 6(10), 300; https://doi.org/10.3390/ijgi6100300 - 28 Sep 2017
Cited by 5 | Viewed by 4686
Abstract
Airborne Light Detection and Ranging (LiDAR) is widely used in digital elevation model (DEM) generation. However, the very large volume of LiDAR datasets brings a great challenge for the traditional serial algorithm. Using parallel computing to accelerate the efficiency of DEM generation from [...] Read more.
Airborne Light Detection and Ranging (LiDAR) is widely used in digital elevation model (DEM) generation. However, the very large volume of LiDAR datasets brings a great challenge for the traditional serial algorithm. Using parallel computing to accelerate the efficiency of DEM generation from LiDAR points has been a hot topic in parallel geo-computing. Generally, most of the existing parallel algorithms running on high-performance clusters (HPC) were in process-paralleling mode, with a static scheduling strategy. The static strategy would not respond dynamically according to the computation progress, leading to load unbalancing. Additionally, because each process has independent memory space, the cost of dealing with boundary problems increases obviously with the increase in the number of processes. Actually, these two problems can have a significant influence on the efficiency of DEM generation for larger datasets, especially for those of irregular shapes. Thus, to solve these problems, we combined the advantages of process-paralleling with the advantages of thread-paralleling, forming a new idea: using process-paralleling to achieve a flexible schedule and scalable computation, using thread-paralleling inside the process to reduce boundary problems. Therefore, we proposed a hybrid process/thread parallel algorithm for generating DEM from LiDAR points. Firstly, at the process level, we designed a parallel method (PPDB) to accelerate the partitioning of LiDAR points. We also proposed a new dynamic scheduling strategy to achieve better load balancing. Secondly, at the thread level, we designed an asynchronous parallel strategy to hide the cost of LiDAR points’ reading. Lastly, we tested our algorithm with three LiDAR datasets. Experiments showed that our parallel algorithm had no influence on the accuracy of the resultant DEM. At the same time, our algorithm reduced the conversion time from 112,486 s to 2342 s when we used the largest dataset (150 GB). The PPDB was parallelizable and the new dynamic scheduling strategy achieved a better load balancing. Furthermore, the asynchronous parallel strategy reduced the impact of LiDAR points reading. When compared with the traditional process-paralleling algorithm, the hybrid process/thread parallel algorithm improved the conversion efficiency by 30%. Full article
Show Figures

Figure 1

7734 KiB  
Article
Entropy-Based Fusion of Water Indices and DSM Derivatives for Automatic Water Surfaces Extraction and Flood Monitoring
by Paramate Horkaew and Supattra Puttinaovarat
ISPRS Int. J. Geo-Inf. 2017, 6(10), 301; https://doi.org/10.3390/ijgi6100301 - 27 Sep 2017
Cited by 11 | Viewed by 5765
Abstract
Reliable water surface extraction is essential for river delineation and flood monitoring. Obtaining such information from fine resolution satellite imagery has attracted much interest for geographic and remote sensing applications. However, those images are often expensive and difficult to acquire. This study proposes [...] Read more.
Reliable water surface extraction is essential for river delineation and flood monitoring. Obtaining such information from fine resolution satellite imagery has attracted much interest for geographic and remote sensing applications. However, those images are often expensive and difficult to acquire. This study proposes a more cost-effective technique, employing freely available Landsat images. Despite its extensive spectrum and robust discrimination capability, Landsat data are normally of medium spatial resolution and, as such, fail to delineate smaller hydrological features. Based on Multivariate Mutual Information (MMI), the Landsat images were fused with Digital Surface Model (DSM) on the spatial domain. Each coinciding pixel would then contain not only rich indices but also intricate topographic attributes, derived from its respective sources. The proposed data fusion ensures robust, precise, and observer-invariable extraction of water surfaces and their branching, while eliminating spurious details. Its merit was demonstrated by effective discrimination of flooded regions from natural rivers for flood monitoring. The assessments we completed suggest improved extraction compared to traditional methods. Compared with manual digitizing, this method also exhibited promising consistency. Extraction using Dempster–Shafer fusion provided a 91.81% F-measure, 93.09% precision, 90.74% recall, and 98.25% accuracy, while using Majority Voting fusion resulted in an 84.91% F-measure, 75.44% precision, 97.37% recall, and 97.21% accuracy. Full article
Show Figures

Figure 1

437 KiB  
Article
On Metrics for Location-Aware Games
by Luis E. Rodríguez-Pupo, Sven Casteleyn and Carlos Granell
ISPRS Int. J. Geo-Inf. 2017, 6(10), 299; https://doi.org/10.3390/ijgi6100299 - 27 Sep 2017
Cited by 5 | Viewed by 4510
Abstract
Metrics are important and well-known tools to measure users’ behavior in games, and gameplay in general. Particularities of location-aware games—a class of games where the player’s location plays a central role-demand specific support in metrics to adequately address the spatio-temporal features such games [...] Read more.
Metrics are important and well-known tools to measure users’ behavior in games, and gameplay in general. Particularities of location-aware games—a class of games where the player’s location plays a central role-demand specific support in metrics to adequately address the spatio-temporal features such games exhibit. In this article, we analyse and discuss how existing game analytics platforms address the spatio-temporal features of location-aware games. Our analysis reveals that little support is available. Next, based on the analysis, we propose a classification of spatial metrics, embedded in existing literature, and discuss three types of spatial metrics-point-, trajectory- and area-based metrics-, and elaborate examples and difficulties. Finally, we discuss how spatial metrics may be deployed to improve gameplay in location-aware games. Full article
Show Figures

Figure 1

10814 KiB  
Article
Mapping Changes in Carbon Storage and Productivity Services Provided by Riparian Ecosystems of Semi-Arid Environments in Northwestern Mexico
by Romeo Mendez-Estrella, Jose Raul Romo-Leon and Alejandro E. Castellanos
ISPRS Int. J. Geo-Inf. 2017, 6(10), 298; https://doi.org/10.3390/ijgi6100298 - 26 Sep 2017
Cited by 13 | Viewed by 5326
Abstract
We analyze the importance of riparian ecosystems (RE) as critical areas for carbon storage and productivity in semi-arid regions of Northwest Mexico. We calculated the carbon storage by land cover and compared temporal trends of basal productivity (MODIS) and pre-monsoon productivity (Landsat) of [...] Read more.
We analyze the importance of riparian ecosystems (RE) as critical areas for carbon storage and productivity in semi-arid regions of Northwest Mexico. We calculated the carbon storage by land cover and compared temporal trends of basal productivity (MODIS) and pre-monsoon productivity (Landsat) of RE, to other land cover types. We used land cover maps generated previously for the region (years 1993, 2002, and 2011), assigning values of carbon stored in aerial and root biomass, as well as organic carbon stored in the soil. To estimate productivity (proxy), time series were generated using the Normalized Difference Vegetation Index (NDVI) values of Landsat 4–5 TM and MODIS for each land cover type. We found that RE stores 93,147 tC/ha, about 1.5 times the estimated storage for oak forest (65,048 tC/ha). Productivity of RE was similar to highly productive land cover types, such as agriculture and oak forest, and higher than in the rest of the ecosystems of the region. We also found that changes from RE to agriculture and cultivated grasslands represented a decrease in productivity (p < 0.001). Finally, we report a gradual decrease in basal productivity (p = 0.0151) and pre-monsoon productivity (p = 0.031) in the RE. These results help us understand that changes in land use, intensive use of water, and climate can influence the ecosystem services of productivity and carbon storage offered by RE in semi-arid areas. Full article
Show Figures

Figure 1

23689 KiB  
Article
Analysis of Groundwater Nitrate Contamination in the Central Valley: Comparison of the Geodetector Method, Principal Component Analysis and Geographically Weighted Regression
by Anil Shrestha and Wei Luo
ISPRS Int. J. Geo-Inf. 2017, 6(10), 297; https://doi.org/10.3390/ijgi6100297 - 26 Sep 2017
Cited by 54 | Viewed by 8012
Abstract
Groundwater nitrate contamination in the Central Valley (CV) aquifer of California is a ubiquitous groundwater problem found in various parts of the valley. Heavy irrigation and application of fertilizer over the last several decades have caused groundwater nitrate contamination in several domestic, public [...] Read more.
Groundwater nitrate contamination in the Central Valley (CV) aquifer of California is a ubiquitous groundwater problem found in various parts of the valley. Heavy irrigation and application of fertilizer over the last several decades have caused groundwater nitrate contamination in several domestic, public and monitoring wells in the CV above EPA’s Maximum Contamination level of 10 mg/L. Source variables, aquifer susceptibility and geochemical variables could affect the contamination rate and groundwater quality in the aquifer. A comparative study was conducted using Geodetector (GED), Principal Component Analysis (PCA) and Geographically Weighted Regression (GWR) to observe which method is most effective at revealing environmental variables that control groundwater nitrate concentration. The GED method detected precipitation, fertilizer, elevation, manure and clay as statistically significant variables. Watersheds with percent of wells above 5 mg/L of nitrate were higher in San Joaquin and Tulare Basin compared to Sacramento Valley. PCA grouped cropland, fertilizer, manure and precipitation as a first principal component, suggesting similar construct of these variables and existence of data redundancy. The GWR model performed better than the OLS model, with lower corrected Akaike Information Criterion (AIC) values, and captured the spatial heterogeneity of fertilizer, precipitation and elevation for the percent of wells above 5 mg/L in the CV. Overall, the GED method was more effective than the PCA and GWR methods in determining the influence of explanatory variables on groundwater nitrate contamination. Full article
Show Figures

Figure 1

11528 KiB  
Article
A New Approach for Interpreting the Morisita Index of Aggregation through Quadrat Size
by James J. Hayes and Oscar Castillo
ISPRS Int. J. Geo-Inf. 2017, 6(10), 296; https://doi.org/10.3390/ijgi6100296 - 24 Sep 2017
Cited by 19 | Viewed by 5959
Abstract
Spatial point pattern analysis is commonly used in ecology to examine the spatial distribution of individual organisms or events, which may shed light on the operation of underlying ecological processes driving the development of a spatial pattern. Commonly used quadrat-based methods of measuring [...] Read more.
Spatial point pattern analysis is commonly used in ecology to examine the spatial distribution of individual organisms or events, which may shed light on the operation of underlying ecological processes driving the development of a spatial pattern. Commonly used quadrat-based methods of measuring spatial clustering or dispersion tend to be strongly influenced by the choice of quadrat size and population density. Using valley oak (Quercus lobata) stands at multiple sites, we show that values of the Morisita Index are sensitive to the choice of quadrat size, and that the comparative interpretation of the index for multiple sites or populations is problematic due to differences in scale and clustering intensity from site to site, which may call for different quadrat sizes for each site. We present a new method for analyzing the Morisita Index to estimate the appropriate quadrat size for a given site and to aid interpretation of the clustering index across multiple sites with local differences. By plotting the maximum clustering intensity (Imr) found across a range of quadrat sizes, we were able to describe how a spatial pattern changes when quadrat size varies and to identify scales of clustering and quadrat sizes for analysis of spatial patterns under different local conditions. Computing and plotting the instantaneous rate of change (first derivative of rMax), we were able to evaluate clustering across multiple sites on a standardized scale. The magnitude of the rMax first derivative is a useful tool to quantify the degree of crowding, dispersion, or random spatial distribution as a function of quadrat size. Full article
Show Figures

Figure 1

24311 KiB  
Article
Comparative Analysis on Topological Structures of Urban Street Networks
by Jingyi Lin and Yifang Ban
ISPRS Int. J. Geo-Inf. 2017, 6(10), 295; https://doi.org/10.3390/ijgi6100295 - 24 Sep 2017
Cited by 20 | Viewed by 5915
Abstract
Street systems are the backbone of cities. With global urbanization and economic development, street systems have undergone significant development along with the growth of cities. In this paper, the authors select three cities with varying sizes, histories, locations, and growth dynamics: Stockholm, Toronto, [...] Read more.
Street systems are the backbone of cities. With global urbanization and economic development, street systems have undergone significant development along with the growth of cities. In this paper, the authors select three cities with varying sizes, histories, locations, and growth dynamics: Stockholm, Toronto, and Nanjing. We analyze topological structures of their public street systems based on GIS and complex network theory. Considering the planarity of street systems, we first calculate various topological measures, including α, β, and γ indices, and density. This is followed by comparing three centrality measures, i.e., degree, betweenness, and closeness in complex network theory. In this part, we investigate these characteristics of nodes and edges in a primal representation, and discuss their relations with urban growth mechanisms. Full article
Show Figures

Figure 1

2157 KiB  
Article
Mapping the Far Right: Geomedia in an Educational Response to Right-Wing Extremism
by Thomas Jekel, Michael Lehner and Robert Vogler
ISPRS Int. J. Geo-Inf. 2017, 6(10), 294; https://doi.org/10.3390/ijgi6100294 - 22 Sep 2017
Cited by 4 | Viewed by 5820
Abstract
Across Europe, and probably the world, messages of the extreme right surface with increasing and alarming regularity in both public and virtual space. Within the virtual space, geomedia are increasingly used in nationalist propaganda, a trend which is embedded in a wider development [...] Read more.
Across Europe, and probably the world, messages of the extreme right surface with increasing and alarming regularity in both public and virtual space. Within the virtual space, geomedia are increasingly used in nationalist propaganda, a trend which is embedded in a wider development in public discourse, election results, and policies. In Austria and Germany, particular sensibilities due to the responsibility for the Holocaust have developed, leading to various specific education initiatives that address this part of history. This paper presents an activist learning environment using geomedia to deconstruct right-wing extremist discourses, and has been tested used in university settings in Salzburg and Vienna. Using a combination of Instagram and geospatial technologies not visible to learners, results of reflection and learning processes are analyzed qualitatively across two slightly different enactments of the learning environment. Experiences suggest an encouraging potential of geomedia use in critical learning processes, as long as the technology is hidden from learners, forming an incentive, support, and contextualization of the learning process. Full article
Show Figures

Figure 1

2384 KiB  
Article
Using a Hidden Markov Model for Improving the Spatial-Temporal Consistency of Time Series Land Cover Classification
by Wenbing Gong, Shenghui Fang, Guang Yang and Mengyu Ge
ISPRS Int. J. Geo-Inf. 2017, 6(10), 292; https://doi.org/10.3390/ijgi6100292 - 22 Sep 2017
Cited by 21 | Viewed by 7516
Abstract
Time series land cover maps play a key role in monitoring the dynamic change of land use. To obtain classification maps with better spatial-temporal consistency and classification accuracy, this study used an algorithm that incorporated information from spatial and temporal neighboring observations in [...] Read more.
Time series land cover maps play a key role in monitoring the dynamic change of land use. To obtain classification maps with better spatial-temporal consistency and classification accuracy, this study used an algorithm that incorporated information from spatial and temporal neighboring observations in a hidden Markov model (HMM) to improve the time series land cover maps initially produced by a support vector machine (SVM). To investigate the effects of different initial distributions and transition probability matrices on the classification of the HMM, we designed different experimental schemes with different input elements to verify this algorithm with Landsat and HJ satellite images. In addition, we introduced spatial weights into the HMM to make effective use of spatial information. The experimental results showed that the HMM considered that spatial weights could eliminate the vast majority of illogical land cover transition that may occur in previous pixel-wise classification, and that this model had obvious advantages in spatial-temporal consistency and classification accuracy over some existing classification models. Full article
Show Figures

Graphical abstract

14750 KiB  
Article
Geo-Hazard Detection and Monitoring Using SAR and Optical Images in a Snow-Covered Area: The Menyuan (China) Test Site
by Qihuan Huang, Yian Wang, Jia Xu, Angelique Nishyirimbere and Zhimin Li
ISPRS Int. J. Geo-Inf. 2017, 6(10), 293; https://doi.org/10.3390/ijgi6100293 - 21 Sep 2017
Cited by 8 | Viewed by 5562
Abstract
In this work, we combine SAR and optical images for geo-hazard detection and monitoring in Western China. An extremely small baseline of C-band SAR image pairs acquired from Sentinel-1A at Menyuan, China, is analyzed. Apart from the large area of coseismal deformation, we [...] Read more.
In this work, we combine SAR and optical images for geo-hazard detection and monitoring in Western China. An extremely small baseline of C-band SAR image pairs acquired from Sentinel-1A at Menyuan, China, is analyzed. Apart from the large area of coseismal deformation, we proposed an earthquake-derived landslide detecting method by removing the coseismal deformation with polynomial fitting, then the detected moving areas were confirmed with Chinese Gaofen-1 optical satellite images. Sentinel-1A C-band interferograms show about a 7-cm line of sight movement caused by the MS 6.4 Menyuan earthquake; meanwhile, several features indicative of ground movement were detected by the proposed method and demonstrated by the Gaofen-1 optical images; the interpretation of high-resolution optical data complemented the goal of better understanding the behavior of geo-hazard disasters. InSAR time series analysis provides an opportunity for continuous monitoring of geo-hazards in remote areas, while the optical image method is easily affected by decorrelation due to snowfall. Full article
Show Figures

Figure 1

Previous Issue
Next Issue
Back to TopTop