1. Introduction
In drylands regions, most stream discharges are of an ephemeral nature with no perennial discharges of surface water that are locally produced [
1]. In the Middle East region, ephemeral streams are termed wadis and the underlying alluvial sediments are commonly the only sources of fresh groundwater in many basins [
2]. Wadis have been historically areas where oases have occurred in which wells containing freshwater and small farms were developed.
The aquifer underlying a wadi channel is recharged primarily by infiltration and percolation coupled with transmission loss (infiltration) in the channel during flood events [
1,
2,
3,
4,
5,
6,
7,
8,
9,
10,
11,
12]. A number of important factors dictate the quantity of recharge to these aquifers. They include: (1) duration of the channel flood event, (2) degree of surface water ponding within the wadi channel during an event, (3) vertical hydraulic conductivity of the alluvial sediments, (4) degree of horizontal stratification (e.g., presence of mud layers within the sequence), (5) slope and structure of the bedding within the aquifer, (6) position of the water level in the aquifer at the time of the flood, and (7) the occurrence of deep-rooted vegetation (phreatophytes).
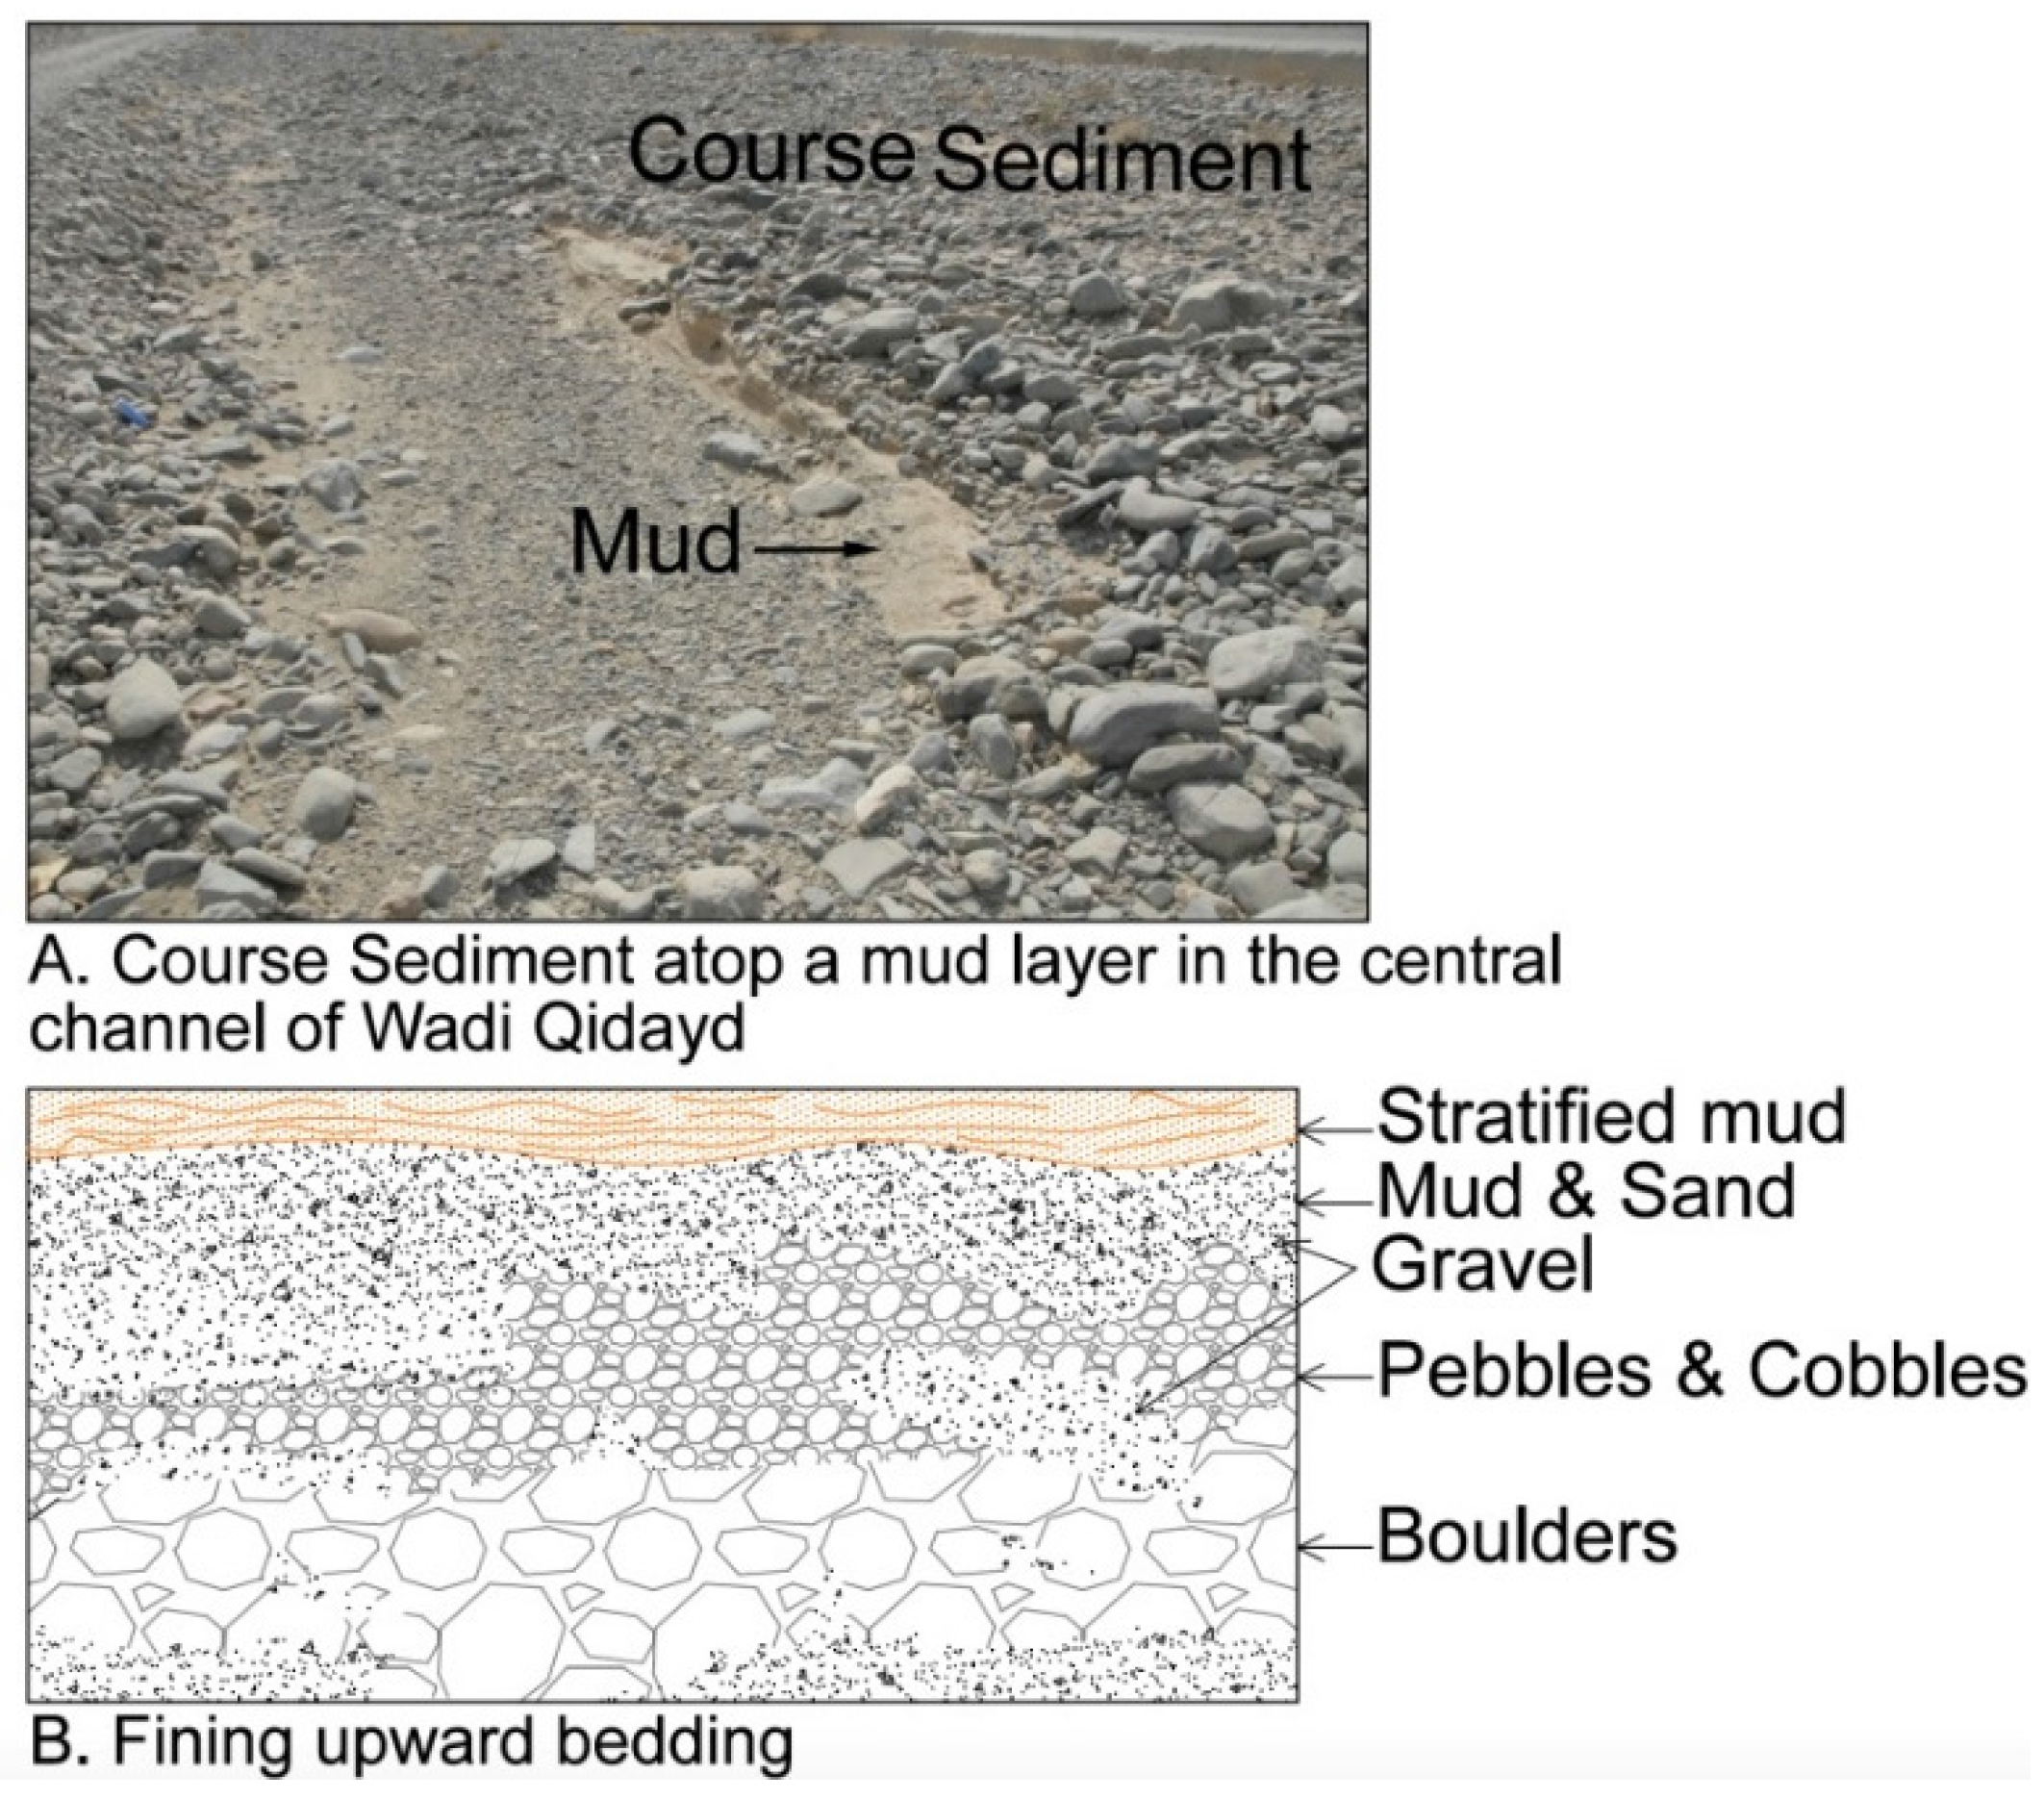
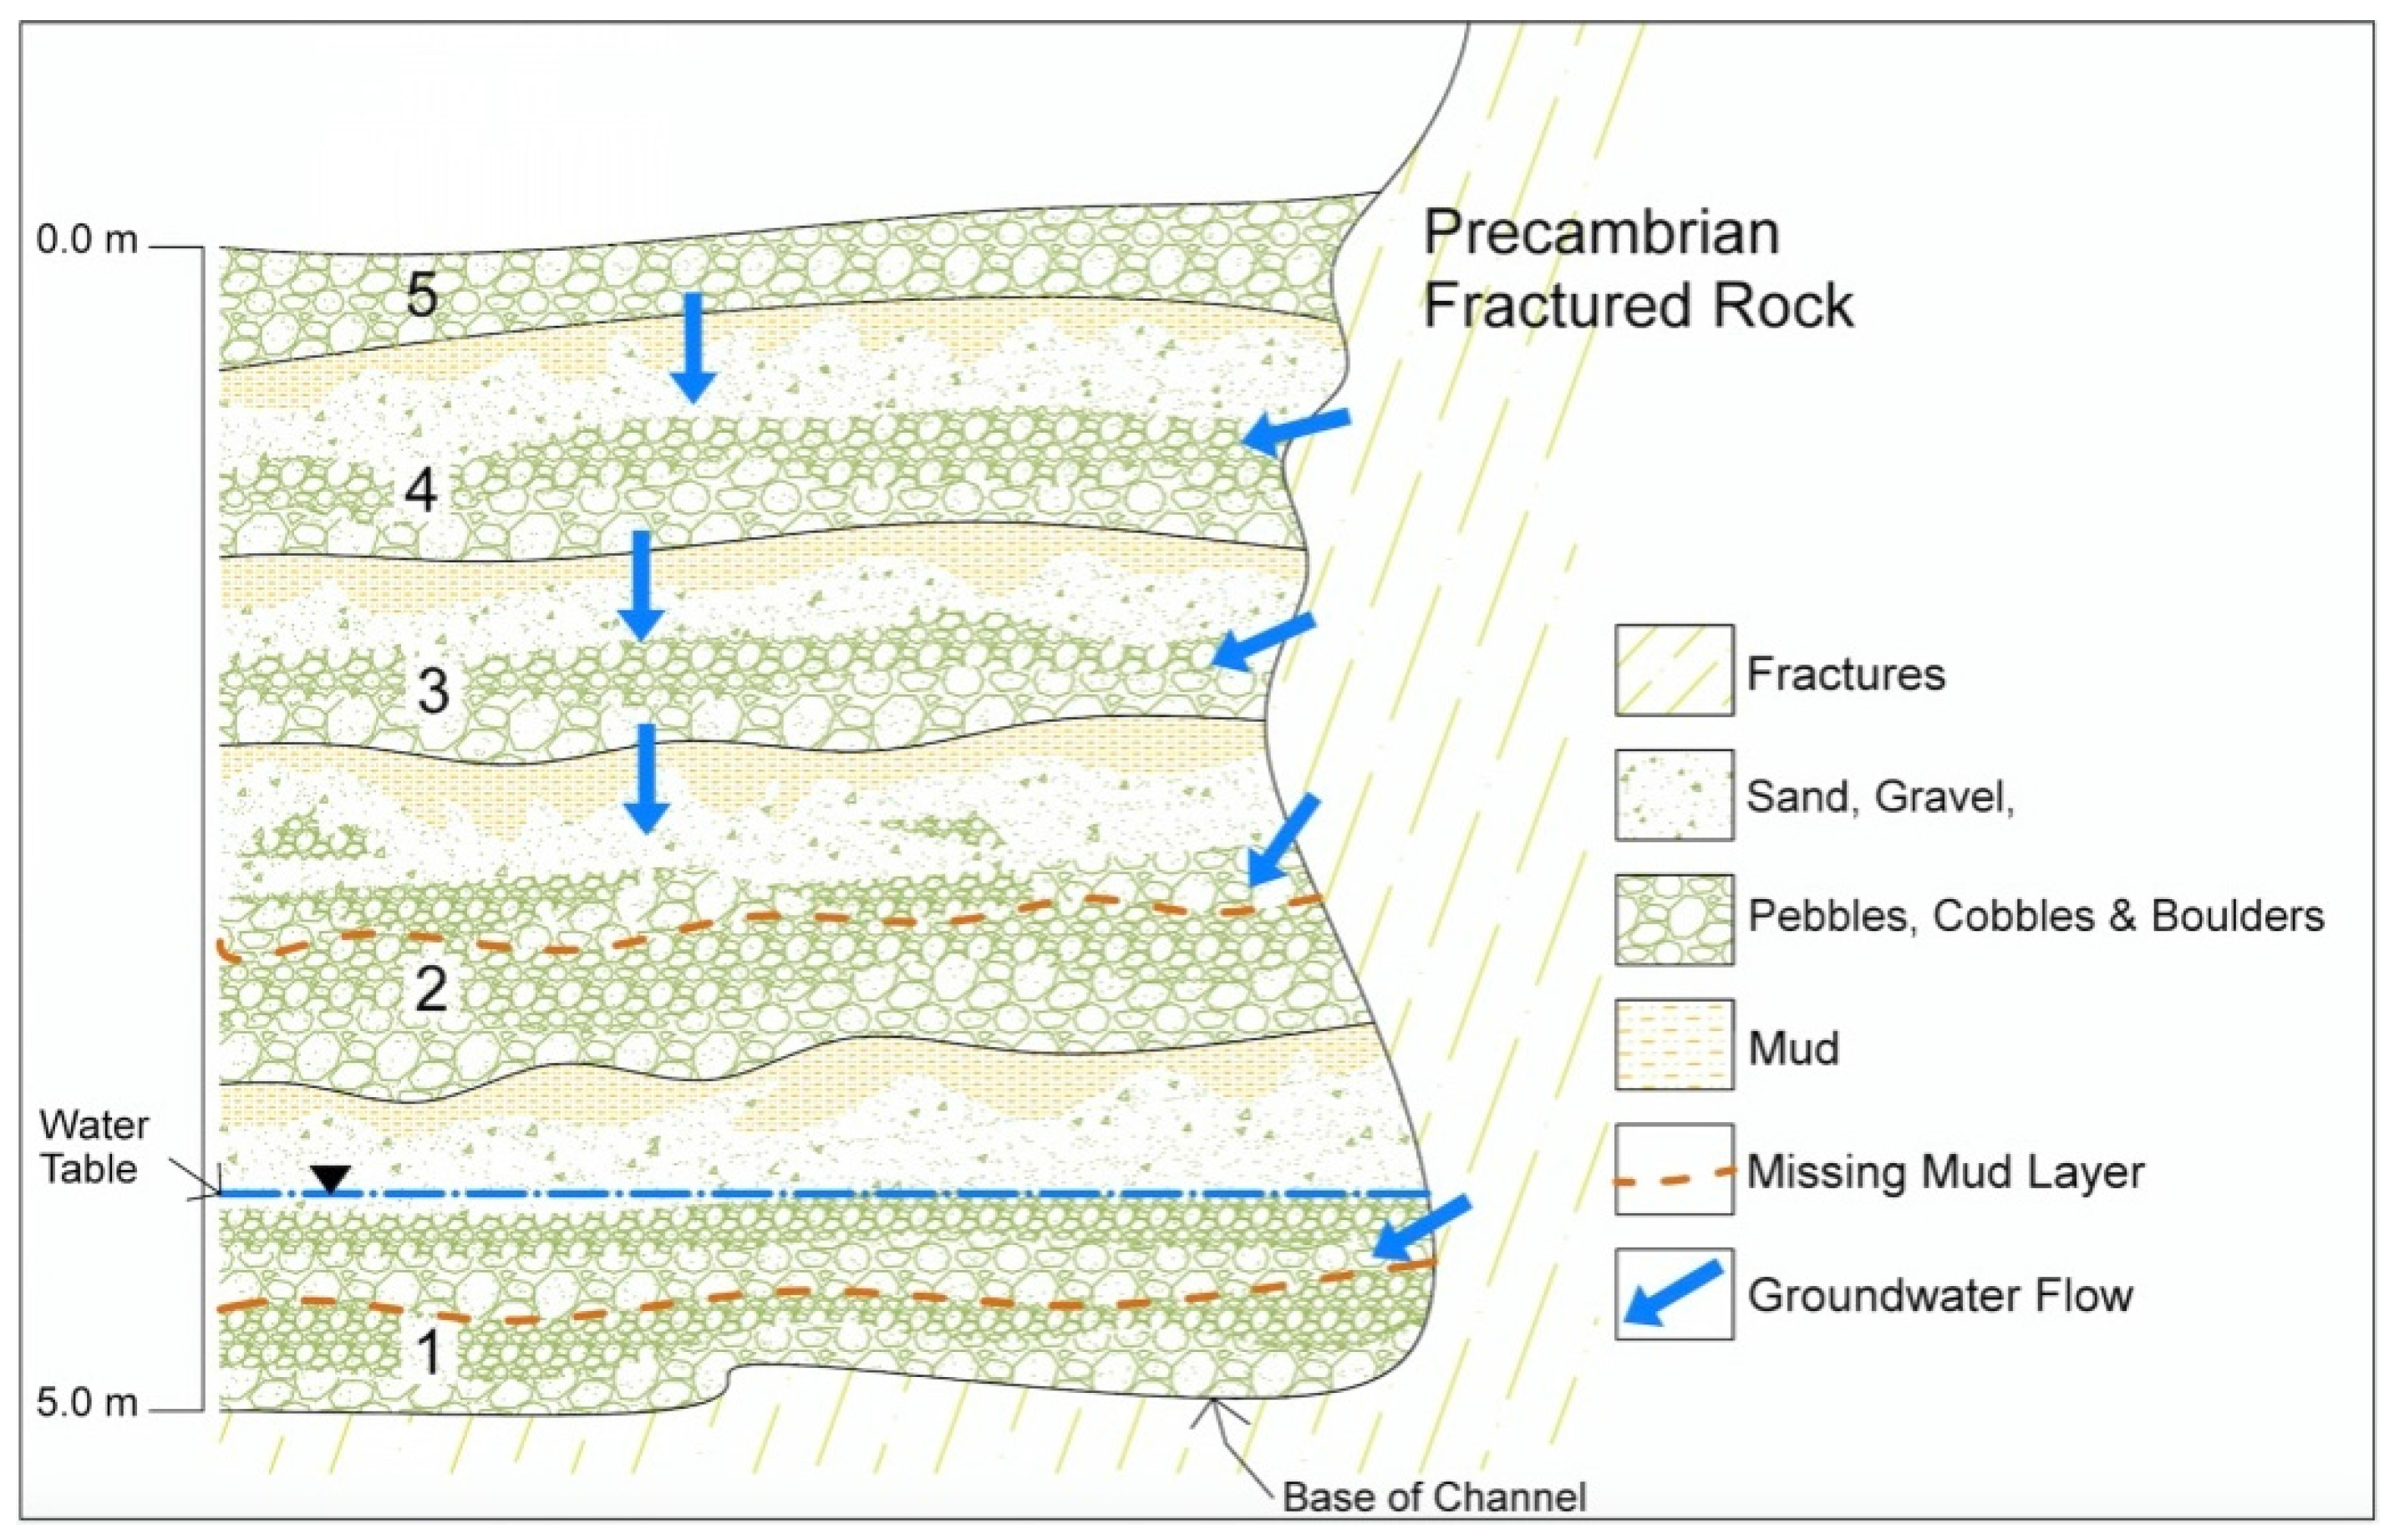
Depending upon the geology of the basin in which a wadi channel lies, the alluvial sediments constituting the underlying aquifer can consist primarily of boulders, gravel, and sand, or can contain significant quantities of mud that forms a stacked pattern with mud layers creating separation between the high hydraulic conductivity gravel beds ([
12],
Figure 1). Where the aquifer consists of fining upwards beds associated with individual flood events, the saturated front of water percolating downward in the aquifer may be intercepted and diverted horizontally downstream or can be extracted by vegetation that has horizontal oriented root masses occurring atop mud layers [
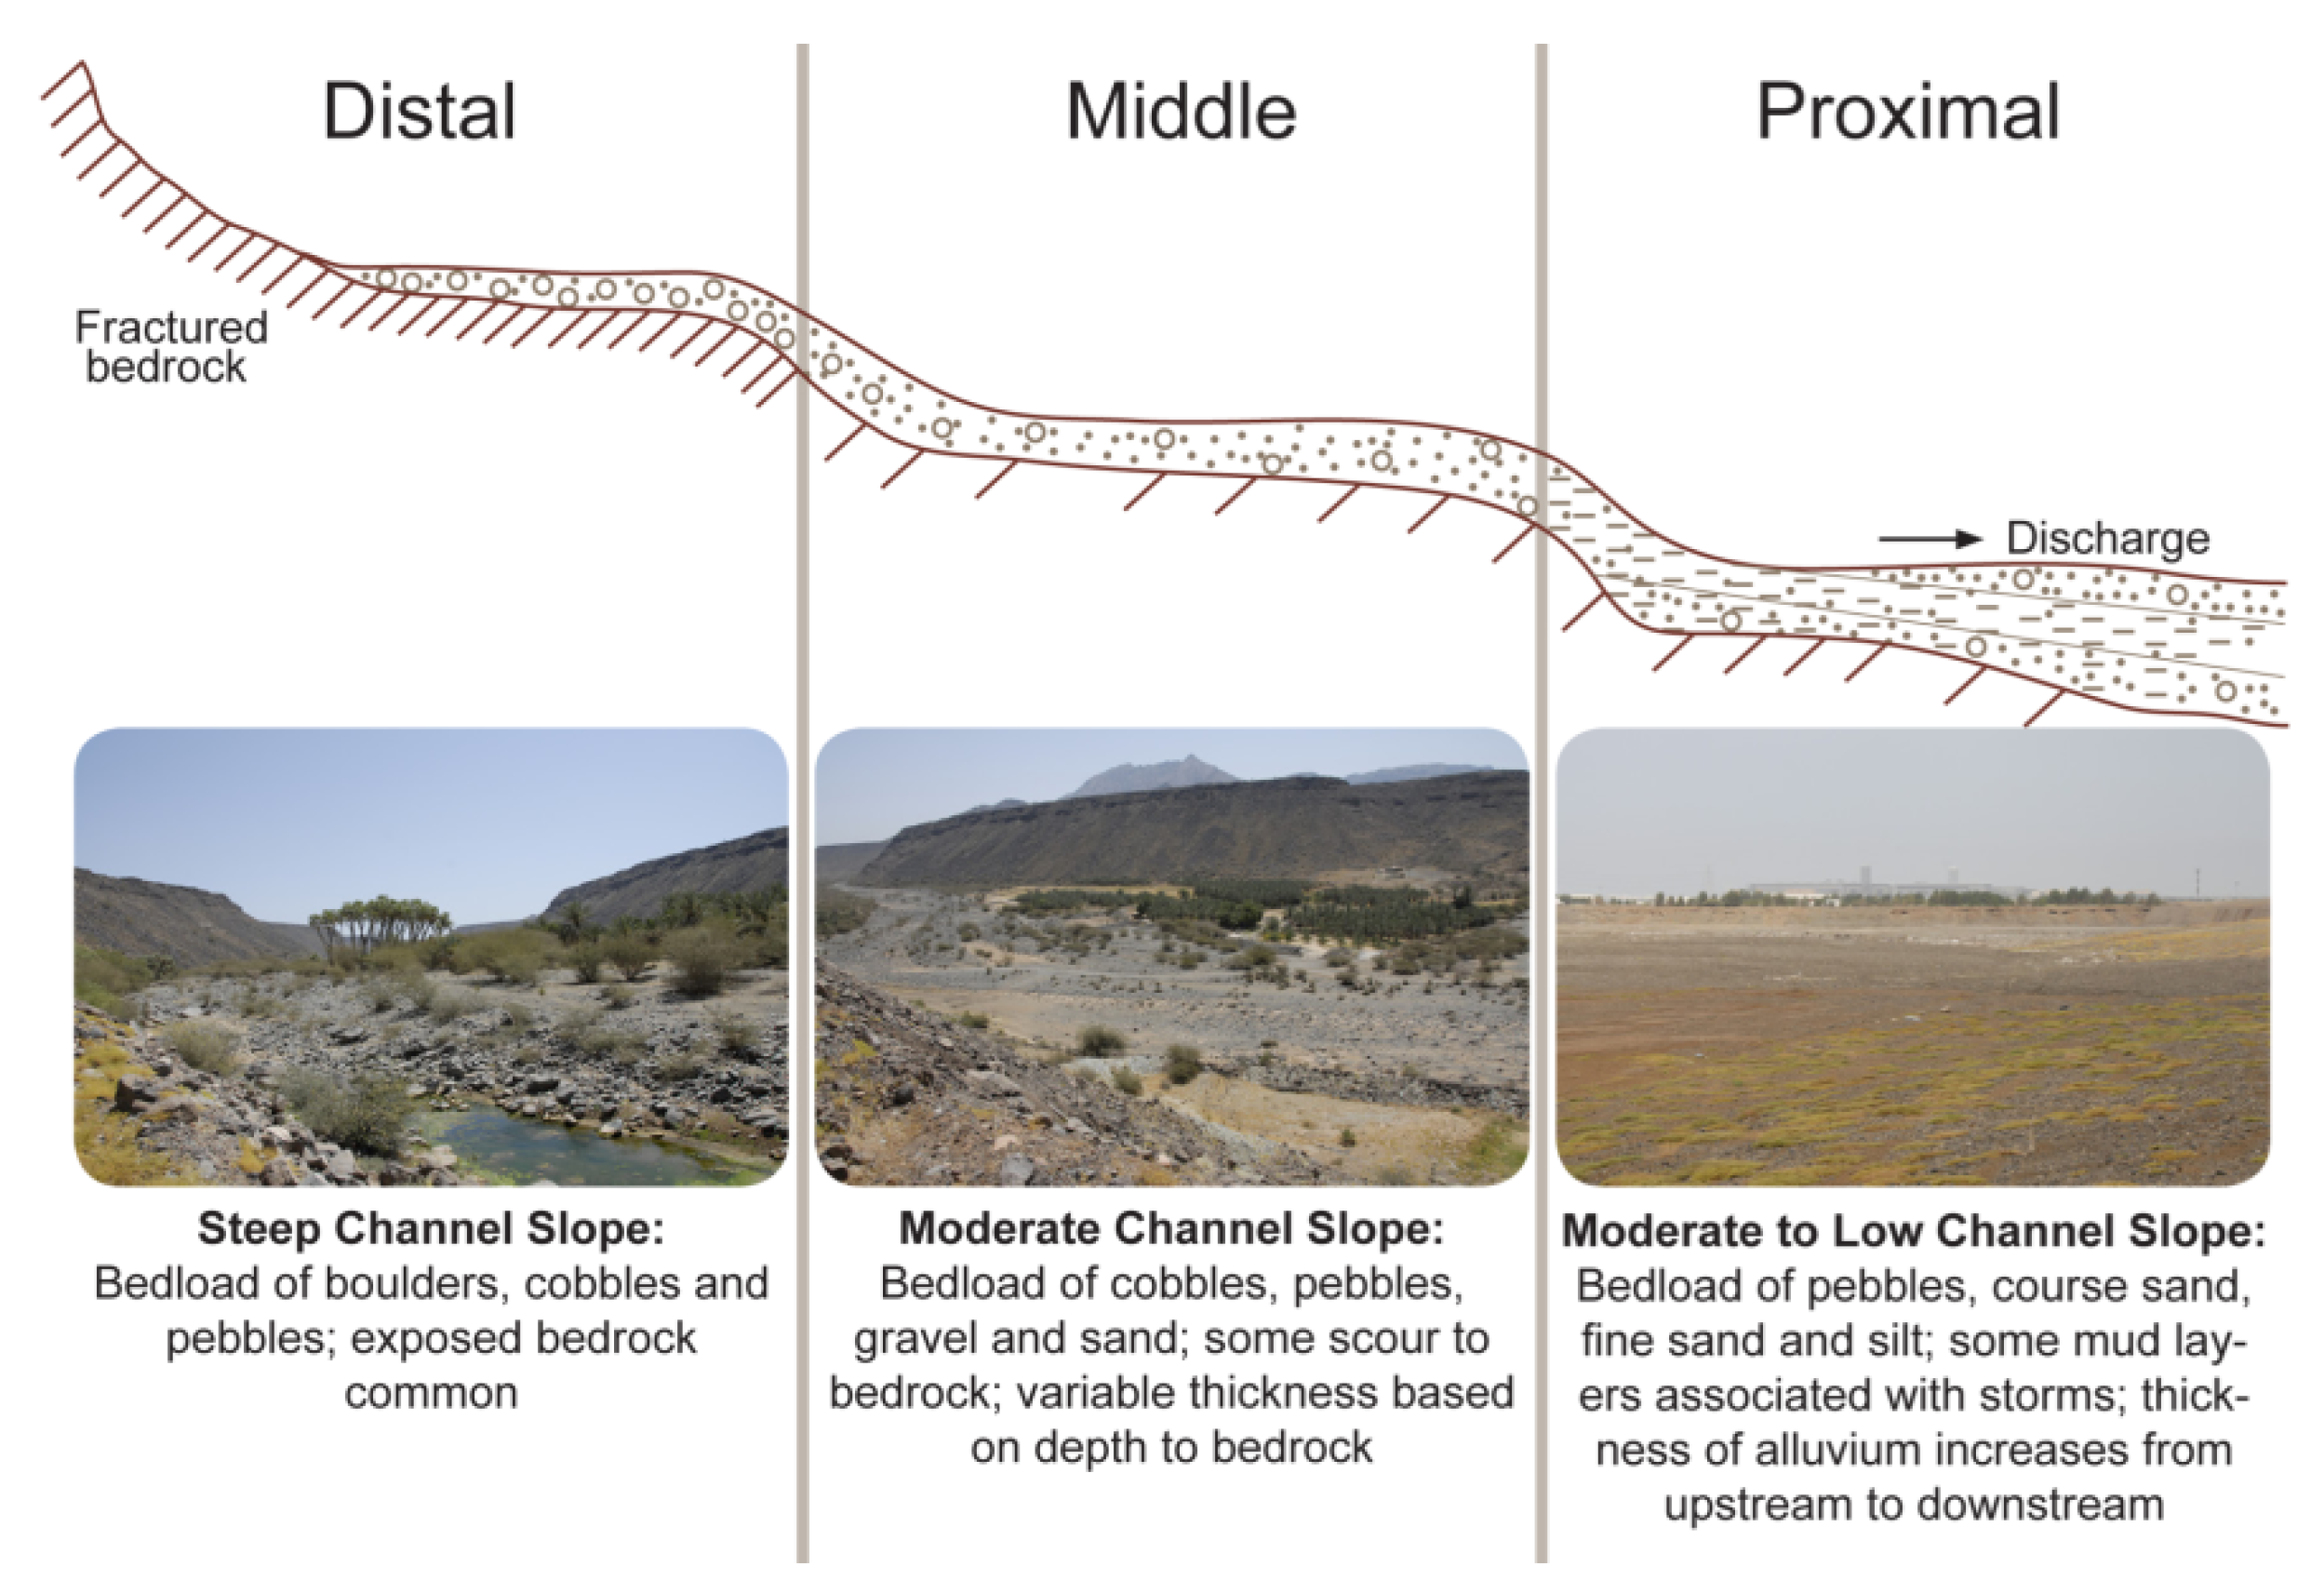
1]. In wadi segments where the channel slope is steep, the bedded sediments can be truncated, causing the percolated water to emerge downstream and be lost to direct evaporation or can be transported to a shallow depth at which diffusive evaporation loss can occur. This issue is particularly problematic at transition locations where slope inflections occur between channel-reach segments. In addition, water can be lost in channel segments that have eroded after a flood event (
Figure 2, left panel). The steepest slope inflections tend to occur at transitional locations from the distal to middle, and middle to proximal channel locations.
In highly-stratified alluvial aquifers, a substantial lowering of the water table can cause a major reduction in the rate of recharge for individual storm events as well as a long-term reduction in overall recharge. The three causes of the reduction in recharge rate are: (1) the increased thickness of the unsaturated zone which creates the requirement of a greater amount of water to enter the aquifer to allow wetting of the unsaturated sediment; (2) the occurrence of the clay layers that inhibit vertical movement of the wetting front; and (3) the greater number of horizontal diversions that inhibit downward movement of the wetted front. The increased thickness of the unsaturated zone causes a rainfall event to be of larger magnitude and of a longer duration before recharge can occur. The larger number of barriers to vertical flow with diversion amplifies the problem of vertical flow to allow recharge as the water table declines. Enhanced growth of deep-rooted vegetation, such as Acacia sp., may also contribute to the change in hydrology. Based on local conditions, a critical position of the water table will be reached whereupon recharge from channel flood loss will no longer occur.
It is the purpose of this research to explore the issue of anthropogenic lowering of water levels by pumping of wells in a wadi aquifer system that severely reduces or eliminates channel flood loss as a means of recharge. Loss of water from the alluvial aquifer system has been further exacerbated by the historical planting of Acacia trees which are phreatophytes. This can cause the only recharge mechanism to be vertical movement into fractured rocks occurring at the wadi perimeter or the permanent drying of the alluvial aquifer. The concept is investigated by field observation of the geology and hydrogeology of a wadi system occurring in a geologic setting that produces considerable quantities of mud during erosion. Water level measurements, geophysical measurements, and a theoretical assessment using one-dimensional unsaturated zone modeling were also made.
2. Background and Methods
2.1. Site Description
The western region of Saudi Arabia contains numerous wadi systems that drain into the Red Sea during flood events [
13]. These wadis are very mature systems that have been formed as erosion channels incised into Precambrian-age rocks with diverse lithologies [
14]. Wadis that occur in Precambrian rocks consisting of partially-metamorphosed shales, schists, metavolcanic, and meta-sediments tend to contain a greater quantity of mud within the alluvial sediment filling the channel and forming the underlying aquifer. At other locations, Precambrian granites produce a higher percentage of boulders, pebbles, gravel, and sand with lower mud content.
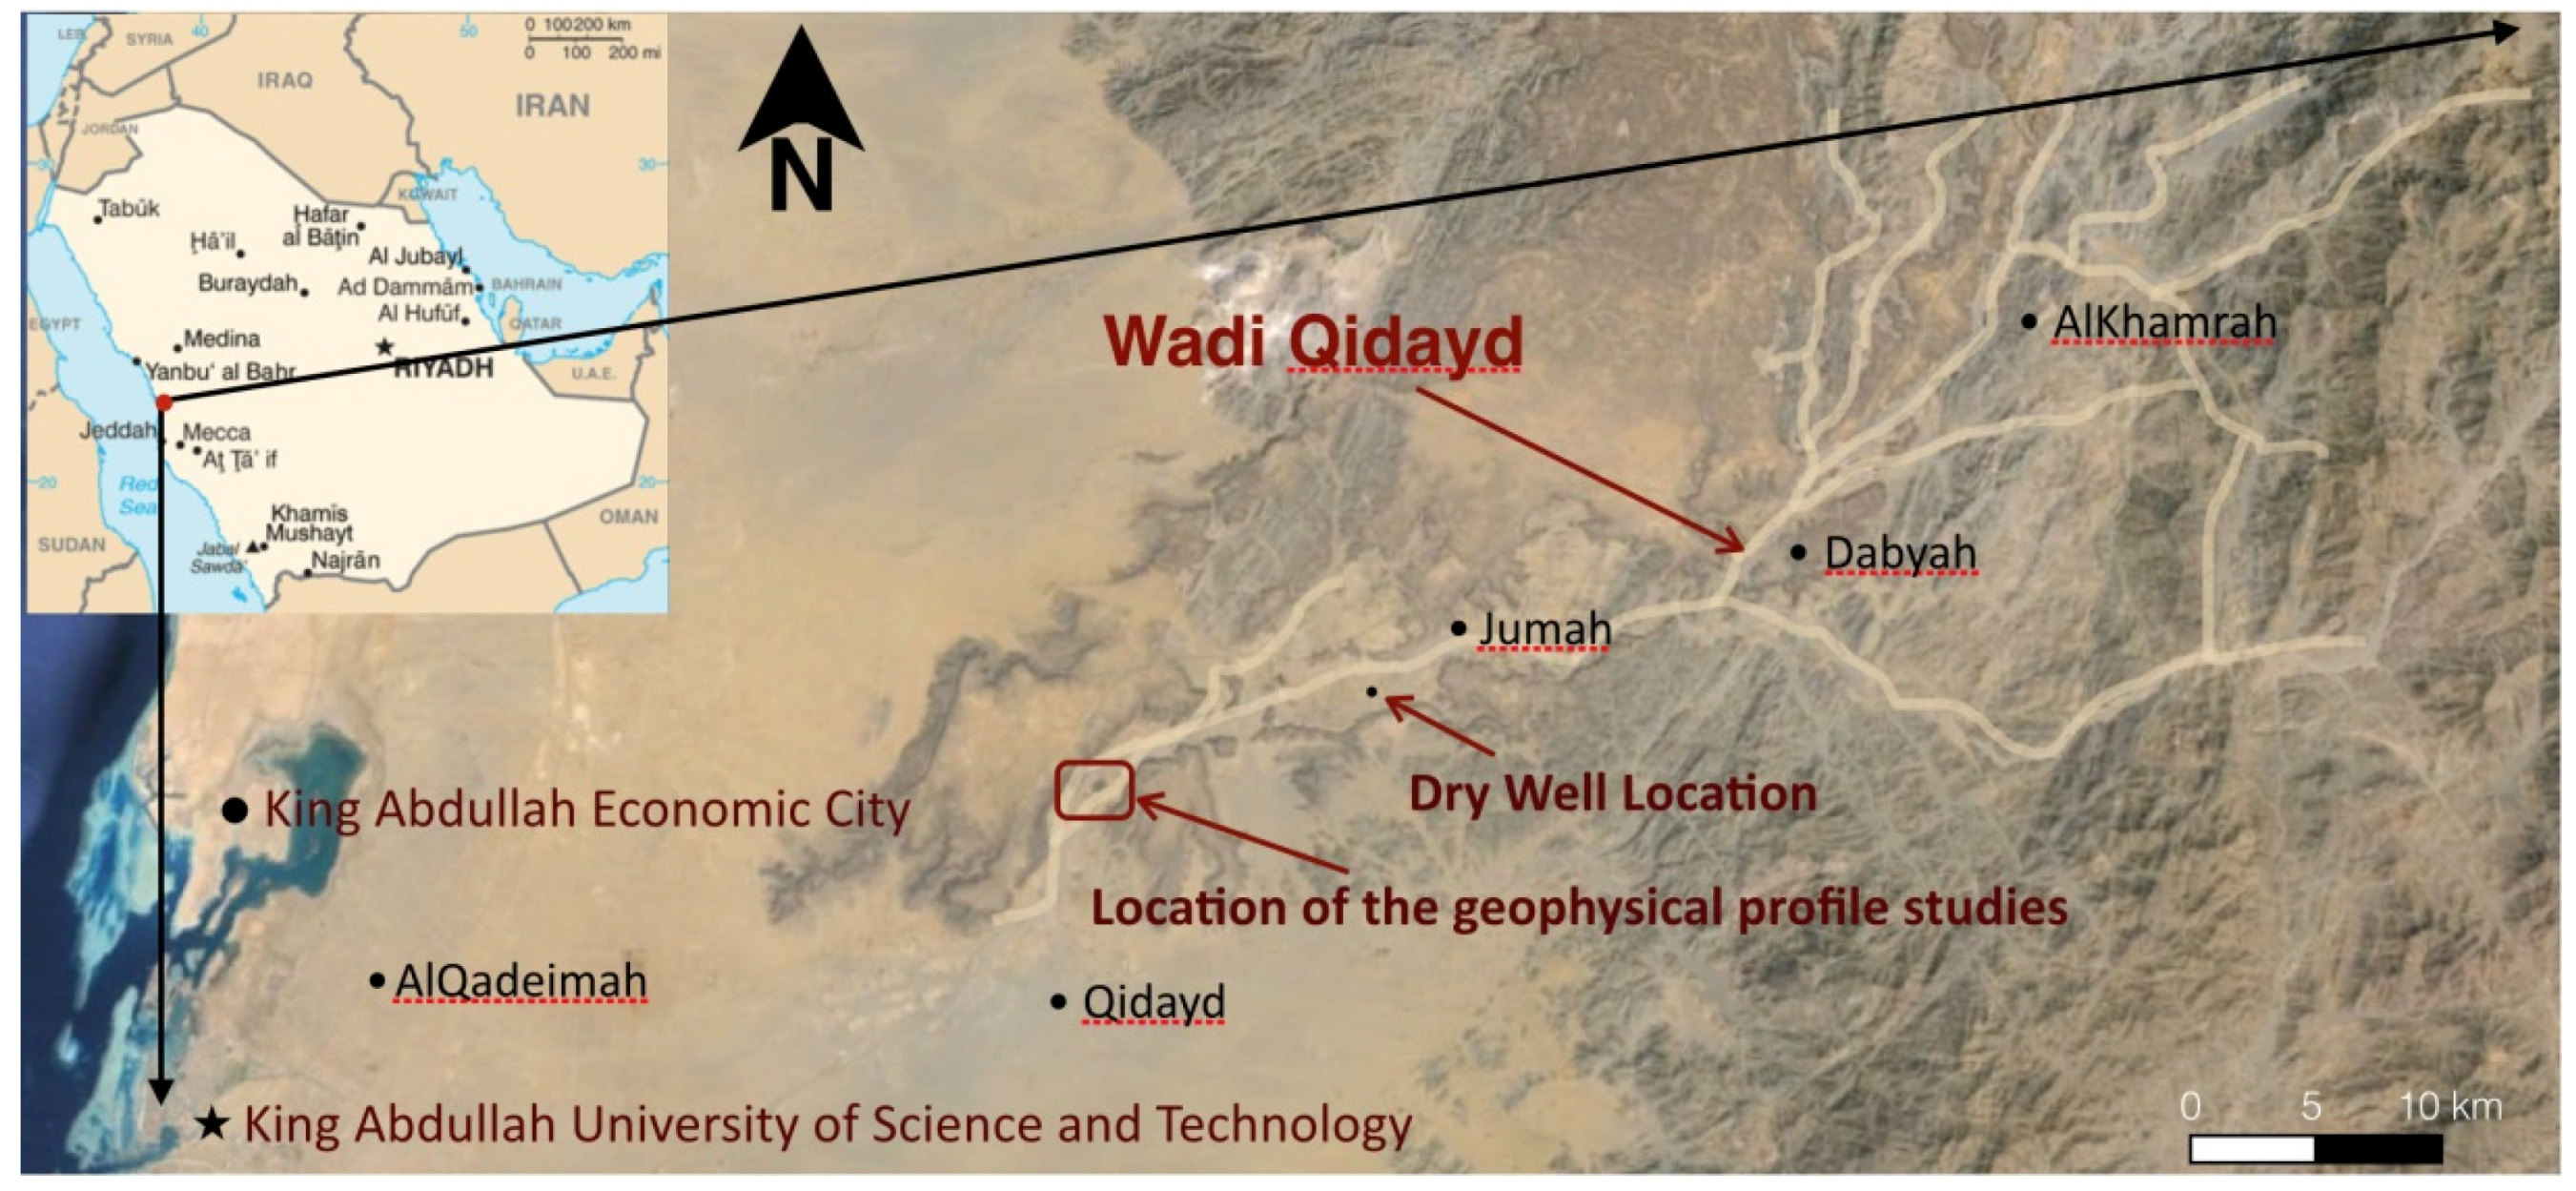
A series of field studies were conducted in Wadi Qidayd that is located about 120 km north of Jeddah in western Saudi Arabia (
Figure 3). The geology of the Wadi Qidayd consists primary of schists, and meta-sedimentary rock types that produce a wide variety of sediments including boulders, cobbles, pebbles, gravel, sand, and mud [
15]. The wadi channels are located in areas of enhanced faulting and fracturing of the Precambrian rocks and have been influenced by the influx of tertiary lava flows [
16]. The Precambrian rocks surrounding the wadi channels are heavily fractured. An eroded tertiary lava field, eroded into boulders, commonly lies adjacent to the incised valleys formed by the wadi.
The composition of the sediments constituting the alluvial aquifer system that underlies the channel network varies depending on the geographic position. The geomorphic zones, as defined by Missimer
et al. [
12] (
Figure 2), are the distal, middle, and proximal reaches. The aquifer in the distal channel reaches is 3 to 5 m thick and contains only a few mud layers which generally are located just above the fractured bedrock. In the middle segments, the aquifer thickness ranges from 5 to 50 m in thickness and it consists of a vertically stacked sequence of fining upward, bedded sediments. A mud layer does not always occur between layers of coarse-grained sediments due to removal by periodic erosion events. The proximal channel sediments range from 50 to 100 m in thickness and contain numerous fining upward flood deposited units along with 1 to 3 m thick units of muddy sand or sandy mud, some gravel beds, and some winnowed sand beds. Some of the bedding was directly observed in dry and deep wells with an exposed open-hole section (
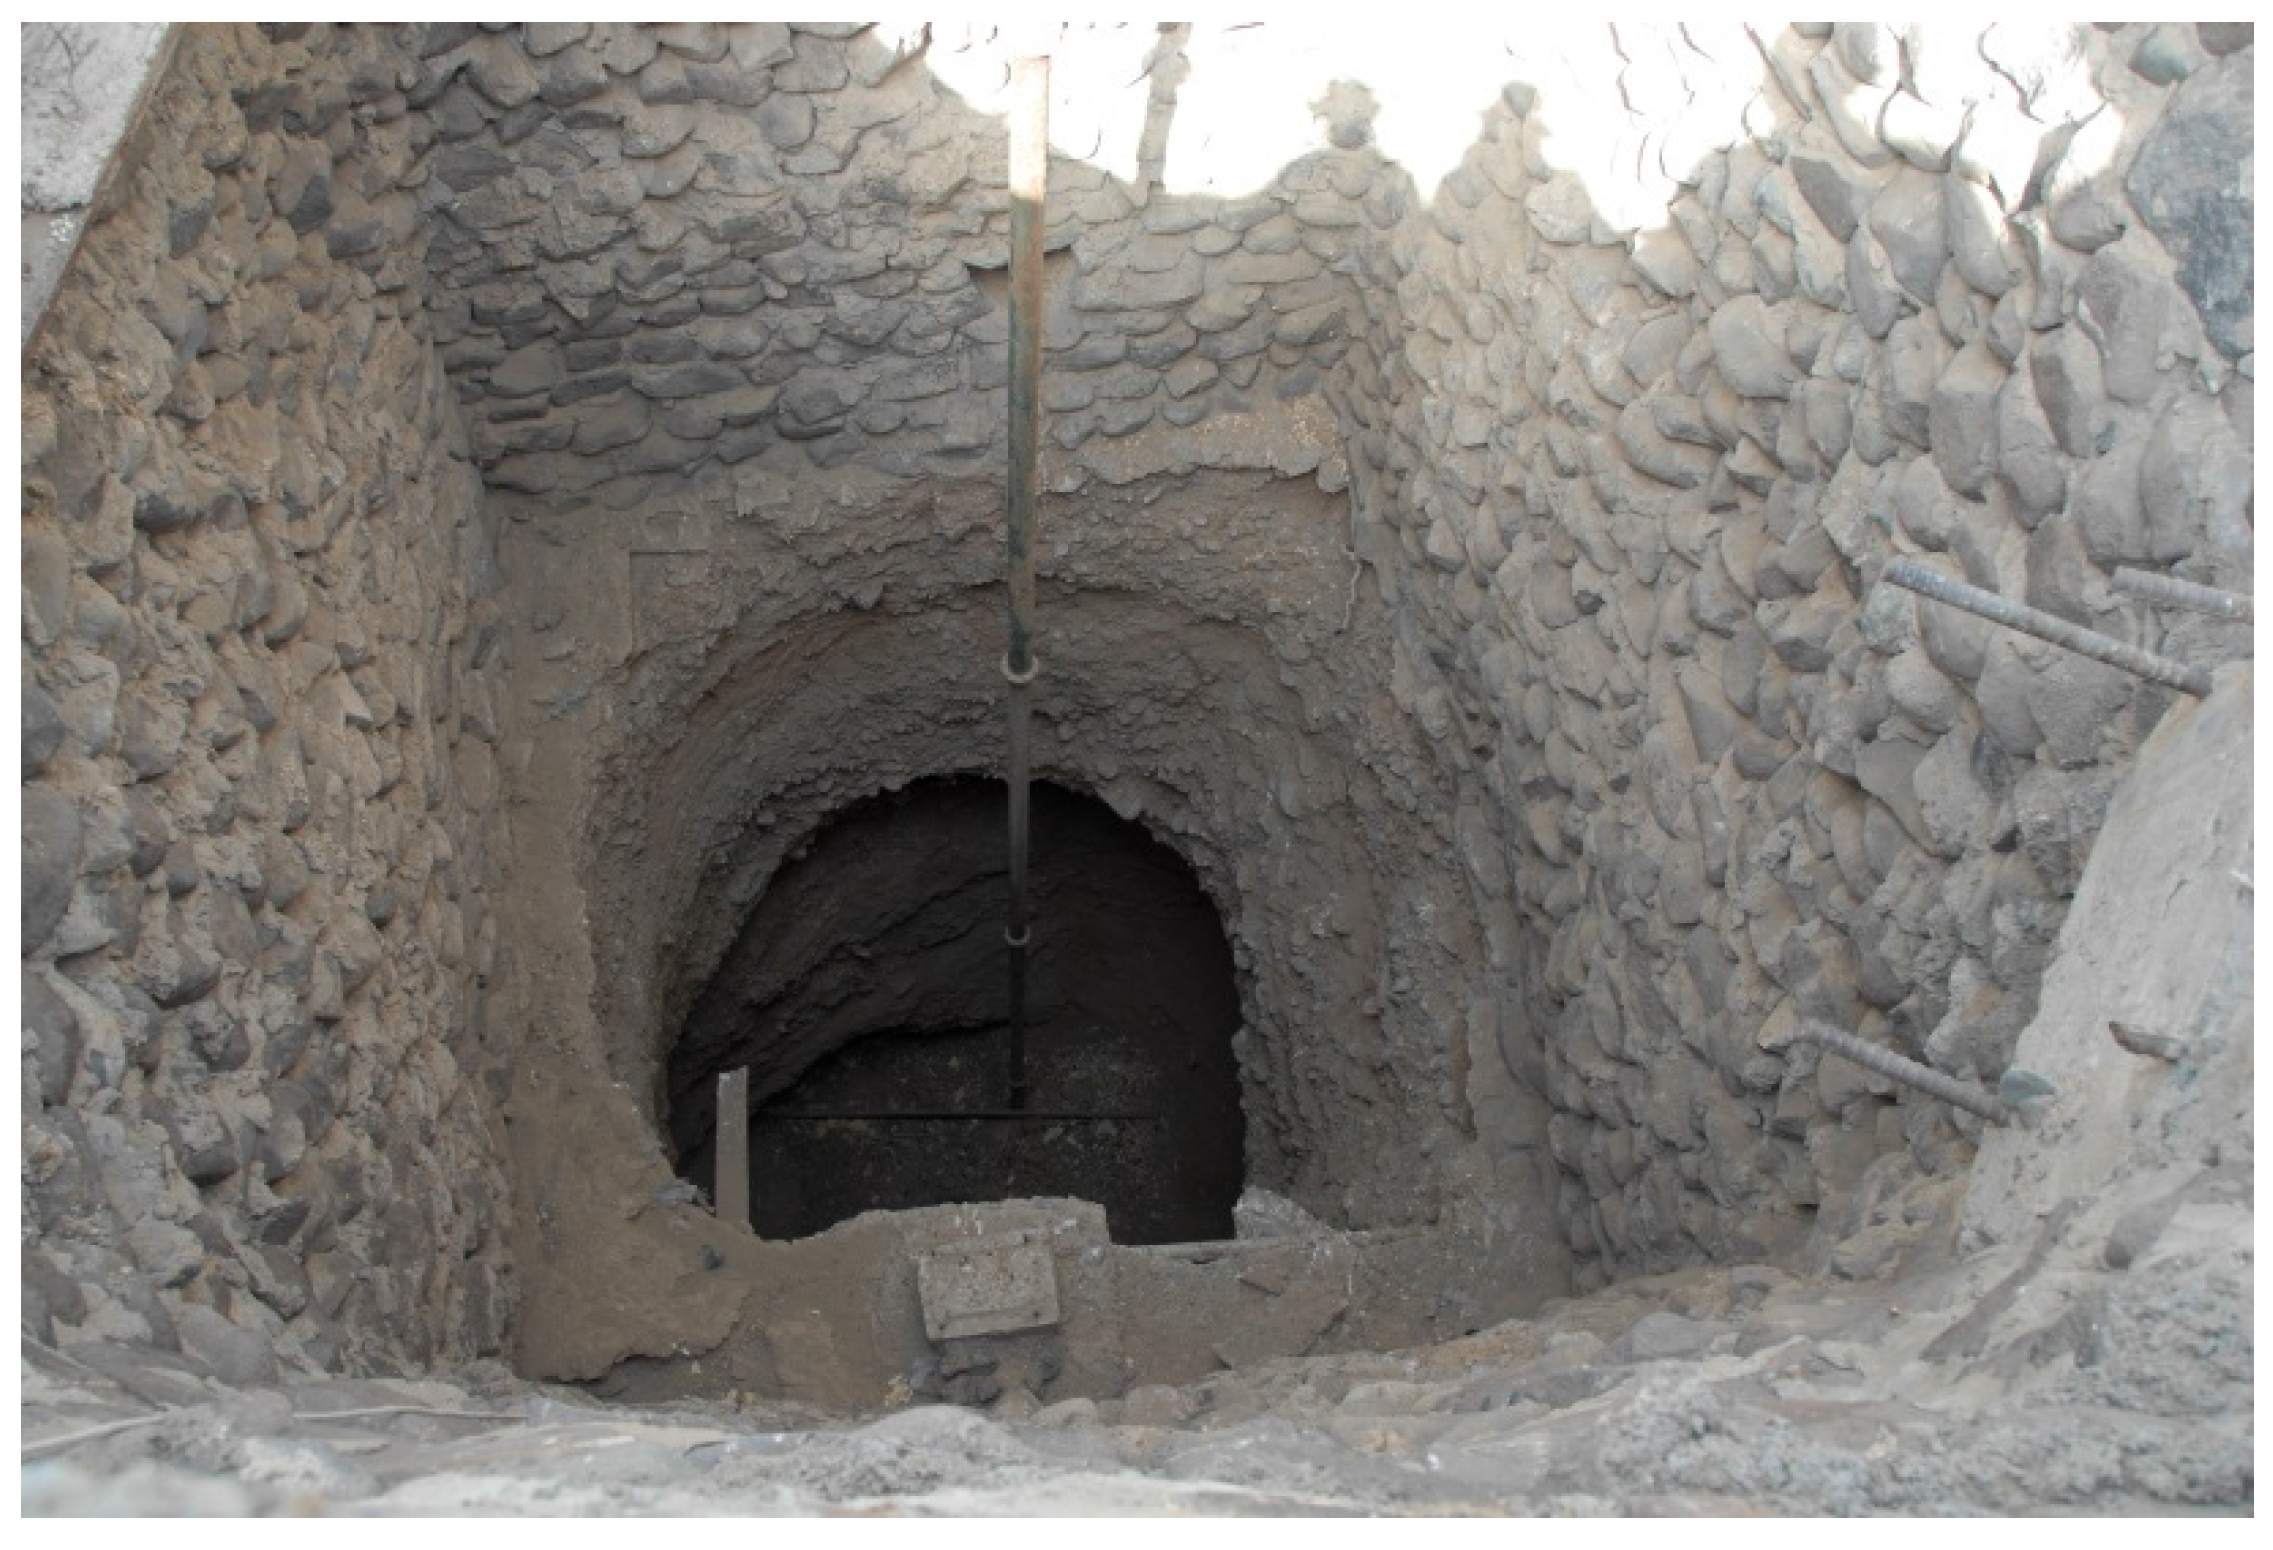
Figure 4). Local residents provided some descriptions of the sediments in the wells, which are large in diameter (2 to 3 m) and were dug by hand.
A few aquifer tests were conducted in the area and showed a range in horizontal hydraulic conductivity values from 5 to 334 cm/h (1.4 × 10
−3 to 9.3 × 10
−2 cm/s) and vertical hydraulic conductivity values ranging from 4 to 34 cm/h (1.1 × 10
−3 to 9.4 × 10
−3 cm/s) [
12]. Sediment samples were collected from cross sections of the channels at specific areas and the laboratory grain size distributions, porosity, and hydraulic conductivities were measured [
17]. Estimates of the vertical hydraulic conductivity of the mud layer, when greater than 5 cm in thickness, are about 0.89 cm/h (2.5 × 10
−4 cm/s) and at about 10 cm in thickness are less than 0.083 cm/h (2.3 × 10
−5 cm/s). The aquifer in the distal area is unconfined and in the middle and proximal is semi-unconfined to semi-confined in nature [
18].
2.2. Field Observation Methods
Numerous field excursions and exercises were conducted at Wadi Qidayd over a period of three years. A large number of wells were inspected and discussions were held with the farmers in the area. The bedding was observed and described in some dry wells where it could be directly [
4] recorded. Additionally, within the channel and particularly at the edges, the fining upward sediment flood deposits were observed. The channel was inspected and some areas of moisture emergence were observed (
Figure 2, right panel). The occurrence of deep-rooted desert plants (
Acacia sp.) was documented.
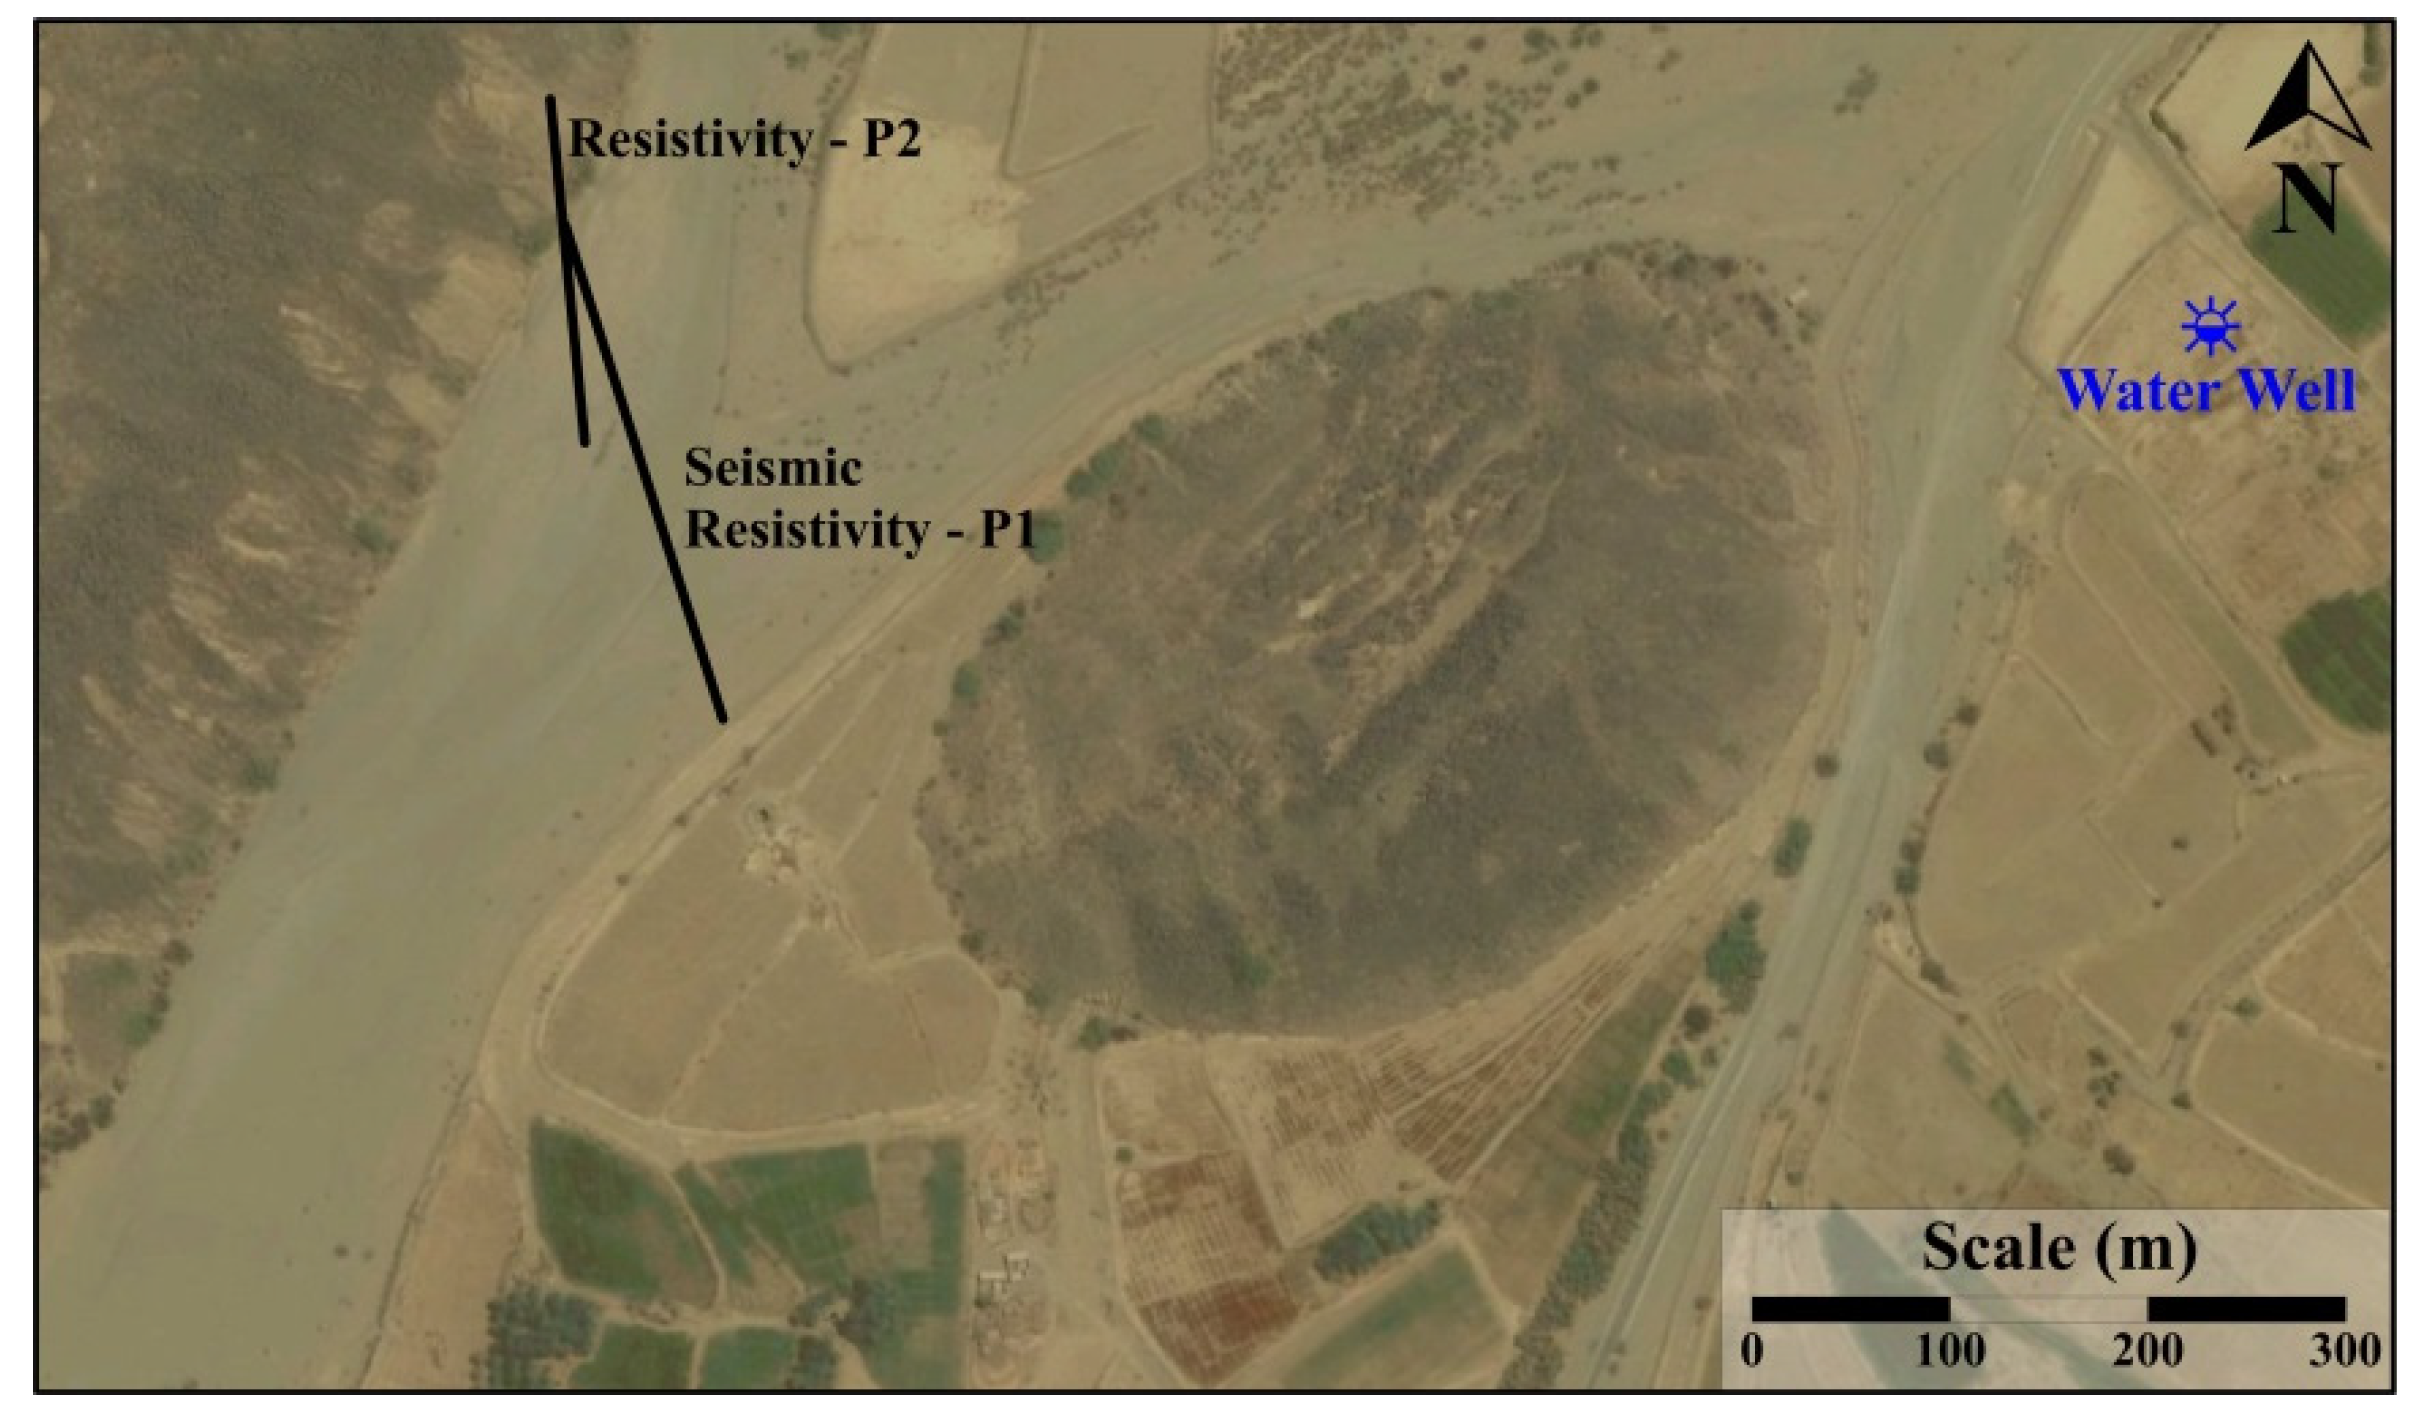
Water level recording devices (HOBO DataLoggers) were placed in several wells to document the depletion of the aquifer caused by pumping. The record from the well data is incomplete because during pumping cycles, the water level would commonly fall below the position of the transducer. Sometimes farmers would remove the transducers from the wells to dig below the depleted water table. The location of the well where water level data were recorded is shown in
Figure 5.
2.3. Collection of Geophysical Profiles across Parts of Wadi Qidayd
Some geophysical profiles were collected across the wadi channel (
Figure 5) after a rainfall event from the edge of the wadi to the central part of the channel. The target of the geophysical study was to find the thickness of the surface layer and the depth to the water table. In this regard, one seismic and two resistivity profiles were recorded at the selected study area (
Figure 5).
The 2D seismic profile had a total of 117 vertical component receivers with 2.0 m spacing and one shot at every receiver position. Here, a 91 kg accelerated weight drop was used to generate the seismic energy with about 15 stacks used at each shot location.
The seismic refraction method was very sensitive to velocity/density variations in the subsurface, while the resistivity method is more sensitive to water content in the subsurface layer [
19]. In this study two resistivity profiles were recorded (
Figure 5) to identify the depth to the water table. Profile P-1 was recorded using 64 nodes with a 5 m node interval while profile P-2 was recorded using 32 nodes with node interval of 5 m. Both profiles were recorded using the Wenner-Schlumberger configuration.
2.4. Hydrodynamic Modeling
Vertical movement of the wetting front through the sediment sequence was assessed by using a simplified one-dimensional water flow model. The hydrological simulator Hydrus 1-D was utilized to numerically solve the Richards equation for the soil hydrodynamics, expressed here in terms of pressure head [
20]:
where the time and depth dependent pressure head (h) is given in cm,
θ is the soil water content (cm
3·cm
−3),
C(
h) =
dθ (
h)/
dh is the differential water capacity where
θ(
h) is the water content as a function of pressure head (cm
3/cm
3), t is the time (h),
z is the depth which is considered positive downward (cm), and
K(
θ) is the hydraulic conductivity as a function of water content (cm/h).
The water retention and hydraulic conductivity functions of the subsurface system were described by the classical Mualem-van Genuchten model [
21,
22]. The water retention is given by:
where
α (1/cm) and
n(-) are shape parameters which are inversely related to the air entry value and the width of the pore size distribution,
θs and
θr are the residual and saturated water contents respectively, and
m is defined as
m = 1 − 1/
n with
n > 1 [
21]. The hydraulic conductivity is given by:
where
Ks is the saturated hydraulic conductivity (cm/h) and
λ(-) represents pore tortuosity. The value of
λ is 0.5 or it can be estimated from bulk density and hydraulic conductivity with which it is highly correlated [
23].
Two scenarios were simulated to assess the infiltration of water in a 13-meter thick sediment subsurface section. The first scenario was considered with uniform coarse texture sediments having a porosity of 38% and saturated hydraulic conductivity of 24.81 cm/h. In the second scenario, thin layers of impervious fine texture soil were imbedded in the course texture sediment. Porosity of the fine texture soil was 42% and saturated hydraulic conductivity was 0.85/cm h. Parameters
and
were obtained with the Rosetta model using sand, silt, and clay contents for both the coarse and fine texture soil [
24]. In total, fifteen soil samples were collected from the wadi channel and analyzed for grain size distribution having coarse to fine soil texture. The average of the grain sizes for the coarse texture samples have 93.39% sand, 4.93% silt, and 1.68% clay, whereas fine texture soil samples have 25.21% sand, 58.57% silt, and 16.2% clay. Parameters for the Mualem-van Genuchten model are shown in
Table 1.
3. Results
3.1. Wadi Channel Geology
Data collected from dry wells was by visual observation. Eroded parts of the primary and tributary channels within the Wadi Qidayd drainage basin suggest that the alluvial aquifer is highly stratified with numerous beds occurring between the land surface and the base of the aquifer. The scale of these fining upwards beds ranges from 0.3 to 1.5 m. Flood events have removed the mud layer that separates the fining-upwards beds at some locations, thereby making the permeable bed thicker (up to 2 m). The overall aquifer ranges from less than 5 m in thickness in the upper (distal) reaches of minor tributaries to nearly 85 m in the primary channel in the proximal reach. These estimates are based on well depths that penetrate into or close to the base of the aquifer. The wells in the proximal reach may not yield an accurate estimate of the aquifer thickness because of saline-water occurrence which limits well depths. Based on field observations, it is estimated that there are at least four mud units occurring within each 5 to 30 m vertical segment of the aquifer. Three fining upward units were found in the dry well shown in
Figure 4 within a 4 m open section. The thickness of the mud part of a bed increases downstream (settling time during a flood event) with a corresponding overall reduction primarily in vertical hydraulic conductivity. The lateral continuity of each storm-deposited, fining upward bed cannot be predicted accurately. There are likely some discontinuities that allow deep penetration of the wetted front before reaching a deeper bed at some locations (e.g., bed slope inflection points).
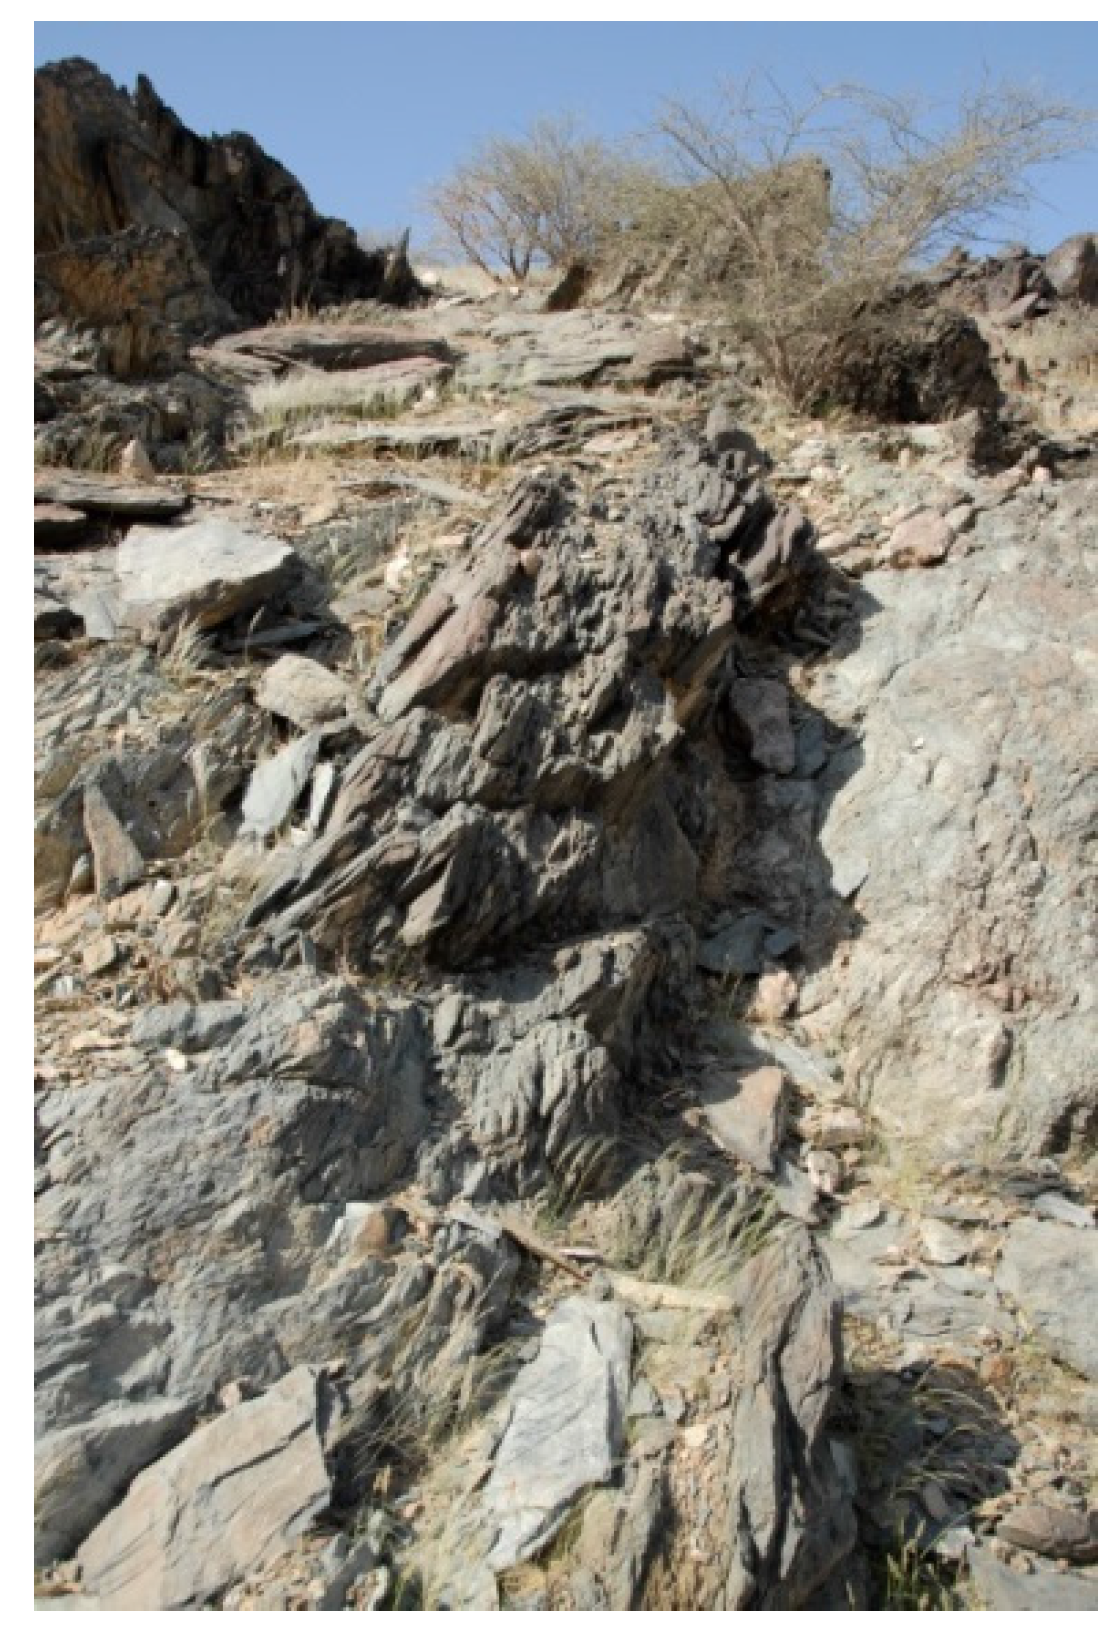
The Precambrian rocks that occur along the perimeter walls of the wadi are highly fractured with the orientation of the fractures being vertical in many locations (
Figure 6). Large-diameter, fractured-rock wells (2–3 m) are used to supply isolated dwellings that are built atop the bluffs surrounding the distal parts of the wadi system. These wells demonstrate that the rock has sufficient hydraulic conductivity and storage to supply enough fresh water to supply large houses (10–15 m
3/d). A drawing showing the conceptual connection between the fractured rock aquifer and the alluvial aquifer is shown in
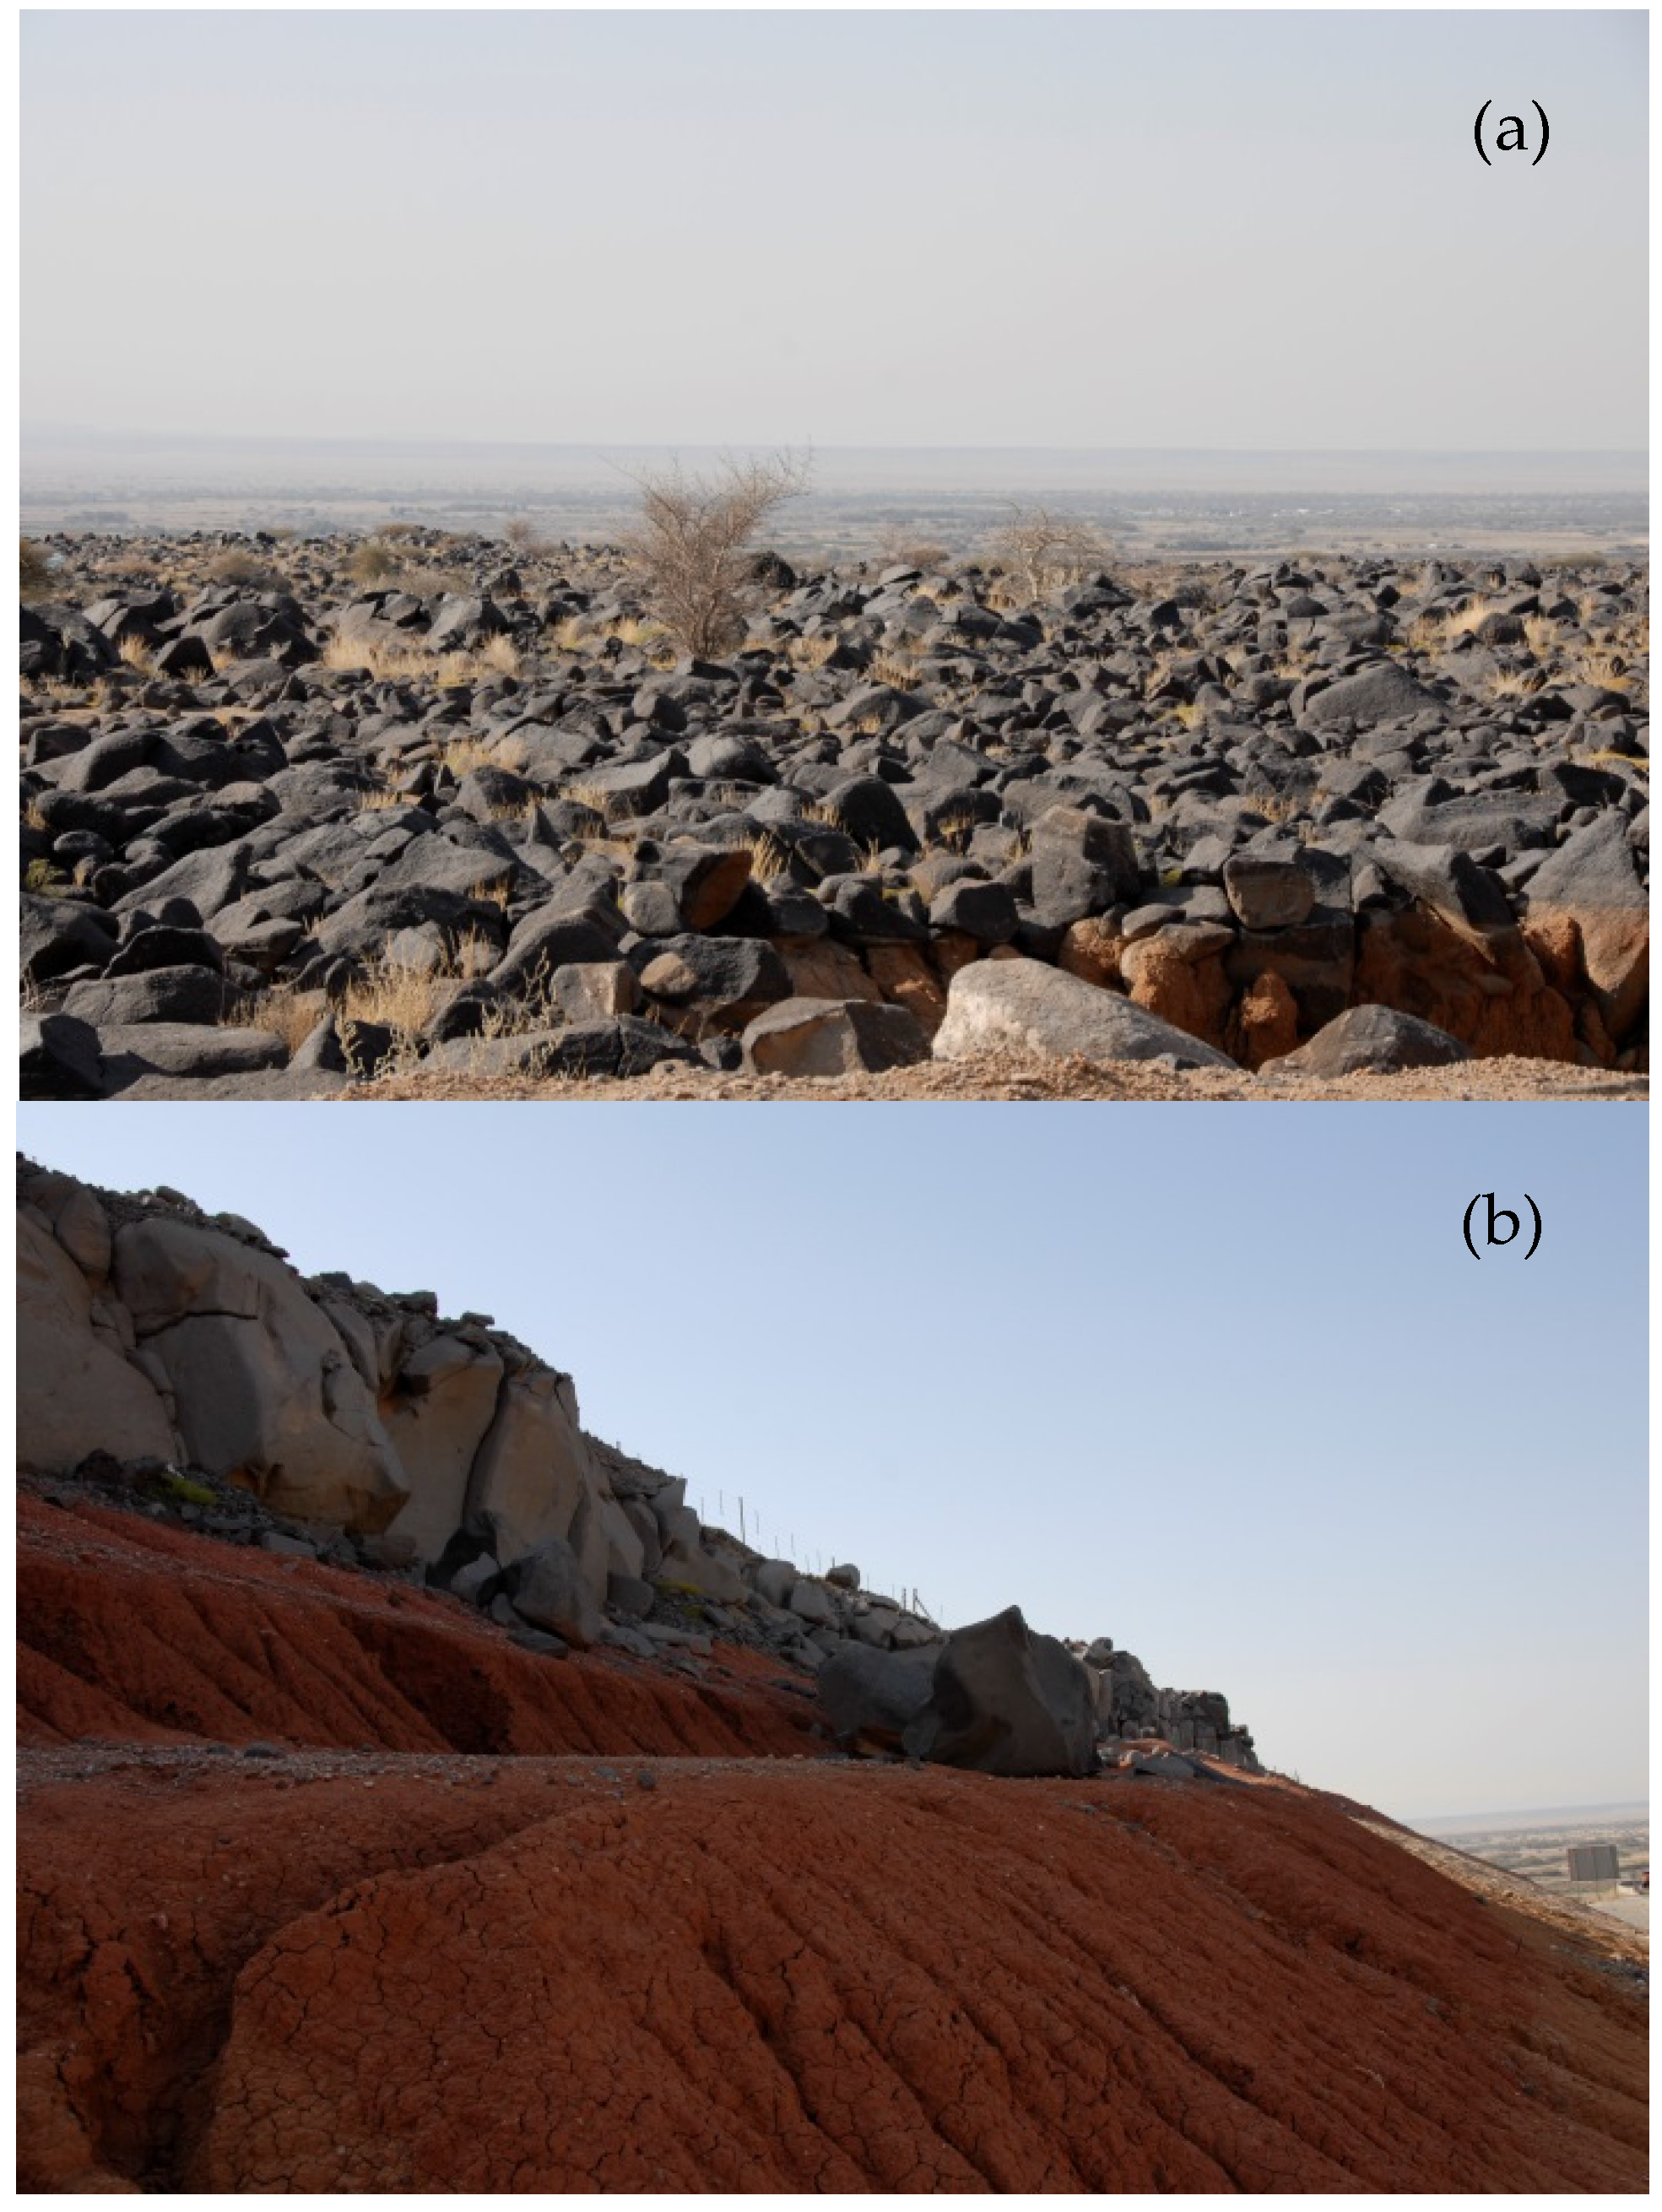
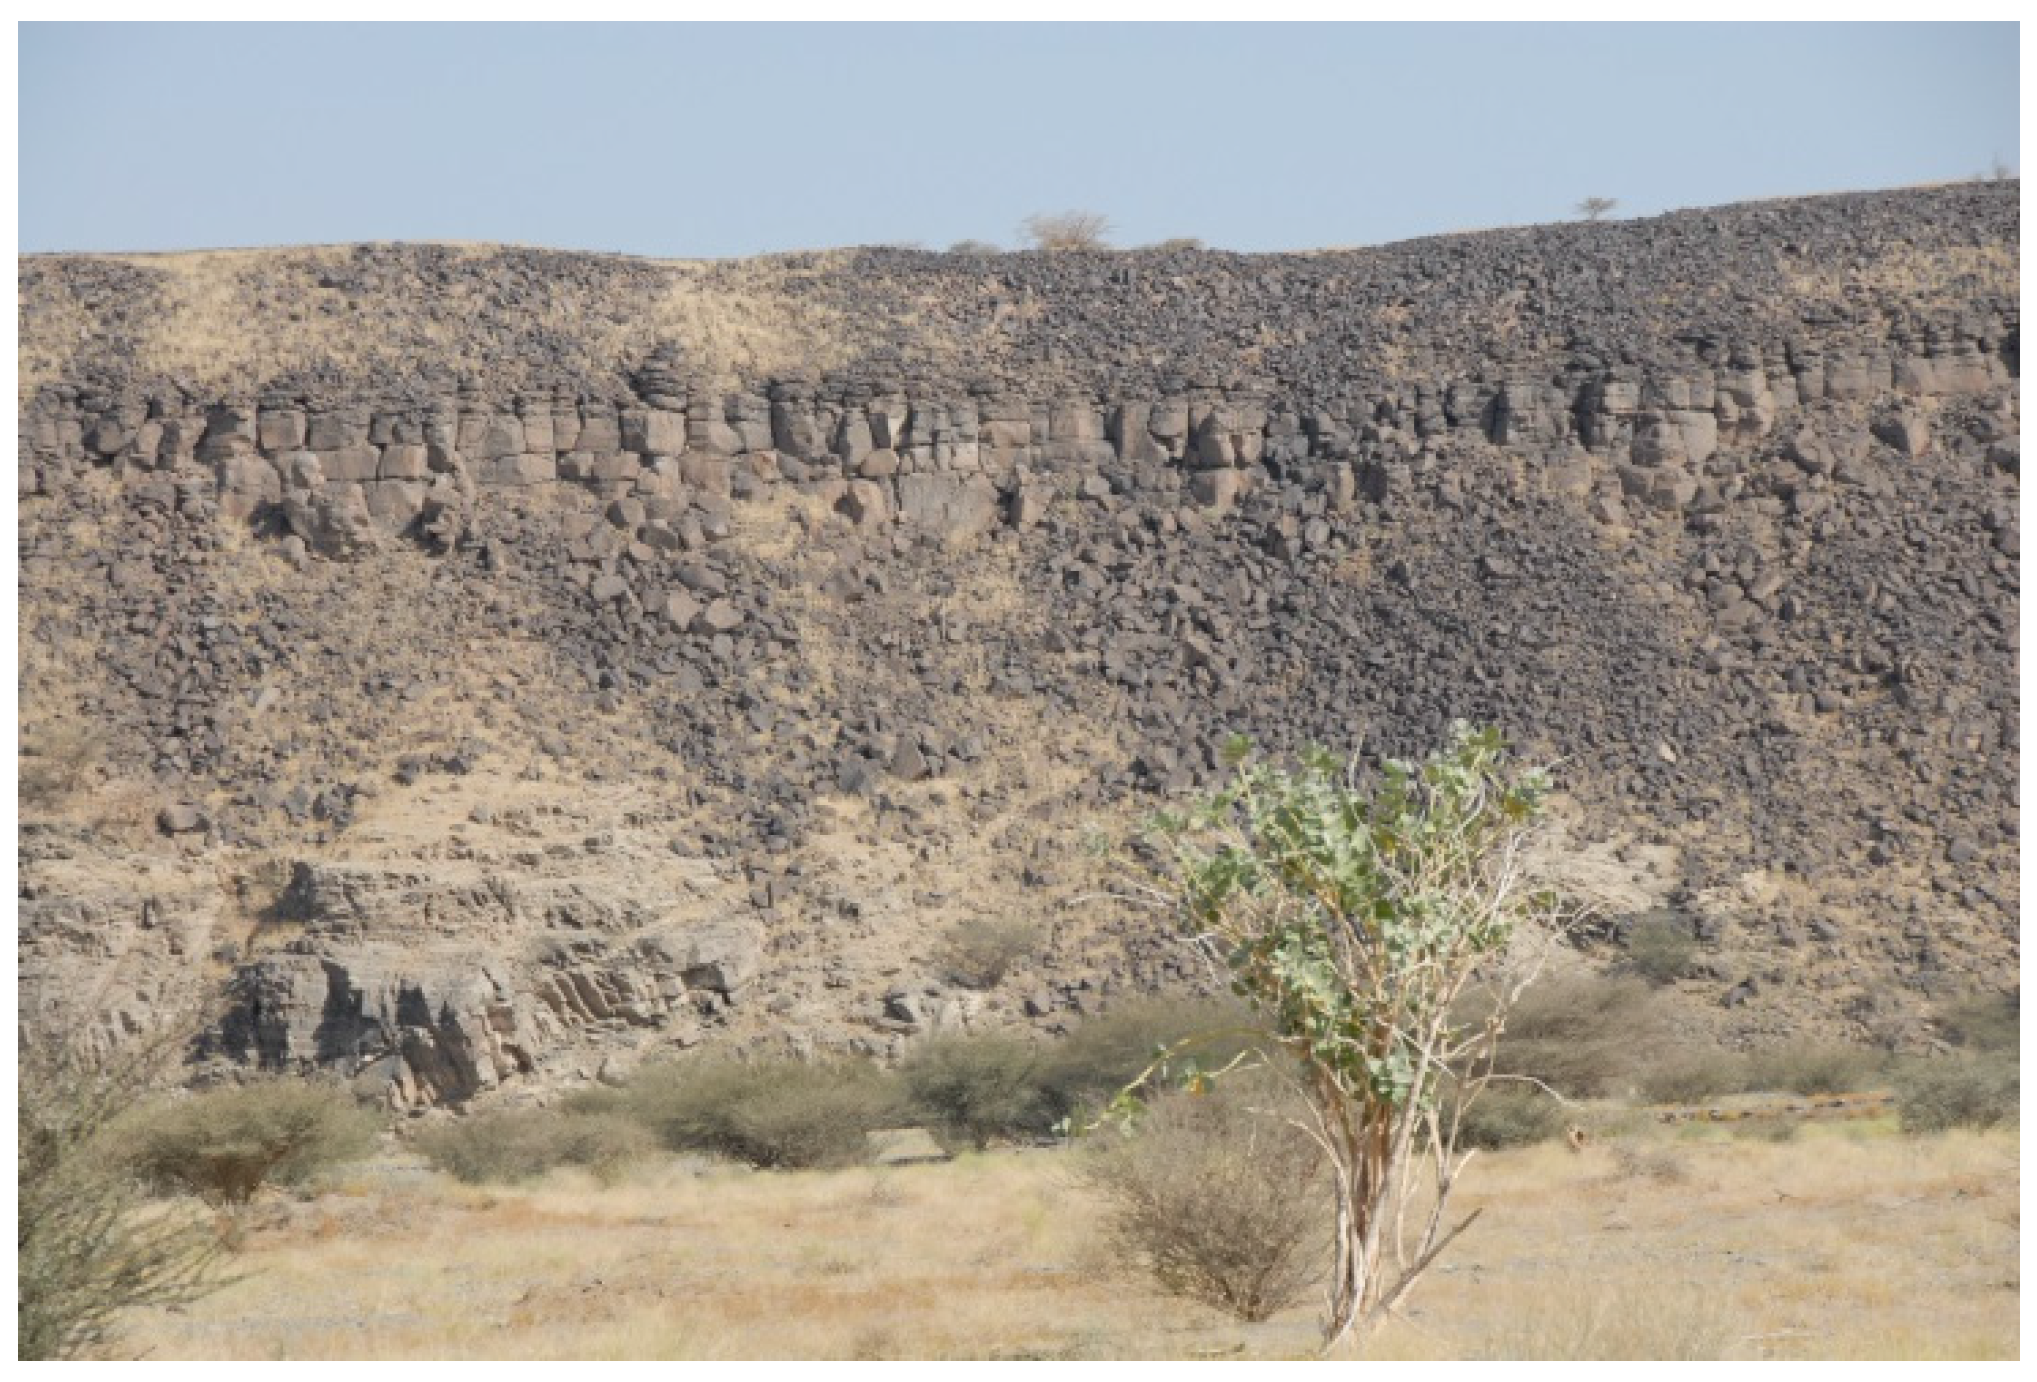
Figure 7. Commonly, during storms rainfall is trapped at the base of the heavily eroded “harrats” or lava fields that occur at the land surface along the upper rim of the wadis and flows between the boulders toward the edge of the wadi channels (
Figure 8a). The soil occurring at the base of the eroded lava boulders consists of a thick layer of dense clay (
Figure 8b). The surface water can then enter the fractured rock at the perimeter of the wadi channels and travel downward to enter the alluvium where the harrat system (eroded lava) comes in contact with the fractured rocks (
Figure 9).
3.2. Water Level Fluctuations
The water levels throughout the alluvial aquifer system of Wadi Qidayd are declining, but not in a regular manner. Many wells in the distal area where the alluvium is 5 m or less in thickness are dry most of the year. Some wells do receive some recharge from channel loss during floods. So, many wells have about 1 m of water in storage above the basement rock with the water table position being 4 m below surface. Water levels in the middle to proximal reaches of the wadi are between 13 and 35 m below surface and are either dry or the water is unusable due to high salinity in many areas. Wells are still being developed and pumped for sale of water in some parts of the wadi system.
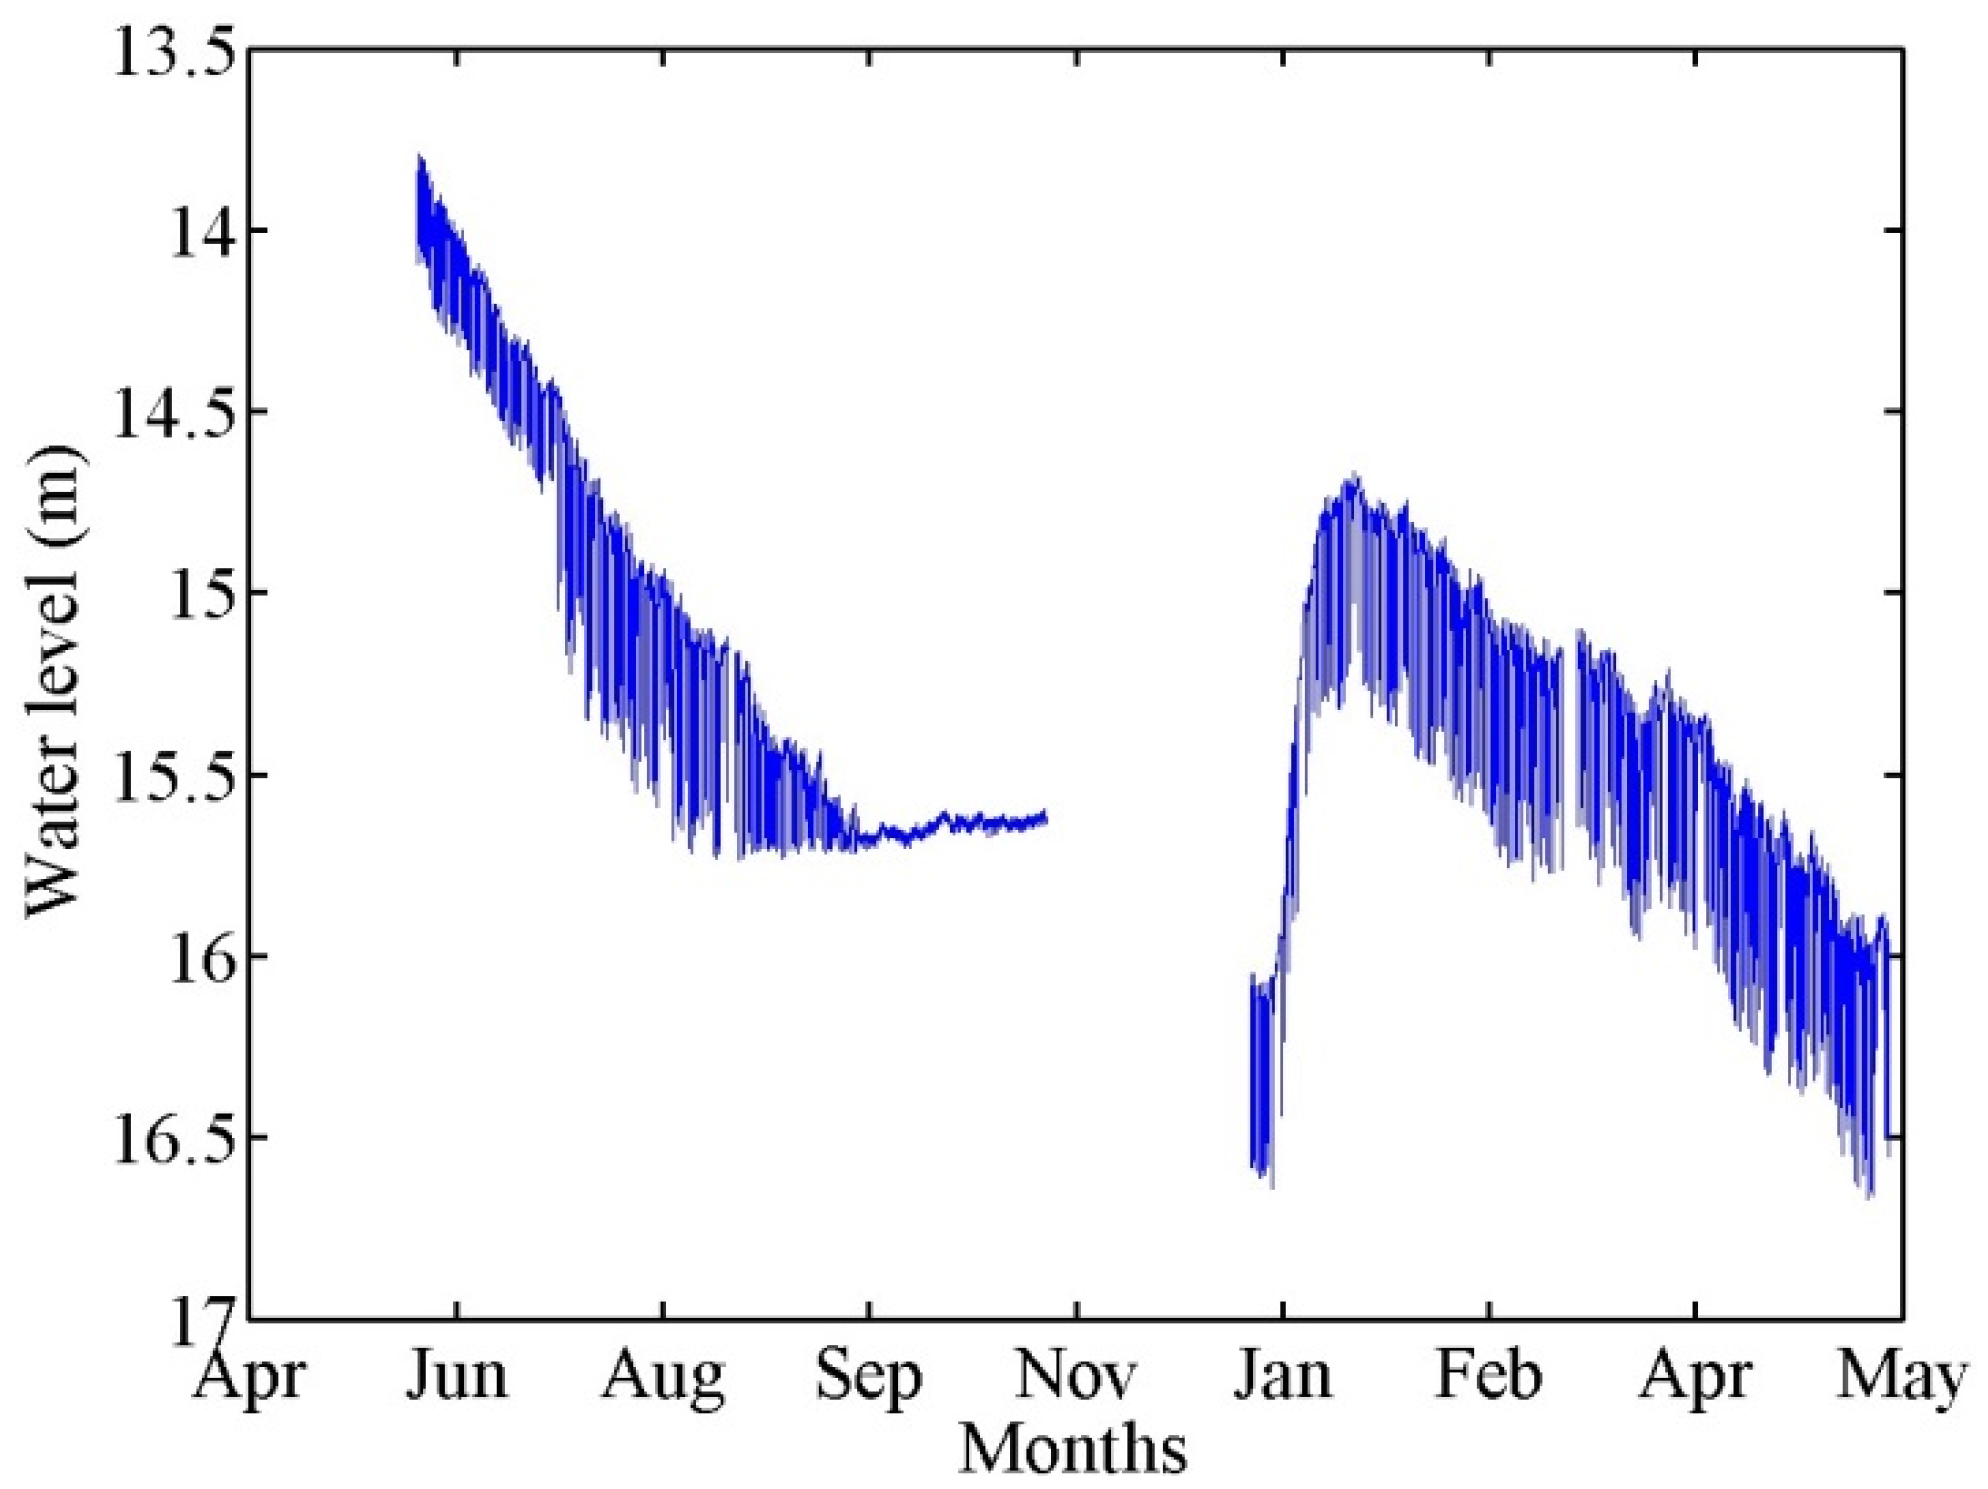
The water level fluctuations in a well were recorded for eight months as shown in
Figure 10. A single precipitation event occurred near the end of December. The water level dropped from 14 to 15.6 m and the HOBO logger was in the free air after 15.6 m. The water level showed stable measurements during the month of September and October as the logger measured the pressure of free air. There was no data during November and the first three weeks of December as the farmer removed the logger and dug the well 2 m deeper. Overall, the system water level was dropping without significant recovery during flood events. There was a delay of 10 days or greater after a rainfall/flood event between a pattern of declining water levels and a short-term rise in the water level with a return to a declining state. The temporary recovery of the water level in the well was likely due to either a pressure effect or water reaching the well from the fractured rock source at the edge of the channel. The rapid decline occurs because of the continuing pumping of the aquifer in the nearby area.
3.3. Hydrus Modeling Results
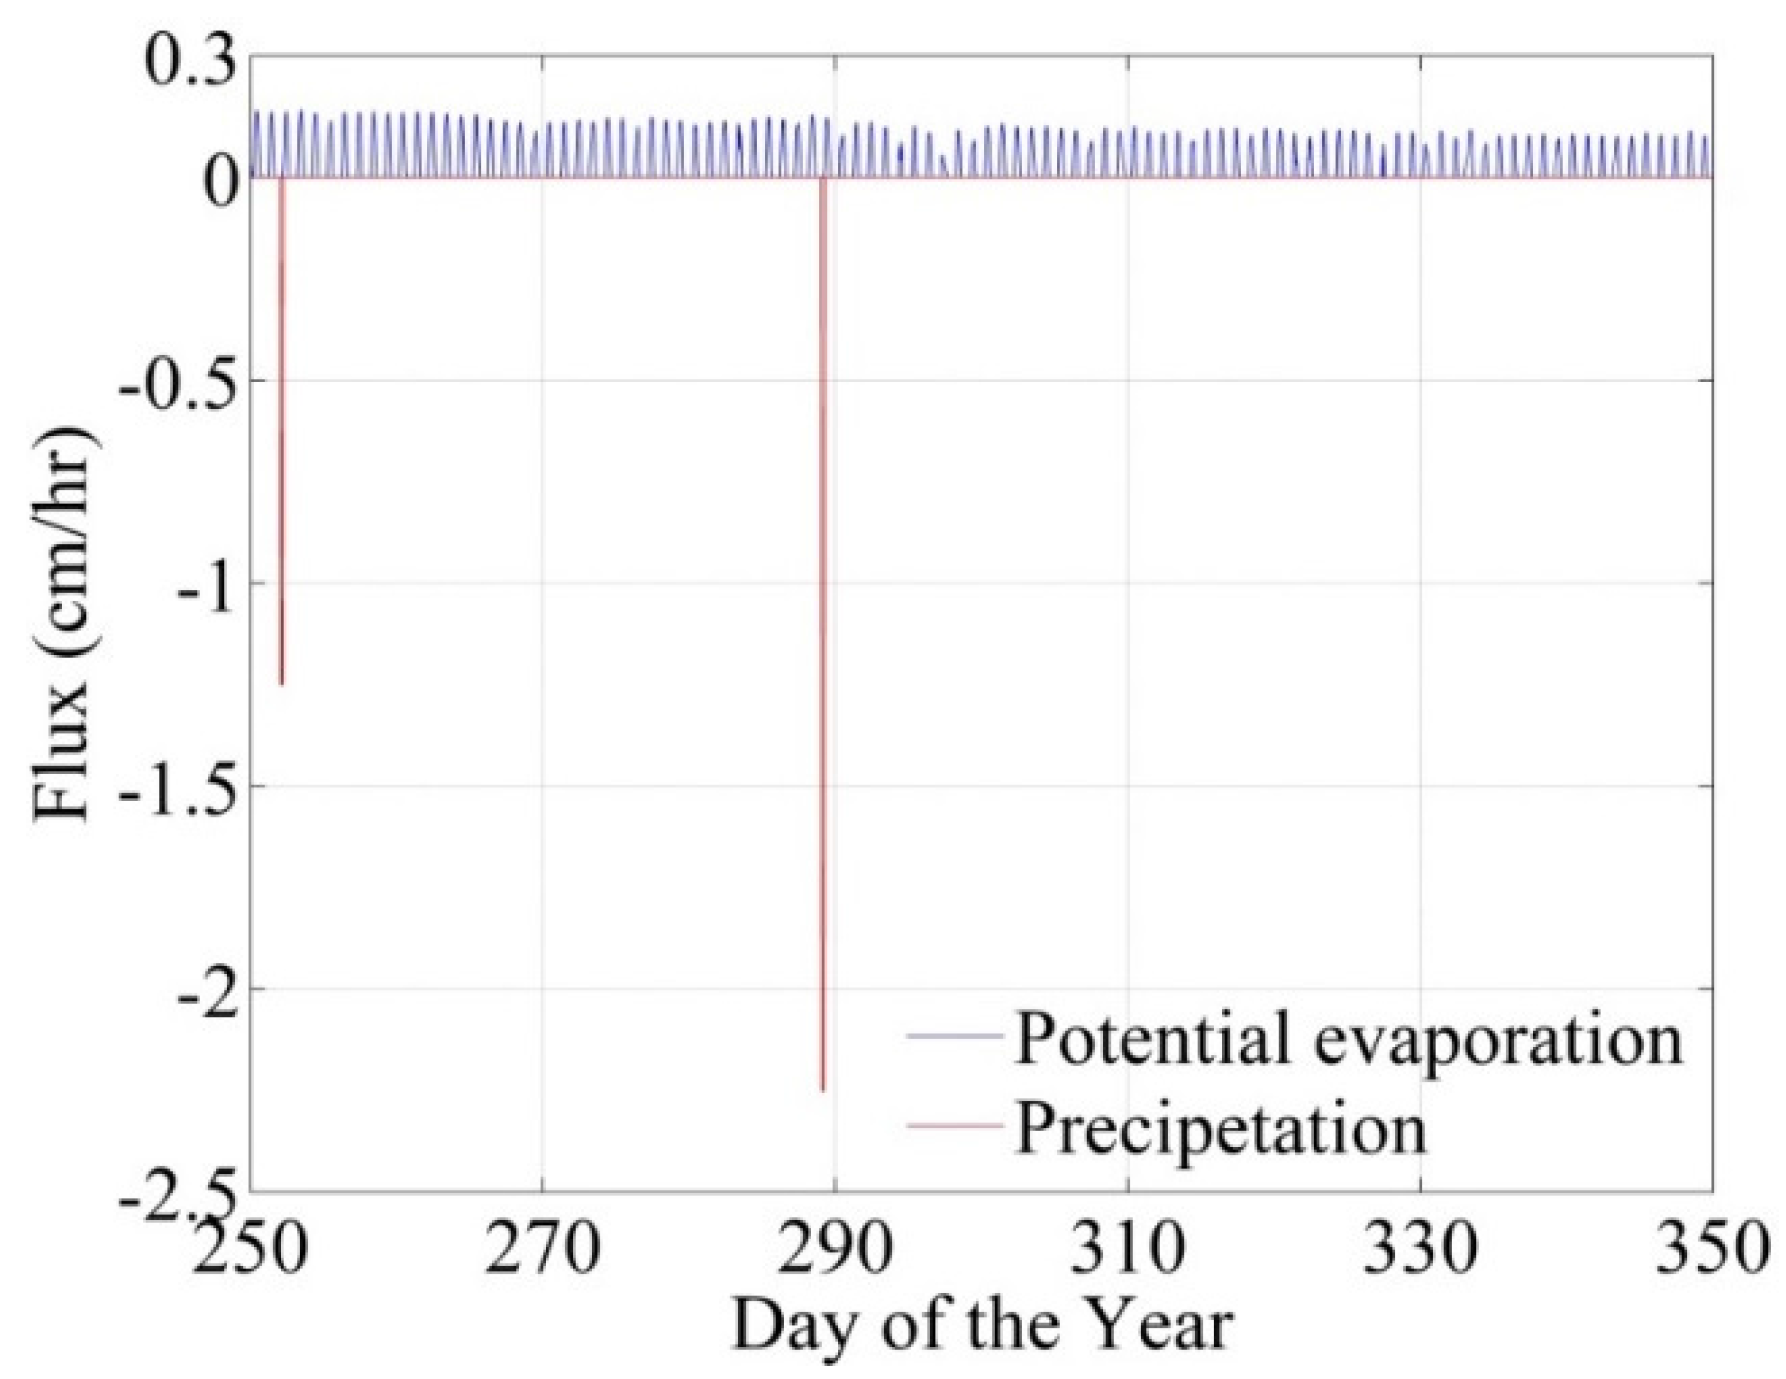
Figure 11 shows the precipitation and potential evaporation used for the hydrological simulator, HYDRUS 1-D (public domain free software) as a time-variable top boundary condition. The potential evaporation was calculated using the modified Penman-Monteith equation [
24]. Hourly average values of various meteorological variables, including air temperature, relative humidity, wind speed, incoming shortwave radiation, and barometric pressure, were input into the model. Meteorological variables were recorded at a meteorological station located close to Wadi Qidayd. Two extreme precipitation events were simulated hypothetically. First, a precipitation event of 45 mm within four hours was chosen and second, an event equal to the precipitation of 90 mm within four hours was used which is the same as the devastating flood in Jeddah in 2009. The initial condition was considered as dry with 0.065 water content through the whole 13 m simulation domain.
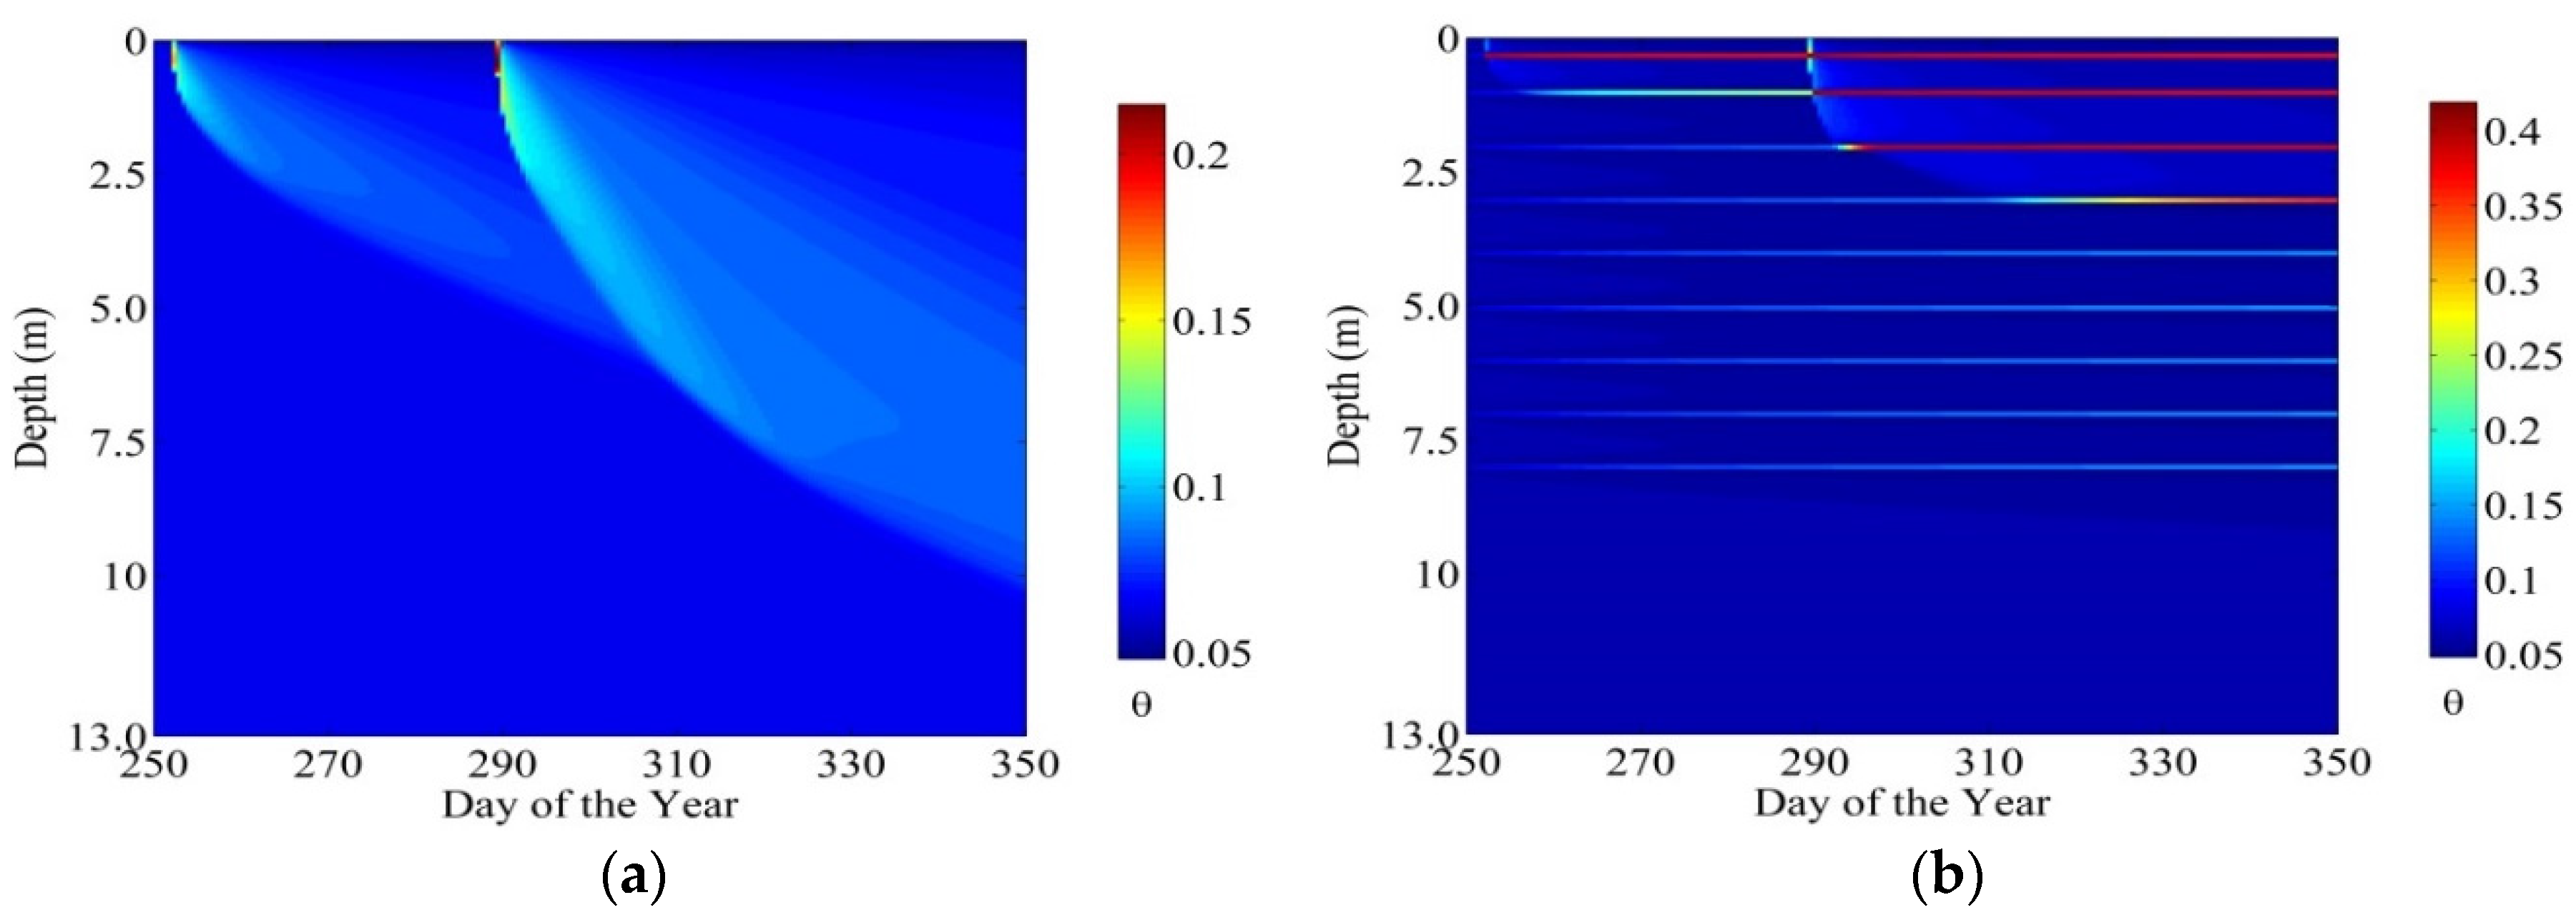
Figure 12a,b shows that HYDRUS 1-D computed water content profiles based on the hydraulic parameters obtained for the first scenario with coarse texture sediment and second scenario with thin fine texture layers between the coarse texture sediment, respectively. In both scenarios, the effects of two extreme precipitation events are clearly visible in the water content profiles. In the time- and depth-dependent water content of scenario one, variations due to the first precipitation event can be observed in the top 5 m of the subsurface and after the second precipitation event the changes in water content remains in the top 10 m of sediment sequence (
Figure 12a). Furthermore, the maximum water content simulated on the 350th day of the year was 0.084, which is 0.036 more than the residual water content. Hydrological simulations confirm that the thick unsaturated zone of 13 meter cannot be recharged even if the sediment sequence has an entirely coarse sediment sequence even with the heaviest rainfall event ever recorded in the region of Wadi Qidayd. In the second scenario, nine thin layers of fine texture soil were considered in the top 7.5 m within the coarse sediment sequence (
Figure 12b). After the first precipitation event the first two thin layers of fine texture of soil represent the water infiltration and after second heavy precipitation event the water infiltration effect can be observed in the top four layers of fine texture of soil, which act as a mud layers (
Figure 12b). Hydrological simulations were tested by placing the thin fine texture layers at different depths and in all cases the water did not infiltrate below the fourth layer. In the wadi, mostly
Acacia sp. trees are grown, which have long roots and the water trapped in the mud layers is likely taken up by the root system. The effect of root water uptake was not incorporated in HYDRUS-1 modeling to keep the scenario simple and to simulate more subsurface infiltration.
3.4. Geophysical Profiles
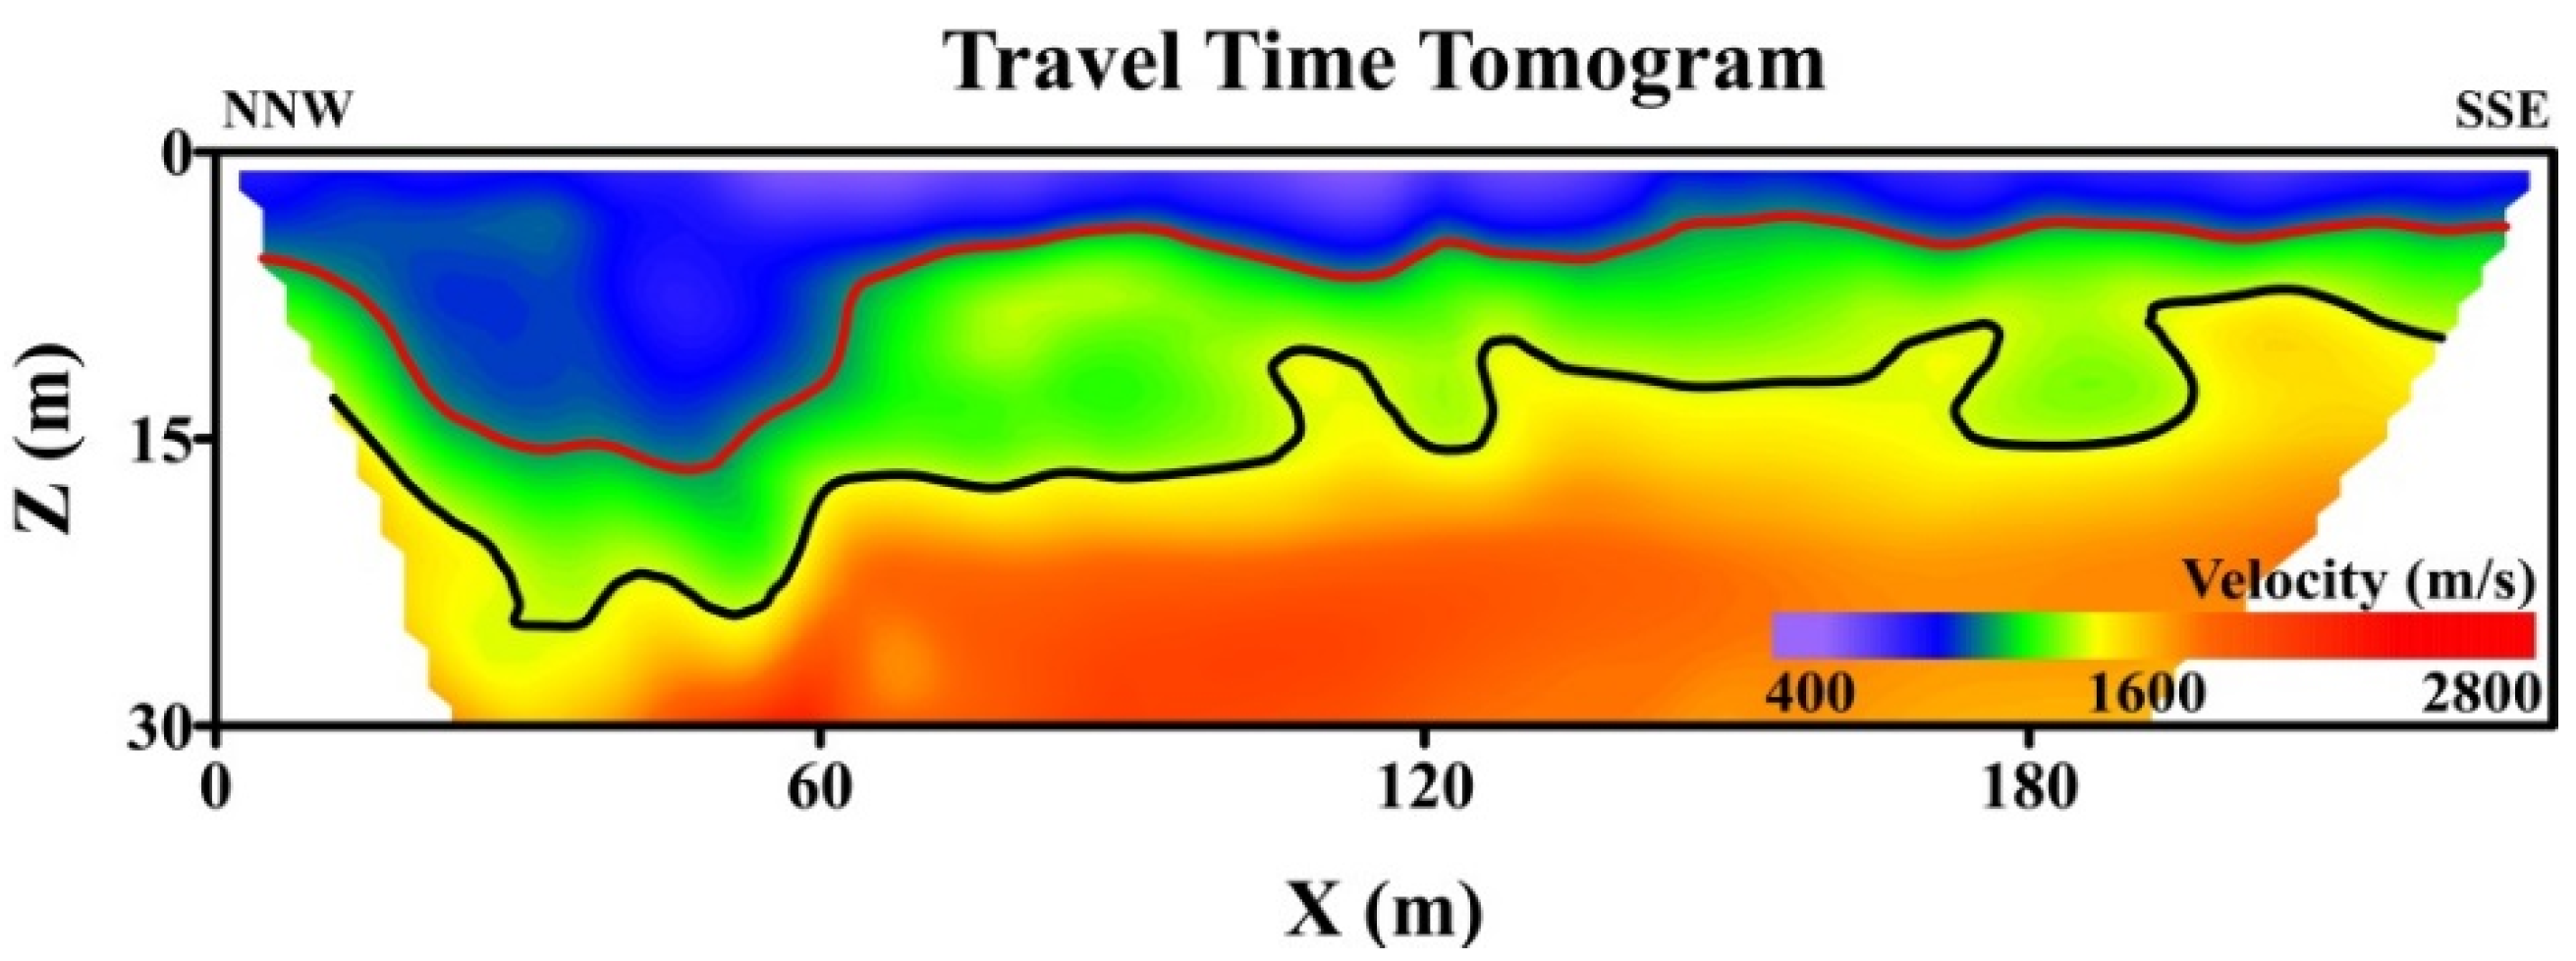
A profile was made from the Precambrian rock located along the north wall of the main channel of the wadi toward the center of the channel. The first arrival travel times of the recorded data were picked and then inverted to find the subsurface velocity model shown in
Figure 13 [
25,
26]. The travel time tomogram represents the variation in seismic wave propagation in both the horizontal and vertical directions.
Figure 13 shows that three different layers are present. The first layer below the surface consists of loose sand and gravel. It has a seismic wave velocity ranging between 600 and 880 m/s. The second layer consists of clay which is partially saturated with water with a seismic wave velocity ranging between 1130 and 1240 m/s. The third layer consists of highly fractured bedrock with a seismic wave velocity of 1440 to 2000 m/s. The depth to the top of the second layer ranges between 13–16 m at the northern part and 4–7 m at the central and southern parts of the profile, while the depth to the top of the third layer is about 24 m at the northern part, and 7 to 14 m at the central and southern parts of the profile.
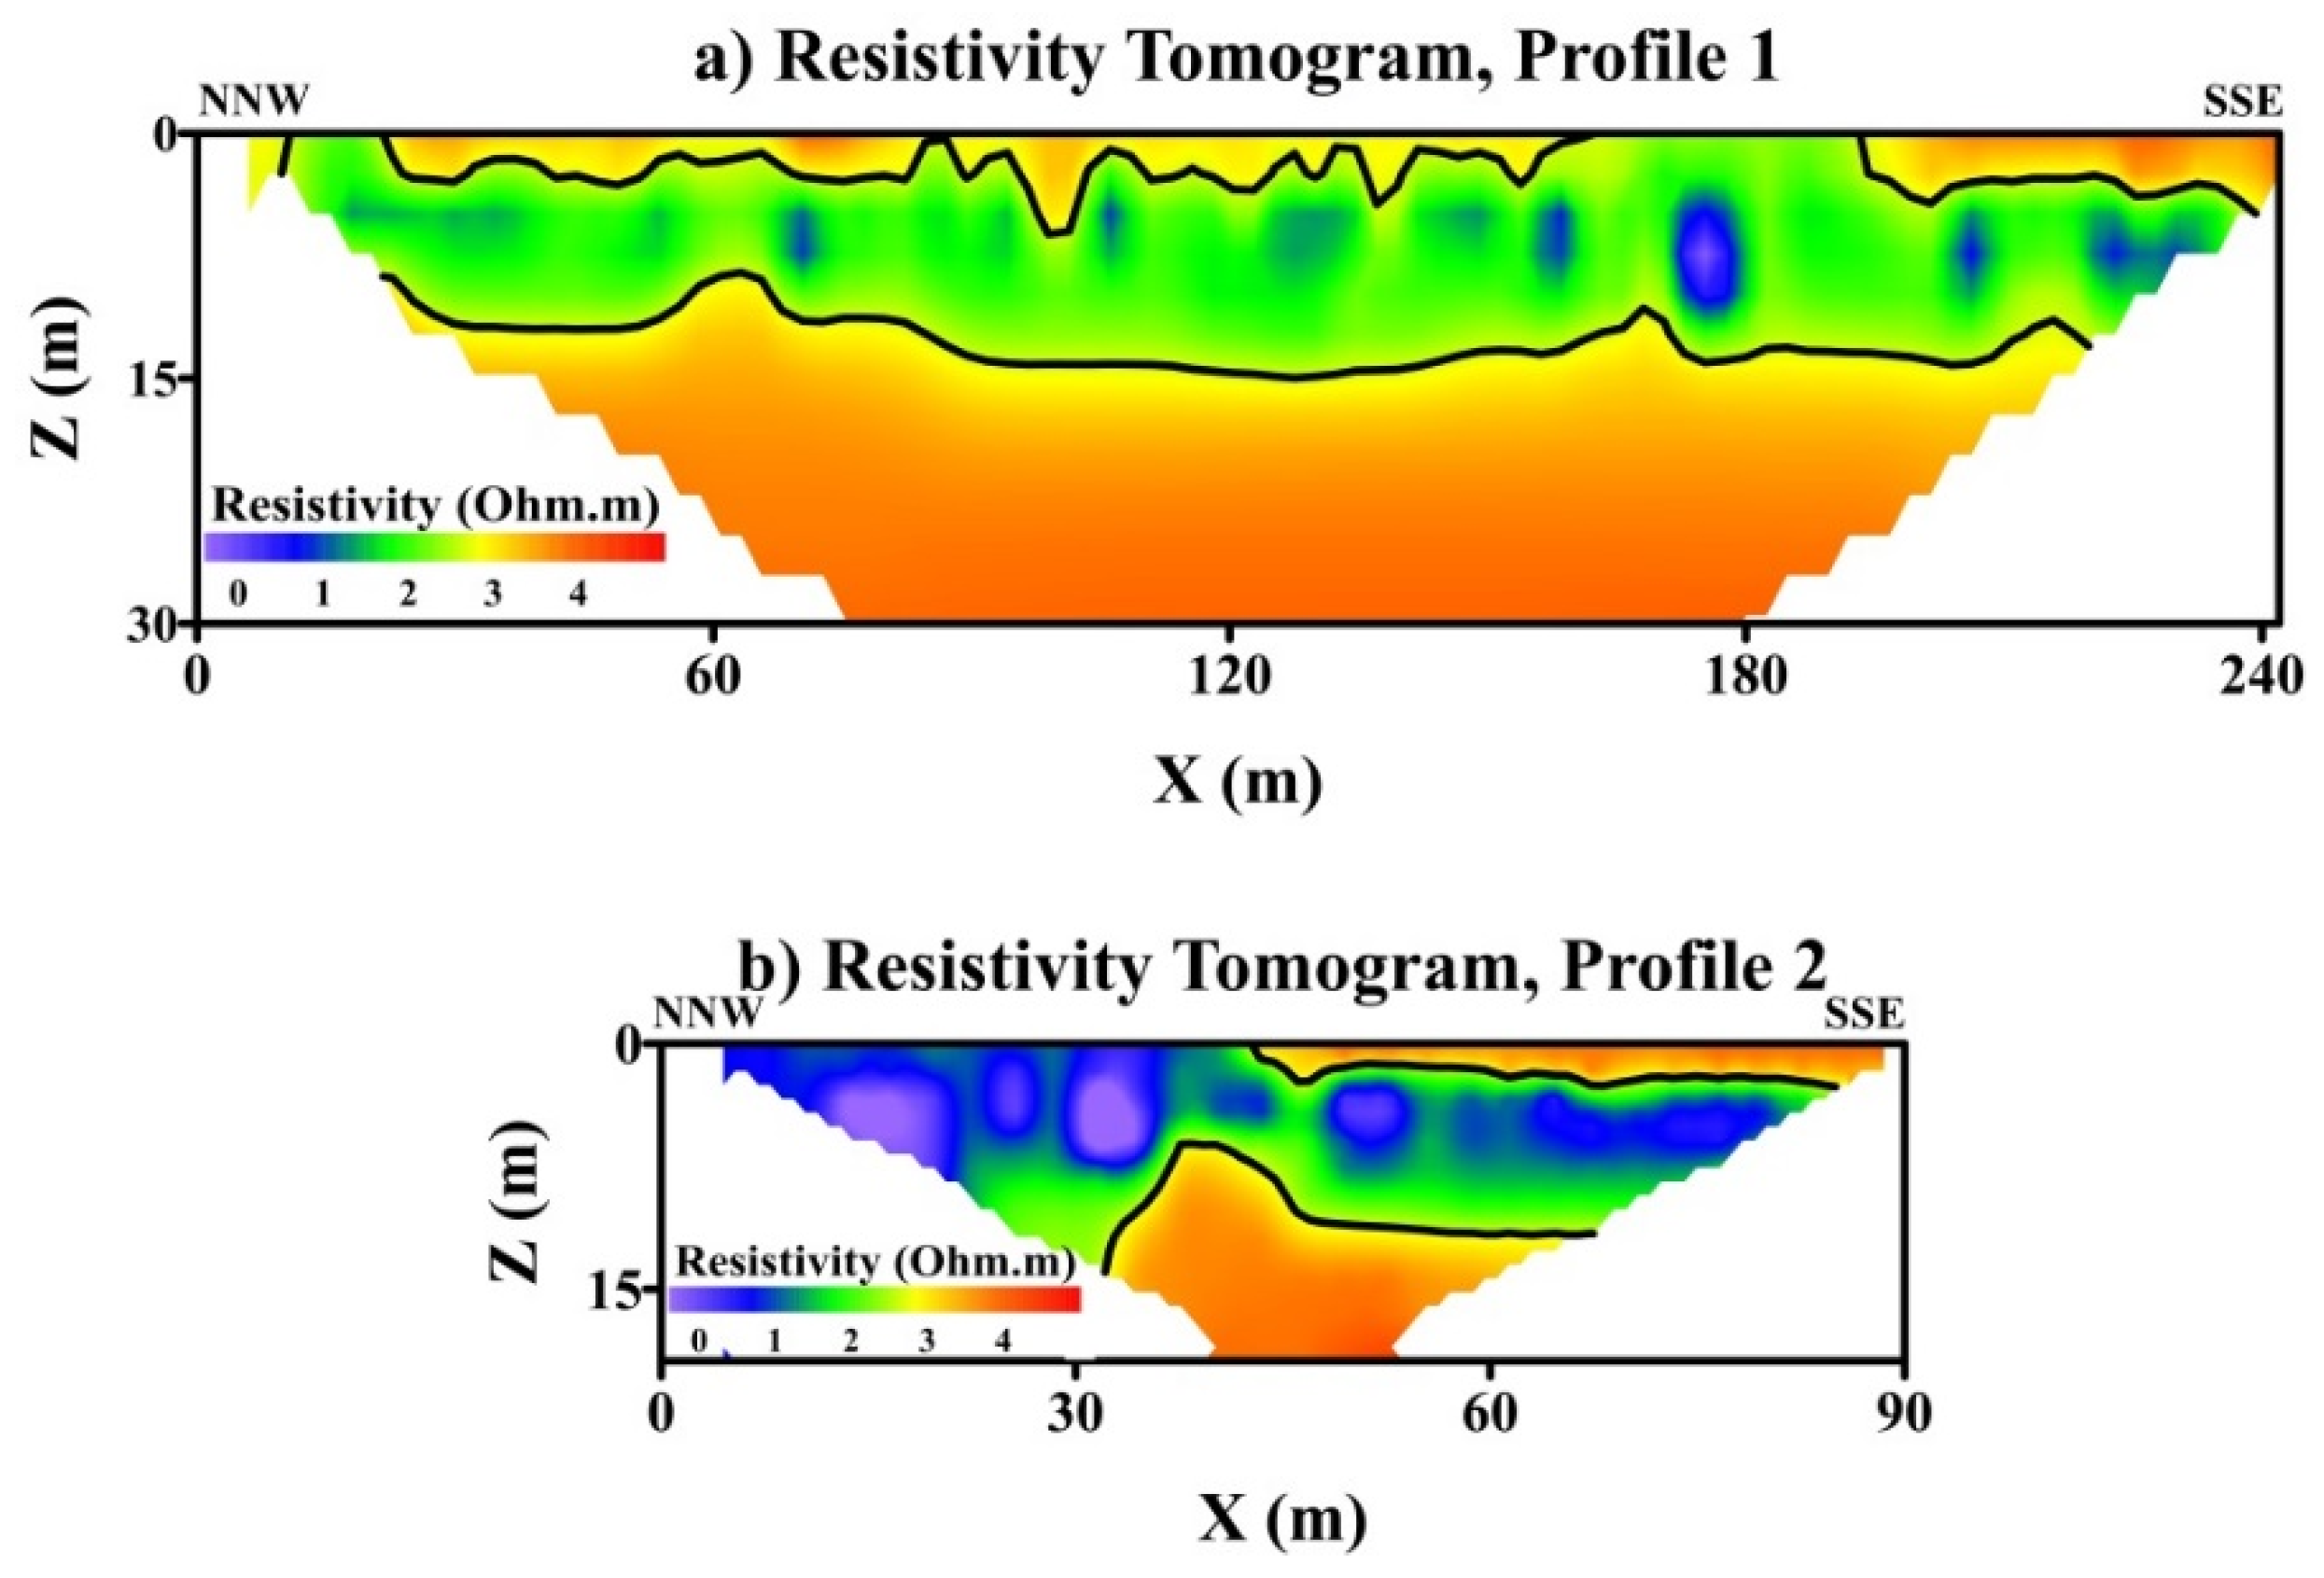
Similar to the seismic refraction tomogram, the resistivity profiles [
27] were analyzed using the travel-time tomography method described by Yu
et al. [
19] and show three subsurface layers (
Figure 14). These layers include a surface unit with a thickness of 2 to 6 m, consisting of dry lose mud, sand, and gravel with a resistivity ranging between 800 and 1000 Ohm.m, a second layer, partially saturated with water with very low resistivity values (10–100 Ohm.m), because it consists mainly of clay and has a thickness of about 10 m, and a bottom layer consisting mainly of bedrock with high resistivity values of 700 and gradually increasing to 3000 Ohm.m with depth. The water table is consistent with the top of the third layer, and the saturation is the reason for the decreased the resistivity of this layer from 3000 Ohm.m to about 700 Ohm.m.
Resistivity profile P-2 shows a very similar subsurface model to that of profile P-1, except at the northern part of P-2 where the first layer disappears. This is because the northern part of P-2 is recorded along a rock cliff, where the clay layer is exposed at the surface, and no sand-gravel layer was deposited at this location.
Comparing the resistivity and seismic results shows some similarities, especially the depth to the top of the third layer at the central and southern part of the profile. Both methods should not give identical results since the seismic method is sensitive to the elastic properties of the rocks, while the resistivity method is sensitive to the water content and salinity of the rocks.
The profile shows that the water table within the wadi channel sloped downward from the fractured rock edge of the channel inward towards the center of the channel. There is approximately 3 m difference which is significant in that the water table in the aquifer within the central part of the channel is lower than at the sides. This suggests that little or no recharge is occurring in the channel, but only at the edges of the channel via the fractured rocks.
4. Conclusions
Field observations of geology, water level measurements, geophysical profiles, and simple scenario-modeling using HYDRUS1-D, were conducted to investigate the current recharge mechanism within Wadi Qidayd in Western Saudi Arabia. The alluvial aquifer in this wadi has been heavily pumped and water levels are commonly greater than 25 m in depth in large areas of the system. The significant lowering of water levels by farm and commercial water sales wells is a relatively recent problem that did not occur historically in the wadi.
The data collected suggest that channel loss during floods is no longer the primary means of recharge in the wadi. This conclusion is based on the low water levels in the aquifer, resulting in a greater thickness of the unsaturated zone, the occurrence of naturally-occurring, fining upwards beds capped with low hydraulic conductivity clays, deflected water passing parallel to the mud layers downstream, higher water levels at the edge of the channel compared to the middle after a flood event, and the common occurrence of Acacia sp. which has long roots and removes water lying atop the mud layers. Simplified, scenario-modeling of the unsaturated zone using HYDRUS1-D suggests that the occurrence of four fining-upwards beds that contain a mud layer is sufficient to prevent the vertical recharge of the aquifer during flood events based on the actual range of rainfall and duration, as recorded at local weather stations.
Therefore, we conclude that most of the recharge to Wadi Qidayd currently occurs via the perimeter fractured rocks that have direct hydraulic connection to the horizontally-layered, high hydraulic conductivity gravel, and boulder beds to allow water collected in the harrat area to drain into the aquifer. There may be some areas of the channel that still may receive direct recharge via channel loss in the distal areas of the wadi where mud layers may not occur and at slope inflection points where erosion or non-deposition of the mud layers occur. The unsaturated zone modeling shows that there is a minimum water level that, once reached, will preclude recharge due to the and thickness of the unsaturated zone and number of preserved mud layers that define the top of flood deposits.
The importance of this research is that the activities of humans (over-pumping) can change the physical mechanisms of recharge within an ephemeral stream. Once the mechanisms have been changed, the quantity of water available for use from the aquifer will significantly reduce and exacerbate the depletion problem. Therefore, wadi aquifers, which are generally believed to provide renewable water resources, may not be recharged sufficiently to be viable water sources in the future and could, perhaps, be considered to be non-renewable resources within a short-term time context.
With regard to water management of the wadi aquifer system, the channel recharge mechanism could be restored by reducing the pumping rate, removal of the Acacia sp. trees (or reducing the density), and monitoring of the wadi aquifer water levels. If pumping is ceased and a “rest period” is allowed to occur, eventually the water table will rise to a level wherein channel loss or infiltration can, again, reach the water table. The likely range of water level fluctuations that should occur with Wadi Qidayd is 1 to 5 m below the surface to maintain the channel recharge function.
The usefulness of our research may be limited to wadi systems lying in geological formations that produce muddy sediments during erosion and the geometry of the observed flood deposits. However, nearly all wadi aquifers contain sufficient mud in storm deposits in the proximal reaches to exhibit similar behavior to the observed throughout Wadi Qidayd.
Acknowledgments
The authors thank the Water Desalination and Reuse Center and the Department of Earth Science and Engineering for the use of field and laboratory equipment. Funding for this research was provided by the Center and Department and from discretionary faculty research funding.
Author Contributions
KJ performed the modeling and assisted in writing the text. SM coordinated many of the field trips into the wadi, helped conduct field measurements, acted as a translator, and drafted many of the figures. SMH and JS worked on the seismic reflection tomograms using the stacking program. TM wrote most of the manuscript and coordinated the overall research effort.
Conflicts of Interest
The authors declare no conflicts of interest.
References
- Maliva, R.G.; Missimer, T.M. Arid Lands Water Evaluation and Management; Springer-Heidelberg: Heidelberg, Germany, 2012. [Google Scholar]
- Besbes, M.; Delhomme, J.P.; de Marsily, G. Estimated recharge from ephemeral streams in arid regions: A case study at Kairouan, Tunisia. Water Res. Res. 1978, 14, 281–290. [Google Scholar] [CrossRef]
- Abdulrazzak, M.J.; Morel-Seytoux, H.J. Recharge from an ephemeral stream following wetting front arrival to water table. Water Resour. Res. 1983, 19, 194–200. [Google Scholar] [CrossRef]
- Abdulrazzak, M.J.; Sorman, A.U.; Alhames, S.A. Techniques of artificial recharge from an ephemeral wadi channel under extreme arid conditions. In Proceedings of the International Symposium on the Artificial Recharge of Groundwater, Anaheim, CA, USA, 23–27 August 1988; Johnson, A.I., Finlayson, D.J., Eds.; American Society of Civil Engineers (ASCE): New York, NY, USA, 1989; pp. 602–611. [Google Scholar]
- Sorman, A.U.; Abdulrazzak, M.I. Infiltration-recharge through wadi beds in arid regions. Hydrol. Sci. J. 1993, 38, 173–186. [Google Scholar] [CrossRef]
- Abdulrazzak, M.J.; Sorman, A.U. Transmission losses from ephemeral streams in arid regions. J. Irrig. Drain. Eng. 1994, 120, 669–675. [Google Scholar] [CrossRef]
- Abdulrazzak, M.J. Losses of flood water from alluvial channels. Arid Soil Res. Rehabilit. 1995, 9, 15–24. [Google Scholar] [CrossRef]
- Sorman, A.U.; Abdulrazzak, M.J. Estimation of wadi recharge from channel losses in Tabalah Basin, Saudi Arabia. In Recharge of Phreatic Aquifers in (Semi-) Arid Areas; Simmers, I., Ed.; International Association of Hydrogeologists: Reading, UK, 1997; Volume 19, pp. 187–200. [Google Scholar]
- Sorman, A.U.; Abdulrazzak, M.J.; Morel-Seytoux, H.J. Groundwater recharge estimation from ephemeral streams, case study: Wadi Tabalah, Saudi Arabia. Hydrol. Process. 1997, 11, 1609–1619. [Google Scholar] [CrossRef]
- Bazuhair, A.S.; Nassief, M.O.; Al-Yamani, M.S.; Sharaf, M.A.; Batumi, T.H.; Ali, S. Groundwater Recharge Estimation in Some Wadi Aquifers of Western Saudi Arabia: King Abdulaziz City for Science and Technology; Project No. AT-17-63; CRC Press: Riyadh, Saudi Arabia, 2002. [Google Scholar]
- Subyani, A.M. Use of chloride-mass balance and environmental isotopes for evaluation of groundwater recharge in the alluvial aquifer, Wadi Tharad, western Saudi Arabia. Environ. Geol. 2004, 46, 741–749. [Google Scholar] [CrossRef]
- Missimer, T.M.; Drewes, J.E.; Amy, G.; Maliva, R.G.; Keller, S. Restoration of wadi aquifers by artificial recharge with treated waste water. Groundwater 2012, 50, 514–527. [Google Scholar] [CrossRef] [PubMed]
- Vincent, P. Saudi Arabia: An Environmental Overview; Taylor & Francis: London, UK, 2008. [Google Scholar]
- Grainger, D. The Geological Evolution of Saudi Arabia: A Voyage through Space and Time; Saudi Geological Survey: Jeddah, Saudi Arabia, 2007. [Google Scholar]
- Roobol, M.J.; Kadi, K.K. Cenozoic Faulting and Traces of Tertiary Gabbro Dikes in the Rabigh Area; Saudi Geological Survey Technical Report SGS-TR-2008-6 (geological map); Saudi Geological Survey: Jeddah, Saudi Arabia, 2007. [Google Scholar]
- Missimer, T.M.; Dagher, M.H.; Tao, W. Geology of Wadi Qidayd, western Saudi Arabia. In Proceedings of the Geological Society of America, Joint Annual Meeting Abstracts with Programs 124th Meeting, Minneapolis, MN, USA, 9–12 October 2011; Volume 43, p. 34.
- Rosas, J.; Jadoon, K.Z.; Missimer, T.M. New empirical relationship between grain size distribution and hydraulic conductivity for ephemeral stream bed sediments. Environ. Earth Sci. 2014, 73, 1303–1315. [Google Scholar] [CrossRef]
- Kruseman, G.P.; De Ridder, N.A. Analysis and Evaluation of Pumping Test Data; International Institute for Land Reclamation and Improvement in the Netherlands: Wageningen, The Netherlands, 1970. [Google Scholar]
- Yu, H.; Zhang, D.; Wang, X. Application of early-arrival waveform inversion to shallow land data. J. Appl. Geophys. 2014. [Google Scholar] [CrossRef]
- Jury, W.A.; Horton, R. Soil Physics, 5th ed.; John Wiley & Sons: New York, NY, USA, 1996. [Google Scholar]
- Mualem, Y. A new model for predicting the hydraulic conductivity of unsaturated porous media. Water Resour. Res. 1976, 12, 513–522. [Google Scholar] [CrossRef]
- Van Genuchten, M.T. A closed form equation for predicting the hydraulic conductivity of unsaturated soils. Soil Sci. Soc. Am. J. 1980, 44, 892–898. [Google Scholar] [CrossRef]
- Vereecken, H. Estimating the unsaturated hydraulic conductivity from theoretical models using simple soil properties. Geodema 1995, 65, 81–92. [Google Scholar] [CrossRef]
- Schaap, M.G.; Leij, F.J.; van Genuchten, M.T. ROSETTA: A computer program for estimating soil hydraulic parameters with hierarchical pedotransfer functions. J. Hydrol. 2001, 251, 163–176. [Google Scholar] [CrossRef]
- Aki, K.; Richards, P.G. Quantitative Seismology, 2nd ed.; University Science Books: Herndon, VA, USA, 2002. [Google Scholar]
- Nemeth, T.; Normark, E.; Pacanowski, G. Dynamic smoothing in crosswell traveltime tomography. Geophysics 1997, 62, 168–176. [Google Scholar] [CrossRef]
- Ostrowski, S.; Lasocki, M.; Pacanowski, G. Electric Resistivity Tomography as a Tool in Geological Mapping. In Proceedings of the 72nd EAGE Conference & Exposition, Extended Abstracts, Barcelona, Spain, 14–17 June 2010.
© 2016 by the authors; licensee MDPI, Basel, Switzerland. This article is an open access article distributed under the terms and conditions of the Creative Commons by Attribution (CC-BY) license (http://creativecommons.org/licenses/by/4.0/).


